Embed Size (px)
Citation preview
Volume 19 Issue 4 Article 7
2020
The Acoustic Camera as a Tool to Identify Belt Conveyor Noises The Acoustic Camera as a Tool to Identify Belt Conveyor Noises
Follow this and additional works at: https://jsm.gig.eu/journal-of-sustainable-mining
Part of the Mechanical Engineering Commons, Mining Engineering Commons, and the Sustainability
Commons
Recommended Citation Recommended Citation Bortnowski, Piotr; Nowak-Szpak, Anna; Ozdoba, Maksymilian; and Król, Robert (2020) "The Acoustic Camera as a Tool to Identify Belt Conveyor Noises," Journal of Sustainable Mining: Vol. 19 : Iss. 4 , Article 7. Available at: https://doi.org/10.46873/2300-3960.1036
This Research Article is brought to you for free and open access by Journal of Sustainable Mining. It has been accepted for inclusion in Journal of Sustainable Mining by an authorized editor of Journal of Sustainable Mining.
The acoustic camera as a tool to identify beltconveyor noises
Piotr Bortnowski, Anna Nowak-Szpak*, Maksymilian Ozdoba, Robert Kr�ol
Wrocław University of Science and Technology, Faculty of Geoengineering, Mining and Geology, Department of Mining and Geodesy,Na Grobli 15, 50-421, Wroclaw, Poland
Abstract
This paper explores the possibilities of using an acoustic camera as a tool that allows the verification of the correctconstruction and operation of individual elements of a belt conveyor. Based on the simultaneously recorded componentse a video camera and measuring microphones, the sound pressure level map of the belt conveyor was created. The testswere carried out in laboratory conditions and covered the location and identification of individual noise sources. Theverification consists not only of searching for dominant sound sources, but above all, of searching for frequencies in theanalysed spectrum that should not occur during their proper operation. The tests allow for the identification of fre-quencies and the determination of the sound pressure level for three noise sources: the electric motor noise, the idler rollbearing noise as well as the noise on the tail pulley caused by belt misalignment.
Keywords: belt conveyor, noise sources, noise location, acoustic camera
1. Introduction
B elt conveyors are the most common means oftransporting bulk materials in the mining in-
dustry. The effectiveness and reliability of itsoperation depends not only on the correctness ofits design and construction, but above all, onmaintaining this correctness throughout itsworking life. Therefore, it is necessary to monitorimportant parameters of its operation and di-agnose the technical condition in order to detectearly signs of deterioration. Thanks to this, we areable to prevent the technical threats or eliminatethem early on. The complexity of the MRO(maintenance, repair and operation) process inconveyor transport has been the subject of manypublications [1e3] and as an important topic inthis industry, it requires efficient diagnostic tools.Currently, special attention is being paid to the
need for of minimizing the negative impact of noiseemissions on the environment. It is essential forimplementing technological processes and decision-
making in the mining industry on new investments.Defined by applicable law [4e8] The 2030 NationalEnvironmental Policy (PEP2030) is a set of compre-hensive actions (directions of interventions andstrategic projects) aimed at creating conditionsnecessary for the implementation of environmentalprotection, in accordance with the principle of sus-tainable development. A number of challenges wasidentified [9] in the development of the country,which partly provide the grounds for taking inten-sified actions in particular areas. One of which is theincreasingly significant adverse impact of the envi-ronment on human health, in which noise has beenidentified as a (relatively) new problem [9].Excessive noise poses a severe threat to human
health as well as affects animal welfare, and istherefore a particularly destructive phenomenon.The conveyor belt, as a group of modules connectedin series, is a significant source of noise.As systems operating most often in the alleday
cycle and being a linear source of noise, they arevery obtrusive factors for employees of industrialplants as well as residents of nearby areas [10].Noise standards for the location of conveyors are
Received 15 November 2020; revised 17 December 2020; accepted 29 December 2020.Available online 31 December 2020.
* Corresponding author.E-mail address: [email protected] (A. Nowak-Szpak).
https://doi.org/10.46873/2300-3960.10362300-3960/© Central Mining Institute, Katowice, Poland. This is an open-access article under the CC-BY 4.0 license(https://creativecommons.org/licenses/by/4.0/).
RESEARCH
ARTIC
LE

usually exceeded, especially operating at night.Thus, belt conveyors largely determine the gener-ated noise of the entire technological line. For thisreason, a noise reduction of these particular mod-ules is especially required. The overall noise levelfor the entire transport system depends on the in-dividual major noise sources, and the identificationand location of these sources is an important step inthe overall noise reduction process [11].The issues related to the identification of noise
emission from the conveyor belt can be found inmany publications. The approach to measuring itsemissions understandably depends, on the purposeof such tests. The most common group of publica-tions is those constituting part of The Environ-mental Impact Reports and research on noise atworkplaces. Such noise analyses are often supple-mented with measurements of noise emissions atcharacteristic points of the routeeas reference datafor modelling acoustic impact. A characteristicfeature of these publications is the treatment of thebelt conveyor as a whole, without taking into ac-count the features related to its structure (efficiency,speed, geometric parameters, etc.) and withoutconsidering the differences of these parameters onindividual sections of the belt conveyor route. Theproposed solutions to reduce excessive noise alsoconcern the installation of barriers completelyseparating the emitter [10,12].Publications describing the noise emitted by
different elements comprising the conveyor belt arediverse, both because they relate to advertisingmaterials of companies producing individual ele-ments of the conveyor (idlers, pulleys, belts, bear-ings), as well as scientists who publish the results of
their research. Conveyor noise generation mecha-nisms (Fig. 1) were summarized as follows:
� Idler Roll Bearing Noise,� Idler Roll Shell Noise,� Belt Idler Interaction,� Air Pumping, Belt/Idler Roll,� Structure-borne Noise e conveyor supportstructure [13].
The authors of various publications agree that thedynamic interaction at the interface between thebelt and the rotating idler is the most dominant, butin the rest of their research they focus on measuringand modifying the idlers themselves [13e18]. Ineach of the above-mentioned publications, noisemeasurements were made with the use of a soundlevel meter or a set of several sound level meters.Some of the measurements were additionally sup-plemented with vibration registrations usingpiezometric accelerometers [18].In recent years, a team of scientists from Ko�sice
has put forward a series of articles presenting thepossibilities of using an acoustic camera for theidentification and analysis of sound sources duringbelt conveyor testing. The authors verified a twoway research approach, which they defined as theglobal approach (i.e. of the entire conveyor) and thediscrete approach (i.e. of the critical places emittingnoise) [19]. They presented measurement results onthe identification and analysis of the dominantsound sources, such as electric motors [19,20] as wellas a hopper (through which material is supplied intothe conveyor belt) and a crusher.In this article, we would like to develop the pos-
sibilities of using an acoustic camera as a tool which
Fig. 1. Conveyor Noise Generation Mechanisms [13].
JOURNAL OF SUSTAINABLE MINING 2020;19:286e295 287
RESEARCH
ARTIC
LE

allows the verification of the correct constructionand operation of individual elements of a beltconveyor. The verification consists not only ofsearching for dominant sound sources, but aboveall, of searching for frequencies in the analysedspectrum that should not occur during the properoperation of the conveyor and all its elements.
2. Materials and methods
The test was performed with an acoustic camera(Fig. 2). By combining two components e a videocamera and measuring microphones, the device al-lows for the simultaneous location and identificationof individual noise sources. The digital cameracaptures the image of the noise emitting device, andat the same time the microphone systems record thesound pressure (sound). This allows for the simul-taneous measurement of sound pressure and soundsource direction localization. The acoustic cameraworks based on beamforming principleseenablingaccurate calculation of the specific runtime delays ofacoustic sound emissions radiating from severalsources to the individual microphones of an array[21]. It is possible due to the appropriate arrange-ment of the sensor array. The final step is tocombine the optical and acoustic images intoa single unit, in a form of is a color-coded map of thesound pressure level.The measurements were carried out on a rig for
testing the intermediate drive for a belt conveyor inthe Machine Systems in Mining Laboratory, at the
Wroclaw University of Science and Technology.Research in laboratory conditions allows for theelimination of acoustic phenomena that could occurin the actual operation of a mine. For the purpose ofthe test, the rig was adapted: the drives weredisconnected, and only the intermediate drive wasassumed as the test object. That minimized addi-tional noise sources that could interfere with thenoise identification of individual components.The arrangement of individual objects in the lab-
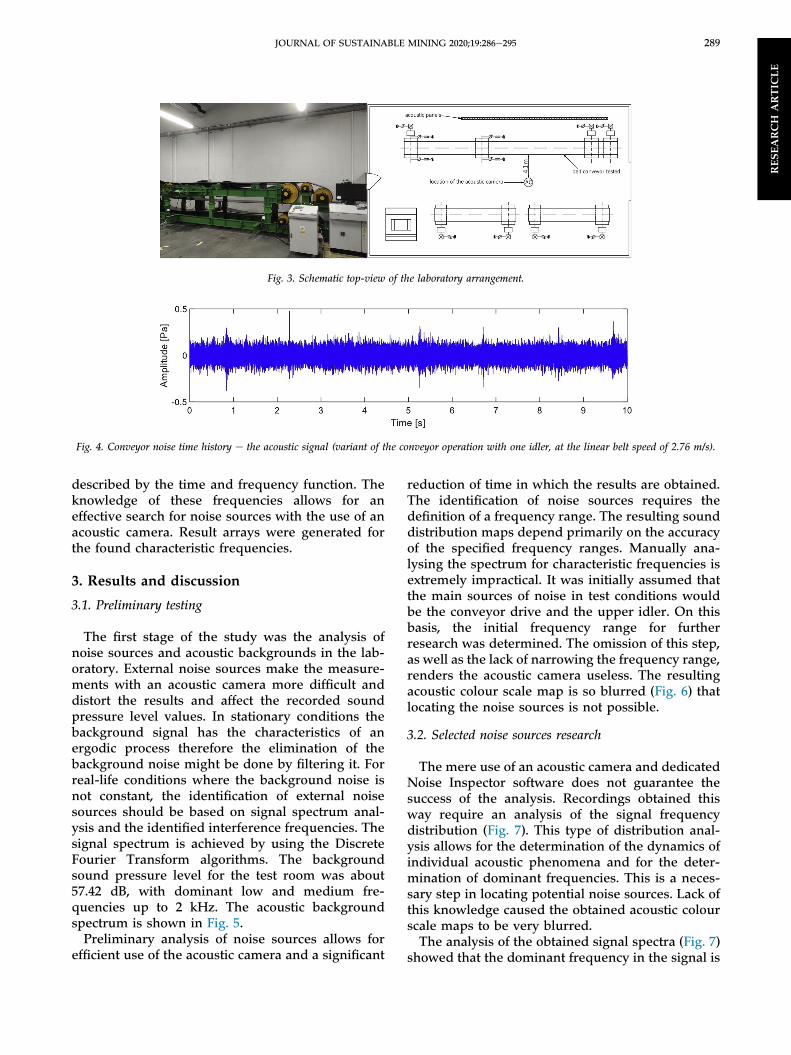
oratory was reorganized. No objects were locatedbetween the tested rig and the acoustic camera,which may have been a source of potential inter-ference and reflections. Due to the location of the rigin short distance from one of the walls of the room,additional acoustic panels were used. The arrange-ment of individual objects is shown in the diagrambelow (Fig. 3).The location of the camera in relation to the
conveyor is limited by the maximum and minimummeasuring range of the microphones used. In mostcases, the minimum recommended distance fromthe test object is 4 m. For these test condition anacoustic camera was placed at a fixed distance of4.1 m from the conveyor structure. The 10s timehistory of the acoustic signal was recorded (Fig. 4)with the sampling frequency of 800 Hz. Theconveyor noise measurements were made with theacoustic camera consisting of 112 MEMS-micro-phones, with a resolution of 24 bits and a maximumsampling frequency of 48 kHz. The frequency rangeof a microphone is from 10 Hz (in practice this valueis closer to 20 Hz) to 24 kHz. The operating rangewas defined as < 33 dBe120 dB, with dynamics up to40 dB.All tests were carried out for one configuration of
the conveyor operation: constant linear belt speed of2.76 m/s and constant belt tensioning force of 25 kN.Measurements were made for the EP1250/5 textilebelt with a width of 0.4 m. The drive motor nominalpower of the rig was 5.5 kW (40% of nominal load).The distance between the axis of the tail and thedrive pulley was 5 m. There was one upper idlerinstalled hallway through the length of the rig(Fig. 3).Acquisition and initial data processing was carried
out using the dedicated Noise Inspector software.The recorded time signals were then processed inthe MATLAB environment. The dominant andcharacteristic frequencies in the noise time historywere found using the discrete Fourier transform.The result of using FFT is the ability to describe thesignal amplitude as a function of frequency. TheNoise Inspector software additionally enables thespectra to be generated and where the amplitude isFig. 2. The acoustic camera used in the measurements.
288 JOURNAL OF SUSTAINABLE MINING 2020;19:286e295
RESEARCH
ARTIC
LE
described by the time and frequency function. Theknowledge of these frequencies allows for aneffective search for noise sources with the use of anacoustic camera. Result arrays were generated forthe found characteristic frequencies.
3. Results and discussion
3.1. Preliminary testing
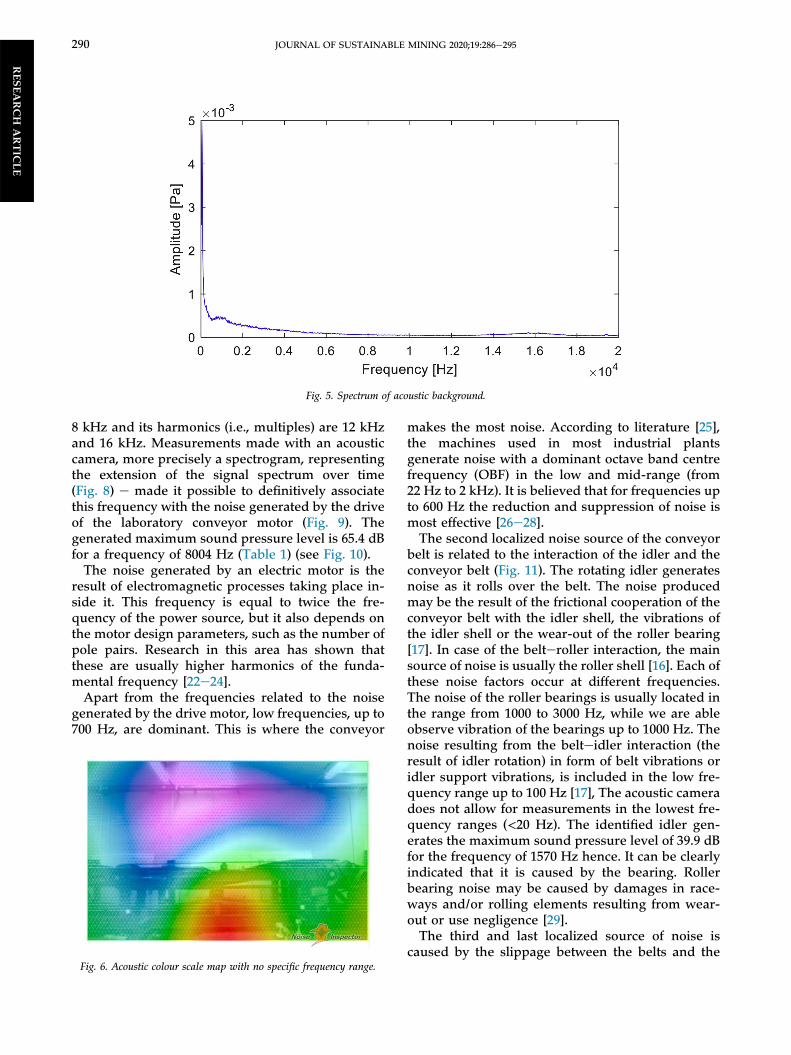
The first stage of the study was the analysis ofnoise sources and acoustic backgrounds in the lab-oratory. External noise sources make the measure-ments with an acoustic camera more difficult anddistort the results and affect the recorded soundpressure level values. In stationary conditions thebackground signal has the characteristics of anergodic process therefore the elimination of thebackground noise might be done by filtering it. Forreal-life conditions where the background noise isnot constant, the identification of external noisesources should be based on signal spectrum anal-ysis and the identified interference frequencies. Thesignal spectrum is achieved by using the DiscreteFourier Transform algorithms. The backgroundsound pressure level for the test room was about57.42 dB, with dominant low and medium fre-quencies up to 2 kHz. The acoustic backgroundspectrum is shown in Fig. 5.Preliminary analysis of noise sources allows for
efficient use of the acoustic camera and a significant
reduction of time in which the results are obtained.The identification of noise sources requires thedefinition of a frequency range. The resulting sounddistribution maps depend primarily on the accuracyof the specified frequency ranges. Manually ana-lysing the spectrum for characteristic frequencies isextremely impractical. It was initially assumed thatthe main sources of noise in test conditions wouldbe the conveyor drive and the upper idler. On thisbasis, the initial frequency range for furtherresearch was determined. The omission of this step,as well as the lack of narrowing the frequency range,renders the acoustic camera useless. The resultingacoustic colour scale map is so blurred (Fig. 6) thatlocating the noise sources is not possible.
3.2. Selected noise sources research
The mere use of an acoustic camera and dedicatedNoise Inspector software does not guarantee thesuccess of the analysis. Recordings obtained thisway require an analysis of the signal frequencydistribution (Fig. 7). This type of distribution anal-ysis allows for the determination of the dynamics ofindividual acoustic phenomena and for the deter-mination of dominant frequencies. This is a neces-sary step in locating potential noise sources. Lack ofthis knowledge caused the obtained acoustic colourscale maps to be very blurred.The analysis of the obtained signal spectra (Fig. 7)
showed that the dominant frequency in the signal is
Fig. 3. Schematic top-view of the laboratory arrangement.
Fig. 4. Conveyor noise time history e the acoustic signal (variant of the conveyor operation with one idler, at the linear belt speed of 2.76 m/s).
JOURNAL OF SUSTAINABLE MINING 2020;19:286e295 289
RESEARCH
ARTIC
LE
8 kHz and its harmonics (i.e., multiples) are 12 kHzand 16 kHz. Measurements made with an acousticcamera, more precisely a spectrogram, representingthe extension of the signal spectrum over time(Fig. 8) e made it possible to definitively associatethis frequency with the noise generated by the driveof the laboratory conveyor motor (Fig. 9). Thegenerated maximum sound pressure level is 65.4 dBfor a frequency of 8004 Hz (Table 1) (see Fig. 10).The noise generated by an electric motor is the
result of electromagnetic processes taking place in-side it. This frequency is equal to twice the fre-quency of the power source, but it also depends onthe motor design parameters, such as the number ofpole pairs. Research in this area has shown thatthese are usually higher harmonics of the funda-mental frequency [22e24].Apart from the frequencies related to the noise
generated by the drive motor, low frequencies, up to700 Hz, are dominant. This is where the conveyor
makes the most noise. According to literature [25],the machines used in most industrial plantsgenerate noise with a dominant octave band centrefrequency (OBF) in the low and mid-range (from22 Hz to 2 kHz). It is believed that for frequencies upto 600 Hz the reduction and suppression of noise ismost effective [26e28].The second localized noise source of the conveyor
belt is related to the interaction of the idler and theconveyor belt (Fig. 11). The rotating idler generatesnoise as it rolls over the belt. The noise producedmay be the result of the frictional cooperation of theconveyor belt with the idler shell, the vibrations ofthe idler shell or the wear-out of the roller bearing[17]. In case of the belteroller interaction, the mainsource of noise is usually the roller shell [16]. Each ofthese noise factors occur at different frequencies.The noise of the roller bearings is usually located inthe range from 1000 to 3000 Hz, while we are ableobserve vibration of the bearings up to 1000 Hz. Thenoise resulting from the belteidler interaction (theresult of idler rotation) in form of belt vibrations oridler support vibrations, is included in the low fre-quency range up to 100 Hz [17], The acoustic cameradoes not allow for measurements in the lowest fre-quency ranges (<20 Hz). The identified idler gen-erates the maximum sound pressure level of 39.9 dBfor the frequency of 1570 Hz hence. It can be clearlyindicated that it is caused by the bearing. Rollerbearing noise may be caused by damages in race-ways and/or rolling elements resulting from wear-out or use negligence [29].The third and last localized source of noise is
caused by the slippage between the belts and the
Fig. 5. Spectrum of acoustic background.
Fig. 6. Acoustic colour scale map with no specific frequency range.
290 JOURNAL OF SUSTAINABLE MINING 2020;19:286e295
RESEARCH
ARTIC
LE

Fig. 7. Signal spectrum over the entire frequency range.
Fig. 8. The spectrum of frequencies of a signal in time. Visible harmonic vibrations occurring at multiples of the fundamental frequency.
Fig. 9. Noise generated by the engineebelt conveyor drive.
JOURNAL OF SUSTAINABLE MINING 2020;19:286e295 291
RESEARCH
ARTIC
LE

pulleys (Fig. 12). There are many reasons that affectthe belt's ability to track properly [30]. The mostcommon are: little accuracy in the alignment be-tween pairs of components, such as drive and tailpulley, or improper belt installation. A characteristicfeature of this occurrence is the cyclical wanderingof the belt along the pulley in the directions of itsaxis. The reason for this is the system's efforts to
equalize the forces. It is influenced by, among otherthings, the tensioning force pressing the belt to thepulley, the coefficient of friction, and the alignmentof conveyor elements. Misalignment is a real threatas it affects the stability of the operation, wear-outand failure of the belt, damage or breakage to themotors, motion failure, all of which may cause a riskof injury for people.In order to prevent the wandering conveyor belts
the guide idlers are used. They constitute a barrierlimiting the space for the belt. Another way toreduce or even eliminate it is proper positioning ofa pulley on a shaft.A characteristic high-frequency noise is emitted
during the belt wandering. The noise emission de-pends on the type of surfaces of the contacting
Table 1. Sound pressure level measurement results for localized noisesources.
Localized noise sources Lp [dB] LpA [dB]
Conveyor belt (in total) 79.46 73.66Drive/electric motor 65.40 65.40Idler 39.90 39.90Belt misalignment on the tail pulley 35.20 35.20
Fig. 10. Identified frequencies related to electric motor noise (high frequencies).
Fig. 11. Noise generated by the idler (roller bearing).
292 JOURNAL OF SUSTAINABLE MINING 2020;19:286e295
RESEARCH
ARTIC
LE
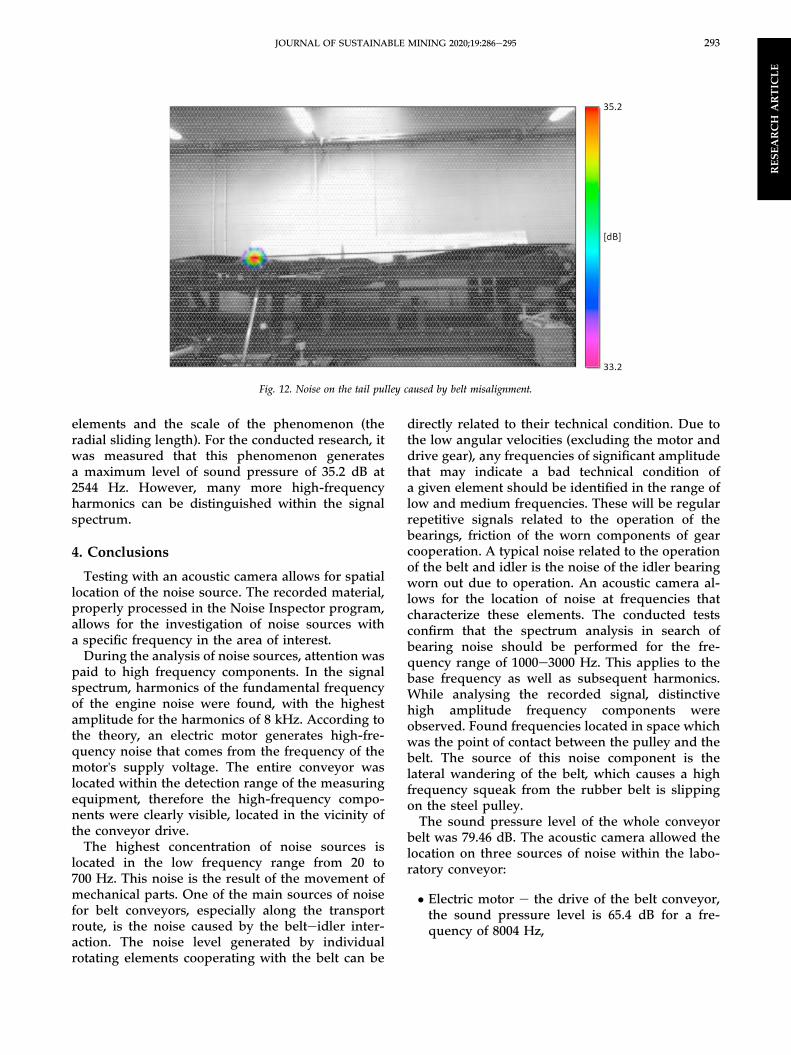
elements and the scale of the phenomenon (theradial sliding length). For the conducted research, itwas measured that this phenomenon generatesa maximum level of sound pressure of 35.2 dB at2544 Hz. However, many more high-frequencyharmonics can be distinguished within the signalspectrum.
4. Conclusions
Testing with an acoustic camera allows for spatiallocation of the noise source. The recorded material,properly processed in the Noise Inspector program,allows for the investigation of noise sources witha specific frequency in the area of interest.During the analysis of noise sources, attention was
paid to high frequency components. In the signalspectrum, harmonics of the fundamental frequencyof the engine noise were found, with the highestamplitude for the harmonics of 8 kHz. According tothe theory, an electric motor generates high-fre-quency noise that comes from the frequency of themotor's supply voltage. The entire conveyor waslocated within the detection range of the measuringequipment, therefore the high-frequency compo-nents were clearly visible, located in the vicinity ofthe conveyor drive.The highest concentration of noise sources is
located in the low frequency range from 20 to700 Hz. This noise is the result of the movement ofmechanical parts. One of the main sources of noisefor belt conveyors, especially along the transportroute, is the noise caused by the belteidler inter-action. The noise level generated by individualrotating elements cooperating with the belt can be
directly related to their technical condition. Due tothe low angular velocities (excluding the motor anddrive gear), any frequencies of significant amplitudethat may indicate a bad technical condition ofa given element should be identified in the range oflow and medium frequencies. These will be regularrepetitive signals related to the operation of thebearings, friction of the worn components of gearcooperation. A typical noise related to the operationof the belt and idler is the noise of the idler bearingworn out due to operation. An acoustic camera al-lows for the location of noise at frequencies thatcharacterize these elements. The conducted testsconfirm that the spectrum analysis in search ofbearing noise should be performed for the fre-quency range of 1000e3000 Hz. This applies to thebase frequency as well as subsequent harmonics.While analysing the recorded signal, distinctivehigh amplitude frequency components wereobserved. Found frequencies located in space whichwas the point of contact between the pulley and thebelt. The source of this noise component is thelateral wandering of the belt, which causes a highfrequency squeak from the rubber belt is slippingon the steel pulley.The sound pressure level of the whole conveyor
belt was 79.46 dB. The acoustic camera allowed thelocation on three sources of noise within the labo-ratory conveyor:
� Electric motor e the drive of the belt conveyor,the sound pressure level is 65.4 dB for a fre-quency of 8004 Hz,
Fig. 12. Noise on the tail pulley caused by belt misalignment.
JOURNAL OF SUSTAINABLE MINING 2020;19:286e295 293
RESEARCH
ARTIC
LE

� Idler e the roller bearing noise with maximumsound pressure level of 39.9 dB for the frequencyof 1570 Hz,
� Belt misalignment on the tail pulley e themaximum sound pressure level of 35.20 for thefrequency of 2544 Hz.
The tests carried out in laboratory conditionsshow the potential of the acoustic camera. This toolallows for a quick analysis of noise sources. The fieldof application can be the broadly understood field ofdiagnostics of both moving mechanical parts anddrive components. The spatial location allows theidentification of phenomena that are difficult todescribe theoretically due to the limited possibilityof estimating the scale and the lack of theoreticalmodels. This is perfectly demonstrated by anexample of locating the noise caused by beltmisalignment that should not occur during theproper operation of the conveyor.The disadvantage of the method is the lack of the
process’ automation. A possible system of contin-uous monitoring of the conveyor condition based onan acoustic camera could help to prevent hazardousoccurrences such as destabilization of the operation,wear-out and failure of the belt, damage or breakageto the motors, motion failure, all of which may causea risk of injury for people. Another significantdisadvantage of this method is the inability toanalyse noise at very low frequencies.
Ethical statement
The authors state that the research was conductedaccording to ethical standards.
Funding body
This research received no external funding.
Conflicts of interest
None declared.
References
[1] Liptai P, Lumnitzer E, Moravec M, Pi�nosov�a M. Analysis andclassification of noise sources of conveyor systems by soundvisualizing on the postal package sorting line. Adv Sci Tech ResJ 2018;12(4):172e6. https://doi.org/10.12913/22998624/100348.
[2] Moln�ar V, Fedorko G, Andrejiov�a M, Grin�cov�a A,Michalik P. Online monitoring of a pipe conveyor. Part I:measurement and analysis of selected operational parame-ters. Measurement 2016;94:364e71.
[3] Lu Q, Wang X, Zhuang L. Research and design of monitoringsystem for belt conveyor. In: 2012 international conferenceon computer science & service system. CSSS; 2012. https://doi.org/10.1109/CSSS.2012.485.
[4] The Environmental Protection Act of 27 April 2001 (Consol-idated text: Polish Journal of Laws of 2019, item 1396, asamended).
[5] Resolution No. 8 of the council of ministers of 14 February2017 on the adoption of the strategy for responsible devel-opment until 2020 (with the perspective until 2030) officialjournal of the republic of Poland monitor Polski of 2017. 2017.item 260.
[6] Resolution No. 67 of the council of ministers of 16 July 2019on the adoption of the "National environmental policy 2030 -development strategy for the environment and water man-agement". Polish Monitor; 2019. item 794.
[7] Single European act. Feb. 17, 1986. 0.J. L169/1 (1987).[8] European Union. Consolidated version of the treaty on the
functioning of the European union. 26 October 2012. OJ L.326/47-326/390; 26.10.2012.
[9] National Environmental Policy 2030 - the developmentstrategy for environment and water management area.Warsaw: Ministry of Climate; 2019.
[10] Sadowski J, Fąs T. Minimalizacja hałasu ta�smociągu trans-portującego węgiel brunatny [Noise minimization of beltconveyor used for lignite coal transportation]. In _zynieria iChemiczna 2014;53(2):113e5.
[11] Luty�nski A. Identyfikacja poziomu hałasu na stanowiskachtechnologicznych w zakładach przer�obki kopal�n węglakamiennego. G�ornictwo i Geoin _zynieria 2006;30(3/4):173e80.
[12] Sadowski J. Wielowarstwowy ustr�oj d�zwiękochlonno-izola-cyjny zwłaszcza na ciągach przeno�snik�ow ta�smowych. 2006.Poland Patent 59682-2006.
[13] Brown S. Conveyor noise specification and control. In:Conference paper 2004 Annual Conference of the AustralianAcoustical Society 3e5 November 2004. Proceedings ofACQUSTICS; 2004. p. 269e76.
[14] Lad�anyi G. Study on the noise emission of belt conveyoridler Rolls. Annals of the University of Petrosani. Mech Eng2016;18:83e92.
[15] Gładysiewicz A. Metody redukcji hałasu przeno�snik�owta�smowych. Trans Przemyslowy i Maszyny Robocze 2010;3:6e63.
[16] Sawicki W, Kr�ol R. Estimation of vibro-acoustic properties ofidlers based on modal analysis. Min Sci 2006;VIII(1):179e85.
[17] Bartelmus W, Sawicki W. Noise of belt conveyors. Chapter165. In: Mine planning and equipment selection 2000, 1stedition; 2000.
[18] Klimenda F, Kampo J, Hejma P. Vibration measurement ofconveyor rollers. Proc Eng 2016;136:198e203. https://doi.org/10.1016/j.proeng.2016.01.197.
[19] FedorkoG, Liptai P,MolnarV. Proposal of themethodology fornoise sources identification and analysis of continuous trans-port systems using an acoustic camera. Eng Fail Anal 2018;83:30e46. https://doi.org/10.1016/j.engfailanal.2017.09.011.
[20] Liu X, Pei D, Lodewijks G, Zhao Z, Mei J. Acoustic signalbased fault detection on belt conveyor idlers using machinelearning. Adv Powder Technol 2020;31(7):2689e98. https://doi.org/10.1016/j.apt.2020.04.034.
[21] Heinz GK. Modelling inherent communication principles ofbiological pulse networks. Syst Anal Model Simulat 1994;15(2):51e158. https://doi.org/10.1007/s11831-016-9182-3.
[22] Nau SL, Gomez Mello HG. Acoustic noise in inductionmotors: causes and solutions. In: Industry applications soci-ety Forty-seventh annual conference; 2000.
[23] Janda M, Ond�rej V, Vladimir H. Noise of induction ma-chines. 2012.
[24] Sathyan S, Aydin U, Belahcen A. Acoustic noise computationof electrical motors using the boundary element method.Energies 03 01 2020;13(1). https://doi.org/10.3390/en13010245.1996-1073.
[25] Mahendra Prashanth K, Venugopalachar S. The possibleinfluence of noise frequency components on the health ofexposed industrial workers - a review. Noise Health 2011;13(50):16e25. https://doi.org/10.4103/1463-1741.73996.
[26] Wang C, Gao H, Yu L, Yu T, Yan W, Xue Q. Portable low-frequency noise reduction device for both small open and
294 JOURNAL OF SUSTAINABLE MINING 2020;19:286e295
RESEARCH
ARTIC
LE

closed spaces. Shock Vib 2016. https://doi.org/10.1155/2016/6241935.
[27] Kuo SM, Morgan DR. Active noise control: a tutorial review.IEEE 1999;87(6):943e73. https://doi.org/10.1109/5.763310.
[28] Monaragala R. Knitted structures for sound absorption. AdvKnit Tech 2011:262e86.
[29] Dyer D, Stewart RM. Detection of rolling element bearingdamage by statistical vibration analysis. J Mech Des 1978:229e35.
[30] [Online]. Available: http://www.sparksbelting.com/blog/conveyor-belt-tracking-common-causes-of-misalignment-checklist. [Accessed 28 September 2020].
JOURNAL OF SUSTAINABLE MINING 2020;19:286e295 295
RESEARCH
ARTIC
LE