Embed Size (px)
Citation preview

OCCAS IONAL PAPER SER IESNO. 43 / FEBRUARY 2006
THE ACCUMULATION OF FOREIGN RESERVES
by an International Relations Committee Task Force

In 2006 all ECB publications will feature
a motif taken from the
€5 banknote.
OCCAS IONAL PAPER SER IE SNO. 43 / F EBRUARY 2006
THE ACCUMULATION OF FOREIGN RESERVES
by an International Relations Committee Task Force *
* The opinions expressed in this paper are those of the authors listed on page 6 and do not necessarily reflect those of the European Central Bank or the national central banks that the authors are affiliated with.
This paper can be downloaded without charge from http://www.ecb.int or from the Social Science Research Network
electronic library at http://ssrn.com/abstract_id=807417.

© European Central Bank, 2006
AddressKaiserstrasse 2960311 Frankfurt am MainGermany
Postal addressPostfach 16 03 1960066 Frankfurt am MainGermany
Telephone+49 69 1344 0
Websitehttp://www.ecb.int
Fax+49 69 1344 6000
Telex411 144 ecb d
All rights reserved. Any reproduction,publication and reprint in the form of adifferent publication, whether printedor produced electronically, in whole orin part, is permitted only with theexplicit written authorisation of theECB or the author(s).
The views expressed in this paper donot necessarily reflect those of theEuropean Central Bank.
ISSN 1607-1484 (print)ISSN 1725-6534 (online)

3ECB
Occasional Paper No. 43February 2006
C O N T E N T SPREFACE 6
MEMBERS OF THE INTERNATIONAL RELATIONSCOMMITTEE TASK FORCE ON ACCUMULATIONOF FOREIGN RESERVES 7
SUMMARY 8
1 The puzzle of reserve accumulationsince 2002 9
2 Possible drivers of the recentreserve accumulation 13
3 Domestic risks and costs ofreserve accumulation 17
4 Main trends in central bankreserve management 19
5 Alternative uses of accumulatedforeign assets 23
6 Impact on yields and asset prices 24
ANNEXES
ANNEX 1STYLISED FACTS OF THE ACCUMULATION OFFOREIGN EXCHANGE RESERVES 27
1 Individual countries and regions 27
2 Reserves channelled into oil andheritage funds 28
ANNEX 2MAIN DRIVERS OF RESERVE ACCUMULATION:A REVIEW OF THE LITERATURE 29
1 Background 29
2 Precautionary motives 30
3 The “global savings glut” 34
4 Management of exchange rates 35
5 Costs of managing exchange rates,and “socialisation” of exchangerate risk 35
6 Unconventional monetary policies 36
ANNEX 3RISKS TO AND CHALLENGES FOR THE CONDUCTOF MONETARY POLICY 37
1 Background 37
2 Institutional characteristics andmonetary policy responses insome major reserve-accumulatingeconomies 38
ANNEX 4THE FOREIGN POSITIONS OF SEVEN ASIANCENTRAL BANKS:TRENDS AND POTENTIAL RISKS 40
1 Background 40
2 Trends in the net foreign positionof seven Asian central banks 41
3 Potential costs of net foreign assetholdings 42
4 Institutional arrangements related tothe management of foreign currencyreserves 44
ANNEX 5DEVELOPMENTS IN CENTRAL BANKRESERVE MANAGEMENT AND THEIR POSSIBLEMARKET IMPLICATIONS 46
1 Background 46
2 Main trends in reserve managementsince 1999: diversification, but towhat extent? 47
3 The coexistence of various foreignreserve management frameworks 51
4 US and euro area fixed incomemarkets: can differences limitcurrency diversification? 51
5 Market implications of excessiveforeign reserve accumulation interms of possible distortions ofcurrent bond market dynamics 55

4ECBOccasional Paper No. 43February 2006
ANNEX 6THE IMPACT OF ASIAN RESERVE ACCUMULATIONON ASSET PRICES 55
1 Background 55
2 The role of changes in the relativesupply of Treasuries on yields: Areview of available evidence 56
3 A model to explain the impact ofAsian reserve accumulation onten-year Treasury yields 57
4 A model to explain the impact ofAsian reserve accumulation onthree-year Treasury yields 59
5 Impact on other asset prices 61
ANNEX 7THE FINANCING OF THE US CURRENTACCOUNT DEFICIT:A SHORT REVIEW OF THE LITERATURE ANDSOME EVIDENCE 63
1 Background 63
2 Review of the literature, and linkswith current policy issues 64
3 A descriptive analysis of UScurrent account deficit financing 66
REFERENCES 68
LIST OF OCCASIONAL PAPERS 74

5ECB
Occasional Paper No. 43February 2006
PREFACE
PREFACE
In a number of countries, especially emergingmarket economies, the public sector has inrecent years been accumulating sizeable cross-border financial assets, mainly in the form ofofficial foreign exchange reserves. Worldreserves have risen from USD 1.2 trillion inJanuary 1995 to above USD 4 trillion inSeptember 2005, growing particularly rapidlysince 2002. The impressive pace of reservegrowth has become an important issue on theinternational policy agenda and has beenconsidered from various perspectives,including the financing of the growing UScurrent account deficits, the debate on high netsavings in the Asian economies and oil-exporting countries, the sustainability ofreserve accumulation, and the factors behindexceptionally low yields within and outside theUnited States.
In January 2005 the International RelationsCommittee (IRC), a committee established bythe European System of Central Banks (ESCB)to deal with international monetary andfinancial affairs, asked a group of ESCBcentral bank experts to study the accumulationof foreign reserves in greater detail. Theensuing report by the IRC task forceinvestigated the features, drivers, risks andcosts of reserve accumulation, as well as theother uses that certain countries have beenmaking of their accumulated foreign assets.The report also reviewed the main trends incentral bank reserve management and providedsome evidence for the impact of reserveaccumulation on yields and asset prices.
The report – on which this occasional paper isbased1 – was discussed by the IRC in June2005, and the authors gratefully acknowledgethe comments made by the Committeemembers on that occasion. In addition, inSeptember 2005 the report was sent to theGeneral Council of the European CentralBank (ECB) and, subsequently, to theEconomic and Financial Committee, aconsultative committee that contributes to thepreparation of the work of the ECOFINCouncil.
1 Georges Pineau (ECB) chaired the IRC task force andcoordinated its work. Ettore Dorrucci (ECB) drafted thepaper, and the other task force members carried out thecorresponding background studies as acknowledged in thefootnotes to each of the seven annexes.

6ECBOccasional Paper No. 43February 2006
MEMBERS OF THE INTERNATIONAL RELATIONS COMMITTEE TASK FORCE ON ACCUMULATIONOF FOREIGN RESERVES
European Central Bank Georges PineauEttore DorrucciFabio ComelliAngelika Lagerblom
Nationale Bank van België/Banque Nationale de Belgique Michel Soudan
Deutsche Bundesbank Gudrun Leichtlein
Banco de España Emiliano González-Mota
Banque de France Guy Levy-Rueff
Banca d’Italia Maurizio Ghirga
De Nederlandsche Bank Philipp Maier
Banco de Portugal Teresa Balcao Reis
Suomen Pankki Jouko Rautava
OTHER AUTHORS OF THIS OCCASIONAL PAPER
Deutsche Bundesbank Antje Kreye
Banco de España Lucía Cuadro SáezSergio Gavilá

7ECB
Occasional Paper No. 43February 2006
SUMMARY
SUMMARY
World foreign exchange reserves grew fromUSD 1.2 trillion in January 1995 to more thanUSD 4.0 trillion in September 20052. Reserveaccumulation in this period exhibited fourfeatures that seem largely unprecedented.Three of these features became particularlyprominent in 2002-04. First, world reservesgrew by around 85% (or 91% if the first eightmonths of 2005 are included), at a pace threetimes faster than in 1999-2001. Second,monetary authorities in Asia, including Japanuntil March 2004, accounted for the bulk of theaccumulation, and eight of them are currentlyamong the ten largest reserve holders. Third,fewer official creditors held an increasinglylarger share of the total accumulation. The topfive reserve accumulating central banks, whichaccounted for almost 57% of the total reserveaccumulation on average in the period 1995-2001, increased their share to more than 68% ofthe total world accumulation in 2004. The toptwo, Japan and China, accounted for about halfof the total world accumulation in 2002-04, andcurrently hold around 40% of the total worldstock of reserves. A fourth, equally importantdevelopment has come about more recently:the oil-exporting countries, whose combinedcurrent account surplus is estimated to haveexceeded that of the Asian economies in 2005,have emerged as a new major group of netcapital exporters in the world economy. They,however, have accumulated assets not only inthe form of “traditional” reserves, but also bybuilding up foreign assets in so-called oil funds– a phenomenon that is not yet fully captured bythe available statistics, including those on thefinancing of the US external deficit.
Such an unprecedented accumulation ofofficial foreign assets can be seen as theoutcome of three main drivers in addition to themore recent oil price hike. First, in theaftermath of the financial crises that occurredin the 1990s and early 2000s, many emergingmarket economies (EMEs) felt the need to self-insure against future crises. Second, at thebeginning of their recoveries and following
strong depreciation of their currencies, thecrisis-hit Asian economies pursued export-ledgrowth supported by exchange rate regimesanchoring their currency, de jure or de facto,to the US dollar. Third, certain features ofthe domestic financial systems of EMEs,especially in Asia, are likely to have playeda role. Such characteristics relate mainly to:(i) their underdeveloped local financialsystems, entailing difficulties in properlychannelling domestic private savings toinvestment as well as inefficient and/or costlyhedging markets; (ii) the resultant tendencytowards dollarisation of official and/or privatecross-border assets on the part of certaincreditor EMEs; and (iii) from a macroviewpoint, an excess of domestic savings overinvestment driven by either a savings glut(e.g. China) or an investment drought (otherAsian emerging market economies). All thesefeatures have significant links to reserveaccumulation, as explained below.
These recent drivers of reserve accumulationseem to have one aspect in common, namely therole played by the build-up of official foreignassets both as an outcome of and an instrumentfor integration of the EMEs concerned into theglobal financial markets. Several emergingcountries, especially in Asia, have in factbecome major players in international trade butare still underdeveloped from a financial angle.This asymmetry is probably one reason whyEMEs now hold around two-thirds of worldreserves compared with less than 30% at theend of the Bretton Woods period in the early1970s, whereas the total reserves of matureeconomies with complete and deep financialmarkets, excluding Japan, have remainedstable at around USD 500 billion since the early1990s.
As underlined in the literature, continuedreserve accumulation may over time entail some
2 As reported by the IMF in its latest update of the database onCurrency Composition of Off icial Foreign ExchangeReserves. In the remainder of this paper, however, data areupdated until the end of August 2005, when world reservesstood at USD 3.9 trillion.

8ECBOccasional Paper No. 43February 2006
risks and costs, such as inflationary pressure,over-investment, asset bubbles, complicationsin the management of monetary policy,potentially sizeable capital losses on monetaryauthorities’ balance sheets, sterilisation costs,segmentation of the public debt market andmisallocation of domestic banks’ lending.
Two other noteworthy developments have beenrecorded in several economies in recent years.First, some progress has been made towardsmore active management of official reserves,resulting, for instance, in investment in a morediversified range of instruments with longermaturities. Second, a substantial share ofofficial foreign assets has been channelled intovehicles with purposes other than reserveholding. Examples include (i) the creation ofoil funds in countries such as Norway, Russia,Venezuela, Kuwait and Oman, which aim toeither stabilise their oil revenues (stabilisationfunds) or save part of them for futuregenerations (savings funds) or for earlyreimbursement of foreign debt; (ii) theestablishment of “heritage funds” which havemore explicit return objectives in economiessuch as Singapore; (iii) the injection of USD 60billion from reserve assets into three majorstate-owned commercial banks in China inorder to increase their capital base for theirpartial privatisation; and (iv) the allocation ofUSD 15 billion to banks in the Taiwan Provinceof China (hereinafter called Taiwan) for use inmajor domestic investment projects. Theeffects of these innovative ways of usingofficial foreign assets are still to be fullyunderstood, in particular with regard to the linkbetween exchange rate and fiscal policy (e.g. inRussia), between the macroeconomic and themicro-prudential dimension of economicpolicy (e.g. in China), and between themanagement of very liquid, low-risk assets atcentral bank level and the management oflonger-term, more return-oriented portfoliosby other financial entities (e.g. in Singapore).
Regarding the impact of reserve accumulationon yields, in the existing literature theestimates of the effect of foreign exchange
intervention on US Treasury yields are quitedifferent, and range from negligible to 200basis points. This paper shows that purchasesof US government debt securities by Asianmonetary authorities might have affected thelevel and dynamics of their yields; inparticular, there is some evidence that Japanesepurchases of US Treasuries might have had animpact of around 65 basis points on three-yearUS Treasury yields at the time of the mostsizeable interventions. Looking forward, theoverall market impact of portfolio changescould differ, depending on the preferences ofthe private sector.
In conclusion, a significant share of the UScurrent account deficits is financed by foreignofficial institutions pursuing objectives thatare, to some extent, insensitive to risk-returnconsiderations. However, EMEs couldprogressively lessen their need for reserveaccumulation by developing policies such as:(i) structural and macroeconomic measures tofoster domestic demand; (ii) financial systemreforms both at domestic and regional levels,including bond market development; (iii) awell-sequenced shift towards greater exchangerate flexibility, coupled with money marketreforms and, possibly, financial accountliberalisation; (iv) regional economicsurveillance and monetary cooperation which,ceteris paribus, would reduce the need forunilateral reserve accumulation.
1 THE PUZZLE OF RESERVE ACCUMULATIONSINCE 2002
The accumulation of world foreign exchangereserves (hereinafter called reserves)3 hasexhibited largely unprecedented features since2002 with respect to: (i) the size and pace of theaccumulation, (ii) the degree of concentrationof ownership, and (iii) the geographicaldistribution.
3 For further evidence, see Annex 1. In this paper theexpression “reserves” always refers to foreign exchangereserves – i.e. reserves net of gold, special drawing rights(SDR) and reserve positions at the IMF – unless otherwisespecif ied.

9ECB
Occasional Paper No. 43February 2006
1 THE PUZZLEOF RESERVE
ACCUMULATIONSINCE 2002
First, while world reserves more than tripled inthe past ten years, they have almost doubled inthe last four years alone, with the rate ofaccumulation increasing dramatically since2002. World reserves have in fact grown fromUSD 1.2 trillion in January 1995 to more thanUSD 4.0 trillion in September 2005 (accordingto the latest data for 2005 made available bythe IMF)4, but the pace varied significantlythroughout the period. Between 1995 and 2001,the financial crises affecting a number of EMEsin a context of increasingly liberalised capitalflows, and the ensuing need to use reserves andthen replenish them as self-insurance againstfuture crises, were important factors. However,in 1997-98, in particular, global reservesincreased by just USD 76 billion, with crisis-hit countries considerably reducing theirforeign assets (see Table 1). Conversely, worldreserves grew significantly – by around 30% –in 1995-96 and 1999-2001. In 1995-96 thisgrowth was mainly driven by the interventionsof China and Japan, which accounted for 14%and 26% of world reserve growth respectively.In 1999-2001, the desire for self-insurancegained momentum among reserveaccumulators; in particular, the reserves lost in1997-98 were replenished by the ASEAN-5economies5 and Russia. Since January 2002,
however, world reserves have risen by 91%(i.e. almost USD 2 trillion), which seemslargely unprecedented. In terms of both reserveholdings and contribution to world reservegrowth, the top three accumulators have beenChina, Japan and Taiwan. In the case of a fewcountries such as Turkey and, since 2003,Argentina and Brazil, such moves can still beinterpreted as reserve replenishment, but inmost other cases the rate of accumulationappears particularly high not only incomparison with the previous seven years, butalso by historical standards.
Looking back, while world foreign exchangereserves doubled from USD 16 billion to USD33 billion in the decade from 1959 to 1969, theythen tripled in just three years, between 1970and 1972, reflecting large interventions at atime when the Bretton Woods system wasunravelling. Since the early 1970s, i.e. the endof Bretton Woods period, reserve assets have
2002–2005 1999–2001 1997–1998 1995–1996
USD Contribution USD Contribution USD Contribution USD Contributionbn to world bn to world bn to world bn to world
growth (%) growth (%) growth (%) growth (%)
China 536 29.0 67 14.7 36 47.8 50 14.4
Japan 443 24.0 177 39.0 -4 -5.2 91 26.1
Taiwan 130 7.1 30 6.7 2 2.6 -5 -1.5
Russia 114 6.1 26 5.6 -2 -2.8 9 2.6
Korea 102 5.5 49 10.8 21 27.7 8 2.2
India 92 5.0 18 3.9 7 9.4 0 0.0
Malaysia 49 2.7 3 0.7 -1 -1.8 2 0.4
Singapore 41 2.2 1 0.3 -3 -3.4 18 5.2
Algeria 33 1.8 12 2.5 2 2.6 2 0.5
Brazil 19 1.0 2 0.3 -14 -19.0 22 6.2
World 1,849 100 455 100 76 100 349 100
Table 1 Year-on-year changes in foreign exchange reserves and their contribution to globalreserve growth(January 1995–August 2005)
Sources: IMF and ECB Staff calculations.
4 See the IMF Currency Composition of Off icial ForeignExchange Reserves (COFER) database. In the remainder ofthis paper, data are updated until the end of August 2005,when world reserves stood at USD 3.9 trillion.
5 ASEAN stands for Association of East Asian Nations, themembers of which are Brunei Darussalam, Cambodia, Laos,Myanmar, Vietnam and the so-called ASEAN-5 countries:Indonesia, Malaysia, Philippines, Singapore and Thailand.

10ECBOccasional Paper No. 43February 2006
multiplied by a factor of 456, a strikingexpansion compared with that in the 1950s and1960s. Yet, despite the very high levels alreadyreached, reserve accumulation has furtheraccelerated in very recent years, as shown inChart 1.
Post World War II trends contradict the notionthat reserve accumulation is mainly driven bythe prevalence of de jure pegged exchange rateregimes, since such regimes have decreasedsignificantly since the 1970s and even more sosince the second half of the 1990s. Over thepast decade, in particular, one third of allcurrencies have been independently floatingaccording to the official IMF classification.This figure, however, is reduced to less than10% if actual observed exchange ratebehaviour is taken as the yardstick. A numberof countries are still anchoring their currencies– not necessarily in the form of traditional pegs,but also via heavily managed floating – toeither the US dollar or the euro. In particular,the countries pursuing a de facto tight peg to thedollar account for around 10% of world GDP atmarket prices, while a further set of economieswith a share of world GDP of about 7% haveadopted some form of managed float vis-à-visthe US currency7.
Second, the degree of concentration of reserveaccumulation has been also increasing overtime. This means that, on the official side, thefinancing of the US current account deficit hasbecome concentrated among increasinglyfewer institutions, at least until 2004 (final2005 data were not available when this paperwas prepared for publication). The top fivereserve accumulating central banks, whichaccounted for 56.9% of total reserveaccumulation in the period 1995-2001, held ashare amounting to 68.4% of worldaccumulation in 2004. The top two holders,Japan and China, accounted for more than halfof the world accumulation between 2002 andthe present day; they currently hold around40% of the total stock of reserves.
Third, as regards the geographical distribution,the Asian economies now account for the bulkof both reserve accumulation and reserveholdings. The share of world foreign reservesheld by Asian economies grew from 46% inJanuary 1995 to 64% in August 2005. Inparticular, the Asian monetary authoritiesaccounted for 77% of the increase in the period2002-05. As a result, eight Asian monetaryauthorities are currently among the ten largestreserve holders, with seven of them owningmore than USD 100 billion (see Table 2 andChart 2).
Sizeable foreign asset accumulation has beenalso taking place in oil-exporting countries suchas Russia, Algeria and Norway (see Table 2).While this is generally related to the surge in oilprices, which has been particularly strong since2004, Russia also benefited from a remarkableincrease in the volume of its oil exports. Inaddition, it should be borne in mind that the IMFreserve statistics do not include “oil funds”, intowhich several governments channel significant
Chart 1 World foreign exchangereserves: 1945-20051)
(USD trillions)
Sources: IMF, International Financial Statistics and WEO.1) August 2005.
0.0
0.5
1.0
1.5
2.0
2.5
3.0
3.5
4.0
4.5
0.0
0.5
1.0
1.5
2.0
2.5
3.0
3.5
4.0
4.5
China, mainlandemerging market and developing economies (excl. China)Japanmature economies (excl. Japan)
1945 1950 1955 1960 1965 1970 1975 1980 1985 1990 1995 2000 2005
6 In this period, world reserves including gold holdings havemultiplied by a factor of “only” 28, if one values gold at thehistorical price of SDR 35 per ounce.
7 These f igures are based on de facto exchange rateclassif ications. Currencies with little or no observedvolatility against an anchor currency are considered to betightly pegged, while those with limited volatility areconsidered to be managed floaters.

11ECB
Occasional Paper No. 43February 2006
1 THE PUZZLEOF RESERVE
ACCUMULATIONSINCE 2002
parts of their oil revenues. This is the case forcountries such as Venezuela, Kuwait, Oman and,again, Russia and Norway. The amountsinvolved are often far from negligible. Forinstance, the market value of the Norwegiangovernment’s Petroleum Fund amounted toaround 78% of GDP at the beginning of 2005.The latest figures show that the accumulation ofboth reserves and oil fund assets by this group ofcountries recorded an even greater rise in 2005,driven by an overall current account surplusestimated to have peaked at more than USD 400billion (almost 1% of world GDP). Conversely,several non-oil-exporting mature economieshave been shedding reserves, although importantexceptions are Japan until March 2004 (whichcarried out large interventions in a deflationarycontext) and, to a lesser extent, Denmark (whichintervened in the framework of the EMS and thenERM II). As Chart 2 shows, the total reserves ofmature economies excluding Japan havestabilised at around USD 500 billion since theearly 1990s. As a result, the emerging market
and developing economies, which held less than30% of total world reserves around the time ofthe collapse of the Bretton Woods system, nowhold around two-thirds (see Chart 1)8. Betweenthe mid-1980s and 1996 the reserves of thisgroup of economies broadly trended upalongside their net private financial inflows.However, since 1997 the link between these twovariables has weakened somewhat, as Chart 2suggests. The share of reserves held by LatinAmerican countries – albeit on the rise,especially in Mexico and, since 2003, Brazil –amounted to only 5.4% in December 2004. Theshare of African and Middle East countriesremained broadly stable throughout the periodconsidered. At the end of 2004 these economiesheld 7.1% of global foreign reserve assets.
Reserve-accumulating 1995 1996 1997 1998 1999 2000 2001 2002 2003 2004 2005 1) % of CC2) Regimecountries (with ranking) GDP (de jure)3)
1 . Japan 172.4 207.3 207.9 203.2 277.7 347.2 387.7 451.4 652.8 824.3 823.1 17.7 N IF2 . China 73.6 105.0 139.9 145.0 154.7 165.6 212.2 286.4 403.2 609.9 769.0 37.0 Y MF3. Taiwan 90.3 88.0 83.5 90.3 106.2 106.7 122.2 161.7 206.6 241.7 253.7 78.2 N IF4 . Korea – 29.4 8.9 48.5 74.1 96.2 102.8 121.4 155.3 199.1 205.9 29.1 N IF6 . Russia 14.4 11.3 12.9 7.8 8.4 24.3 32.5 44.0 73.2 120.6 155.7 20.7 Y MF7. India – – 23.9 26.8 31.5 36.8 44.9 65.7 95.2 124.7 136.9 18.9 Y MF8. Hong Kong 55.4 63.8 92.8 89.6 96.3 107.6 111.2 111.9 118.4 123.6 122.0 75.1 N CB9. Singapore 68.8 77.0 71.4 75.0 77.2 80.4 75.8 82.3 96.3 112.8 115.5 104.4 N MF
10. Malaysia 22.9 25.1 20.0 24.7 29.7 28.6 29.6 33.3 43.5 58.2 75.8 55.5 Y MF11. Mexico 15.7 16.7 26.7 29.5 30.7 36.2 40.0 45.8 55.7 61.0 68.6 15.0 N IF12. Brazil 51.8 60.1 52.2 44.5 36.3 33.0 35.9 37.8 47.1 54.0 54.8 8.8 N IF13. Algeria 2.0 4.2 8.0 6.8 4.4 11.9 18.0 23.1 32.9 39.4 51.7 52.9 Y MF14. Thailand – – – 24.7 33.6 32.5 33.2 38.1 42.1 49.1 48.3 29.7 N MF15. Norway 21.1 25.2 22.0 17.3 22.5 26.7 22.2 30.7 35.9 42.7 42.7 17.1 N IF16. Turkey – – – – – 19.6 19.9 26.4 32.3 35.1 41.7 11.8 N IF19. Denmark 10.2 13.4 18.2 13.7 21.1 14.5 16.1 25.9 36.0 38.2 34.4 15.8 N FP20. Australia 11.3 13.9 16.1 13.4 19.5 16.8 16.4 18.6 29.9 33.9 33.4 6.1 N IF
Other (non-accumulating) reserve holders (with ranking)5 . Euro area 277.4 306.8 312.5 284.4 228 218.6 208 215.8 188 179 173.2
17. US 49.1 38.3 30.9 36.0 32.2 31.2 29.4 33.1 39.2 42.4 38.718. UK 39.2 37.1 28.8 27.3 30.1 39.3 32.0 32.8 35.1 39.5 38.6
Sources: IMF and CEIC Data Company database.1) Latest available 2005 data (mostly to August 2005).2) Capital controls: Y = Yes; N = No.3) IF: Independent floating; MF: managed floating; FP: f ixed peg; CB: currency board.
Table 2 Foreign exchange reserves of countries with the largest holdings: 1995-2005 1)
(net of gold, SDR and reserve positions at the IMF; end-of-period holdings; USD billions)
8 Including gold holdings valued at the historical price of SDR35 per ounce, the share of EMEs in world reserves increasedfrom less than 20% to over 60% in the same period. Withgold valued at market prices, however, the share of reservesheld by mature economies would be significantly higher.

12ECBOccasional Paper No. 43February 2006
2 POSSIBLE DRIVERS OF THE RECENTRESERVE ACCUMULATION
Traditional criteria, such as the adoption offoreign exchange controls or de jure exchangerate regimes and the adequacy of foreignreserves, may not provide a full understandingof the phenomenon of reserve accumulation(see also Annex 2 for greater detail and areview of the literature).
First, the presence or absence of controls oncapital movement is not a factor thatdistinguishes reserve-accumulating economiesfrom other economies, as Table 2 confirms.Second, sustained intervention has been takingplace even in economies with de jureindependent floating currency regimes, thusconfirming the de facto managed nature of suchregimes. This may have been partly becauseexpectations of further appreciation of theexchange rate produced short-term capitalinflows, adding to exchange rate pressure inthe economy and thus inducing the localauthorities to intervene in order to preventexcessive exchange rate appreciation and/or tosmooth out volatility. Third, the notion usedin the literature of “adequacy” or “excess” of
foreign reserves does not capture the keyfeatures of the process of accumulation, at leastsince 2002. Indeed, the main reserve-accumulating economies have ratios of reserveassets to imports that are well above the three tofour months’ coverage, which is the rule ofthumb. Taiwan, for instance, would be able tofinance its imports with its reserves for aroundtwo years. Similarly, the ratios of reserves tototal external debt maturing within one yearhave risen far above the level of 1recommended by the Greenspan-Guidotti rule,reaching a value of around 10 in China forexample. Turning to the ratio of reserves tobroad money, which indicates the potential fora capital flight from the domestic currency byresidents, this indicator has also increasedsignificantly above the threshold values,reaching levels of around 90% in India andSingapore. Finally, an alternative indicatorthat can be used is the ratio between a country’sreserve assets and its IMF quota. If this ratio isgreater than unity, then the country concernedhas foreign assets exceeding the maximum IMFresources it could borrow based on its IMFquota. Again, for most reserve accumulatorsthis ratio far exceeds 100%.
All in all, these considerations support the viewthat reserve accumulation in most countrieshas gone beyond the levels warranted byconventional indicators, suggesting that thebuild-up is largely influenced by other factors.Three of the fundamental drivers of reserveaccumulation, all of which are in some wayrelated to financial globalisation, stand out inaddition to the more recent oil price hike:
(i) A desire to self-insure against financialcrises (virtually all EMEs share thismotivation, although it is expected to loseweight as accumulation progresses, and isalready less important than a few yearsago);
(ii) The pursuit, at least during certain periods(e.g. following a financial crisis), ofexport-led growth by a number of Asianeconomies, supported by exchange rates
Sources: IMF, International Financial Statistics and WEO.1) To August 2005.
Chart 2 World foreign exchange reservesand total net private f inancial inf lows ofEMEs: 1980-20051)
(USD trillions)
0.00
0.50
1.00
1.50
2.00
2.50
3.00
3.50
4.00
4.50
1980 1983 1986 1989 1992 1995 1998 2001 2004-0.05
0.00
0.05
0.10
0.15
0.20
0.25
0.30
non-Asia Emerging Markets (right-hand scale)mature economies (excl. Japan, right-hand scale)Japan (right-hand scale)non-Japan Asia (right-hand scale)global capital flows to Emerging Markets (left-hand scale)

13ECB
Occasional Paper No. 43February 2006
2 POSSIBLEDRIVERS OFTHE RECENT
RESERVEACCUMULATION
anchored de jure or de facto to the USdollar;
(iii) The combined effect of a number offeatures related to the financial structureof several EMEs, includingunderdeveloped domestic financialsystems and dollarisation of foreign assetsin certain net creditor Asian economies.
First, reserves may have been accumulated inorder to weather potential turbulence incurrency markets and/or shocks to the balanceof payments. The literature shows that this mayhave been particularly the case for EMEscharacterised by a high degree of capitalmobility coupled with underdevelopeddomestic financial systems. This sensitisationto financial risk is, in fact, mainly related todevelopments such as the impressiveexpansion in holdings of cross-border assetsand liabilities9 and the increased vulnerabilityto sudden stops in capital flows in a context offinancial account liberalisation. While reserveaccumulation may no longer be proportional tothe actual risks faced by certain countries, thisdoes not seem to be the case as yet for mostLatin American emerging market debtoreconomies. At least until recently, theseeconomies have long been unable to borrowabroad in their domestic currencies – though incountries like Mexico and Brazil there weresigns in 2005 that this situation wassignificantly easing – and, therefore, have hada particular incentive to accumulate reserves toself-insure against a possible loss of access tointernational capital markets. Even today inAsia external risk mitigation considerationsstill continue to be one of the reasons forreserve accumulation. Unilateral reserve build-up may also have been one way to pursuegreater independence from potential recourseto IMF financing, to the extent that countries donot regard conditional borrowing rights withthe IMF and their own assets as perfectsubstitutes.10
Before focusing on the two other drivers ofreserve accumulation listed above, it should be
observed that, with a few temporary exceptions(e.g. Brazil until 2002 and India until 2000 andthen again since 2004), the main emergingmarket reserve accumulators have not behavedas standard economic theory would predict, i.e.maintained current accounts in deficit or closeto balance coupled with net foreign directinvestment (FDI) inflows and other financialinflows from mature economies. EMEs havebeen providing the rest of the world, andespecially the United States, with net resourcesin the form of current account surpluses. Thisimplies that a significant excess of domesticsavings over investment has, as a rule, been acharacteristic shared by all major reserveaccumulators (including Japan), although thishas been the outcome of different trends insavings and investment in the economiesconcerned. Certain economies, moreover, havenot only recorded current account surpluses buthave also been confronted with increasingexchange rate pressure arising from netfinancial inflows. Accordingly, four differentgroups of reserve accumulators can bedistinguished on the basis of the trends in theirbalance of payments and savings-investmentbalance. These groups are shown in Chart 3,which focuses on the top nine emergingmarket reserve accumulators and confirms that,though as a result of different developments, allthese economies have on average recordedexcess domestic savings over investment,i.e. current account surpluses. This, however,does not imply reserve accumulation per se.The phenomenon can therefore only beunderstood in conjunction with other featurestypifying the countries under examination.
9 According to the IMF, worldwide gross external assets haveincreased from USD 2.4 trillion in 1980 to around USD 40trillion today.
10 Reserve accumulation is also likely to have indirectlysmoothed the progress of regional monetary and financialcooperation in East Asia. The total size of bilateral swaparrangements available in East Asia under the Chiang MaiInitiative, amounting to around USD 39.5 billion in March2005, could soon rise by up to 100% following a decisiontaken by ASEAN+3 Finance Ministers at their meeting inIstanbul on 4 May 2005. On this occasion it was alsoannounced that the f inancing threshold above which IMFconditionality would not apply will be increased from 10% to20%.

14ECBOccasional Paper No. 43February 2006
One of these features may, in a number ofcountries and for limited periods, have been thepursuit of some form of export-led growth,which is the second possible driver of reserveaccumulation identified in this paper. Inparticular, in Asian countries other than Chinaand India, the investment/GDP ratio hasdropped significantly since the mid-1990s, asa result of: (i) the 1997-98 financial crises
(see Charts 3a and 3c) and (ii) the bubble yearsin Japan. Most notably, in the ASEAN-5countries and Korea the average investment/GDP ratio, which was 34.7% in 1996, wasstill 24.1% in 2004. With the savings ratioremaining broadly unchanged, this seems tohave induced several of these countries to usethe US dollar as a monetary anchor to underpinexport-led growth after 1997. It should be
Chart 3 Reserve accumulation, balance of payments composit ion and savings- investmentbalance in the nine main emerging market reserve accumulators(USD billions; data aggregated for country clusters as described in the text)
Sources: IMF and ECB staff calculations.Notes: Reserve accumulation does not fully equal the algebraic sum of the other balance of payments items shown in the charts. Theremainder is given by the sum of errors and omissions and the “capital account” as def ined in off icial statistics. 2005 data are IMFannual estimates.
Malaysia and Singapore
current accountother capital inflows (+) or outflows (-)net FDI inflows (+) or outflows (-)gross national savingschange in total reservesinvestment
100
80
60
40
20
0
-20
-40
100
80
60
40
20
0
-20
-401996 1997 1998 1999 2000 2001 2002 2003 2004 2005
Russia, Brazil and Algeria
current accountother capital inflows (+) or outflows (-)net FDI inflows (+) or outflows (-)gross national savingschange in total reservesinvestment
1996 1997 1998 1999 2000 2001 2002 2003 2004 2005
50
-50
150
250
350
450
50
-50
150
250
350
450
Korea and Taiwan
current accountother capital inflows (+) or outflows (-)net FDI inflows (+) or outflows (-)gross national savings (right-hand scale)change in total reservesinvestment (right-hand scale)
1996 1997 1998 1999 2000 2001 2002 2003 2004 20050
50
100
150
200
250
300
350150
100
50
0
-50
a. Current account-driven, in conjunction witha drop in domestic investment after the 1997-98Asian crises
b. Current account-driven, in conjunction withdomestic savings growing more than investment
c. Driven both by the current account and thefinancial account, in conjunction with a drop indomestic investment after the 1997-98 Asian crises
d. Driven both by the current account and thefinancial account, in conjunction with domesticsavings growing more than investment
China and India
current accountother capital inflows (+) or outflows (-)net FDI inflows (+) or outflows (-)gross national savings (right-hand scale)change in total reservesinvestment (right-hand scale)
1996 1997 1998 1999 2000 2001 2002 2003 2004 2005-100
0
100
200
300
400
500
200
400
600
800
1,000
1,200

15ECB
Occasional Paper No. 43February 2006
2 POSSIBLEDRIVERS OFTHE RECENT
RESERVEACCUMULATION
observed, however, that in more recent yearsthe contribution of net exports to real GDPgrowth has been declining in most Asianeconomies, with the notable exceptions ofSingapore, Hong Kong S.A.R. and, since 2003,Korea. Moreover, the recent experience ofKorea – which saw its currency appreciate byaround 24% against the US dollar between theinitial months of 2002 and the final monthsof 200511 while reserves doubled in the sameperiod to USD 206 billion – suggests that otherfactors have been at play.
Another factor that may have producedresistance to exchange rate appreciation and,hence, supported reserve accumulation in thesecountries, is their high degree of trade openness(90% on average in Asia). This implies a higherpass-through of exchange rate changes intodomestic prices, and hence a strongerdeflationary bias in the event of currencyappreciation.
Unlike other Asian EMEs, China saw itsinvestment/GDP ratio rise between 1996 and200412, which has not prevented the countryfrom recording current account surpluses in thepresence of a saving rate increasing even more(see Chart 3d). In this context, the Chineseauthorities have maintained an exchange ratepolicy that has resulted in currencydepreciation in real effective terms since 2002.Between that year and the exchange rate reformof 21 July 2005, the real effective exchange rate(REER) of the renminbi fell by around 15%,though still remaining above the 1995 level.This trend – which the recent exchange ratereform has only partly reversed – hassupported, together with very low labour costs,the price competitiveness of Chinese exports,thus helping to fuel growth in a dual economycharacterised by a rural population ofunderemployed workers accounting for two-thirds of the population but less than 30% ofGDP.
Besides the developments described above, netexcess savings have to be also examined inconnection with certain features of EMEs’
financial structures, which leads to thediscussion of the third driver of reserveaccumulation. Given the inability of theirfinancial markets to channel private savings toinvestment, either domestically or abroad, incertain countries the public sector may haveendeavoured to direct residual savings abroad,thus leading to reserve accumulation. Thisseems to apply to China, given its outwardforeign exchange controls and the role of thepublic sector in the economy. Indirectconfirmation of this interpretation maypossibly be provided by the case of Japan,where the suspension of interventionoperations since mid-March 2004 seems tohave been associated with – and made possibleby – a considerable increase in the share offoreign assets held by the private sector.
A related aspect is that several reserve-accumulating countries are becominginternational net creditors. In some of thesecountries, however, external assets remainlargely or fully denominated in foreigncurrency, either because they lend only limitedamounts in domestic currency (e.g. Japan) orbecause lending in their domestic currencies isprecluded by asymmetric foreign exchangecontrols (e.g. China). This leads tofundamental mismatches in their nationalbalance sheets, consisting of sizeable holdingsof liquid assets mainly denominated in USdollars that are not balanced on the liabilityside. Especially in Asia, asset dollarisation hasled to attempts to “socialise” the exchange raterisk, i.e. to use reserve assets as a vehicle totransfer this risk from the private to the officialsector, though not reducing it for the economy
11 In nominal effective terms, after remaining relatively stablein 2002-03, the Korean won appreciated by more than 20%between May 2004 and end-2005.
12 The trend in investment recorded in China, which runscounter to those of most other countries in the region, may bepartly due to China’s growing role as a hub in the Asianproduction and export chain. Given this role, it is diff icultfor China’s regional partners to let the exchange ratesignif icantly appreciate in the absence of measures torevalue or introduce greater flexibility in China’s exchangerates. The immediate reaction of Malaysia to the 2%revaluation of the renminbi in July 2005 clearly conf irmsthis point.

16ECBOccasional Paper No. 43February 2006
as a whole13. In certain countries this mayhave been partly justified by the fact thatprivate hedging is more difficult and costly,particularly in periods characterised byone-way bets on the exchange rate, whichconstrains private capital outflows even in theabsence of restrictions on them.
On the whole, these recent drivers of reserveaccumulation seem to have one aspect incommon, namely the role played by the build-up of official foreign assets both as an outcomeof and an instrument for integration of theEMEs concerned into the global financialmarkets. Several emerging countries,especially in Asia, have in fact become majorplayers in international trade but are stillunderdeveloped from a financial angle.
3 DOMESTIC RISKS AND COSTS OF RESERVEACCUMULATION
While past experience indicates that centralbanks were usually able to sterilise the
expansionary impact of foreign exchangepurchases on base money, interventions havebeen larger and more prolonged in recent years.When specific features of today’s reserve-accumulating EMEs, such as theirunderdeveloped financial systems, are takeninto account, some risks and costs maymaterialise as a result of the process ofaccumulation. The most significant ones aresummarised in Table 3 and include inflationarypressure, overinvestment, asset bubbles,complications in the management of monetarypolicy, segmentation of the public debt market,potentially sizeable capital losses on monetary
13 Unlike in Asia, there has been little socialisation of theexchange rate risk in Latin America. One exception wasBrazil in 1997-99, when the currency mismatches of thecorporate and banking sector were transferred to the publicsector through a number of measures, including the issuanceto residents of Treasury securities linked to the US dollar. Asa result, the overall exposure of the economy to exchangerate fluctuations did not change significantly. There is,however, strong evidence that since 1999 the Brazilianprivate sector has been hedging against exchange rate risk onits own, thus no longer relying on the off icial sector’s safetynet.
Table 3 Potential r isks and costs of reserve accumulation 1)
Source: Eurosystem.1) In Annex 3 some background information is provided on how these risks and costs might have become relevant, to varyingdegrees, in the recent past across a sample of large reserve holders.
Potential risk or cost
Risks (1) Conflict between exchange rate stability andinappropriate easing of monetary conditions,eventually resulting in inflation and/oroverinvestment and/or bubbles
(2) Difficulties for central banks in managing themoney market and, more generally, in implementingmonetary policy
(3) Segmentation of the public debt market, thusimpairing its liquidity
(4) Market (i.e., currency and interest rate) risk,resulting in potentially sizeable capital losses on thebalance sheet of the monetary authority
Costs (1) Sterilisation costs
(2) Concerns about bank profitability
Underlying factors
Unsuccessful sterilisation due to e.g. (i) underdevelopedfinancial markets and shortage of sterilisation instruments;(ii) snowball effects (i.e. higher interest rates produced bysterilisation coupled with expectations of exchange rateappreciation produce massive capital inflows, thus forcing thecentral bank to intervene/sterilise even more)
Excessive central bank dependence on liquidity-absorbingtransactions, whereas the money market is more easilymanaged via liquidity-providing operations
Excessive sterilisation through issuance of central bankliabilities instead of government paper
Accumulation over time of a potential for currencyrevaluation/appreciation, which materialises whenintervention ceases or is no longer effective; interest rate risk
The yields paid on domestic sterilisation instruments exceedthose on foreign assets
Particularly because of controls on lending, the banking sectormight have hardly any alternatives to buying low-yieldsterilisation instruments

17ECB
Occasional Paper No. 43February 2006
3 DOMESTICRISKS AND COSTS
OF RESERVEACCUMULATION
authorities’ balance sheets, sterilisation costs,and misallocation of domestic banks’ lending(see Annex 3 for greater detail). At the sametime, the risks and costs may vary significantlyfrom country to country and, over time, withineach country. Hence, the balance of incentivesand disincentives to accumulate reserves mayalso change. Looking forward, if netdisincentives were to materialise in a numberof countries, accumulation would probablydecrease overall but it might also becomefurther concentrated in a smaller group ofeconomies.
In China, the intervention-related rise inreserve money was almost entirely sterilised in2002, but the sterilisation rate proved to bemuch more limited in 2003-04, partly becauseof implementation difficulties. Partly as aresult, the annual consumer price index (CPI)rate increased from -0.8% in 2002 to 3.9% in2004, alongside signs of overinvestment andlocal property price bubbles. Yet inflationremains subdued in China if one considers itsimpressive growth rate, and even trended downsignificantly after October 2004. Financial“repression” in the form of both administrativemeasures to limit credit expansion andasymmetric controls on capital flows played animportant role in achieving this. Even thoughsuch measures entail a cost in terms ofmisallocation of resources and have notprevented the country from recording massive“speculative” inflows and some interest ratetightening, they nevertheless allow China tobenefit from exchange rate stability and somedegree of monetary policy autonomy at thesame time. Moreover, sterilisation costs havebeen kept under control, even when US interestrates reached their low point, and have becomeeasier to manage since the current UStightening cycle started in mid-2004.
In Korea, where the intervention-relatedgrowth in reserve money was largely sterilisedin 2003-04, the main problem faced by thecentral bank is in its own view, the over-reliance of its monetary policy on liquidity-absorbing transactions. Moreover, in 2004
the interest payments on the MonetaryStabilisation Bonds issued by the Bank ofKorea to control the money supply weresignificantly higher than prevailing US interestrates. This negative differential contributed tothe loss of KRW 150 billion (about USD 130million) posted in the Bank of Korea’s 2004balance sheet. The sizeable intervention, whichin just a few years has made this country thefourth largest reserve holder in the world(starting from a level of USD 9 billion asrecently as end-1997), has not prevented thewon from appreciating strongly against the USdollar since 2002. Such an appreciation mightoccasionally have led to some tension betweenthe objective of maintaining a fairly stableeffective exchange rate in a regional contextand the strategy of inflation targeting pursuedby the central bank since 1998.
In India, the large capital inflows recorded inrecent years have presented a challenge forthe conduct of monetary policy and triggereda debate on the need for exchange rateadjustment. At the beginning of 2004, theMinistry of Finance agreed with the ReserveBank of India to issue government securitiesand bills exclusively for sterilisation purposes.In comparison with issuance of the centralbank’s own liabilities, this measure provedsuccessful in permitting sterilisationoperations that do not contribute to segmentingthe sovereign bond market. However, India hasexperienced a very unfavourable differentialbetween foreign and domestic interest rates,entailing sterilisation costs.
In Russia, central bank interventions have beenaccompanied by strong liquidity growth andincreased inflationary pressure. While tightfiscal policy and the setting-up of the oilstabilisation fund in 2004 (which has proved tobe a substitute for sterilisation) have greatlyhelped the Bank of Russia to keep monetaryconditions reasonably balanced, the currentmonetary and fiscal policy frameworks andinstruments may need to be further adjusted ifprogress is to be achieved in keeping inflationunder control in the period ahead. Thus, the

18ECBOccasional Paper No. 43February 2006
debate on moving to inflation targeting and amore flexible exchange rate policy14 is likely tocontinue in Russia.
Besides these general risks and costs, reserveaccumulation has also had some implicationsfor the balance sheets of certain central banks.These implications are described in Annex 4with regard to seven Asian central banks. Inparticular, it should be noted that the foreignassets of most of these institutions are currentlymuch greater than their capital base.
4 MAIN TRENDS IN CENTRAL BANK RESERVEMANAGEMENT
Not only have world reserves increaseddramatically in recent years, but the way theyare managed has also evolved over time. Theframeworks for foreign reserve management,however, vary significantly across countries,with China and Japan – the two largest reserveholders – being examples of management stylesthat differ from trends prevailing elsewhere.While recent trends in reserve management areanalysed more thoroughly in Annex 5, theirmain features are summarised below.
Reserve management in Japan is still strictlyconsidered from a policy viewpoint, and in factit is conducted along “passive” guidelines bythe Ministry of Finance, i.e. with limitedsensitivity to the risk/return trade-off. Littleinformation is available on reservemanagement in China. Regarding the otherAsian economies, the most importantdevelopment in reserve management hasbeen the use of a broader range of instruments.In addition, so-called heritage funds andinvestment corporations have been set up, forexample by Singapore and Korea respectively,with more explicit longer-term return-orientedobjectives.
Investment in new instruments has become animportant feature of reserve management inseveral Asian countries. The investmentspectrum, which was mostly limited to timedeposits and government bonds until a few
years ago, now includes: (i) other interest rateproducts, such as interest rate derivatives anddebt instruments bearing a spread over USTreasuries (e.g. BIS instruments, corporatebonds and government-linked issues such asthose of the US agencies); and (ii) sometimeseven equities. One approach adopted in order tofoster diversification along the yield curve andacross asset classes, is to split foreign reservesinto a liquidity portfolio and an investmentportfolio. The Hong Kong Monetary Authority,for example, has kept all foreign reserves underone roof at the central bank but has separatedthe funds into distinct portfolios with differentobjectives, risk profiles, time horizons andeligible instruments. In Korea, foreign reserveassets to an initial value of USD 20 billion (outof a total of USD 205 billion) started to bemanaged by an independent entity, the KoreanInvestment Corporation (KIC), on 1 July 2005,with the aim of seeking higher yields. Thefunds were shifted from the Bank of Korea’sreserves (which contributed USD 17 billion)and the Foreign Exchange Stabilisation Fund ofthe Ministry of Finance (which provided USD 3billion). The Bank of Korea will, however,maintain the option to recall its assets in theevent of an emergency, i.e. the funds areretained as international reserves while beingentrusted to the KIC for management. The KICpartly resembles the model of the Governmentof Singapore Investment Corporation (GIC),which was established in the 1990s in responseto the rapid growth of Singapore’s foreignreserve holdings. The GIC currently has aroundUSD 100 billion under management for non-intervention-related purposes, which is clearlydisentangled from the country’s reserves. Themain objectives of these moves are to achievehigher long-term returns and to preserve theassets’ value for future generations (hence thefunds are sometimes referred to as “futuregeneration” or “heritage” funds). The pool ofeligible instruments used to invest these fundsoften differs quite substantially from the one
14 It should be borne in mind that in Russia, unlike in most ofthe other economies reviewed in this paper, the euro plays anincreasingly important role in exchange rate policy and theprocess of reserve accumulation.

19ECB
Occasional Paper No. 43February 2006
4 MAIN TRENDSIN CENTRAL BANK
RESERVEMANAGEMENT
used by traditional reserve managers, andincludes, for example, equities, corporatebonds and special forms of investment. Suchinstitutions, moreover, often also have otherobjectives, such as fostering the domestic assetmanagement industry (Korea) and the domesticcapital market (Singapore and Hong KongS.A.R.).
Despite these developments, however, thisdiversification into new instrument types,although impressive for its rapidity, has not yetaltered the picture significantly since, givensafety and liquidity constraints, the bulk ofreserve assets is still government or quasi-government bonds, and the percentage offoreign reserves not invested in interest rateproducts is still negligible. Hence, while thechanges in foreign reserve management havebeen significant, they do not appear to havekept pace with reserve accumulation.
Turning to currency diversification, IMF dataexpressed in US dollars point to broad stabilityin the shares of reserve currencies in globalforeign exchange assets in recent years, withthe US dollar still accounting for the bulk(66.4% as at the end of September 2005)and the euro increasing its weight from 18%in 1999 to 24.3% in 2004, partly owing topositive valuation effects recorded in theperiod 2002-0415 (see Table 4).
The US dollar is still by far the most dominantreserve currency, especially in Asia. There arein fact several, mutually reinforcing reasonsrelated to asset management which seem toplay a significant role in the US dollar’spredominance:
– the breadth, depth and liquidity of US fixedincome markets (and US financial marketsin general) compared with those of the euroarea and Japan (see Table 5);
– the fact that all the largest reserveaccumulators can be expected, at least forthe time being, to continue to use the USdollar as a vehicle for intervention, eitherprimarily or exclusively;
– the increasing use of derivatives by centralbank portfolio managers, which allows formore flexibility than in the past (e.g. byinvesting in one currency while shoulderingthe interest rate risk in a different market, forinstance by using foreign exchange swaps).
The trends in instrument and currencydiversification described above are confirmedby the evidence on investment of foreignreserves in US assets, for which more datais available. While comprehensive stock
1999 2000 2001 2002 2003 2004 2005 1)
All countries 2)
US dollar 71.0 70.5 70.7 66.5 65.8 66.0 66.4Euro 17.9 18.8 19.8 24.2 25.3 24.9 24.3Japanese yen 6.4 6.3 5.2 4.5 4.1 3.8 3.7Pound sterling 2.9 2.8 2.7 2.9 2.6 3.2 3.6Swiss franc 0.2 0.3 0.3 0.4 0.2 0.2 0.1Other currencies 1.6 1.4 1.2 1.4 1.9 1.9 1.9
Table 4 Off ic ia l foreign exchange reserves: currency shares
(as a percentage of total identified holdings; end-of-year values expressed in US dollars)
Source: IMF.1) End-of-September data.2) Shares are calculated only for the group of countries reporting reserve currency composition to the IMF, which account for around70% of world reserve holdings.
15 These shares, however, are calculated only for the group ofcountries reporting reserve currency composition to the IMF,which account for around 70% of world reserve holdings.This group does not include some of the major reserveaccumulators.

20ECBOccasional Paper No. 43February 2006
statistics covering all types of instrument arenot available, data are made public on holdingsof marketable US Treasury bonds, notes andbills held by foreign official institutions, whichamounted to almost USD 1,230 billion (nearly60% of total foreign holdings of US Treasurysecurities, or 32.5% of the total amountoutstanding) at end-September 2005.
Turning to flow data, it is interesting to look atthe available evidence for 2004 and draw someinitial inferences from the, as yet incomplete,2005 statistics. In 2004 foreign officialinstitutions are estimated to have purchased USgovernment-linked assets (including federalagency bonds) amounting to over USD 254billion, whereas investment in corporate bondsand equities amounted to only USD 13 billion.Reserve accumulation resulted in significantlylarger US dollar positions of foreign centralbanks in the United States in the same year.Four types of investment can be distinguishedaccording to aggregate data disclosed by theUS Treasury, anecdotal information and datadisclosed by individual central banks, such asthe Bank of Japan:
– First, in 2004 a large part of foreignexchange reserves was invested in US
Treasury securities, including T-bills.Foreign official institutions are estimated tohave purchased US Treasury notes andbonds with a net face value of USD 201billion16, amounting to 70% of the total netissuance of US Treasury notes and bondsduring this period. Total US Treasurysecurities purchases – including bills –amounted to around USD 234 billion,representing almost two-thirds of the netissuance of these securities.
– Second, foreign official investors alsopurchased federal agency bonds bearinghigh yields. According to the Treasury, thestock of these bonds held by foreignersincreased by USD 20 billion in 200417.
Table 5 Nominal value of outstanding bonds at the end of 2003
(USD billions)
Source: Merrill Lynch (Size & Structure of the World Bond Market: 2004).1) Includes mortgage securities and municipals in the US and municipals, government guaranteed and private placement in Japan.2) In the euro area, covered bonds are included in the corporate category. Exchange rate = JPY 107.116/USD; EUR 0.7936/USD.
Total government (sovereign and quasi-sovereign) issues
government agencies other 1)
Total % World % of % of % of % ofYear 2003 outstanding bond mkt Total total Total total Total total Total total
US 21,351 47.6 10,405 48.7 2,646 12.4 2,608 12.2 5,151 24.1Japan 7,164 16.0 5,838 81.5 4,631 64.7 - - 1,206 16.8Euro area 2) 10,306 23.0 4,639 44.8 4,639 44.8 - - -
Total corporate Total foreign Total eurobond
% of % of % ofYear 2003 Total total Total total Total total
US 6,456 30 385 2 4,106 19Japan 837 12 57 1 432 6Euro area 2) 3,998 43.3 1,669 11.9
16 Estimate based on the US Treasury’s international capitalreport (TIC).
17 According to Federal Reserve System data, the proportion ofUS federal agency bonds held in custody for foreign off icialinstitutions by the US Federal Reserve System shows anupward trend over the last few years, reaching around 20% oftotal foreign off icial institutions’ custody holdings in 2004compared with around 12% in 2000. These data, however, arenot consistent with those of the US Treasury as there is asignif icant discrepancy between TIC system (Treasury) andStatistical Release H.4.1 (Federal Reserve) data in thisrespect. According to the latter, the 2004 increase in federalagency securities held by foreign off icial investors was muchlarger (i.e. USD 60 billion).

21ECB
Occasional Paper No. 43February 2006
4 MAIN TRENDSIN CENTRAL BANK
RESERVEMANAGEMENT
– Third, a significant part of reserves was alsoheld in time deposits – especially in theperiods immediately following large foreigncurrency purchases in the context ofintervention activity. Information on thisthird component is available only for Japan,which, at the end of 2004, held 15% of itstotal foreign exchange reserves in timedeposits.
– Fourth, only a minor part of reserves wasinvested in corporate bonds and equities. In2004, these purchases amounted to USD 13billion, and were mainly purchases of UScorporate bonds. It is, however, likely thatthe relative importance of these instrumentswill grow over time. For instance, the Bankof Korea highlighted this trend in a reportsubmitted to the Korean NationalAssembly’s Finance and EconomyCommittee on 24 February 2005.
Chart 4, which is based on US Treasury data,compares the total amount of US governmentand agencies’ longer-term securities with theamount of T-bills, corporate bonds and equitiespurchased by foreign official institutions. TheUS Treasury, however, does not report data onofficial investment in US time deposits.
Preliminary data for 2005 point, on the whole,to a significant decrease in the share of foreignofficial institutions in the financing of the UScurrent account deficit by comparison with2004 (down to less than one-third from aroundtwo-thirds, on a net basis). Some substitutionof private for public investors is thereforelikely to have occurred. A further explanationmay, however, be that during 2005 oilexporters have been replacing the Asiancountries as the group of countries with thelargest current account surplus. Their ensuingaccumulation of foreign assets is, however,unlikely to have taken the form of traditionalreserve accumulation for the most part, butwould rather have been a build-up of assetsabroad by state-owned oil funds. As Chart 5illustrates, this may have been reflected in adramatic increase in the net portfolio outflows
of oil-exporting countries18, which is notrecorded as reserve accumulation but nor is itprivate investment. The importance of thisdevelopment argues greater transparency instatistics on portfolio investment by oil funds.Moreover, apart from the aggregateinformation discussed above, the exactamounts of individual central banks’ reserveholdings denominated in US dollars andinvested in the United States is not known dueto the US Treasury’s duty of confidentiality inits reporting, which is largely derived fromcustodians-based information.
Regarding investment in euro-denominatedinstruments, the data available are much lesscomprehensive than those from the UnitedStates, which limits the scope of the analysis.The Eurosystem is in fact only able to trackbetween 15% and 30% of foreign reserveinvestment in euro-denominated assets. Whileit can be inferred that official holdings offoreign reserve assets denominated in euro,which amount to approximately USD 740billion, are, to a large extent, held in German
Chart 4 Net purchases of US Treasury securities,federal agency bonds, corporate bonds andequities by foreign official institutions(2000-2004;USD billions)
Sources: US Treasury and ECB staff estimates for USTreasury bills.
0
50
100
150
200
250
0
50
100
150
200
250
2000 2001 2002 2003 2004
US Treasury and federal agency bondsUS Treasury billsUS corporate bonds and equities
18 In Chart 5 the oil exporters include Saudi Arabia, Russia,Norway, Iran, Algeria, the United Arab Emirates, Venezuela,Nigeria, Kuwait, Mexico, Libya and Qatar (selected andranked on the basis of the size of their 2005 oil balancesurpluses expressed in US dollars).

22ECBOccasional Paper No. 43February 2006
and French long-term securities, noconclusions can be drawn as regards thegeographical distribution of the central banksand other institutions holding euro-denominated foreign reserve assets.
5 ALTERNATIVE USES OF ACCUMULATEDFOREIGN ASSETS
An important development in recent years hasbeen the increasing use of part of the foreignassets accumulated by the public sector foralternative purposes, such as theaforementioned creation of oil funds in severalcountries, the recapitalisation of state-ownedbanks in China, the repayment of external debtin Russia, and the funding of investment inTaiwan. The IMF does not, of course, countsuch “innovative” uses of foreign assets asreserves since they are not related to foreignexchange policy targets19.
The main rationale for setting up oil funds inrecent years is that oil prices are highly volatileand unpredictable. Hence, revenues oftendiffer greatly from budget projections,requiring either fiscal adjustment or publicfinancing for any shortfalls. As a result, notonly have several oil-exporting countries
established such funds (e.g. Russia, Norway,Venezuela, Kuwait and Oman), but other oilexporters are also considering doing so. Oilfunds can be classified into two categories:while the majority are designed to address theaforementioned problems created by thevolatility and unpredictability of oil revenues(stabilisation funds), some are also used to savepart of the oil revenues for future generations(savings funds). Some funds have bothobjectives. In the case of stabilisation funds,when oil prices are high a portion of therevenue is channelled from the governmentbudget to the stabilisation fund; when oilrevenues are low, the fund makes up theshortfall. There is some debate about theeffectiveness of these funds in stabilisinggovernment spending. Empirical research fromthe IMF on past experience with oilstabilisation funds suggests that, except inNorway, oil funds did not significantly affectthe relationship between oil export earningsand government expenditure. The policyimplication is that an oil stabilisation fund canbe no substitute for sound, medium-term-oriented fiscal policies20.
In early January 2004 China’s central bankannounced that it had injected USD 45 billionfrom the country’s foreign exchange reservesinto the Bank of China and the ConstructionBank of China to increase their capital base. In2005, a similar injection, though for the loweramount of USD 15 billion, was carried out forthe Industrial and Commercial Bank of China.In the former case, the two state-owned banks –which are considered to be the flagships of thebank reform process – had already started toraise their capital adequacy ratios throughvarious subordinate bond issues in 2003. It isimportant to note that the transfer of foreignexchange assets was not converted into
Chart 5 Oi l exporters’ net f inancial outf lows
(USD billions; positive sign means net outflows)
Sources: IMF WEO and ECB staff calculations.
-100
0
100
200
300
400
500
-100
0
100
200
300
400
500
1998 1999 2000 2001 2002 2003 2004 2005
otherportfolioreservesFDIfinancial outflow
19 The same applies to the heritage funds discussed inSection 4.
20 However, it should be noted that in Russia foreign assetsamounting to USD 15 billion held in an oil stabilisation fundhave been used to repay Soviet-era debt ahead of schedule.The agreement between Russia and the Paris Club wasreached in May 2005 and marks the biggest ever buy-back ofParis Club debt by any debtor country.
23ECB
Occasional Paper No. 43February 2006
6 IMPACTON YIELDSAND ASSET
PRICES
domestic currency and, therefore, exerted nopressure on the value of the renminbi. Thegovernment also retained control over themanagement of these transferred assetsthrough a newly created investment companyrun jointly by the central bank, the ministry offinance and the State Administration forForeign Exchange. Even so, the move wasunprecedented, as in the past the government’sstrategy for restructuring state-ownedcommercial banks had relied on increasing itsliabilities rather than transferring its assets.Since high non-performing loan ratios werehindering the banks’ efforts to raise theircapital adequacy ratios, this capital injectionmade it easier for them to reach the 8% capitalratio target. However, it exposed the banks’capital base to currency risks, since the capitalinjection was denominated in US dollars.
Finally, in Taiwan USD 15 billion has beenallocated to banks for use in major investmentprojects to foster domestic growth.
The effects of these innovative ways of usingforeign assets are still to be fully appreciated,as, depending on the origin of the foreign assetsand the objectives pursued, they createunprecedented bridge from monetary andexchange rate policy to fiscal policy, from themacroeconomic to the micro-prudentialdimensions of economic policy, and fromcentral bank management of foreign exchangemarket risks to management of portfolioinstruments outside the realm of foreignreserve assets by other entities. At the sametime, converting short-term monetary orfinancial assets into long-term wealth holdings– possibly including non-financial assets – mayprovide certain countries with a meaningfulvehicle for diversifying their risk exposure toUS dollar assets in a gradual and orderly way.
6 IMPACT ON YIELDS AND ASSET PRICES
A majority of market participants, academicsand policy-makers believe that reserveaccumulation may have contributed toabnormally low yields in mature economies.
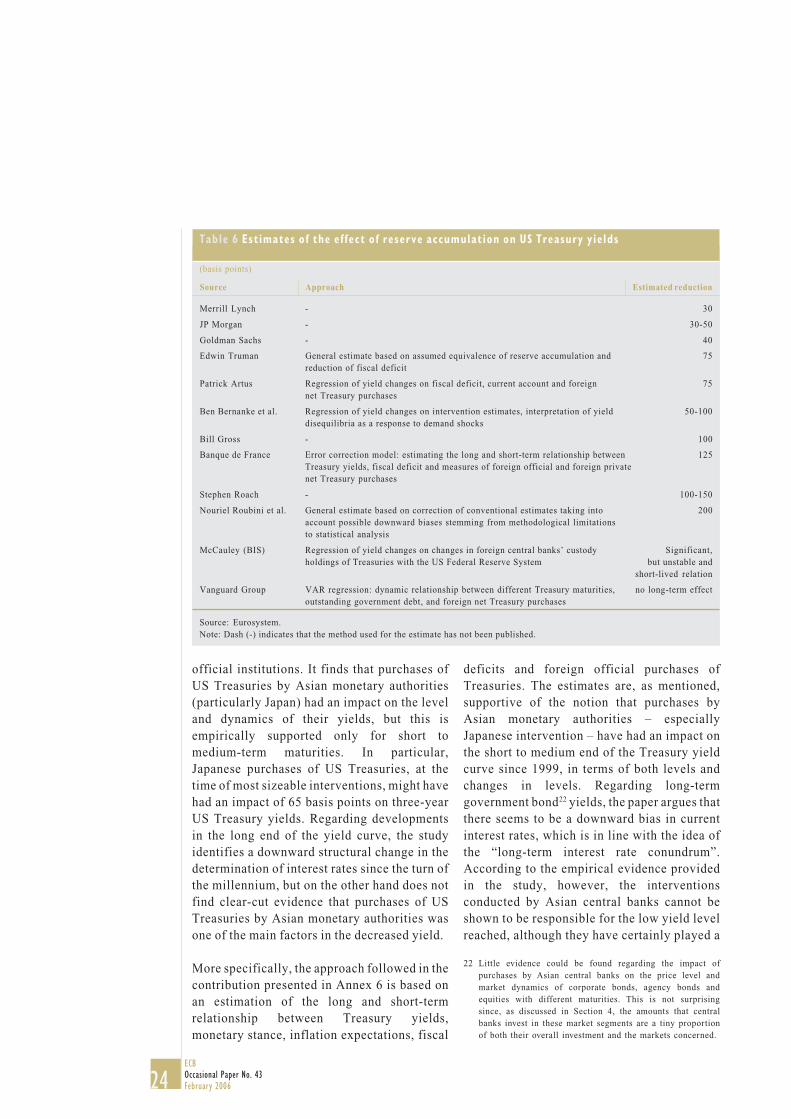
From a qualitative viewpoint, given the sheersize of foreign reserves transactions, theirconcentration in the US Treasury market andtheir relative price insensitivity, there arereasons to believe that reserve accumulationhas contributed to lowering US long-terminterest rates. However, the supportingempirical evidence is not clear-cut. Estimatesrange, as shown in Table 6, from 30 basis points(Merrill Lynch and JP Morgan) to 200 basispoints (N. Roubini), though admittedlyestimates in the high part of the range lackempirical support and are mainly based on thejudgement of experts. One well-knowncontribution is that of Bernanke, Reinhart andSack of the US Federal Reserve System, whofind evidence that Japan’s interventionsbetween 2000 and the first quarter of 2004 had asignificant impact on the yields of Treasurynotes and bonds21, while there is no suchevidence for Treasury bills.
Despite the abundant literature, the lack of highquality data on foreign official institutions’ netpurchases makes the empirical evidencesupporting the link between interventions andUS yields not particularly robust. In thiscontext, views denying any effect have alsobeen put forward. According to an analysis bythe Vanguard Group, cessation of Chinese netpurchases of US government bonds would havevirtually no effect on any of the US Treasury’syields. B. McCauley (2004) identifies only anunstable relationship between foreign officialinstitutions’ net purchases of US governmentbonds and Treasury yields, existing for verylimited periods (i.e. a few weeks).Furthermore, the US Federal Reserve System’sweekly release on foreign official institutions’custody holdings is found to have no effect onTreasury market rates.
A study presented in Annex 6 provides aneconometric quantification of the impact ofpurchases of US Treasury securities by foreign
21 See Bernanke, B., Reinhart V. and Sack, B. (2004):“Monetary Policy Alternatives at the Zero Bound: AnEmpirical Assessment”, Finance and Economics DiscussionSeries, Federal Reserve Board.
24ECBOccasional Paper No. 43February 2006
official institutions. It finds that purchases ofUS Treasuries by Asian monetary authorities(particularly Japan) had an impact on the leveland dynamics of their yields, but this isempirically supported only for short tomedium-term maturities. In particular,Japanese purchases of US Treasuries, at thetime of most sizeable interventions, might havehad an impact of 65 basis points on three-yearUS Treasury yields. Regarding developmentsin the long end of the yield curve, the studyidentifies a downward structural change in thedetermination of interest rates since the turn ofthe millennium, but on the other hand does notfind clear-cut evidence that purchases of USTreasuries by Asian monetary authorities wasone of the main factors in the decreased yield.
More specifically, the approach followed in thecontribution presented in Annex 6 is based onan estimation of the long and short-termrelationship between Treasury yields,monetary stance, inflation expectations, fiscal
deficits and foreign official purchases ofTreasuries. The estimates are, as mentioned,supportive of the notion that purchases byAsian monetary authorities – especiallyJapanese intervention – have had an impact onthe short to medium end of the Treasury yieldcurve since 1999, in terms of both levels andchanges in levels. Regarding long-termgovernment bond22 yields, the paper argues thatthere seems to be a downward bias in currentinterest rates, which is in line with the idea ofthe “long-term interest rate conundrum”.According to the empirical evidence providedin the study, however, the interventionsconducted by Asian central banks cannot beshown to be responsible for the low yield levelreached, although they have certainly played a
22 Little evidence could be found regarding the impact ofpurchases by Asian central banks on the price level andmarket dynamics of corporate bonds, agency bonds andequities with different maturities. This is not surprisingsince, as discussed in Section 4, the amounts that centralbanks invest in these market segments are a tiny proportionof both their overall investment and the markets concerned.
Source Approach Estimated reduction
Merrill Lynch - 30
JP Morgan - 30-50
Goldman Sachs - 40
Edwin Truman General estimate based on assumed equivalence of reserve accumulation and 75reduction of fiscal deficit
Patrick Artus Regression of yield changes on fiscal deficit, current account and foreign 75net Treasury purchases
Ben Bernanke et al. Regression of yield changes on intervention estimates, interpretation of yield 50-100disequilibria as a response to demand shocks
Bill Gross - 100
Banque de France Error correction model: estimating the long and short-term relationship between 125Treasury yields, fiscal deficit and measures of foreign official and foreign privatenet Treasury purchases
Stephen Roach - 100-150
Nouriel Roubini et al. General estimate based on correction of conventional estimates taking into 200account possible downward biases stemming from methodological limitationsto statistical analysis
McCauley (BIS) Regression of yield changes on changes in foreign central banks’ custody Significant,holdings of Treasuries with the US Federal Reserve System but unstable and
short-lived relation
Vanguard Group VAR regression: dynamic relationship between different Treasury maturities, no long-term effectoutstanding government debt, and foreign net Treasury purchases
Table 6 Est imates of the ef fect of reserve accumulation on US Treasury yie lds
(basis points)
Source: Eurosystem.Note: Dash (-) indicates that the method used for the estimate has not been published.

25ECB
Occasional Paper No. 43February 2006
6 IMPACTON YIELDSAND ASSET
PRICES
role in explaining shorter-term dynamics. Overa longer-term horizon, the paper identifies, inline with the literature, a fundamental changein the behaviour of US bond yields since theturn of the millennium. In this regard, it shouldbe born in mind that in recent years the largecentral bank purchases of US Treasuriesoccurred at the same time as demand frompension funds and life insurance companieswas increasing.

26ECBOccasional Paper No. 43February 2006
ANNEX 1STYLISED FACTS OF THE ACCUMULATION OFFOREIGN EXCHANGE RESERVES1
1 INDIVIDUAL COUNTRIES AND REGIONS
On a global scale, foreign exchange reserveshave risen sharply during the last decade, withthe build-up accelerating until 2004 and mostof the increase occurring in emerging marketeconomies. Foreign exchange reserves rosefrom USD 1.2 trillion in January 1995 to USD4.0 trillion in September 2005.2 The share ofsuch reserves held by Asian countries relativeto the world total increased from 45% inJanuary 1995 to 67% in August 2005.Conversely, the share of the Latin Americancountries as a group decreased from 8% inJanuary 1995 to 5% in August 2005.
Looking at the amounts outstanding, eightAsian economies are among the ten largestreserve holders: Japan, the People’s Republicof China, the Taiwan Province of China, Korea,India, Hong Kong SAR, Singapore andMalaysia (Chart 6).
A N N E X E SSingapore has the highest percentage ofreserves to GDP (104.4%), followed by Taiwan(78.2%), Hong Kong (75.1%) and Malaysia(55.5%). Japan is the world’s largest reserveholder and also the only industrial economywithin the top ten reserve-holding economiesto have actively increased its reserve holdingsuntil recently (March 2004). The Japaneseauthorities purchased a total of USD 177billion in 2003 and USD 138 billion in the firstquarter of 2004. The People’s Republic ofChina has also been, and still is, increasing itsreserves considerably. In December 2005reserves stood at USD 818 billion (equivalentto 36% of Chinese GDP). Specifically, since2003 China’s reserve accumulation has alsobeen associated with non-foreign directinvestment (FDI) in the form of private capitalinflows as international investors have beenexpecting a revaluation of the Chinesecurrency. In 2004 FDI inflows and the tradesurplus together accounted for only 55% of theincrease in reserves (compared with 78% in2003 and 125% in 2002), but this share roseagain in 2005 (75%).
Oil-exporting countries in Africa and theMiddle East also increased their stocks ofreserves in keeping with the oil price rise. InAfrica reserves increased from USD 39 billionat the end of January 1995 to USD 147 billion atthe end of June 2005. The largest reserve holderin Africa is Algeria, while other importantreserve holders include Libya, Nigeria,Morocco, Egypt and South Africa. During thesame period, foreign exchange reserves in theMiddle East rose from USD 33 billion to USD92 billion3. However, it is likely that theamount of foreign exchange reserve holdings inOPEC member countries is underestimated, asseveral oil-exporting countries channel part of
Chart 6 Top 10 reserve-accumulatingcountries : 1995-2005
(in USD trillions)
Source: IMF.
0
0.5
1
1.5
2
2.5
3
0
0.5
1
1.5
2
2.5
3
JapanChinaTaiwanKoreaRussia
IndiaHong KongSingapureMalaysiaMexico
Jan.1995
Apr.1996
July1997
Oct.1998
Jan.2000
Apr.2001
July2002
Oct.2003
Jan.2005
1 Prepared by F. Comelli (European Central Bank), with inputsfrom J. Routava (Suomen Pankki – Finlands Bank).
2 As reported by the IMF in its latest update of the databaseon Currency Composition of Off icial Foreign ExchangeReserves.
3 The Middle East region includes the following countries:Israel, Saudi Arabia, Kuwait, the United Arab Emirates,Oman, Qatar, Bahrain, Yemen, Jordan and Lebanon. Foreignexchange reserves holdings for Iran and Iraq are notavailable.

27ECB
Occasional Paper No. 43February 2006
ANNEX 1
their oil revenues into oil funds (see nextsection) without reporting these funds to theIMF. In addition, according to the Bank forInternational Settlements (2005a) the increasein total financial outflows from OPEC membercountries, which was triggered by rising oilrevenues, is not fully reflected in availablecounterparty data.4 There are several possibleexplanations for the current large gap betweenrising outflows from OPEC member countriesand counterparty data. First, the availablecounterparty data do not capture offshorepurchases of securities. For example, theestimate of OPEC’s cumulative net purchasesof US securities based on the data from the USTreasury International Capital (TIC) systemwould tend to underestimate the total by anamount equivalent to purchases of thesesecurities in London or other financial centresoutside the United States. Second, cross-borderinvestment in regional stock and bond marketsis likely to have become a more importantoutlet for petrodollars than before. Manycountries in the Middle East are, experiencingan economic boom; the stock market indices inSaudi Arabia, Kuwait and the United ArabEmirates more than quadrupled between theend of 2001 and the end of June 2005. Finally,there is some evidence that petrodollars arebeing invested more broadly – more diversifiedgeographically and across the asset spectrum –than they once were. For instance, hedge fundsand private equity funds, which haveexperienced large inflows worldwide in recentyears but which are not required to releaseinformation on the positions of their investorbase, are one possible home for theseinvestments.
In Russia, the devaluation of the rouble in 1998and rising commodity prices led to currentaccount surpluses, reaching 10% of GDP in2004. Previously, significant outflowshindered the growth of reserves, but in 2003-2004 rising oil revenues and more balancedcapital flows led to a considerableaccumulation of reserve assets. In LatinAmerica, finally, reserves rose from USD 95billion (January 1995) to USD 239 billion
(August 2005). Mexico and Brazil are the twolargest reserve holders in the region.
2 RESERVES CHANNELLED INTO OIL ANDHERITAGE FUNDS
In some countries, part of the foreign currency-denominated oil revenues is invested directlyin foreign assets without the need forintervention and sterilisation by central banks.Specifically, some oil-exporting countrieshave established oil funds in order to smoothfiscal revenues. Since oil prices and revenuesare highly volatile and unpredictable, actualfiscal revenues in oil exporting countries oftendiffer greatly from budget projections,meaning that, in the case of shortfalls, eitherfiscal adjustment or financing is required. Oilfunds can be classified in one of two categories:stabilisation funds, designed to address theproblems created by the volatility of oilrevenues, and savings funds, established tosave part of the oil revenues for futuregenerations. In the case of stabilisation funds,when oil prices are high a portion of oilrevenues is channelled from the governmentbudget to the stabilisation fund. Conversely,when oil revenues are low the stabilisation fundfinances the oil revenue shortfall. In thiscontext, a debate has developed about theeffectiveness of stabilisation funds insmoothing government spending.
In Norway the authorities established theGovernment Petroleum Fund (GPF) in 1990.The GPF, formally a government account at thecentral bank, receives most of the petroleumrevenue and invests it in foreign financialassets. It can, therefore, insulate the budgetfrom changes in petroleum income andpreserve the assets for use by futuregenerations (Skancke, 2003). One such use is tofinance the increase in old-age pensions, and in2005 the Norwegian government proposed thatthe GPF be formally linked to old-agepensions. No transfers to the GPF took placeuntil 1995 because of low net oil income and
4 See the BIS Quarterly Review, December 2005.

28ECBOccasional Paper No. 43February 2006
large oil-related expenditures. Since then,however, the assets of the GPF have increasedrapidly, as oil production and prices havepicked up and the government’s oil-relatedinvestment has declined. At the beginning of2005 the market value of the GPF was 78% ofmainland GDP. The 2005 budget projects thatthe market value of the fund could reach 128%of mainland GDP in 2010. In 2001 (effectivefor the 2002 budget) the policy of savingpetroleum revenue for the future was formallyadded to the fiscal guidelines. Within theseguidelines, the key rule sets the non-oil centralgovernment structural deficit to the same levelas the long-run real return on the GPF, assumedto be 4%. The guidelines allow temporarydeviations from the rule over the business cycleand in the event of extraordinary changes in thevalue of the GPF. The guidelines were meant toserve a number of purposes, namely to preservethe capital of the GPF for future generations,ensure that some petroleum revenue is spentnow, and insulate the budget against sharpchanges in petroleum revenues.
In Russia the authorities established theRussian Oil Stabilisation Fund (ROSF) tomanage the increasing volume of oil revenuesin February 2004. The Central Bank of Russiamanages the ROSF and may invest the fund’sresources in both cash and securities. Abeneficial side effect is that investment in theROSF helps to curb excessive money supplygrowth and to control inflation. Finally, someoil-producing countries in the Persian Gulfregion, such as Kuwait, have also establishedoil stabilisation funds. However, the largestoil-producer, Saudi Arabia, has so far refrainedfrom doing so.
Some economies with large reserve holdingshave set up heritage funds. These funds managereserves in order to achieve higher long-termreturns than central banks and to preserve thevalue of reserves for future generations.However, heritage funds can also have short-term objectives in terms of fostering activity indomestic financial centres. In addition theyoften serve as a second line of defence when
intervention is required in the context of acurrency crisis. Recent country experiencesinclude the Government of SingaporeInvestment Corporation and the KoreanInvestment Corporation.
ANNEX 2MAIN DRIVERS OF RESERVE ACCUMULATION:A REVIEW OF THE LITERATURE5
1 BACKGROUND
In past years the accumulation of internationalreserves has shown rather unusual patterns, asdescribed earlier in this paper. In particular,traditional indicators for “reserve adequacy”indicate that the stock of international reservesis substantially in excess in a number ofemerging markets, notably in Asia. This raisesthe possibility that other factors might bedriving the rapid accumulation of foreignreserves.
Consequently, considerable attention has beenfocused on the extent to which thisdevelopment can continue. In order to evaluatethe sustainability of the factors behind reserveaccumulation, this annex evaluates the maindrivers for emerging markets to accumulatereserves (i.e. to have an exchange rate target,ranging from just smoothing out volatility tomore formal objectives). We broadlydistinguish the following issues: first,international reserves are essential in copingwith often volatile capital flows. In such cases,higher uncertainty implies a higher optimallevel of reserves. Second, internationaldevelopments (such as financial globalisation)or country-specific factors (such asdemographic issues or temporarily higherrevenues, e.g. from oil exports) can contributeto the build-up. However, these factors are notsufficient to explain the build-up: as long as
5 Prepared by P. Maier (De Nederlandsche Bank). Informationon reserve adequacy has been provided by F. Comelli(European Central Bank). Helpful input from the DNB’sFinancial Stability Division, P. Cavelaars, M. Admiraal, andother ESCB colleagues is gratefully acknowledged.

29ECB
Occasional Paper No. 43February 2006
ANNEX 2
currencies are freely floating, sustainedaccumulation of foreign reserves (i.e. beyond acertain minimum level) is unnecessary andpotentially costly. Hence, there are strongindications that where the accumulation offoreign reserves occurs very rapidly and thestock of reserves is very high, it might result inexchange rates being managed. For instance,if countries keep their exchange ratesundervalued as part of an export-led growthstrategy, accumulation of foreign reserves willcontinue until the exchange rate is in line withthat required by economic fundamentals.
In particular with regard to policy choices, it isimportant to realise that clear differences mayexist between the objectives of private andpublic sector investors. For private investors,the objective is to maximise expected returnsrelative to perceived risk. In contrast, centralbanks buy and sell foreign assets for policyreasons that might go beyond trying tomaximise risk-adjusted returns.6
Acknowledging the distinct differencebetween private and public sector investors isessential, in that the medium and long-termsustainability of a certain policy is notnecessarily impaired if it is economically notfully optimal. For instance, central banks mightbe willing to increase their foreign dollarreserves for political reasons, even if purelyeconomic reasoning calls for a slower reserveaccumulation, e.g. if the value of the reservecurrency comes under pressure.
In the following sections we examine first theextent to which current reserve holdings can beexplained by “insurance” considerations(Section 2). Section 3 examines the impact offinancial globalisation. Section 3 discussespolicy choices, notably management of theexchange rate as a means to boost exports. Thelast section discusses the main findings andprovides a brief review of the costs associatedwith the build-up of international reserves.
2 PRECAUTIONARY MOTIVES
INSURANCE AGAINST CURRENCY DEPRECIATIONOne of the traditional motives for central banksto accumulate international reserves is thatthey need foreign currency to weather potentialturbulence on currency markets. In the face of adeficit in the balance of payments, countrieshave various options (use of one or more ofthese policies is not mutually exclusive): first,they can engage in expenditure-switchingpolicies, such as accepting a lower exchangerate or imposing tariffs or import quotas.Second, they can impose expenditure-reducingpolicies, effectively reducing economicgrowth. Third, they can engage in policies tostimulate exports. And last, they can finance itby losing reserves to smooth out short-runpayment imbalances.7
Turbulence on currency markets occurs whenprivate capital flows suddenly threaten to bringunwelcome changes in the country’s exchangerate. When private capital outflows threaten toweaken the currency, the central bank can sellreserves and buy domestic assets. Whenspeculators are suddenly putting upwardpressure on the currency by buying domesticcurrency assets, the central bank can attempt tocontain that pressure by selling domesticcurrency and accumulating foreign reserves.
The typical example is that foreign investorssuddenly fear that a currency is overvalued andrush to convert domestic currency assets intodollars or other reserve currencies. The attemptto satisfy this demand can sharply reduce thecentral bank’s reserve holdings (effectivelyredoubling investor incentives to buy foreignassets before the domestic currency weakens).Larger amounts of international reserves can
6 Central banks may also take “traditional” investmentconsiderations into account when managing their reserveportfolio. The larger the reserve holdings, the more reservemanagers are distinguishing between a liquidity portfolio(designed to offset exchange rate pressures) and aninvestment portfolio. According to a recent study, fourteen oftwenty central banks surveyed now rely on private fundmanagers to allocate at least some of their reserve holdings(International Monetary Fund, 2004).
7 See also Bahmani-Oskooee and Brown (2002).

30ECBOccasional Paper No. 43February 2006
imply that countries can avoid costlyliquidation of assets and can serve as a publicdemonstration of a commitment to exchangerate stability. Moreover, just when an emergingmarket most needs reserves – in a crisis – it canbe shut out of the international capital marketsbecause of sovereign risk concerns.Additionally, countries may wish to reducetheir dependency on institutions such as theIMF, if they “do not regard conditionalborrowing rights at the IMF and ownedreserves as perfect substitutes” (Crockett,1978).
A related problem in this context is that netcapital inflows to developing countries arelargely due to external factors that they cannotinfluence (such as reductions in world interestrates). Although it is not alwaysstraightforward to disentangle “push” from“pull” factors as determinants for capital flows,the literature suggests that domestic factors –such as country-specific productivity shocks ordomestic demand shocks – are relatively lessimportant (Kim, 2000), though this feature islikely to have abated in recent years. Countriesmight thus suddenly experience capital inflowsor outflows without adequate domestic policiesto deal with them.
Holding foreign reserves as self-insuranceagainst a currency crisis is especially importantif a currency is overvalued. Mexico, Korea andRussia, for example, all share relatively recentexperiences with destabilising runs on theircurrency during a financial crisis. Against thisbackdrop, it should not come as a surprise thatthese countries might attach a high value to theprotection derived from large accumulation offoreign reserves. This argument is lessrelevant, however, for undervalued currenciessuch as those in most Asian countries (althoughit is not always evident whether a currency isover or undervalued, as e.g. estimates of“equilibrium exchange rates” can differ vastlyacross models).
CAN PRECAUTIONARY MOTIVES FULLY EXPLAINRECENT RESERVE ACCUMULATION?Although reserves may be useful as a tool toavoid crises, there is a limit to the reservesneeded to prevent financial turbulence(particularly as holding large currency reservescan imply costs). Were reserve accumulationpurely driven by precautionary motives, itshould slow down once the “optimal” level ofreserves has been reached. However, this doesnot seem to be the case. The main indicator forgauging the adequacy of foreign exchangereserve assets is the ratio of foreign assets toshort-term external debt (de BeaufortWijnholds et al., 2001). This indicator – alsoknown as the Greenspan-Guidotti rule –reflects a country’s ability to service itsexisting short-term external debt (debtmaturing within one year) in the event of a
Chart 7 Ratio of reserves to short-termforeign debt
Source: BIS.
ChinaHong KongIndiaIndonesiaKorea
0
2
4
6
8
10
12
14
16
0
2
4
6
8
10
12
14
16
1996 1997 1998 1999 2000 2001 2002 2003 2004
MalaysiaPhilippinesSingaporeTaiwanThailand
0
2
4
6
8
10
12
14
16
0
2
4
6
8
10
12
14
16
19961995 1997 1998 1999 2000 2001 2002 2003 2004

31ECB
Occasional Paper No. 43February 2006
ANNEX 2
sharp deterioration in the external financingconditions. Typically, a country is consideredprudent if it holds foreign currency reserves inthe amount of its total external debt maturingwithin one year (Rodrik and Velasco, 1999 andGarcia Soto, 2004). Asian countries have alsobeen improving their positions in terms ofreserves to short-term debt since 1997, albeit todifferent degrees (see Chart 7). One can arguethat part of the accumulation of foreignreserves that occurred after the Asian currencycrisis was intended to bring the level ofreserves back to the optimal level. Currently,however, the reserves to short-term externaldebt ratios of all the Asian countries consideredare well above one – China, India and Taiwan,in particular, have very high ratios.8
While the ratio of short-term debt to foreignassets is the most popular indicator of reserveadequacy, it is not the only one. The followingratios can also be used:
– the ratio of international reserves to imports,which represents the number of months forwhich a country could support its currentlevel of imports if all other capital flowswere to stop. As a rule of thumb, countriesshould hold foreign reserve assets in order tocover their imports for three to four months.All Asian countries appear to be well abovethe threshold (see Chart 8), with the possibleexception of the Philippines where the ratiowas four at the end of 2004. In particular,according to the reserve to import indicatorfor Taiwan, if all capital inflows weresuddenly to stop, this country would be ableto finance nearly two years of imports withits existing stock of foreign exchangereserve assets.
– the ratio of reserves to broad money, whichreflects the potential for resident-basedcapital flight from the domestic currency. Ifthe ratio is very close to zero, broad moneylargely exceeds foreign exchange reserves.In the presence of an exchange rate peg, thehigher the increase in monetary aggregatesrelative to the stock of foreign reserve
assets, the higher the potential for capitalflight in the event of negative moneydemand shocks. This ratio has also increasedfor most Asian countries since the 1997financial crisis, albeit with considerablevariation at the country level (see Chart 9).
Hence, all three methods employed indicatethat international reserves might be in excess invarious Asian economies. More detailedeconometric analysis confirms this picture(Table 1 provides an overview of recentstudies): until about the late 1990s, reserveaccumulation in Asian emerging economiescould be explained by standard economic
Chart 8 Ratio of reserves to imports
Source: Deutsche Bank Research.
ChinaHong KongIndiaIndonesiaKorea
0
5
10
15
20
25
30
0
5
10
15
20
25
30
1990 1992 1994 1996 1998 2000 2002 2004
MalaysiaPhilippinesSingaporeTaiwanThailand
0
5
10
15
20
25
30
0
5
10
15
20
25
30
1990 1992 1994 1996 1998 2000 2002 2004
8 It should be stressed that the values of these indicatorsdepend on the database used. Using the IMF database yieldsdifferent values, but it still shows that the reserves to short-term external debt ratio is well above 1.

32ECBOccasional Paper No. 43February 2006
factors such as economic size and current andcapital account vulnerability. Since the Asiancrisis, models based on the standard economicexplanatory variables have underestimated thereserve holdings of several key Asiancountries. This unusual accumulation is a signthat factors other than purely precautionarymotives might play an important role.9
Taken altogether, the evidence suggests thatlimiting vulnerability has probably not beenthe primary motive for recent reserveaccumulation in most economies. It should benoted, however, that determining the “optimal”level of currency reserves is notstraightforward: in fact, it might also depend oninstitutional factors, such as the degree ofcapital mobility or financial liberalisation.Hence, the indicators presented above might, atleast to some degree, underestimate the optimallevel of foreign reserves, as the followingconsiderations show.
FINANCIAL GLOBALISATIONIn a narrow sense, the role of internationalreserves as a buffer to smooth shocks to thebalance of payments has not changed.However, the economic environment whereinemerging economies operate has undergonesubstantial transformation in recent decades:the capital account of emerging marketeconomies often displays high volatility, andcountries differ in their conduct of monetarypolicy and exchange rate policy. This canimpact on a country’s ability to deal withsudden capital inflows or outflows, and henceinfluence the desired stock of foreign reserves.In addition, the rapid pace of financialglobalisation provides countries with newpossibilities of diversifying risks or spreading
Chart 9 Ratio of reserves to broad money
Source: IMF.
Hong KongIndiaIndonesiaKoreaChina
1995 1996 1997 1998 1999 2000 2001 2002 2003 2004 2005
1.00
0.80
0.60
0.40
0.20
0.00
1.00
0.80
0.60
0.40
0.20
0.00
MalaysiaPhilippinesSingaporeTaiwanThailand
1995 1996 1997 1998 1999 2000 2001 2002 2003 2004 2005
1.00
0.80
0.60
0.40
0.20
0.00
1.00
0.80
0.60
0.40
0.20
0.00
Study Key findings
IMF (2003) Reserves in various Asian countries are currently in excess. A ratio of reserves toshort-term foreign debt much above one does not further reduce the risk of a crisis.
Aizenman & Marion (2003) Reserve holdings in the period 1980–1996 can be explained by “traditional factors”,but have been significantly underestimated since the Asian crisis.
Bahmani-Oskooee & Brown (2004) The demand for international reserves may be difficult to estimate correctly as itexperiences structural instability (in particular in the face of shocks).
Table 1 Are international reserves in Asian countries excess ive? Econometric evidence
9 While reserve accumulation in Asia might over time havebecome disproportionate to the actual threat faced by certaincountries, this does not seem to be the case in most LatinAmerican emerging market debtor economies. Given theirnature as “original sinners”, these countries are unable toborrow in domestic currency and, as such, have a particularincentive to accumulate reserves to self-insure against futureloss of access to international capital markets.

33ECB
Occasional Paper No. 43February 2006
ANNEX 2
savings geographically in ways that were notpossible several decades ago. And lastly, otherfactors can (structurally) exert downwardpressure on a country’s exchange rate, e.g.demographic developments.
CAPITAL MOBILITY AND FINANCIALLIBERALISATIONWhen estimating a country’s demand forforeign reserves, empirical studies search forvariables other than the reserves to short-termdebt ratio, which can reduce the probability of acurrency crisis. Good macroeconomicfundamentals are an important and necessarycondition for avoiding currency crises, albeitan insufficient one. As economies that are moreopen to trade are relatively more vulnerable,empirical studies such as Lane and Burke(2001) or Edwards (2004) generally find thattrade openness is a very important variable inexplaining cross-country variation at the levelof international reserves. Moreover, there is alink between a country’s financial system andcapital mobility on the one hand and the build-up of foreign reserves on the other. High capitalmobility can be a cause of current accountinstability (Wong and Carranza, 1999), andwith greater financial integration governmentsaccumulate more international reserves (Modyand Murshid, 2005). One explanation is thatopening the capital account while maintainingan inflexible exchange rate regime can be aprecursor to a crisis, as e.g. the “tequila crisis”of 1995 or the Asian/Russian crises of 1997/98have shown.10
The link between financial deregulation andthe capital account on the one hand and(speculative) currency inflows on the other hasbeen recognised since the Asian crisis (Kawai1998). In Thailand, for instance, thecombination of de facto fixed exchange ratesand high interest rates generated excessivecapital inflows. This led to too much liquiditychasing bad investments. The build-up ofshort-term, unhedged debt left East Asianeconomies vulnerable to a sudden collapse ofconfidence. Rapid capital outflows and theconsequent depreciation of currencies
exacerbated the strains on private sectorbalance sheets.
3 THE “GLOBAL SAVINGS GLUT”
Recent empirical evidence points to anincreasing erosion of the home bias in savings(International Monetary Fund 2005b). In aclosed economy, investment equals saving ineach period; but in a world of financialglobalisation, countries have more amplepossibilities to smooth consumption over timeor to finance investment in the face ofinsufficient domestic savings. Hence, as savingcan cross international borders, a country’sdomestic investment and domestic saving neednot be equal in each period.
In the view of Bernanke (2005), recenteconomic and demographic developments inmany industrialised countries have contributedto a “global savings glut”. Declining birth ratesand an ageing population will result in apronounced increase in the proportion of theelderly to the active population in allindustrialised countries. In contrast, thepopulation structure in most developing Asiancountries is pyramidal, reflecting their youngerpopulation (to some extent China is anexception). Such differences in populationdevelopments will affect international capitalflows. First, everything else being equal (e.g.assuming stable monetary policy, etc.), thepopulation ageing in industrialised countries islikely to lead to an increase in savings by theyounger generation in the short to mediumterm. If these higher savings by the young arenot offset by dissaving on the part of theelderly, or if the proportion of elderly people inthe population is not above a certain threshold,a country’s saving rate is likely to increase.
10 Capital restrictions, however, are not likely to alter thepicture substantially. Glick and Hutchinson (2005) f ind thatrestrictions on capital flows do not effectively insulateeconomies from currency problems; rather, countries withless restrictive capital controls and more flexible exchangerate regimes appear to be less prone to speculative attacks.This holds even after controlling for macroeconomic,political and institutional characteristics that influence theprobability of a currency crisis.

34ECBOccasional Paper No. 43February 2006
Second, in industrialised countries the ageingpopulation (and the associated slowdown inlabour force growth) is likely to exertdownward pressure on the return to capital,relative to that of labour.
Lastly, it is worth noting that sudden changes inrevenues from oil exports can also influencesavings of oil-exporting countries. As oilrevenues are highly volatile and unpredictable,several oil exporters have set up funds tosmooth revenue flows over time or to save partof the oil revenues for future generations. Thisprovides an additional explanation as to whycountries such as Russia and Norway haveincreased their stock of international reserves.
4 MANAGEMENT OF EXCHANGE RATES
We have seen so far that emerging markets maywant to accumulate reserves to counterturbulence on currency markets and that theoptimal stock of reserves might actually berelatively high, given the increase in capitalmobility, the weaknesses of the domesticbanking system, etc. In addition, there arefactors such as demographic developments thatprovide additional explanations for existingcapital movements. That said, these lastfactors, as well as current account surpluses, donot necessarily lead to a build-up of foreignreserves, provided that the exchange rate isfully flexible. In other words, the fact that theaccumulation of reserves has occurred over along period and has reached very high levels,and the speed with which those reserves werebuilt up, indicates that the exchange rates weremanaged, i.e. not floating freely.
KEEPING THE EXCHANGE RATE UNDERVALUEDVarious Asian countries ran sizeable currentaccount surpluses in the early 2000s, and manyalso received substantial net private capitalinflows. If regional central banks had not offsetthese foreign exchange inflows with officialoutflows – i.e. reserve purchases – Asiancurrencies would have strengthened.11 Dooleyet al. (2003) argue that various Asian countrieskeep their exchange rates deliberately
undervalued as part of a development strategy(the so-called “Bretton Woods II” system offixed exchange rates). By keeping theircurrency undervalued, emerging countriesdeliberately stimulate export growth, which inturn fosters economic growth (e.g. by buildingup a competitive domestic capital stock).Given that Asia trades mostly with the UnitedStates, the choice of the US dollar as theprimary reserve currency is not surprising.
This hypothesis has generated considerablecontroversy (see e.g. Roubini and Setser,2005). A fixed or relatively rigid exchange ratesystem can yield benefits in terms ofmacroeconomic stability, especially to low-income countries where financial marketdevelopment is limited and the capital marketclosed (Rogoff et al., 2004). Although mostauthors agree that various Asian countriesfollow policies to keep their currencyundervalued, much of the controversy is relatedto the question of whether this is optimal andwhether such policies can be sustained for aprolonged period. China, for example, has arural population of 200 million underemployedworkers yet to be absorbed into the modernsector. Eichengreen (2004) estimates thatChina can accomplish this at the rate of only10 million to 20 million a year.12 In his view,the possibility exists that China could attemptto stick to its strategy of export-led growth for adecade or more.
5 COSTS OF MANAGING EXCHANGE RATES,AND “SOCIALISATION” OF EXCHANGERATE RISK
In theory, central banks can deliberately(“structurally”) keep their currencyundervalued over a sustained period. However,
11 For economies pegged to the US dollar, reserve accumulationhas resulted automatically from the authorities’ pledge tobuy foreign currency as necessary to maintain the f ixed rate.How much stronger the currencies might have been withoutrecent large reserve purchases is unclear (Higgins andKlitgaard 2004).
12 In making these calculations, Eichengreen does not accountfor other possible sources of Chinese income growth (e.g.from favourable productivity developments), which may biashis estimates.

35ECB
Occasional Paper No. 43February 2006
ANNEX 2
it is far from clear whether such a strategy iseconomically optimal over the medium andlong term. For instance, it has been pointed outthat domestic financial market structures haveundergone substantial changes since theBretton Woods period: financial deregulationhas limited the scope for funnelling forcedsaving into capital formation in specificsectors. Moreover, maintenance of a fixedexchange rate regime can be difficult inpractice, and its benefits may erode over time,while exchange rate flexibility becomes morevaluable as economies mature and becomeintegrated with global markets.
Maintenance of a fixed exchange rate regimecan often mask underlying policy andinstitutional weaknesses, and result in thebuild-up of various sorts of imbalances. Forinstance, not letting one’s currency appreciateimplies that tradable goods are too cheap onworld markets, which inflates the returns oninvestment for tradable goods. This can resultin overinvestment, in particular in the tradablegoods sector. These problems can beexacerbated by an open capital account, as e.g.domestic firms and financial institutions mayreact to the perception of limited foreignexchange rate risk by taking on foreigncurrency debt.
If a country becomes an international creditor,its external assets may remain largelydenominated in foreign currency butmismatches in national balance sheets willemerge. As holdings of liquid assets in UScurrency are not balanced on the liability side,any significant appreciation of the domesticcurrency vis-à-vis the US dollar would imply(potentially sizeable) capital losses. Forinstance, Roubini and Setser (2005) estimatethat if adjustment were postponed, China’scapital loss could easily exceed 20 percent ofits GDP by 2008.13
Lastly, if at some point a revaluation becomesnecessary, valuation losses on foreign currencyholdings occur.
Some of these risks – e.g. valuation losses ormismatches in balance sheets – can be shiftedfrom the private sector to the central bank bymeans of reserve accumulation. Hence,building up international reserves can also beused as a means of “socialising” the negativeconsequences of currency and interest ratemovements, i.e. preventing the negativeimplications of capital flows on the privatesector.14 In such cases, central bankseffectively act as financial intermediaries,channelling domestic saving away from localuses and into international capital markets.This can be because domestic financial systemsare ill-equipped to deal with flexible exchangerates (Prasad et al., 2005), or because weak orunderdeveloped financial systems do notprovide sufficient tools to hedge againstcurrency movements (McKinnon and Schnabl,2003).15
6 UNCONVENTIONAL MONETARY POLICIES
Reserve accumulation can also occur in theform of unconventional monetary policymeasures. In Japan, for instance, conventionalmonetary policy has been rendered ineffectiveby the zero interest bound and bad loanproblems in the banking sector (Garton, 2005).Moreover, the country’s economicperformance has been negatively affected bydeflation. In such circumstances, monetarypolicy can essentially only be conducted bymanaging the country’s exchange rate. Anappreciating currency would have enhanceddownward pressure on the country’s inflationrate. By keeping the exchange rate stable, or
13 The People’s Bank of China is not simply lending China’scurrent account surplus back to the United States. Around75% of China’s reserve accumulation in 2003-04 wasf inanced by capital inflows, not China’s current accountsurplus (Roubini and Setser, 2005).
14 Foreign reserves can also be used to recapitalise (state-owned) banks, as in China in 2003 and 2005.
15 China’s approach of opening up to FDI rather than othertypes of capital inflows has helped to insulate it from manyof the risks associated with capital account liberalisation.But the dominance of FDI in China’s total capital inflows hasdeclined markedly in recent years, implying that thecomposition of inflows is likely to be increasingly driven bymarket forces rather than the desires of policymakers (Prasadet al., 2005).

36ECBOccasional Paper No. 43February 2006
even allowing for a gradual weakening of itsdomestic currency by accumulating foreignreserves, the effectiveness of monetary policycan be increased.
ANNEX 3RISKS TO AND CHALLENGES FOR THE CONDUCTOF MONETARY POLICY16
1 BACKGROUND
Reserve accumulation harbours a number ofrisks for the conduct of monetary policy. First,inconsistencies among monetary policyobjectives (price versus exchange ratestability) can evolve. Second, reserveaccumulation may also entail risks for thefinancial sector and medium-term growthprospects. In addition, quasi-fiscal costs ofsterilisation, defined here as the differencebetween the yields received for holding foreignassets and yields paid on domestic liabilitiesissued for sterilisation purposes, may arise.
Particularly in the presence of continuous netcapital inflows, interventions on currencymarkets to prevent exchange rate appreciationmay lead to an excessive easing of domesticmonetary conditions which could then threatenprice stability. The underlying reason is that ifsuch interventions are not fully sterilised, themonetary base rises and the resultingadditional liquidity increases the ability andwillingness of commercial banks to supplycredit. With interventions as large andpersistent as those recently observed in Asia,however, it might become more difficult to findeligible instruments with which to absorb theintervention-related rise in the liquidityreserves of the banking system. One possibilityis the issuance of new government securities orcentral bank paper.17 Another possibility couldbe a drastic increase in reserve requirements,which would reduce the amount of banks’excess liquidity.18 Moreover, in connectionwith capital inflows, monetary policy might behindered by a snowball effect. Continuedintervention to prevent exchange rate
appreciation might give rise to expectations ofexchange rate appreciation and furtherencourage capital inflows. In addition,sterilisation – considered in isolation – keepsdomestic interest rates elevated, therebyattracting even higher capital inflows. For thisreason, there is only limited leeway fordiscretionary interest rates hikes in order torein in excessive credit growth. This impliesthat, under such conditions, the central bankmight have to accumulate more and morereserves in order to offset upwards pressures onthe exchange rate.
Reserve accumulation may also facilitate theemergence of domestic imbalances,specifically if interventions are not fullysterilised and excessive liquidity is generated.On the credit supply side, in the presence ofabundant liquidity domestic financialintermediaries might be encouraged to grantcredit more easily and to relax their assessmentof borrowers’ creditworthiness. On the creditdemand side, lax monetary conditions exertdownward pressure on interest rates and mayencourage excessive domestic investment,either in the tradable or in the real estate sector.In this context, domestic imbalances may resultand the implications for medium-termeconomic growth are negative, posing asignificant challenge for monetary policy-makers. Finally, continuous reserveaccumulation might also imply quasi-fiscalcosts, which are here defined as the differencebetween the yields received for holding foreignassets and the yields paid on domesticliabilities issued for sterilisation purposes.Specifically, these costs may entail losses forreserve-accumulating central banks if anunfavourable foreign-domestic interest ratedifferential develops.
16 Prepared by G. Leichtlein and A. Kreye (DeutscheBundesbank).
17 In some Asian countries (China, Singapore, Taiwan andKorea) part of the sterilisation effort has been carried out viathe issuance of central bank paper.
18 However, raising reserve requirements is not a costlessoption as it could put commercial banks at a competitivedisadvantage vis-à-vis non-bank institutions. The share ofintermediation handled by the banking sector mightdecrease.

37ECB
Occasional Paper No. 43February 2006
ANNEX 3
2 INSTITUTIONAL CHARACTERISTICS ANDMONETARY POLICY RESPONSES IN SOMEMAJOR RESERVE-ACCUMULATINGECONOMIES
JAPANInterventions on currency markets are carriedout by the Bank of Japan (BoJ) on behalf of theMinistry of Finance (MoF). The MoF financesthe purchase of foreign assets by sellingFinancial Bills (FBs) via auctions to marketparticipants. Thus the effect on the monetarybase is virtually neutral. However, for a limitedperiod of time, the central bank can directlyunderwrite FBs from the MoF before they areauctioned to the markets.19 Therefore, theeffects of reserve accumulation on themonetary base in Japan are kept under control.
HONG KONG SARHong Kong is among the largest holders offoreign exchange reserves but its reserves havechanged only slightly since 2000. Theexchange rate regime adopted in Hong Kong isa currency board system, which requires thatboth stock and flows of the monetary base arefully backed by US dollars held in HongKong’s Exchange Fund. The link between theHong Kong dollar and the US dollar ismaintained through an automatic interest rateadjustment mechanism, whereby interest ratesadjust to inflows or outflows of funds, creatingthe monetary conditions that counteract theoriginal capital movement. On 18 May 2005 theHong Kong Monetary Authority announced a“refinement” of the exchange rate system. Theformer link of HKD 7.8 to one US dollar wasgradually changed into a fluctuation band withHKD 7.75 and HKD 7.85 as margins. Theintroduction of the convertibility zone aroundHKD 7.8 was aimed at removing uncertaintyabout the extent to which the exchange ratemay appreciate and should also reduce theusage of the Hong Kong dollar as a vehicle forspeculation on a revaluation of the Chinesecurrency. Under this new system, when theHKD/USD rate approaches the upper boundary(HKD 7.75), investors should have theconfidence to sell US dollars for Hong Kong
dollars if they believe in the central bank’scommitment to buy all available US dollars inthe market at the upper boundary. In this case,domestic interest rates should move to close thegap with US rates.
PEOPLE’S REPUBLIC OF CHINAGiven the considerable pace of reserveaccumulation, the People’s Bank of China(PBC) has been countering current accountsurpluses, foreign direct investment andspeculative inflows with sterilisation andadditional measures. Sterilisation in thepresence of continuous inflows might, undercertain circumstances, become costly. Forinstance, in 2004 the PBC had to resortincreasingly to currency interventions and, inorder to sterilise the ensuing domesticmonetary expansion, conducted large-scaleopen market operations. Specifically, theissuance of central bank securities forsterilisation purposes reached 15% of M0 in2004, up from 5% in 2003.
On 21 July 2005 the PBC announced a reformof the exchange rate regime that came intoeffect the next day. The reform included animmediate appreciation of 2% to 8.11 renminbiper US dollar. For the US dollar the band of±0.3% around the central parity is maintained,while for other currencies the daily band hasbeen widened to ±3% (from ±1.5 %) around thecentral parity. For the US dollar the centralparity rate is determined by a weighted averageof market opening bid prices from marketmakers before 9:15 am on the same tradingday.20 This implies that the opening price maybe different – possibly outside the ±0.3% band– from the closing price of the previousbusiness day. In addition, the exchange rate ofthe renminbi is determined by “a managedfloating exchange rate regime based on market
19 Such operations would smooth the potential disturbance ofthe money market arising from a large-scale issuance of FBswithin a short period of time. Moreover, for the public, itconceals the scale of interventions. FBs underwritten by theBoJ must be redeemed by the government as quickly aspossible.
20 Previously the US dollar central parity rate was based on theprevious day’s closing price.

38ECBOccasional Paper No. 43February 2006
supply and demand with reference to a basketof currencies” (People’s Bank of China, 2005).However, despite this reform the build up offoreign exchange reserves has been continuingin a context of large basic balance surpluses.Prior to the exchange rate reform, the PBC hadraised the reserve requirements ratio andemployed interest rate policy measures,including the increase in benchmark depositrates and lending rates. Moreover, theauthorities also tried to slow investmentgrowth through administrative measures tocurb excessive credit growth. In parallel,several measures to ease capital outflows havebeen introduced since October 2003.21
INDIAIn India reserve accumulation amounted toroughly USD 30 billion in 2003. In 2004foreign exchange reserves grew further andreached about USD 125 billion at year-end. In2002 and 2003 the Reserve Bank of India (RBI)sterilised about 70% and 60% of theintervention-related increase in reserve moneyrespectively. The stock of governmentsecurities available to the RBI for sterilisationpurposes declined progressively. In order toenable liquidity absorption, at the beginning of2004 it was decided that the Government wouldissue treasury bills and dated securities to beused exclusively for sterilising purposes. As inChina, the authorities in India adoptedadministrative measures to discourage capitalinflows, including a tightening of therequirements on external commercialborrowing. To ease outflows, restrictions onoverseas investment and lending were loosenedand the prepayment of foreign loans wassimplified. However, persistent inflationarypressures and sterilisation costs, which add tohigh fiscal deficits, make it more difficult forthe Indian authorities to reconcile theirexternal and domestic policy objectives.
REPUBLIC OF KOREAIn Korea, the management of foreign exchangereserves lies with the Ministry of Finance andEconomy (MoFE), but is partly delegated toother authorities, including the Bank of Korea
(BOK). The BOK manages the bulk of thecountry’s foreign exchange reserves. In its roleof undertaking matters relating to the issuanceand redemption of government bonds, the BOKis entrusted by the MoFE with the operationand management of Foreign ExchangeStabilisation Fund bonds. The central bankinter alia issues Monetary Stabilisation Bonds(MSBs) to control money supply. Sterilisationof the intervention-related growth in themonetary base has increased over the pastyears. In 2002 nearly 60% was sterilised whilein 2003 the additional liquidity generated byinterventions was almost completely sterilised.In 2004 Korea’s foreign exchange reserves roseby USD 43.7 billion, the bulk of which (USD 25billion) was accumulated during the fourthquarter. Nevertheless, in the same quarter theKorean won appreciated by 10% against the USdollar. As the outstanding amount of MSBsincreased considerably in 2004, all theliquidity caused by foreign exchangeintervention has been sterilised. In 2004 theBOK posted a loss of 150.2 billion won, its firstloss since 1994. The deficit was largely theresult of interest payments on MSBs beinghigher than returns earned on foreign assets andof exchange rate losses which were marked tomarket.
SINGAPOREForeign exchange interventions by theMonetary Authority of Singapore (MAS)amounted to USD 16.5 billion in 2004, ofwhich USD 10.2 billion took place in the fourthquarter. The MAS manages the Singaporedollar against a trade-weighted basket ofcurrencies of Singapore’s major tradingpartners. In April 2004 the MAS shifted itsstance from zero appreciation of the nominaleffective exchange rate to a modest and gradualappreciation, with the aim of reducing the riskof imported inflation. The central bank’smoney market operations do not target a policy
21 For example, China liberalised exchange restrictions onindividual overseas travel, encouraged certain types ofdomestic f irms to invest abroad, and initiated a scheme toinduce domestic institutional investors to increase theiroutward investment. In addition, the regulation of foreigncurrency holdings for certain enterprises has been relaxed.

39ECB
Occasional Paper No. 43February 2006
ANNEX 4
interest rate but aim at providing liquidity forthe banking system that is sufficient for banksto maintain the minimum reserve requirementratio of 3%. According to the MAS (2001), inorder to smooth short-run volatility in theexchange rate, the central bank intervenes incurrency markets from time to time. Theintervention operations aim to keep the trade-weighted value of the Singapore dollar within aspecified band. Institutional features that havesupported the effectiveness of the MAS’intervention are the government’s fiscalsurpluses and the surpluses of the CentralProvident Fund.22 These surpluses are placed indeposits with the MAS, thereby withdrawingliquidity and putting upwards pressures on theexchange rate. The MAS engages in eithermoney market operations or (non-sterilised)foreign currency interventions to offset thisliquidity withdrawal.
TAIWAN, PROVINCE OF CHINAThe Central Bank of China (CBC) hasintervened significantly on foreign exchangemarkets in recent years. In 2002 and 2003 theCBC absorbed liquidity by more than theintervention-related expansion in the monetarybase. Sterilisation was lower in 2004 at 85%.The intermediate target for monetary policy inTaiwan is M2. Thus, a surge of broad monetaryaggregates should induce the CBC to carry outoffsetting operations. The main instruments arecertificates of deposits, issuance of which grewmuch less in 2004 than in the two precedingyears, with much of the increase taking place inthe first two quarters.
ANNEX 4THE FOREIGN POSITIONS OF SEVEN ASIANCENTRAL BANKS: TRENDS AND POTENTIALRISKS23
1 BACKGROUND
The building up of foreign exchange reservescreates an exposure to foreign currency-relatedrisks. The larger the absolute level of reserves,the larger the potential risks and the need for
appropriate risk management. Given the oftendominant role, in reserve-accumulatingcountries, of the US dollar as the denominatorof most foreign transactions and the anchor forexchange rate policy, foreign exchangereserves are usually mostly denominated in thiscurrency. The related risks that monetaryauthorities face are largely similar to thosefaced by private agents with currencyexposure, and can be classified into (i) market(i.e. currency and interest rate) risk, (ii) creditrisk and (iii) liquidity risk. The main marketrisk is given by the potential for valuationlosses on the securities denominated in theinternational anchor currency. In fact, ifauthorities were to abandon or modify theirlink to this currency and/or be forced intodomestic currency appreciation, they wouldexperience an immediate loss on the asset sideof their balance sheet.
When assessing the trends in net foreign assetsin the balance sheet of central banks, twopreliminary aspects have to be borne in mind.First, the growth in foreign currency reserves isnot always fully reflected in central bankbalance sheets. Japan, where the Ministry ofFinance holds the greatest share of foreignexchange reserves, is a case in point, asillustrated below. Moreover, in countries suchas China the central bank is not independent ofthe government24. Second, foreign assets haveto be assessed net of foreign liabilities. Sinceboth components may vary widely, including interms of relative weight, the net foreignposition is the most comprehensive measure ofthe external exposure of central banks and,therefore, the appropriate variable to assess therelated risks.
22 The Central Provident Fund is a mandatory-def inedcontribution savings scheme for Singapore residents.
23 Prepared by M. Soudan (Nationale Bank van België/BanqueNationale de Belgique).
24 A short description of the different institutionalarrangements underlying the management of foreignexchange assets for the seven countries surveyed in thispaper is provided in Section 4 of this annex.

40ECBOccasional Paper No. 43February 2006
2 TRENDS IN THE NET FOREIGN POSITIONOF SEVEN ASIAN CENTRAL BANKS
Chart 10 plots the net foreign position of sevenAsian central banks on a monthly basis fromJanuary 1995 to April 2005, and shows thatthose banks built up substantial net foreignassets in this period. At the end of 1995 the totalsum of net foreign assets within this group wasUSD 458 billion. The yearly growth rate of thenet foreign position increased from about 10%in 2000-01 to 29% in the period ending inDecember 2004. The net foreign assets of thesecentral banks totalled USD 1,484.9 billion atthe end of April 2005, thereby having tripled inonly eight years.
Chart 11 shows that not all of these centralbanks have contributed in equal measure to therise in net foreign assets. The share of the Bankof Japan (BoJ) declined from 24.7% of the totalat the end of 1995 to 1.8% in April 2005. In fact,the BoJ significantly reduced its net holdingsof foreign assets in April 1998 (to USD 27.2billion from USD 183.8 billion at the end ofMarch 1998) in line with the arrangements with
the MoF. The Monetary Authority of Singapore(MAS) and the Hong Kong Monetary Authority(HKMA) also witnessed a decreasing share, theformer from 15.0% at the end of 1995 to 7.7%in April 2005 and the latter from 10.6% to 7.6%in the same period. Conversely, three centralbanks increased their share in total net foreignassets: the People’s Bank of China (PBC), theBank of Korea (BoK) and the Reserve Bank ofIndia (RBI). Their combined share rose from29% at the end of 1995 to 66% in April 2005.While in 1995 the BoJ was, in our sample, thecentral bank with the highest net foreign assetson its balance sheet, in April 2005 it was thePBC that held the highest share.
Table 1 shows the ratio of net foreign assets tocentral banks’ total assets, the latter as reportedon their balance sheets. The table points to arise in the importance of net foreign assets inthe total assets of all considered Asian centralbanks, except for the BoJ and the MAS. At theend of 2004 the net foreign assets of the sixcentral banks excluding the BoJ represented,on average, 73% of total assets, with a 15percentage point increase in five years. The rise
Chart 11 Relat ive net foreign assetposit ions of seven Asian central banks
(December 1995-April 2005; percentages)
Source: IMF, except for Taiwan Province of China, for whichthe source is the Central Bank of China.
Dec.1995
Dec.2000
Dec.2004
Apr.2005
17.528.5
40.6 41.910.6
15.6
8.4 7.6
4.0
6.29.4 9.5
24.7
5.71.9 1.87.2 14.5
14.3 14.615.0
12.3 8.1 7.7
20.9 17.2 17.3 17.0
0
20
40
60
80
100
0
20
40
60
80
100
People’s Bank of ChinaHong Kong Monetary AuthorityReserve Bank of India Bank of JapanBank of KoreaMonetary Authority of SingaporeCentral Bank of China (Taiwan)
Chart 10 Net foreign posit ion of seven Asiancentral banks
(USD billions)
Source: IMF, except for Taiwan Province of China, for whichthe source is the Central Bank of China.
0
0.2
0.4
0.6
0.8
1.0
1.2
1.4
1.6
0
0.2
0.4
0.6
0.8
1.0
1.2
1.4
1.6
1995 1996 1997 1998 1999 2000 2001 2002 2003 2004 2005
People’s Bank of ChinaBank of JapanCentral Bank of China (Taiwan)Hong Kong Monetary AuthorityBank of KoreaSumReserve Bank of IndiaMonetary Authority of Singapore

41ECB
Occasional Paper No. 43February 2006
ANNEX 4
was particularly rapid in the cases of the RBI,BoK and PBC.
Summing up, the central banks of China, Koreaand India experienced a sharp rise in their netforeign asset positions in the period 1995-2004, while the positions of other central banksremained more stable or declined, thus leadingto greater concentration of net foreign assets ina few central banks. Those central banks alsoexperienced an increase in the relativeimportance of foreign assets in their balancesheets, thereby affecting the potential forforeign currency-related risks.
3 POTENTIAL COSTS OF NET FOREIGNASSET HOLDINGS
The rising importance of net foreign assets in thebalance sheet of a central bank increases itsexposure to currency risk, which, ideally, shouldbe mitigated with a commensurate increase inthe capital base. It is true that, in principle,central banks do not need capital as they issuecurrency on which no interest payment or otherpayments need to be made. If, however, a centralbank is potentially subject to large profits andlosses, an adequate capital base might provedesirable as it would allow running (foreignexchange-related) losses for a sustained periodof time without the need for recapitalisationthrough a transfer of public funds. A substantialcapital base thereby contributes to central bankfinancial independence.
In Table 2 the central bank capital base hasbeen calculated as the sum of paid-up capital,reserves, and accumulated profits minus lossesand provisions for foreign exchange losses;these items have been properly identified inpublicly available sources.25 The table reportsthe central bank capital base in terms of thebalance sheet total for the period 1995-2004,and shows that the relative importance of thecapital base fluctuates greatly across the sevenAsian central banks observed. Excluding theBoJ, the capital/balance sheet ratio remainedstable at 9.0% to 9.5% between 1995 and 2003,but fell to 6.9% in 2004 mainly due to a drop inthe capital base of the BoK26 and in the networth of the Central Bank of China (Taiwan),coupled with a very rapid rise in total assets. Acloser examination of the balance sheets revealsthat some central banks (RBI, CBC, HKMAand MAS) have increased their capital base,whereas others have refrained from doing so.
The dissimilar trends in the capital base,combined with the diverse speeds at whichcentral banks have been accumulating foreignassets, have led to very different rates at whichnet foreign assets are covered by capital andreserves. Table 3 provides an overview andshows that the importance of net foreign assets
25 A short description of the calculation of the capital base foreach central bank is provided in Section 4 of this annex.
26 The observed volatility of the capital base of the BoK in theperiod 1997-2004 is entirely caused by the fluctuations in theExchange Revaluation Reserve (see Section 4).
1995 1996 1997 1998 1999 2000 2001 2002 2003 2004
China N/A N/A N/A N/A 41 39 45 45 49 59Hong Kong 82 87 86 74 69 77 80 87 86 85Taiwan 84 82 86 84 84 89 88 88 88 90India 28 29 39 38 43 46 50 63 74 89Japan N/A N/A N/A 4 4 4 3 3 2 2Korea 36 40 9 35 60 73 79 81 85 82Singapore 99 100 100 100 98 95 95 95 95 96
Total N/A N/A N/A N/A 29 32 35 37 38 42
Total (excl. Japan) N/A N/A N/A N/A 58 59 63 64 68 73
Table 1 Net foreign asset as a percentage of total assets in the balance sheets of seven Asiancentral banks
Source: IMF, except for Taiwan Province of China, for which the source is the Central Bank of China.Notes: End-of year data except for Reserve Bank of India (mid-year data). Because of data limitations some data points are missing.

42ECBOccasional Paper No. 43February 2006
in relation to the capital base has beenincreasing since 1995, especially during 2004.Excluding the BoJ, the sum of net foreignassets for the other six Asian central banks wasalmost 11 times larger than their combinedcapital base at the end of 2004.
Chart 12 plots the ratios to nominal GDP of netforeign assets in the balance sheets of the sevenAsian central banks. These ratios have risensince 1995, once again with the exception ofthe BoJ. Excluding this central bank, the othersheld, on average, net foreign assets equivalentto 37% of GDP at the end of 2004, comparedwith only 17% in 1998. The relative importanceof net foreign assets vis-à-vis GDP has
increased not only in small open economies butalso in the two larger economies of China andKorea, and at the end of 2004 it reached itshighest level since 1995. Net foreign assets inthe balance sheets of the PBC and the BoKrepresented 34% and 27% of GDP respectivelyat the end of 2004.
Summing up, the following conclusions can bedrawn. First, the capital base of most reserve-accumulating Asian central banks relative tothe total balance sheet remained stable duringthe period 1995-2003 but decreased in 2004.Second, net foreign assets are currently greaterthan the capital base in all the central banksunder review, excluding the BoJ.
1995 1996 1997 1998 1999 2000 2001 2002 2003 2004
China N/A N/A N/A N/A 1.0 0.9 0.8 0.4 0.4 0.3Hong Kong 34.8 32.3 29.9 26.6 29.0 30.0 30.9 34.3 38.0 39.9Taiwan 4.5 6.1 15.6 16.3 10.1 12.3 14.5 14.8 14.7 9.7India 9.5 12.3 11.4 15.7 16.2 18.0 17.7 23.4 21.9 20.5Japan N/A N/A N/A 5.5 4.6 4.5 4.3 4.1 4.0 3.7Korea N/A N/A 31.5 13.5 9.7 12.8 12.8 7.9 9.4 2.3Singapore N/A 4.9 7.2 9.7 10.7 9.6 8.2 10.4 9.6 9.2
Sum N/A N/A N/A N/A 6.7 7.1 7.1 6.9 6.9 5.5
Sum (excl. Japan) N/A N/A N/A N/A 9.1 9.6 9.5 9.1 9.2 6.9
Table 2 Capital base as a percentage of the total balance sheet total of seven Asian centralbanks
Source: IMF, except for Taiwan Province of China, for which the source is the Central Bank of China.Notes: Figures for the Reserve Bank of India are mid-year f igures. Figures for the Monetary Authority of Singapore are Marchfigures in the subsequent year. All other f igures are end-of-year f igures.
1995 1996 1997 1998 1999 2000 2001 2002 2003 2004
China N/A N/A N/A N/A 39.4 42.6 54.5 103.8 139.5 211.0Hong Kong 2.4 2.7 2.9 2.8 2.4 2.6 2.6 2.5 2.3 2.1Taiwan 18.7 13.5 5.5 5.1 8.3 7.2 6.1 5.9 6.0 9.3India 3.0 2.3 3.4 2.4 2.6 2.5 2.8 2.7 3.4 4.4Japan N/A N/A N/A 0.8 0.8 0.9 0.6 0.7 0.5 0.5Korea N/A N/A 0.3 2.6 6.2 5.7 6.2 10.2 9.0 35.8Singapore N/A 20.5 13.9 10.2 9.1 10.0 11.6 9.5 10.0 10.3
Sum N/A N/A N/A N/A 4.3 4.6 5.0 5.3 5.6 7.7
Sum (excl. Japan) N/A N/A N/A N/A 6.3 6.2 6.7 7.0 7.4 10.6
Table 3 Ratio of net foreign assets over capital base for seven Asian central banks
Source: IMF, except for Taiwan Province of China, for which the source is the Central Bank of China.Notes: Figures for the Reserve Bank of India are mid-year f igures. Figures for the Monetary Authority of Singapore are Marchfigures for the following year (e.g. the ratio of 20.5 in the “1996” column for the MAS is actually a March 1997 f igure). All otherf igures are end-of-year f igures.

43ECB
Occasional Paper No. 43February 2006
ANNEX 4
4 INSTITUTIONAL ARRANGEMENTSRELATED TO THE MANAGEMENT OFFOREIGN CURRENCY RESERVES
In order to better asses the risks related to theforeign exchange exposure of reserve-accumulating Asian central banks, this finalsection summarises the institutionalarrangements underlying the management offoreign exchange reserves in each of the sevencountries under scrutiny. Specifically, thesection examines whether balance sheet risksrelated to a country’s foreign exchangereserves are borne by the monetary authority orthe Ministry of Finance, and to what extent.Where available, this section also providesinformation on whether foreign currency-denominated financial instruments are markedto market or valued at cost.
JAPANThe Japanese Ministry of Finance (JMoF) isresponsible for exchange rate policy and themanagement of foreign assets in the ForeignExchange Fund Special Account (FEFSA)system. The FEFSA system consists of twoelements: the Foreign Exchange Fund and theForeign Exchange Fund Special Account. Theformer is a fund established for foreign
exchange trading by the government and isfinanced by the issuance of short-termgovernment financing bills. Funds in theFEFSA are used to conduct interventions in theforeign exchange market. The financial resultsof foreign exchange trading, such as profits orlosses and payment or receipt of interest, arerecorded in the Foreign Exchange Fund SpecialAccount and are, therefore, part of overallgovernment revenues and expenses.Interventions are executed by the BoJ, whichacts as the agent of the JMoF. The BoJ doesnormally not take part in the financing offoreign exchange operations. However, fromJanuary to March 2004 the BoJ entered into anagreement with the JMoF to purchase foreignsecurities held by the FEFSA in order toprovide yen for FEFSA operations. Purchasesby the BoJ were conditional on their repurchasewithin three months. Total purchases by theBoJ were limited to JPY 10 trillion (slightlyunder USD 100 billion). The agreement wasinitiated because the FEFSA had, at that time,virtually exhausted the room for short-termborrowing under budgetary appropriations.The capital base of the BoJ has in this sectionbeen calculated in accordance with thedefinition in the BoJ’s 2004 Annual Report,namely as the sum of capital, special and legalreserves, as well as provisions. The BoJ is onlyliable for valuation gains/losses on foreignassets and liabilities recorded in its ownbalance sheet. At the end of 2004 the netforeign assets of the BoJ represented only 3%of total foreign exchange reserves in Japan.
PEOPLE’S REPUBLIC OF CHINAThe State Council is in charge of approving themonetary and exchange rate policy of China.The PBC carries out monetary policy andoversees the exchange rate policy implementedby the State Administration of ForeignExchange (SAFE), which is also responsiblefor regulating foreign exchange transactions,managing the country’s foreign exchangereserves and developing its foreign exchangemarket. The SAFE is a government agencydirectly reporting to the PBC.
Chart 12 Net foreign assets of seven Asiancentral banks in percentage of GDP
(percentages)
Sources: IMF, except for Taiwan Province of China, for whichthe source is Central Bank of China.
0
20
40
60
80
100
120
0
20
40
60
80
100
120
PBoCHKMARBI
BoJBoKMAS
CBCSumSum (excl. BoJ)
1995 1996 1997 1998 1999 2000 2001 2002 2003 2004

44ECBOccasional Paper No. 43February 2006
REPUBLIC OF KOREAThe formulation of foreign exchange policy is ashared responsibility of the Ministry ofFinance and Economy (MOFE) and the BoK.The MOFE is responsible for the overallforeign exchange policy and is empowered toset guidelines on the pursued external value ofthe won and to decide foreign exchangeintervention accordingly. The formulation offoreign exchange policy is also, to a certainextent, delegated to the (BoK) in keeping withits inflation targeting rule. Foreign exchangeinterventions are executed by the BoK, whichholds and manages the nation’s foreignexchange reserves together with the MOFE andKorea Investment Corporation. Losses andgains made on BoK transactions are recorded inits income statement. The capital base of theBoK has been calculated as the sum of capital(i.e. the sum of the legal reserve, voluntaryreserve and net profit for the period) and theExchange Revaluation Reserve (ERR).Valuation losses on foreign exchange holdingsare not recorded in the income statement, butare accounted for directly in the balance sheetof the BoK through the ERR, which is part ofthe item “Other current liabilities”.
TAIWAN PROVINCE OF CHINA27
Exchange rate policy is normally formulatedand executed by the CBC. The centralgovernment may restrict the foreign currencyoperations in the event of severe balance ofpayments deficits or when the stability of thedomestic economy is endangered. The TaiwanMinistry of Finance is in charge of thegovernment foreign exchange transactions,including the management of foreign debt.Rules relating to the settlement of foreignexchange transactions are set jointly by theCBC and the Ministry of Finance. In 1989Taiwan moved to a regime of managed float.Although the bilateral exchange rate of the newTaiwan dollar (NTD) vis-à-vis the US dollar isin principle set by the market, the central bankintervenes to avoid currency volatility and tomaintain orderly foreign exchange marketconditions.
INDIAThe RBI is responsible for formulating andexecuting foreign exchange policy, inconsultation and close cooperation with thegovernment. The RBI’s foreign exchangepolicy is communicated through regular policystatements and speeches by the Governor orother high-ranking officials. The currentexchange rate policy can be described as amanaged float: the RBI does not have a fixedexchange rate target, but intervenes in theforeign exchange market to dampen excessivevolatility when necessary. The RBI also holdsand manages the nation’s foreign exchangereserves, which are part of its balance sheet. Inthis section, the capital base of the RBI hasbeen defined as the sum of capital paid-up, thereserve fund, the contingency reserve, thecurrency and gold revaluation account and theexchange equalisation account. Gains andlosses on the valuation of foreign currencyassets and gold due to movements in theexchange rate and/or prices of gold are notbooked on the profit and loss account butinstead accumulated on the balance sheet underthe name Currency and Gold RevaluationAccount (CGRA). The balance in the CGRA atthe end of June 2004 was positive, equivalent to11.5% of the foreign currency assets and goldholdings of the RBI, compared with 13.4% atthe end of June 2003. Foreign securities held bythe RBI other than treasury bills are valued atthe lowest of book value and market price.Depreciations are adjusted against currentincome.
HONG KONG SARExchange rate policy is formally set by theFinancial Secretary of Hong Kong SAR and isexecuted through the Exchange Fund operatedby the HKMA. The latter also executes thenecessary monetary policy operations tosafeguard HKD convertibility. Reserve assets
27 The CBC does not provide information on how it deals withprofits or losses on foreign exchange transactions, nor doesit provide information on how foreign assets and liabilitiesare valued in its books. The capital base of the CBC has beendef ined as the net worth of the CBC.

45ECB
Occasional Paper No. 43February 2006
ANNEX 5
are, therefore, an integral part of the balancesheet of the HKMA. Reserves in the ExchangeFund are managed as two portfolios: theBacking Portfolio and the InvestmentPortfolio. The Backing Portfolio is used toback the monetary base of Hong Kong. TheInvestment Portfolio is used to preserve thevalue and long-term purchasing power ofassets. The capital base of the HKMA as it hasbeen defined in this section equals theExchange Fund equity. According to the notesincluded with the balance sheet in the HKMAAnnual Report, exchange gains and losses onforeign currency conversions (very smallbecause of the fixed peg) are included in theincome and expenditure account in “Netexchange gains/losses”. More importantly,foreign securities are stated on the balancesheet at fair value at the balance sheet date. Thefair value of a financial instrument representsits market price where there is a published pricequotation in an active securities market. Wheresuch a market price is not available, the fairvalue of a financial instrument represents itsvaluation according to a price matrix ofdiscounted cash flows using applicable interestrates for discounting. Changes in the fair valueof these investments are recognised in theincome and expenditure account in “Netrealised and revaluation gains/losses on otherinvestments in securities” as they arise. In 2004they accounted for 34.3% of total income and50.7% of the surplus for the year.
SINGAPOREThe foreign exchange reserves of Singapore aremanaged by the MAS, which also setsexchange rate policy. Singapore operates amanaged float regime along the lines of a so-called “band-basket-crawl” arrangement, theaim of which is to limit currency volatility andsecure domestic price stability. The exchangerate policy targets the nominal effectiveexchange rate (NEER), but the exactcomposition of the basket that is used tocalculate the NEER, normally made up of thecurrencies of major trading partners, is notmade public. In order to instil adequateconfidence in its exchange rate policy, the
MAS operates a Currency Fund which holdsforeign exchange reserves at least as large asthe total of domestic currency in circulation.The bulk of Singapore’s reserves are held in theGeneral Reserve Fund. Together, these twofunds make up the financial assets andliabilities of the MAS. The capital base of theMAS has been defined as the sum of the balancesheet items issued and paid-up capital, generalreserve fund and currency fund reserves. Goldand foreign assets, including derivativeinstruments, are stated on the balance sheet ofthe MAS at the lower of cost and market valueon an individual investment basis, except forshareholdings in the BIS and S.W.I.F.T. Gainsin the market value of foreign assets are notrecorded on the balance sheet.
ANNEX 5DEVELOPMENTS IN CENTRAL BANK RESERVEMANAGEMENT AND THEIR POSSIBLE MARKETIMPLICATIONS28
1 BACKGROUND
The increase in the size of foreign reserves inrecent years has made the choice of an adequatereserve management framework an importantissue for central banks. It is necessary for sucha framework to: i) be consistent with theexchange rate policy features; ii) seek anefficient risk-return trade-off; and iii) avoidmarket distortions. Against this backdrop, thisannex reviews developments in foreignexchange reserves and their composition, interms of both currency and instrumentallocation. It also elaborates on the variousframeworks for reserve management methodsobserved among the ten largest holders offoreign reserves, and compares the US and euroarea bond markets in order to find out whetherthere are differences that could limit a potentialcurrency diversification. Finally, the annexoutlines how the accumulation of foreignreserve might affect bond market dynamics.
28 Prepared by A. Lagerblom (European Central Bank) andG. Levy-Rueff (Banque de France).

46ECBOccasional Paper No. 43February 2006
2 MAIN TRENDS IN RESERVE MANAGEMENTSINCE 1999: DIVERSIFICATION, BUT TOWHAT EXTENT?
Given the accumulation of foreign reservesover the past years, there is a trend amongreserve managers towards a diversification oftheir portfolios. Diversification, however, cantake place in two dimensions, namely acrosscurrencies and across asset classes.
DIVERSIFICATION IN TERMS OF CURRENCYCOMPOSITION: A MARKET VIEWThe underlying principles, as outlined in theBox, support the view that changes in thecurrency composition of foreign reserves arelikely to occur very gradually. This is due to thefact that the reasons determining a specificchoice of currency composition, including therole of the dominant international foreignreserve currency (which has changed over timebut is currently clearly considered to be the US
dollar), are unlikely to change rapidly.According to Eichengreen (1998 and 2005) forexample, the importance of the depth, breadthand stability of the financial markets and thedegree of international transactions havealways played a decisive role whendetermining reserve currencies. In that respect,the incumbent world reserve currency holds anadvantage in term of network externality. Thisis particularly the case in Asia, given the role ofthe de facto dollar zone.29 In addition, centralbanks in general try to avoid swift changes inthe main characteristics of their foreign reservemanagement framework, since they can be asource of market disturbances.
When trying to carry out a more detailedanalysis of recent currency composition trends,one is confronted with the fact that theinformation available on currency composition
Box
POSSIBLE FACTORS DETERMINING THE CURRENCY COMPOSITION OF FOREIGN RESERVES
– The currency composition of reserves usually reflects a country’s exchange rate regimeand, if the exchange rate regime is not a pure float, is closely linked to the choice of ananchor currency or basket.
– One issue specific to Asia is the de facto existence of a dollar zone (in the strong or weaksense) in the region with many Asian currencies more or less strictly linked to the dollar.Given the strong inter-twinned commercial links in the region, this makes the weight of thedollar in the foreign exchange policy of Asian countries more important than the simpleweight of the United States.
– Official reserves, in particular in developing countries with fragile access to internationalcapital markets, are considered to be a cushion for paying for imports and ensuring theservicing of external debt in foreign currencies. Therefore, the reserve currencycomposition is often linked to the composition of trade and financial flows.
– Moreover, risk management considerations and optimal asset allocation approaches seemto have gained in importance recently.
– Finally, central banks also take into consideration, to the extent that it is compatible withtheir other objectives, the “market neutrality principle”, as prescribed by the IMF.
29 In this regard, see also Genberg, McCauley, Park and Persaud(2005) and Ho, Ma and McCauley (in BIS, 2005b).

47ECB
Occasional Paper No. 43February 2006
ANNEX 5
is generally vague and that, if it is published, itis only with a substantial time lag (to avoid anynegative market impacts). This is particularlytrue for most Asian countries.
IMF data are still the most relevant statisticswhich are publicly available. They showgradual changes in the currency composition offoreign reserves since 1999, with the share ofUS dollar holdings, at a global level, at its peakwith 71% in 1999.30 Since then, however, theshare of US dollar holdings has declined,standing at 65.9% at the end of 2004. Whenlimiting the analysis to developing countries,the share of the US dollar seems to be slightlylower, i.e. 59.8% at the end of September 2005.The aggregated share of euro holdingsincreased from 17.9% in 1999 to 24.3% at theend of September 2005 according to the latestavailable data from the IMF CurrencyComposition of Official Foreign ExchangeReserves (COFER) database (with the specifictrend in developing countries being verysimilar to the general picture). However, asregards the share of euro holdings, theappreciation of the euro also contributed topositive valuation effects in recent years.31
These shares, however, are calculated only forthe group of countries reporting reservecurrency composition to the IMF, accountingfor around 70% of world reserve holdings(excluding important reserve accumulatingcountries).
The gradually increasing use of the euro inglobal foreign reserves has been supported bythe smooth functioning of the euro area and theeuro’s appreciation against other internationalcurrencies in recent years.32 It is noteworthythat, according to the recent survey of trends inreserve management conducted by CentralBanking Publications in 2004 (Pringle andCarver, 2005), 70% of the sample groupreported an increase in euro exposure. Of the50% of the sample that reported a reduction inUS dollar exposure, 93% reported that theirexposure to the euro had increased. One statedreason for this trend is the advantage ofdiversification in terms of an improvement in
the risk-return trade-off. While a precisecountry or regional breakdown for allcurrencies in foreign reserves is not available,partial evidence suggests that the bulk ofreserves of the ten largest holders are in USdollar-denominated financial assets.
Overall, the concentration of foreign reserveholdings in US dollar assets remainssignificant, particularly in Asia. This is relatedto the foreign exchange regimes adopted inseveral Asian countries, often characterised byde facto pegs against the US dollar, and thecomposition of their external trade, dominatedby links with the United States and the dollarzone.33 However, it is also related to a differentreason: the desire to improve the risk-returntrade-off through diversification, not just at thelevel of the central bank but at the aggregatecountry level. A diversification advantage atthe aggregate national level might exist whenthe central bank invests part of the nationalsavings – which are otherwise invested in thedomestic currency because of the home bias indomestic financial markets – in US dollarassets. Home bias is decreasing as shown in theIMF April 2005 World Economic Outlook(2005b), but it remains significant, inparticular in certain countries. For example, inChina34 the home bias can be extreme becauseof regulatory constraints. The central bankmight therefore perceive an advantage inaccumulating foreign assets on behalf of therest of the Chinese economy and see only a
30 See the IMF’s Annual Report 2005, which shows somesignif icantly revised data for the currency composition ofoff icial foreign exchange reserves over the past years. Pleasenote that in the IMF’s own admission, these data are not fullyreliable. It should also be noted that the IMF introduced anew presentation regarding the estimation of the currencycomposition of reserves in 2005, which makes any directcomparison with the old presentation impossible.
31 A more accurate way of analysing the relative change is tolook at the ratio of quantities for all countries: in 1999 therewere 3.9 times more dollars held than euro, but at the end of2003 reserve managers held only 2.6 dollars per euro.
32 See the Review of the international role of the euro, ECB,January 2005.
33 Genberg et al. (2005), for example, argue that the dollarshare of foreign reserves is not out of line with the share ofthe dollar zone measured in the world GDP.
34 China is not covered in this specif ic IMF WEO analysis,which focuses mainly on developed countries.

48ECBOccasional Paper No. 43February 2006
limited advantage in diversifying out of thedollar into other foreign currencies at thisstage, since a good part of the benefit ofdiversification is already obtained by investingin dollars for the entire country, while furthercurrency diversification would only addmarginally to this first order effect. Thissupports the idea that a possible diversificationof foreign reserves out of the US dollar in Chinacould only be implemented at a slow pace.
As regards possible market impacts, centralbanks with large foreign reserve holdings areaware that some of their moves might generatevolatility in the US dollar or international bondmarkets, even if doing so would also inflictsignificant losses on them.35 The fact that theauthorities might stop purchasing US dollarsand US Treasuries (even without talking aboutnet selling) is seen by market participants as arisk for volatile US dollar movements andhigher US bond yields.
DIVERSIFICATION IN TERMS OF INSTRUMENTCOMPOSITION: A MARKET VIEWThe instruments in which reserve managersinvest the bulk of their foreign reserves havealso changed to a certain degree over the lastdecade. On the one hand, changing financialmarkets (e.g. the shrinking stock ofoutstanding US Treasuries at the end of the1990s and in the early part of the 2000s) forced,to some extent, traditionally conservativereserve managers to enlarge the eligible assetclass spectrum for their portfolios. Betterportfolio management skills, technical know-how and risk management tools have alsohelped to promote a diversification of foreignreserve portfolios towards new instrumentclasses given the advantages of thisdiversification in terms of decreasing risks andenhancing returns. However, the changes havebeen slow. Most foreign reserve managementactivities, compared with private portfoliomanagement activities, still seem to havespecific features which may make them morelikely to have an impact on the market.36
As McCauley and Fung (BIS, 2003a) summedup, the reserve manager’s choice of instrumenthas showed three successive phases. In themid-1970s, reserve managers began todiversify their short-term holdings out of USTreasury bills into private money marketinstruments or BIS instruments to obtain higheryields, which consequently also meantaccepting greater credit risk. In a second phase,the maturity of their reserve holdings wasextended, thus accepting larger market risk.Although comprehensive data on the maturitystructure of US Treasuries held in foreignreserves are not available, the findings ofMcCauley and Fung are corroborated by theviews of other market participants. In additionto the desire for more diversification, themarket context, characterised by decliningyields in the 1990s, led reserve managers towish to enhance returns by purchasing USTreasuries with longer maturities. Morestructurally, numerous researchers have foundthat, for investors with a medium to long-terminvestment horizon, extending the durationgenerally allows a positive term premium to beearned (of course at the price of greater profitand loss volatility).
In the last and most recent phase, which startedat the end of the 1990s, reserve managersshifted some of their longer-term securitiesaway from US Treasuries into securities withhigher credit risk, in order to earn theadditional yield spread pick-up. Hence, forexample, the securities issued by government-sponsored enterprises (GSEs), also referred toas US agencies, were not only used by reservemanagers as a substitute for the shrinking USTreasury market, but also to enhance returns ina relatively low-yield environment. However,
35 For example, rumours regarding the possible diversificationof reserves by the Bank of Korea in February 2005 triggereda 2% appreciation of the Korean won against the US dollar,which meant a 2% loss for the Bank of Korea’s reserveholdings (valued in KRW terms).
36 Off icial institutions including central banks are oftenscrutinised by market participants because the amounts thatthey trade are large and because the investment strategy ofsuch institutions can change abruptly and independently ofinterest rate levels (in contrast to the behaviour of privateforeign investors).

49ECB
Occasional Paper No. 43February 2006
ANNEX 5
one can note that, according to the US TreasuryInternational Capital (TIC) system report37, theamount of GSE securities acquisitions byofficial institutions peaked in 2000, with netacquisitions of approximately USD 41 billion.Although there is a significant discrepancybetween the US Treasury’s TIC report and theFederal Reserve’s custody GSE securitiesholding data, other evidence points in the samedirection.
There is a range of data sources that track theinstrument composition of foreign officialinvestments denominated in US dollar assets.In addition to the IMF and the BIS, the USTreasury, the Federal Reserve and the Bureauof Economic Analysis (BEA) also recordforeign official holdings of US reserves.However, each data source differs in i)coverage, ii) timing, iii) valuation, and iv)methodology for recording holdings.Furthermore, due to confidentiality issues,disclosures have limitations and it is notpossible to conclude with certainty from thepublished data the precise amount of each kindof asset held by foreigners, i.e. private orofficial investors. Therefore, any conclusionsabout the foreign ownership of US marketablesecurities as presented hereafter are drawn
cautiously. Furthermore, the followinganalysis is restricted to US dollar reserveholdings only, as only limited data are yetavailable for euro-denominated securities.
Table 1 below shows changes in thecomposition of US dollar reserves byinstrument types from March 2000 to June 2004and is based on an analysis carried out byMcCauley and Fung (BIS, 2003a). The datacover investments in the United States, ascaptured by the US Treasury TIC data, anddollar deposits held outside the United Statesin banks captured by the BIS internationalbanking statistics.
The data confirm that central banks have beenmarginally diversifying away from USTreasuries to other assets within their US dollarreserve portfolios. Recent evidence, asoutlined in the survey by Pringle and Carver(2005), suggests that central banks remaincommitted to diversifying portfolios further interms of assets. Many central banks are stilldiversifying into higher-yielding instrumentsand securitised bonds. However, the bulk of
March 2000 June 2000
Short Long Short Longterm term Total in % term term Total in %
Treasury securities 165 492 657 58 249 923 1,172 52Other assets 262 211 473 42 635 434 1,069 48Repos and deposits in the United States 32 32 3 141 141 6Money market paper 104 104 9 93 93 4Offshore deposits 126 12 138 12 401 37 438 20
Agency securities 91 91 8 216 216 10Corporate bonds 12 12 1 47 47 2Equity 96 96 8 134 134 6
Total 427 703 1,130 100 884 1,357 2,241 100
Memo:Total US dollar reserves end-1999 1,359 end-2004 2,334
Sources: BIS Quarterly Review, March 2003, “Choosing instruments in managing dollar foreign exchange reserves”, R. N.McCauley, B. S. C. Fung, March, Basel; BIS Quarterly Review, September 2005, “Distinguishing global dollar reserves fromoff icial holdings in the United States”, R. N. McCauley, Basel.
Table 1 Instrument composit ion of US dol lar reserves
(in USD billions)
37 See the US Department of the Treasury,http://www.treas.gov/tic/fpis.html.

50ECBOccasional Paper No. 43February 2006
their assets continue to be concentrated intraditional instruments such as bank deposits,BIS instruments and US Treasuries (as well asagency securities, though to a lesser extent). Itcan be concluded that, while the changes in themanagement of foreign reserves have beensignificant, they do not seem as important asthe magnitude of reserve accumulation.
3 THE COEXISTENCE OF VARIOUS FOREIGNRESERVE MANAGEMENT FRAMEWORKS
Given the rapid growth of foreign reserveholdings over the past years and the risks andcosts associated with it, greater focus has beengiven to the management framework for suchforeign reserve portfolios. Central banks havebeen and are still diversifying along the yieldcurve and across asset classes, by taking onmore interest rate and credit risk in search ofhigher yields, but they are doing this todifferent extents. In addition, in some countrieswith large reserve holdings, not all reserves areinvested in highly liquid and secure sovereignissues.
For example, natural-resource-basedstabilisation funds have been created, likeNorway’s Government Petroleum Fund and thenewly established Russian Stabilisation Fund.These funds are typically thought of as a by-product of national budget surpluses, withexcess budget revenues coming from the exportof natural resources. In contrast to theNorwegian Government Petroleum Fund,which in addition to providing short-term fiscalstabilisation across the oil price cycle acts as amechanism for transferring wealth fromcurrent resource exploitation to futuregenerations, the Russian Stabilisation Fund isdesigned almost solely to serve short-termpurposes (i.e. fiscal targets). The assets of suchstabilisation funds are not accounted for in acountry’s reserve holdings, since they do notcome from and are not being used for foreignexchange intervention. They might appear, insome cases, on a central bank’s balance sheet asa separate “foreign assets” item, but theirorigin is not foreign exchange intervention.
More generally, parts of the reserve holdingsare sometimes transferred to separateinstitutions. This set-up has already been inplace in some countries for several years, as isthe case with the Government of SingaporeInvestment Corporation (GIC), and it is beingput in place in countries such as Korea38. Suchseparate institutions can, to some extent, beseen as external managers mandated by therespective central bank, with the foreignreserve assets remaining on the balance sheetof the central bank. The Bank of Korea, forexample, retains the option to recall the assetsin the event of an emergency, meaning that thefunds would effectively be retained by thecentral bank as international reserves whilebeing entrusted to the KIC for management.However, in the case of the GIC, some of theinflows come from accumulated budgetsurpluses and workers contributions to theSingapore Central Provident Fund (CPF), anational pension scheme, i.e. they are notrelated to the central bank’s foreign reserves.The main objective of these institutions is, ingeneral, to achieve higher long-term returns inorder to preserve the value of the assets forfuture generations (hence they are sometimesreferred to as “future generation or heritagefunds”).
4 US AND EURO AREA FIXED INCOMEMARKETS: CAN DIFFERENCES LIMITCURRENCY DIVERSIFICATION?
How could the differences between US andeuro area fixed income markets limit currencydiversification? On the other hand, if suchdiversification were to take place abruptly,could this mean a specific impact on euro areabond markets?
A BRIEF COMPARISON OF THE US ANDEUROPEAN FIXED INCOME MARKETSAccording to the 2005 Global FinancialStability Review published by the IMF, the sizeof the US bond market is close to USD 20,500billion compared with USD 13,500 billion for
38 The Korea Investment Corporation (KIC) began itsoperations on 1 July 2005.

51ECB
Occasional Paper No. 43February 2006
ANNEX 5
the euro area. Of these totals, government debtamounts to USD 5,000 billion in the UnitedStates compared with USD 5,500 billion in theeuro area (with, however, some fragmentationsince the Italian government debt market isclose to USD 1,500 billion, France andGermany are close to USD 1,000 billion eachand Spain is close to USD 500 billion accordingto the BIS quarterly review of March 2005).Finally, non-government debt securities (e.g.corporate debt securities, asset-backedsecurities, etc.) amount to USD 15,500 billionin the United States compared with USD 8,000billion in the euro area.
In brief, it should also be observed that theEuropean secondary bond market, in contrast tothe European primary market, is still relativelynarrow compared with the US secondary bondmarket. Interviewees surveyed for a studycarried out by BearingPoint39 estimated thatthe average daily turnover of the secondaryfixed income market in the euro area falls in arange between €60 and 65 billion. More than70% of the average daily turnover (approx.€44-50 billion) takes place in the German,Italian and French government bond markets.Compared with the US Treasury market, thisrepresents only 1/4 of the average dailyturnover (about USD 250 billion), as estimatedby the Federal Reserve Bank of New York. TheUS agency securities market on its own seemsto be almost comparable, in terms of turnover,to the size of the European government bondmarket, with an average daily turnover ofapproximately USD 45 billion.
Due to the difference in market sizes anddepths, large cash investors are thereforeinclined to favour the US bond market over theeuro area market. Differences in marketliquidity also tend to attract investors firsttowards the US bond market before theydiversify into the euro area market. Based on aninformal survey of nearly a dozen of the mainmarket makers in the US and euro area bondmarkets, the US market indeed remainssomewhat more liquid in terms of bid-offerspreads and the standard size of transactions.
However, the differences are not that large, andnor are they similar for all bonds (e.g.depending on their maturity; on-the-runcompared with off-the-run US Treasuries;government debt compared with agency orcorporate debt; etc.).40
In fact, according to the central bank surveycarried out in autumn 2004 (Pringle and Carver,2005), the importance of the euro area as aninternational investment centre is growing andthis is making the fixed income markets inparticular ever more attractive to many reservemanagers. Over half of the respondents to thesurvey indicated indeed that euro area marketsare now as attractive to invest in as those in theUnited States.
The growing use of derivatives, e.g. futures orinterest rate swaps, also means that theliquidity of cash instruments is now lessimportant since trading can be disentangledfrom liquidity management. In general, thederivative markets have a very good depth andliquidity, both in the euro area and in the UnitedStates.41
Therefore, the difference in size and structurebetween US and euro area markets should beneither overestimated nor underestimated.While only 37% of international bonds andnotes are denominated in US dollars, the factthat they are, in general, traded in morehomogeneous and liquid markets than othercurrencies certainly provides a partial reasonfor the concentration of dollar assets and thelimited diversification into the euro by Asian
39 See BearingPoint, The electronic bond market 2005, StudyDocumentation, Frankfurt, 2005.
40 The difference seems to be the largest in the money marketarea, with the six-month US Treasury bill bid-offer spreadannounced at between 0.25 and 1 basis point, while a spreadon similar instruments in the euro area is shown between 1and 2 basis points (or even 4 basis points for onecounterparty). For ten-year benchmark government bonds,several counterparties show similar spreads in the US andeuro area markets (or even tighter spreads in the euro area,but the dispersion seems higher there with severalcounterparties also showing significantly worse spreads thanfor US markets).
41 See, for example, Jones G., Citigroup saga highlights theneed for change, Financial News, 5 September 2004.

52ECBOccasional Paper No. 43February 2006
central banks. It also means that there is anadditional potential risk of distortion for euroarea long-term interest rates, should Asiancentral banks invest more in euro area markets.
BACKGROUND DATA ON THE MAJOR HOLDERS OFUS AND EUROPEAN FINANCIAL SECURITIESAs pointed out earlier, there is a range of datasources that track foreign official investmentsand holdings in US assets. However, nocomparable data are available for the euro areamarket as a whole, due to its – in this sense –fragmented structure. Only limited data can beretrieved from national debt agency offices orcentral banks, and from these data only roughconclusions can be drawn as regards theholders of euro area financial securities.
In the United States, the estimated share oftotal long-term securities in total outstandingstock (debt instruments and equities) held byforeigners has increased from 9.7% in March2000 to 14.3% (i.e. an amount of USD 5,418billion) as of June 2004.42 In comparison,approximately USD 588 billion worth of short-term securities are held by foreigners. No splitis provided here between official and privateforeign holdings. However, according to theUS Treasury, the share of foreign officialholdings in total foreign portfolio investmentin the United States was quite high in the periodfrom 1974 to 1984, when it stood at around40%, compared with the figure ofapproximately 24% (or USD 1,320 billion)published in June 2005. This drop can probablybe explained by the fact that the increase inforeign official holdings has been outpaced bythe increase in foreign private holdings. From1984 onwards the percentage of foreign officialholdings fell steadily, but it has reboundedslightly in the last two surveys.
The report further confirms that foreignofficials invest primarily in US Treasury debt,but that they have also increasingly invested inUS agency and corporate debt. Foreign privateinvestors still hold the bulk of their USinvestments in equities, with the share in USTreasury pretty much unchanged. Finally, and
more specifically, as of June 2004 foreignholdings of US Treasury securities represented52% of the total US Treasury debt outstanding,up from 35% in March 2000, with the majority(around 63%) held by foreign officialinstitutions.
When looking at the maturity structure of USdebt held by foreign official investors, the USTreasury report shows that, as of June 2004,over 73% was held in securities maturing infive years or less, with a concentration in issuesmaturing in one to three years. The picture issimilar when focusing only on US Treasurybonds. However, this is very much in line withthe maturity structure of outstandingmarketable US Treasuries in 2004, with only34% of marketable public debt outstandingheld in securities with maturities of more thanfive years. In short, foreign official portfoliosseem to concentrate on short to medium-termmaturities rather than the longer end of thecurve, which, however, corresponds to thematurity structure of outstanding debt.43
Focusing on US Treasury securities only,the US Treasury also publishes, on a monthlybasis, the major foreign holders split bycountry or between foreign official andforeign non-official holdings. However, anyconclusions about foreign ownership are to bedrawn cautiously, as the US Treasury itselfpoints out that the data are imperfect.44
Based on this data, Japan’s US Treasuryholdings in 2004 were more than three times the
42 See US Treasury (2005), Report on foreign portfolioholdings of US securities as of 30 June 2004, Department ofthe Treasury, Federal Reserve Bank of New York, June 2005.
43 It should be borne in mind that the same market risk isobtained through an investment of USD 1 billion in ten-yearnotes or around USD 15 billion in six-month bills.
44 For example, the “custodial bias” contributes to the largerecorded holdings in major f inancial centres, includingBelgium, the Caribbean, Luxembourg, Switzerland, and theUnited Kingdom, as some foreign owners entrust thesafekeeping of their securities to institutions that are neitherin the United States nor in the owner’s country of residence.The UK and Caribbean holdings of US Treasuries arediff icult to analyse, as the data represent a mixture of foreigncentral bank activities, petrodollar recycling and globalhedge fund activities.

53ECB
Occasional Paper No. 43February 2006
ANNEX 5
amount of the second largest holder (mainlandChina). Hence, Japan was responsible for overhalf of all US Treasury foreign purchases duringthe whole of 2004, although the vast majority ofthose purchases took place within the first half of2004. Japan’s position as a consistently largebuyer of US Treasury securities is a function ofits foreign exchange interventions to preventappreciation of the Japanese yen: the Japanesemonetary authorities do not dynamically adjustthe currency composition of their reserves, somost of the proceeds remain in US dollars. Whencomparing the TIC data with the data publishedby the Japanese Ministry of Finance (MoF), 85%of the stock of Japanese foreign exchangereserves is invested in foreign securities, withthe bulk held in US Treasuries. Therefore,Japanese authorities hold a particularly largeamount of US Treasuries compared with otherforeign institutions.
China’s demand for US assets arises fromforeign exchange interventions like in the sameway as for Japan, and China’s foreign assetpurchases were, until July 2005, somewhatmore automatic than Japan’s due to therenminbi’s fixed exchange rate against the USdollar. Therefore, one of the most commonassumptions is that China has also beenallocating large amounts of foreign currencyreserves into US Treasuries. However, the TICdata do not support this assumption, probablygiven the “custodial bias” (see footnote 45),which may understate the actual US Treasuryholdings by mainland China. Furthermore,China’s exposure to the US dollar is onlypartially shown by the TIC data since, unlikethe MoF, the People’s Bank of China invests ina more diversified asset base. Finally, theconsequences of the change in the Chinesecurrency regime in 2005 will need to bemonitored. For the time being it is too early toexpect swift significant changes since therenminbi de facto continues to be closelypegged to the dollar. But the Chineseauthorities have now more freedom i) to let therenminbi float over time, and hence to buy lessforeign currencies, ii) to shift the currencycomposition of their purchases in order to
decrease the focus on the US dollar, and iii) tochange their foreign reserve managementframework more generally.
For the euro area, the IMF’s CoordinatedPortfolio Investment Survey (CPIS), based onend-2002 data, shows that the United Statesheld the largest portfolio claims on the euroarea, followed by the United Kingdom, Japanand Switzerland. While the United States heldmainly equities, the United Kingdom and Japanheld mainly debt securities. However, the CPISdata do not provide any geographicalbreakdown for securities held as reserve assetsand international organisations’ portfolioinvestment holdings. The IMF thereforeconducts two complementary surveys toestablish a geographical breakdown ofsecurities held as reserve assets. In 2003, forexample, 55% of the securities held as reserveassets or in international organisations’investment portfolios were issued by USresidents, while only 28% were issued by euroarea residents even though, compared with1997, assets issued by US residents havedeclined at the expense of assets issued by euroarea residents (which is in line with thedevelopment in the currency composition ofreserve portfolios). The split between short andlong-term debt in US assets was 30%/70%,while in euro area assets 80% were accountedfor by long-term debt and the remaining 20% byshort-term debt.45 While it can be presumedthat official holdings of foreign reserve assetsdenominated in euro, which amount toapproximately USD 740 billion, are to a largeextent held in German and French long-termsecurities, no conclusions can be drawn asregards the geographical breakdown of thecentral banks and institutional organisationsholding such euro area foreign reserve assets.
Although this brief analysis is far fromexhaustive, it should be noted that no otherreliable data source was found that would showa decomposition of major holders of Italian,
45 In the euro area, more specif ically, the majority of assets(over 78%) held by off icial institutions are assets issued byGermany and France.

54ECBOccasional Paper No. 43February 2006
German and French government debt. None ofthe countries analysed publishes a breakdownof non-resident official and non-residentprivate holders of sovereign debt, and hence itis difficult to draw conclusions as clear as thosein the analysis provided for the US Treasurydebt market. In brief, however, it can beconcluded that, compared with the US Treasurymarket, only a minor share of euro areagovernment debt securities are held as reserveassets, with the large bulk held by euro arearesident investors (e.g. insurance companies,mutual funds and other financial institutions).
5 MARKET IMPLICATIONS OF EXCESSIVEFOREIGN RESERVE ACCUMULATION INTERMS OF POSSIBLE DISTORTIONS OFCURRENT BOND MARKET DYNAMICS
Overall, this contribution has shown that thereis evidence that foreign reserve portfolios arestill managed under much stricter constraintsthan private portfolios; investment decisionsregarding foreign reserves are also less price-sensitive than those made by private portfoliomanagers. Therefore, the two types of portfolioare not completely interchangeable, whichmight explain their different market impacts.An additional set of arguments supporting theview that central banks’ foreign reserveinvestment might have a market impact lies inthe behaviour of investment banks reacting tothe actions of central banks themselves. First,in line with experience and the order flowapproach (which shows that such flows cansometimes have a greater impact thaneconomic fundamentals), there is every reasonto believe that market makers profit from theirinformation regarding the action of centralbanks and, in particular, their US Treasurypurchases. In this context, they have a biastowards trading on the expensive side of themarket. Second, market participants oftenperceive changes in central bank foreignreserve strategy as partly policy-related and,therefore, containing specific information(also because reserve management often lackstransparency); this can trigger specific marketmoves or magnify market volatility.
Any market impact is also likely to depend onthe context in which it takes place. In recentyears large purchases of US Treasuries byAsian central banks have coincided withincreasing demand from pension funds and lifeinsurance companies. In addition, both the USmonetary and fiscal policy stances havesignificantly changed and impacted marketsduring that period with, in particular, thedecrease in US Treasury supply given thebudget surpluses around the turn of the centuryand the deflation fears of 2002-03. Therefore, itis difficult to disentangle all the various factorswhich have contributed to low interest rates.
ANNEX 6THE IMPACT OF ASIAN RESERVE ACCUMULATIONON ASSET PRICES46
1 BACKGROUND
Long-term interest rates in the United Stateshave remained low or even decreased in recentyears, defying expectations of significantlyhigher rates associated with robust nominalGDP growth, increasing public deficits and,perhaps more surprisingly, the gradual butpersistent tightening in official interest rateswhich began in June 2004. The persistently lowlevels of yields and the atypical behaviourdepicted by the increasing path of short-termrates versus stable or decreasing long-termrates have been given names such as the bondpuzzle or the interest rate conundrum47. Thepossibility of an interest rate misalignment,which could add to mounting disequilibria andultimately lead to a disorderly correction ofimbalances, has raised concerns.
However, despite the extensive literaturedeveloped to explain this puzzle, the question
46 This contribution has been prepared by Teresa Balcao Reis(Banco de Portugal) and Emiliano González Mota (Banco deEspaña), with input from Lucia Cuadro-Sáez and SergioGavilá (Banco de España).
47 The expression conundrum refers to long-term yields andwas introduced in Chairman Alan Greenspan’s semi-annualMonetary Policy Report to the Congress before theCommittee on Banking, Housing, and Urban Affairs (USSenate).

55ECB
Occasional Paper No. 43February 2006
ANNEX 6
remains controversial of whether thepersistence of yields below currently assessedfair value has been due to a change in theeconomic and financial fundamentalsunderpinning bond prices or to special factorswhich may be impeding the correct functioningof financial markets. This contribution aims toassess the extent to which interest rates arebelow expected equilibrium values because ofthe “captive demand” for US Treasuries arisingfrom foreign exchange interventions by Asiancentral banks.
2 THE ROLE OF CHANGES IN THE RELATIVESUPPLY OF TREASURIES ON YIELDS:A REVIEW OF AVAILABLE EVIDENCE
“HIGH FREQUENCY” DATAUnder the assumptions of frictionless financialmarkets and perfect substitution among assetclasses, changes in the relative supply ofsecurities do not affect their relative returns.Returns would be determined by the jointaction of “fundamentals” and arbitrageoperations which would guarantee that nomisalignment among asset returns occurs. Themajority view among financial economists is inline with the behaviour described by thefrictionless model. Accordingly, pricing ofassets in the US financial markets should notbe affected by changes in their relative supply.For the purposes of this contribution, ifthese assumptions were to hold, even largereductions in the net supply of Treasuries(because of strong demand from Asian centralbanks) should not have an impact on interestrates.
However, some studies48 support thehypothesis of imperfect substitution amongasset classes so that changes in the relativesupply of assets have an impact on returns.Indeed, Bernanke, Reinhart and Sack (2004)present some evidence supporting the view thatfinancial assets are not perfect substitutes andthat changes in the relative supplies ofsecurities do matter for their relative returns.They present an event study in which threeepisodes49 leading to changes in the expected
relative supply of Treasury securities affectedlong-term yields. The second episode, i.e. themassive foreign official purchases of USTreasury securities by the Bank of Japan, isintimately related to the aim of thiscontribution. Bernanke et al. (2004) show,using daily data, that Japanese interventionsfrom 3 January 2000 to 3 March 2004 had animpact on two, five and ten-year Treasuryyields on dates around the Japaneseinterventions. These results clearly support arole for changes in the relative asset supply ofassets in the determination of yields.Moreover, it is interesting to note that theseresults hold even if all days with major US datareleases are excluded from the sample. Thus, acommon econometric difficulty in this kind ofexercises, i.e. a possible joint endogeneity ofvariables, is to a great extent circumvented intheir estimations. However, this studyconsiders only the very short-term impact ofJapanese interventions on yields, i.e. theimpact on the days surrounding theinterventions (from t-2 to t+2). An immediatequestion related to their exercise is what effectremains, if any, after this very short period isover.
“LOW FREQUENCY” DATAAlternative studies have examined the extent towhich Asian reserve accumulation plays a rolein explaining the low levels of the changes inlong-term interest rates in the United Stateswith a longer perspective. Unfortunately,available evidence linking foreign officialpurchases of Treasuries and US yields is ratherinconclusive. The estimates of the impactdiffer substantially and are subject in mostcases to econometric caveats. The range of theresults is quite ample, from negligible effectsto sizable effects as big as 200 basis points.
48 See Roley (1982), Friedmand and Kuttner (1998).49 These episodes are 1) the announcement of debt buybacks
that followed the emergence of budget surpluses in theUnited States in the late 1990s; 2) the massive foreignoff icial purchases of US Treasury securities by the Bank ofJapan; and 3) the apparent expectations among marketparticipants in 2003 that the Federal Reserve was likely toembark on targeted bond purchases.

56ECBOccasional Paper No. 43February 2006
The methodology used by those who supporttheir assessments with time series analysisconsists of regressing either changes in USbond yields or the discrepancy between currentrates and estimated equilibrium rates, onmeasures of intervention or foreign officialTreasury purchases. The list of studies is quiteextensive and the most relevant ones aresummarised in Table 6 of the main part of theTask Force’s report at the beginning of thispaper.
3 A MODEL TO EXPLAIN THE IMPACT OFASIAN RESERVE ACCUMULATION ONTEN-YEAR TREASURY YIELDS
The model presented hereafter builds onprevious works and presents a reduced form ofthe so-called fundamental bond yield model,which will be used to regress the discrepancybetween the model results and current yields onAsian official net purchases of Treasuries.50
In the long-term relationship, US ten-yearinterest rates are explained as a function ofmonetary policy stance, inflation expectationsand fiscal deficits. Thus, bond yields depend ona set of current fundamentals and a measure oflikely changes in the relative supply ofTreasuries. Moreover, the base relationshipimplicitly admits the principle of imperfectsubstitution among financial assets.Otherwise, changes in the relative supply ofTreasuries arising from public deficits or fromcaptive purchases of Treasuries from Asiancentral banks would have no effects on yields.Afterwards, the behaviour of the short-termrelationship is obtained by using an errorcorrection model.
The model differs from others because itexplicitly incorporates the role of inflationexpectations in the determination of long-terminterest rates, whereas other models use thethree-month interest rate compound in a singlevariable, the actual monetary stance andexpectations for GDP growth and inflation. Asa consequence, the introduction of the variable“fiscal balance” in this model is aimed at
exclusively grasping changes in the relativesupply of Treasuries and, in principle, does notconvey any additional information on theexpected future path of interest rates.Therefore, the role of the fiscal variable issimilar to that of official foreign purchases ofTreasuries, i.e. changes in the relative supplyof Treasuries and bonds. Fiscal balances areused as a percentage of GDP. In particular, theestimated long-term relationship will bechecked to see if it holds or not for the period inwhich the strong accumulation of reserves hastaken place (from 1999 onwards). Last but notleast, the estimation technique used isGeneralised Least Squares in order to correctthe autocorrelation in the residuals that wouldbe obtained if Ordinary Least Squares wereapplied.
The long-run equation51 in our model is givenby:
US 10yr yield = a0 + a1 monetary stance+ a2 inflation expectations
+ a3 US public balance + a residual
The results are shown in Table 1.
In a second step, several measures wereincluded to gauge the impact of Asian reserveaccumulation on long term interest rates. Thevariables considered are Japanese netpurchases of Treasuries, aggregate Japaneseplus Chinese plus Malaysian net purchases ofTreasuries, and total Foreign Official netpurchases.52
None of the long-run equations show anystatistically significant impact of any of the
50 See Iankova, Lefeuvre and Teiletche (2004), Artus (2005),Moëc and Frey (2005) and Deutsche Bank (2005). Of theseworks, the approach presented by Moëc and Frey seemsparticularly appealing.
51 The Fed funds rate is used as a measure for the actual stanceof monetary policy and the consumer expenditure index(core) as a measure of inflation expectations. Public balancesare measured as a percentage of GDP. The baseline time spanconsidered is from 1994 onwards, though wider horizons (thewidest begins in 1990) were also considered and obtainedsimilar results.
52 The data are provided by the Treasury International CapitalSystem (TICS).

57ECB
Occasional Paper No. 43February 2006
ANNEX 6
measures of the Asian reserve accumulationon US yields. In other words, Asian purchasesof Treasuries do not add any additionalinformation to explain interest rate levels tothat contained in the sum of monetary stance,inflation expectations and public deficits in theextended time-horizon considered.
Afterwards we used the error correction modeltechnique to estimate a short-run relationship.The results support the view that ForeignOfficial net purchases of Treasuries help toexplain the changes of US ten-year yieldsat a 95% confidence level and that Asianpurchases, mainly because of Japanesepurchases, are statistically significant at an85% confidence level.
According to the coefficients obtained for theextended period 1994-2004, current long-termgovernment yields are around 80 to 85 basispoints below that suggested by fair valueestimates. Equilibrium long-term interest ratesin the United States would be in the range of
5.15% to 5.25%. However, Asian officialpurchases of Treasuries obtained from TICSdata are not responsible for this misalignmentalthough, according to the short-termrelationship estimated, they help to explainchanges in yields.
The exercise is repeated for a shorter time span(1999-2004) just after the Asian crisis when,among other things, the strong pace ofaccumulation of foreign reserves by Asiancountries took place. The results are shown inTable 2.
Since 1999, the estimation of the model hasshown a structural change in the determinationof long-term interest rates in the United States.The public deficit and the consumer price indexvariables are not statistically significant,whereas other factors, apart from officialinterest rates, have become more importantbecause the coefficient estimated for theconstant term of the equation is higher andstatistically significant at a 95% confidence
Table 1 Regress ions for 1994-2004
(dependent variable: US ten year Treasury bond yield)
Source: Calculations provided by Banco de España.Notes: USBB stands for public budget balance, FEDFUNDS stands for the quarterly average of Fed funds, PCE core stands for thecore component of the expenditure consumer price index, LD BOND10Y stands for the first lag in the ten-year interest rate, D. standsfor differences, and NP stands for net purchases of US Treasuries according to TICs data.1) p<.152) p<.103) p<.05
Period: 1994Q1-2004Q4Baseline Japan Asia Fgn. official inst.
Variable Long run Short run Long run Short run Long run Short run Long run Short run
USBBs -0.140 3) -0.139 3) -0.135 2) -0.140 3)
FEDFUNDS 0.516 3) 0.515 3) 0.507 3) 0.502 3)
PCE_core 0.764 3) 0.764 3) 0.775 3) 0.743 3)
LD.BOND10Y 0.256 0.305 0.272 0.280D.USBBs 0.044 0.112 0.096 0.043D.FEDFUNDS 0.680 3) 0.669 3) 0.662 3) 0.584 3)
D.PCE_core 0.077 0.104 0.211 0.025L.residual -0.919 3) -0.956 3) -0.953 3) -0.854 3)
NP -0.006 -0.036 -0.112D.NP -0.195 1) -0.163 1) -1.196 3)
CONSTANT 1.888 3) 0.000 1.896 3) -0.005 1.932 3) 0.001 2.015 4) 0.003
OBS. 44 44 44 44 44 44 44 44R-SQUARE 0.718 0.426 0.717 0.477 0.715 0.467 0.710 0.437ADJ. R-SQUARE 0.697 0.351 0.688 0.393 0.686 0.380 0.680 0.345DURBIN-WATSON 1.607 1.726 1.604 1.645 1.597 1.685 1.582 1.765SCHWARZ I.C. 51.922 48.217 55.704 49.421 55.643 49.742 55.272 50.640

58ECBOccasional Paper No. 43February 2006
level. This result, with all due caveats, suggeststhat a structural change (whose underlyingfactors are not identified) in the relationshipbetween Treasury yields, public deficits andthe consumer price index – a measure ofinflation – has taken place. The results arerobust when the time horizon is shortenedfurther (from 2000 onwards) and the residualsshow no autocorrelation. In a second step,when different measures of Asian Treasurypurchases were added again, the estimatesobtained did not support the view that Asianpurchases of Treasuries were responsible forthis structural change in the long-termrelationship.
When using the error correction modeltechnique to estimate the short-runrelationship, the results strongly suggest thatAsian purchases of Treasuries have an impacton changes in long-term Treasury yields,mainly because of changes in JapaneseTreasury purchases. Compared with theprevious results, Asian purchases become moreimportant in explaining changes in yields,at a 95% confidence level, whereas the
significance of the aggregate of foreign officialnet purchases of Treasuries is lower than in theextended time horizon.
According to the newly estimated coefficientsconfined to the 1999-2004 period, US ten-yearyields in the first quarter of 2005 were in therange of 40 to 50 basis points below thatpredicted by the model. However, the estimatesdo not support the view that this relativelymodest downward bias in the levels isexplained by purchases of Treasuries by Asianmonetary authorities (alone). They becomehighly significant in explaining the short-termdynamics but not the levels.
4 A MODEL TO EXPLAIN THE IMPACT OFASIAN RESERVE ACCUMULATION ONTHREE-YEAR TREASURY YIELDS
To better grasp the impact of Asian reserveaccumulation on US Treasury yields, the modelis rerun by substituting the three-year yield forthe ten-year yield in both the extended timehorizon (from 1994 onwards) and the shortertime span (from 1999 onwards). To the extent
Table 2 Regress ions for 1999-2004
(dependent variable: US ten year Treasury bond yield)
Source: Calculations provided by Banco de España.1) p<.15.2) p<.10.3) p<.05.
Period: 1999Q1-2004Q4Baseline Japan Asia Fgn. official inst.
Variable Long run Short run Long run Short run Long run Short run Long run Short run
USBBs 0.046 0.075 0.081 0.043FEDFUNDS 0.276 3) 0.206 1) 0.180 0.251 3)
PCE_core 0.369 0.264 0.360 0.265LD.BOND10Y 0.395 1) 0.297 0.251 0.453 2)
D.USBBs -0.056 0.128 0.139 -0.026D.FEDFUNDS 0.332 2) 0.252 0.263 2) 0.256 1)
D.PCE_core 0.321 0.265 0.549 1) 0.244L.residual -0.767 3) -0.771 3) -0.788 3) -0.697 3)
NP -0.230 -0.254 -0.170D.NP -0.441 3) -0.432 3) -0.307 1)
CONSTANT 3.510 3) 0.021 4.018 3) 0.046 4.000 3) 0.053 3.790 3) 0.029
OBS. 24 24 24 24 24 24 24 24R-SQUARE 0.761 0.459 0.761 0.534 0.765 0.526 0.758 0.483ADJ. R-SQUARE 0.726 0.309 0.711 0.369 0.716 0.359 0.707 0.300DURBIN-WATSON 1.661 2.012 1.450 1.819 1.507 1.869 1.599 2.027SCHWARZ I.C. 24.119 26.241 25.664 24.445 25.069 24.331 26.652 28.314

59ECB
Occasional Paper No. 43February 2006
ANNEX 6
to which central bank portfolios are thought tobe biased towards short-term maturities, theimpact of a change in the relative supply ofTreasuries (because of a captive demand from
foreign central banks) is likely to be moreimportant in this part of the yield curve than forlong-term bonds. The results are shown inTables 3 and 4.
Table 3 Regress ions for 1994-2004
(dependent variable: US ten year Treasury bond yield)
Source: Calculations provided by Banco de España.1) p<.15.2) p<.10.3) p<.05.
Period: 1994Q1-2004Q4Baseline Japan Asia Fgn. official inst.
Variable Long run Short run Long run Short run Long run Short run Long run Short run
USBBs -0.082 -0.075 -0.071 -0.089FEDFUNDS 0.810 3) 0.790 3) 0.777 3) 0.798 3)
PCE_core 0.635 3) 0.637 3) 0.674 3) 0.610 3)
LD.BOND3Y 0.168 0.216 0.175 0.195D.USBBs 0.046 0.128 0.125 0.038D.FEDFUNDS 1.081 3) 1.034 3) 1.016 3) 0.970 3)
D.PCE_core 0.061 0.030 0.189 0.001L.residual -1.048 3) -1.037 3) -1.016 3) -0.985 3)
NP -0.123 -0.143 -0.147D.NP -0.269 3) -0.263 3) -0.230 3)
CONSTANT 0.268 -0.007 0.389 -0.010 0.410 -0.005 0.384 -0.003
OBS. 44 44 44 44 44 44 44 44R-SQUARE 0.826 0.561 0.818 0.596 0.816 0.596 0.816 0.565ADJ. R-SQUARE 0.812 0.504 0.799 0.531 0.797 0.530 0.797 0.495DURBIN-WATSON 1.715 1.722 1.678 1.629 1.678 1.669 1.688 1.748SCHWARZ I.C. 53.364 52.406 56.703 53.343 56.274 52.847 56.455 55.201
Table 4 Regress ions for 1999-2004
(dependent variable: US ten year Treasury bond yield)
Source: Calculations provided by Banco de España.1) p<.15.2) p<.10.3) p<.05.
Period: 1999Q1-2004Q4Baseline Japan Asia Fgn. official inst.
Variable Long run Short run Long run Short run Long run Short run Long run Short run
USBBs 0.044 0.096 0.103 0.044FEDFUNDS 0.644 3) 0.526 3) 0.492 3) 0.623 3)
PCE_core 0.355 0.255 0.422 0.286LD.BOND3Y -0.021 0.194 0.110 0.029D.USBBs 0.036 0.163 1) 0.184 2) 0.030D.FEDFUNDS 0.819 3) 0.621 3) 0.660 3) 0.749 3)
D.PCE_core 0.150 0.138 0.541 0.101L.residual -0.830 1) -0.799 2) -0.828 2) -0.806 1)
NP -0.361 2) -0.373 2) -0.126D.NP -0.538 3) -0.533 3) -0.185CONSTANT 1.406 0.019 2.148 2) 0.050 2.058 2) 0.051 1.617 2) 0.020
OBS. 24 24 24 24 24 24 24 24R-SQUARE 0.877 0.522 0.860 0.651 0.858 0.644 0.871 0.524ADJ. R-SQUARE 0.859 0.389 0.831 0.527 0.828 0.519 0.843 0.357DURBIN-WATSON 1.704 1.861 1.378 1.742 1.490 1.885 1.682 1.918SCHWARZ I.C. 28.909 32.228 28.713 28.200 28.231 28.278 31.811 35.189

60ECBOccasional Paper No. 43February 2006
Nor surprisingly, the influence of the Fed fundson Treasury yields now becomes greater than itwas in the ten-year yield estimation, at theexpense of the role of the public deficitvariable. With regard to foreign officialpurchases, they do not play a role in explainingthree-year US Treasury interest rate levels inthe extended horizon model, but become highlysignificant (at 95% confidence) in the short-term equation, which means that they do help toexplain the dynamics of interest rate changes.
What it is particularly relevant for the aim ofthe study is that, for the latter period, estimatesare highly supportive of Asian purchases(mainly because of Japanese purchases) havingan impact on the short-end of the Treasury yieldcurve in terms of both levels and changes inlevels. Net official purchases by Japan, forexample, become statistically significant inexplaining the low levels of three-yearTreasury yields. Furthermore, changes in netpurchases are also statistically significant inexplaining changes in yields. Indeed, whencombining the results, evidence can be foundthat Japanese purchases have played a role inexplaining the low levels and dynamics ofTreasury yields.
The short-term model shows no autocorrelationof the residuals which support the statisticalsignificance of the coefficient estimated.Neither is there evidence of autocorrelation ofthe residuals in the long-term model, althoughadmittedly the Durbin-Watson in the latter isinconclusive.53 According to the estimates,Japanese purchases of US Treasuries, at thetime of the greatest net purchases, might havehad an impact of 65 basis points on three-yearUS Treasury yields. The fact that no impact wasfound in the ten-year maturity is consistentwith the principle of imperfect substitutionamong US Treasuries of different maturitiesalong the yield curve.
5 IMPACT ON OTHER ASSET PRICES
This section tries to assess whether the demandfor US securities by Asian central banks had
any relevant implication on asset prices otherthan US Treasuries.54 The analysis focusesmainly on US corporate and US agency debtand very briefly touches on the equity segment.Asian central bank purchases of US securitiescan have an impact on these asset prices via twochannels: i) the direct consequences of Asiancentral bank purchases of agencies, corporatebonds and equity in the relative supply in thesesegments, and ii) the indirect effects of Asiancentral bank purchases of US Treasuries in theagency, corporate and equity markets.55 Thefirst consequences stem from the effects thedemand for US agency and corporate debt andequity by Asian central banks can have on thelevel and dynamics of the prices of these assetsin their own markets. Regarding US corporateand agency debt, and equity, the possible directimpact of the captive demand arising fromAsian central banks purchases does not seemto be very clear. The amount of agency andcorporate bonds and equity bought by officialforeigners is still small, both in absolute termsand when looking at their share in theirrespective markets. Adding to the directimpact, there can be second-round effects. Theindirect consequences would reflect the roleUS Treasury debt plays in other asset markets.On the one hand, agency and corporate debtmarkets have developments in the Treasurymarket as a benchmark and their respective
53 The results are in line with those obtained by Kasman andMalik (2004), even if the data source used to account forAsian reserve accumulation (TIC data) is different to theirs(Fed holdings data).
54 Besides the asset prices reviewed, the fact that, in the equitymarket, foreign off icial purchases have a very small weightin total foreign purchases (2% on average since January1994) should also be taken into account. According toholdings data, foreign investors have only 9% of US equityand off icial institutions represent 7% of this (so theyrepresent only 0.6% of the US equity market). Furthermore,the assumption made earlier that total off icial purchases area good proxy for Asian central bank purchases no longerholds in the equity segment, where the share of Asianinstitutions in purchases and holdings of US equity is verylimited.
55 As no data on off icial foreign purchases by type of asset witha country (or regional) breakdown are available, purchasesby all off icial institutions were used, as a proxy to Asiancentral bank purchases. The error induced by includingoff icial investors from other areas should not be signif icant,as monetary authorities from areas other than Asia have atiny share of off icial purchases and holdings of USsecurities.

61ECB
Occasional Paper No. 43February 2006
ANNEX 6
yields are highly positively correlated. On theother hand, if we assume that the differentmarkets are not segmented, an increase inpurchases of treasuries may, in theory, divertinvestment from other markets.
CORPORATE DEBTIn the corporate segment, foreign officialpurchases make up only a small proportion oftotal foreign purchases56 (2% on average sinceJanuary 1994). In terms of holdings, officialinstitutions hold only 2% of total foreignholdings of corporate bonds; furthermore,foreign-owned corporate debt represents 16%of US corporate bonds outstanding.57 Thus, thepotential direct impact of foreign officialpurchases of corporate bonds on prices is rathersmall. Official investors’ behaviour is usuallyclosely monitored by market participants as theformer are often viewed as “special” agentsthat have unusual utility functions and canproduce specific impacts on markets. In orderto assess if the behaviour of official investorscan, in fact, be differentiated, one can try toidentify some drivers of official and non-official corporate purchases by computingcorrelation coefficients.58 Two differentperiods were considered: since 1994 and since1999. Actual evidence of the existence ofdifferent factors playing a major role in thedynamics of these two variables is limited. Inparticular since 1999, correlation coefficientsbetween the US dollar, corporate yields,corporate spreads and risk appetite, and officialand non-official corporate purchases byforeigners are very similar.59 Comparablecalculations were made using shortermaturities (two and three years) for corporateand Treasury yields and the conclusions arevery similar. Another approach to test whetherofficial purchases have a relevant role inexplaining corporate debt price developmentsis by running a regression. By running simpleregressions, based mainly on market data,little evidence could be found that “officialcorporate purchases” are statisticallysignificant.60 The very small share of totalcorporate debt demand held by foreign officialpurchases may explain this result.61 Another
hypothetical impact is the effect of the lowinterest rate environment on the soundness ofUS companies. The generalised improvementin the balance sheets of many US companieshas almost certainly had a positive impact oncorporate spreads. This is, however, moredifficult to model and goes beyond the scope ofthis note.
AGENCY DEBTRegarding the agency segment, official foreignpurchases do seem to hold a greater share offoreign activity than in the corporate market.62
According to TIC data, official purchasesrepresent, on average, 12% of all foreignpurchases since January 2003 and 15% sinceJanuary 1994. However, their weight in theagency market is still small. According toTreasury holdings data, in June 2003 officialholdings were 31% of total foreign holdingsand foreign-owned US government agencybonds represented around 11% of outstandingdebt (so they represent 3.5% of outstanding USgovernment agency bonds).
56 Data on flows are from the US Treasury’s InternationalCapital System (TICS).
57 As of June 2003, US Treasury Annual Survey of ForeignHoldings of US Securities, June 2004.
58 Correlation coeff icients between off icial and non-off icialcorporate purchases and an effective exchange rate index ofthe US dollar, ten-year corporate yields, spreads betweenten-year corporate yields and Treasury yields, and a proxyfor investors risk appetite (the Global Risk Appetite Index ascomputed by CSFB) were computed.
59 Correlation coeff icients must be carefully interpreted andused prudently as f inancial data usually do not fully complywith normality conditions (see Lehman Brothers, 2005).
60 Interestingly, there is some evidence that “off icial Treasurypurchases” might have some influence on corporate spreads(this could be justif ied by the indirect impact of thealternative investments argument).
61 It should be highlighted that the simple models run, basedmainly on market data, tend to give poor results and are notstatistically very robust.
62 To monitor this segment there are two main data sources: USTreasury TIC data and Custody Holdings at the FederalReserve Bank of New York. Comparing changes in theamount of agency bonds held in custody and purchases byoff icial foreign institutions (TIC data), the two sources showgreat differences both in terms of amounts and trends. Evenwhen smoothing for yearly data, different trends can beidentif ied. According to UBS (2005), the Fed data are“considered to be more reliable at identifying trends amongoff icial accounts”. However, custody data have only beenavailable since 2000, limiting their use for a comparativeanalysis between the period since 1994 and the period afterthe increasing reserve accumulation process took place.

62ECBOccasional Paper No. 43February 2006
First, several correlation coefficients werecomputed between official and non-officialpurchases, and an effective exchange rate indexof the US dollar, ten-year agency yields, ten-year agency spreads and a proxy for investors’risk appetite63, trying to identify whetherofficial and non-official foreign investorsexhibit different behaviour.
Correlation coefficients computed with datasince 1994 do not point to different behaviourfrom the two kinds of investors. Correlationswith data from 2000 are not so uniform.Regarding agency yields and agency spreads, itis interesting to highlight that, although datafrom the TIC could lead to the conclusion thatthere is different behaviour, if we use thecustody data as a proxy to official institutions,the correlation coefficients became negative(as with TIC non-official purchases).64 All inall, there is only limited actual evidence ofdifferentiated behaviour on the part of officialand non-official investors.
In a second step several regressions were run,relating agency spreads with risk appetite,growth indicators, and demand and supply onagency and Treasury markets. These simpleregressions based on market data did not entailthe use of advanced econometric methods. Theresulting evidence is not enough to support theview that official purchases of agencies arestatistically significant in explaining agencyspread behaviour (using both long and short-term yields).65 Developments seen recently inthe agency market, with several accountingproblems arising in the main government-sponsored enterprises, may also haveintroduced some instability into the dynamicsof this segment.
ANNEX 7THE FINANCING OF THE US CURRENT ACCOUNTDEFICIT: A SHORT REVIEW OF THE LITERATUREAND SOME EVIDENCE66
1 BACKGROUND
“The counterpart to current account surplusesin Asia and the purchases of foreign exchangeassets denominated in US dollars has beenlarge US current account deficits. Persistentdeficits are reflected in a negative USinternational investment position, implying theUnited States has become a net debtor country.While these imbalances should in principlereflect the use of financial markets to allocateworld savings towards the most profitableinvestment opportunities, it is likely that thereis a limit to the amount of debt that a givencountry can issue before international investorsbegin to worry about its willingness to repaythe debt. If the country in question is the UnitedStates, which issues the international reservecurrency, then the rapid accumulation of assetsdenominated in the reserve currency mightresult in nominal exchange rate swings thatwould be much larger than those needed for anorderly rebalancing of asset positions. Thiscould have negative implications forinternational financial stability.” (King 2005).The quotation shows how the growing UScurrent account deficit has become a source ofconcern for policy-makers, and raises thequestion about what could happen ifinternational investors were to reduce theirpurchases of assets denominated in US dollars.
This annex is organized as follows. In Section 2a few selected contributions on thesustainability of the US current account deficitare reviewed, while section 3 contains a
63 Global Risk Appetite Index computed by Credit Suisse FirstBoston.
64 The conclusions are very similar if shorter maturities (twoand three years) are used for agency and Treasury yields.
65 These conclusions should be used carefully as the simplemodels run tend to give poor results and are not statisticallyvery robust.
66 By F. Comelli (European Central Bank) and M. Ghirga(Banca d’Italia).

63ECB
Occasional Paper No. 43February 2006
ANNEX 7
descriptive analysis of the data on the financingof the US current account deficit.
2 REVIEW OF THE LITERATURE, AND LINKSWITH CURRENT POLICY ISSUES
Blanchard, Giavazzi and Sa (2005) havedeveloped a partial equilibrium portfoliomodel of exchange rate and current accountdetermination. They assume imperfectsubstitutability both between US and foreigngoods and between US and foreign assets,which allows the presence of goods andportfolio shifts. In their model, the dollar ispredicted to depreciate further in the absence ofany unexpected events. This is because furthershifts in investors’ preferences towards dollarassets would provide only temporary relief forthe currency, as higher demand for US assetswould lead to an initial dollar appreciation, butthe consequent deteriorating competitivenessof the United States would widen the currentaccount deficit and increase the accumulationof foreign debt. Thus, the authors consider thatthe argument according to which the UnitedStates – thanks to the attractiveness of its assets– can keep running large current accountdeficits with no effect on the dollar appears tooverlook the long-term consequences of a largeaccumulation of external liabilities. Similarly,an increase in US interest rates wouldtemporarily strengthen the dollar, buteventually the depreciation needed to restoreequilibrium in the current account would beeven larger, both because the accumulation offoreign liabilities would accelerate andbecause eventually the United States wouldneed to finance a larger flow of interestpayments abroad as both interest rates and debtwould be higher. The policy conclusion is thatfiscal consolidation is needed in order toinduce lower interest rates in the United States.This would allow the potentially higher interestrates required by foreigners to invest in theUnited States to be offset in the presence ofdollar depreciation. In other words, fiscaltightening is needed to reduce the currentaccount deficit, but it is not a substitute fordollar depreciation – both are needed. This
policy recommendation is very similar to thatformulated by the IMF (2005a). In the April2005 issue of the World Economic Outlook, theIMF suggests that a reduction in globalimbalances will require domestic demand togrow more slowly than GDP in the UnitedStates, and to grow faster than GDP in surpluscountries. This will likely need to beaccompanied by a further depreciation of thedollar over the medium term, a tightening of USfiscal policy, and appreciation in a number ofemerging Asia economies.
Gourinchas and Rey (2004) highlight theimportance of valuation effects throughexchange rate changes in improving the netexternal assets position of the United States.They find that, historically, an average of 31%of the international adjustment of the UnitedStates is realised through valuation effects,while 56% is realised through movements infuture net exports. Therefore, valuation effectscan be relevant for the external adjustmentprocess. By absorbing about 31% of theexternal imbalances, valuation effectssubstantially relax the external budgetconstraint of the United States. At short tomedium horizons, most of the adjustment goesthrough asset returns, while at longer horizonsit occurs via the trade balance. It follows thatthe dynamics of the exchange rate play a majorrole in the model since it has the dual role ofchanging the differential in rates of returnbetween assets and liabilities denominated indifferent currencies and also of affecting futurenet exports. The main policy implication ofthe paper is that, as financial globalisationincreases, the United States could be ableto run larger and more substantial externalimbalances, provided foreign investors arewilling to accumulate further holdings ofdepreciating dollar-denominated liabilities.
By contrast, Lane and Milesi-Ferretti (2004)argue that it is problematic to rely only onvaluation effects to address adjustmentproblems. Even for those countries for which aone-off surprise devaluation may indeedgenerate a positive valuation effect that

64ECBOccasional Paper No. 43February 2006
improves the net foreign asset position, such amove would involve a reputation cost: foreigninvestors in the future would require a largerpremium in order to compensate for the risk ofsubsequent devaluations. The classic time-consistency problem arises, and the standardpolicy recommendation is that policy-makersshould take steps to commit to not using thedevaluation option as a form of capital levy.While the severity of this problem is one of theunderlying factors behind the prevalence ofliability dollarisation and short-maturity debtamong the emerging market economies, it mayalso be relevant for debtor industrialeconomies.
Obstfeld and Rogoff (2004) argue that thewidening of the US current account deficit maypotentially trigger a sharp depreciation of thedollar. Unlike Gourinchas and Rey (2005), theauthors focus their discussion not on theconsequences of growing international capitalmarket integration, but on the relative pricemovements needed to preserve goods-marketequilibrium during the current accountadjustment. The authors find that, in a generalequilibrium framework, a rebalancing of theUS current account deficit may involve a trade-weighted dollar depreciation of at least 20% inthe baseline scenario, while in a more extremescenario the trade-weighted depreciation couldamount to 40%. The policy implication is thatthe US current account adjustment would beachieved through the trade channel and notthrough valuation effects. The growingintegration of world capital markets may atmost delay the US current account adjustment,but it is likely that a sharp closing of the currentaccount will eventually lead to large exchangerate adjustments.
Debelle and Galati (2005) examine episodes ofcurrent account adjustments in industrialcountries over the last 30 years. They foundthat adjustments were generally associatedwith large declines in domestic growth andexchange rate depreciation. From an ex-postperspective they also found that the bulk of thefinancial account adjustment is achieved
through a change in private sector capitalflows. The US constitutes an importantexception. A comparison of the current accountreversal experienced by the United States in1987 with episodes of current accountadjustment in other industrial countries showsthat the role played by foreign official flowswas much more significant in the USadjustment than in other countries. Finally,since the dollar is an international reservecurrency, this implies that the US internationalinvestment position can benefit from positivevaluation effects on net foreign liabilities.Summing up, the analysis of Debelle and Galatisuggests that, in view of a potential currentaccount adjustment in the United States,foreign official capital flows can play animportant role in the adjustment process.Finally, according to the Bank for InternationalSettlements (2004b), an empirical analysis ofthe financial flows associated with currentaccount adjustments since the mid-1970sreveals sizeable swings in a number ofcategories of capital flows during adjustmentepisodes. Nonetheless, an analysis of theexperience in the United States around 1987suggests that the pattern of adjustment of thepresent US external imbalance cannot bepredicted with confidence. But changes in thecomposition of financial flows into the UnitedStates might suggest that the private sector isbecoming less willing to finance the US currentaccount deficit, and this could imply that anadjustment of the current account deficit mightbe happening sooner rather than later.
Recently the policy debate has focused onvaluation effects on the US internationalinvestment position (IIP) and on the possibleerosion of home bias in financial markets.Gourinchas and Rey’s predictions seem to be inline with the data released by the US Bureau ofEconomic Analysis (BEA) on the US IIP at theend of 2004. According to the BEA, the US IIPat the end of 2004 was USD 2.54 trillion, upfrom USD 2.37 trillion at the end of 2003.Valuation gains (USD 415 billion) limited thedeterioration of the US IIP by offsetting mostof the increase in net capital inflows (USD 590

65ECB
Occasional Paper No. 43February 2006
ANNEX 7
billion). Specifically, valuation gains wereaccounted for by asset price changes of aroundUSD 145 billion and by exchange rate effectsof around USD 270 billion. Asset price changesreflected relative underperformance of the USstock market compared with major foreignstock markets, which raised the value of US-owned equity holdings abroad more than thevalue of foreign-owned equity holdings in theUnited States. Exchange rate effects were dueto the nominal depreciation of the US dollaragainst most foreign currencies. The dollarnominal depreciation raised the dollar value ofUS-owned assets abroad, which are mainlydenominated in foreign currencies (whileforeign-owned assets in the United States aredenominated in US dollars). Naturally,everything else being equal, a potentialnominal appreciation of the US dollar during2005 would lead to valuation losses for the IIP.According to past internal work, the expectedrise in US interest rates and its interaction withincreasing stock of foreign-owned US debtwould have a significantly negative effect onthe US balance on income in the coming years.In a reasonably conservative scenario, theanalysis shows that the US balance on incomecould become negative by 2006 and contributeby 0.4% of GDP to the US current accountdeficit in 2007.
The issue of home bias has been discussedrecently by the IMF (2005b and d).
Specifically, the increase in foreign holdings ofUS liabilities since 1990 was motivated both bygrowth of US financial markets and by anerosion of the home bias, so that investors havebecome increasingly willing to hold moreforeign assets relative to domestic assets.However, according to IMF staff calculations,global asset portfolios do not appear to besignificantly overweight in US assets, relativeto the United States’ benchmark share inan internationally diversified portfolio. Thisimplies that the exposure of foreign investorsto US assets may still rise and that the US IIPmay deteriorate again, possibly offsettingpotential positive valuation effects.
3 A DESCRIPTIVE ANALYSIS OF US CURRENTACCOUNT DEFICIT FINANCING
Table 1 shows data from the Flow of FundsAccounts of the United States, compiled by theBoard of Governors of the Federal ReserveSystem. The table shows that the US currentaccount deficit in 2004 was USD 641 billion,equivalent to approximately 5.5% of GDP. Thecounterpart of the US current account deficitis the deteriorating international investmentposition of the United States, which at the endof 2004 was equal to USD -630.8 billion.Therefore, in 2004 net capital inflows fromforeign investors were USD 630.8 billion,while the remaining USD 11.8 billionaccounted for the statistical discrepancy
1995 1996 1997 1998 1999 2000 2001 2002 2003 2004
Foreign income fromthe United States 1,137.2 1,217.7 1,352.2 1,430.4 1,586.0 1,875.6 1,725.7 1,764.4 1,886.1 2,217.0Foreign outlays tothe United States 1,046.2 1,117.3 1,242.1 1,243 1,312.1 1,479.0 1,355.3 1,306.8 1,375.3 1,575.7Total savings 91.0 100.4 110.1 187.4 273.9 396.6 370.4 457.6 510.8 641.3
Net acquisition of financial assets 419.2 521.8 597.3 393.4 708.5 963.0 657.7 741.7 783.0 1,190.1Net increase in liabilities 333.8 384.8 377.0 318.4 476.8 486.7 242.7 172.7 240.4 559.4Non-produced financial assets 0.2 -0.1 -0.1 0.0 0.0 0.0 0.1 0.0 0.1 0.1
Total investment 85.6 136.9 220.2 75.0 231.7 476.0 415.1 569.0 542.8 630.8Discrepancy 6.5 -36.0 -109.1 113.1 47.0 -78.9 -43.6 -110.1 -28.8 11.8
Memo:US current account deficit 91.0 100.4 110.2 187.4 273.9 396.6 370.4 457.7 510.9 641.3
Table 1 Flow of Funds Accounts of the United States and the Rest of the World – FederalReserve System(USD billions; March 2005)
Source: Federal Reserve System.

66ECBOccasional Paper No. 43February 2006
between the current account and financialaccount balances.67
Chart 13 shows the amounts of net financialinvestment made by foreign investors in theUnited States from 1995 onwards. The amountof net financial investment by foreignersmeasures the amount of net private capitalinflows that the United States has beenreceiving from foreign investors and isexpressed as the difference between the netacquisition of financial assets by foreigninvestors and their net liabilities. The UnitedStates has been progressively receivinggrowing net capital inflows from foreigninvestors. Chart 14 shows that in 2004 foreigninvestors were net buyers of credit-marketinstruments, which include open market paper,US Treasury securities, US GovernmentAgency bonds, corporate bonds and loansto US corporate businesses. From 2000 until2004, credit market instruments appear to havebeen the preferred asset category of foreigninvestors. During the same period, foreigninvestors were also net buyers of cash-typeinstruments, which include net interbankassets, bank deposits and security repurchaseagreements. The data also show that, in netterms, foreign investors were net sellers of USequities in 2003 and 2004. Finally the chart
Chart 14 Financial investment by foreignersin the United States: breakdown by assetc lasses(USD billions)
Source: Federal Reserve System.
-600
-400
-200
0
200
400
600
800
1,000
1,200
-600
-400
-200
0
200
400
600
800
1,000
1,200
1980 1984 1988 1992 1996 2000 2004
cash-type instrumentsequitiescredit market instruments miscellaneous assets
Chart 13 Net f inancial investment byforeigners in the United States
(USD billions)
Source: Federal Reserve System.
-600
-400
-200
0
200
400
600
800
1,000
1,200
-600
-400
-200
0
200
400
600
800
1,000
1,200
rest of the world total financial liabilitiesrest of the world total financial assetsrest of the world net financial investment
1980 1984 1988 1992 1996 2000 2004
67 These data are broadly consistent with the balance ofpayments data produced by the US Department ofCommerce.
shows the amount of miscellaneous assets,which include direct investments, bank loansand trade credits.
In terms of the category of investors, mostof the US current account deficit financingwas provided by foreign private investors.Nevertheless, foreign official investors havebeen progressively more involved in financingthe US current account deficit. Specifically,from 1999 onwards foreign official investorspurchased growing amounts of US securities,in particular Treasury and Government agencybonds. In 2004 foreign official investorspurchased a total amount of USD 290 billion ingovernment securities, which constitutes asubstantial increase compared with their 2003purchases of USD 194.6 billion.

67ECB
Occasional Paper No. 43February 2006
REFERENCES
REFERENCES
Aizenman, J. and N. Marion (2003), “The High demand for International Reserves in the Far East:What is Going on?”, Journal of the Japanese and International Economies, 2003, 17/3,pp. 370-400.
Artus, P. (2005), “Quel est l’effect des interventions de change sur les taux d’intérêt à long termedes Etats-Unis ?”, CDC IXIS Flash.
Bahmani-Oskooee, M. and F. Brown (2002), “Demand for international reserves: A reviewarticle”, Applied Economics 34:129-1227.
Bank for International Settlements (2000), “Special feature: hedge funds”, Quarterly Review,November 2000, Basel, Switzerland.
Bank for International Settlements (2003a), “Choosing instruments in managing dollar foreignexchange reserves”, by R. N. McCauley and B. S. C. Fung, Quarterly Review, March 2003,Basel, Switzerland.
Bank for International Settlements (2003b), “Reaching for yield: selected issues for reservemanagers”, by E. M. Remolona and M. A. Schrijvers, Quarterly Review, September 2003,Basel, Switzerland.
Bank for International Settlements (2004), 74th Annual Report, pp. 99-107, Basel, Switzerland.
Bank for International Settlements (2005a), “The International Banking Market”, QuarterlyReview: International Banking and Financial Market Developments, December 2005, Basel,Switzerland.
Bank for International Settlements (2005b), “Trading Asian currencies”, by C. Ho, G. Ma andR. McCauley, Quarterly Review, March 2005, Basel, Switzerland.
Bank for International Settlements (2005c), “1. Overview: low yields in robust economies”, byF. Packer and P. D. Woolridge, Quarterly Review, March 2005, Basel, Switzerland.
Bernanke, B. S. (2005), “The Global Saving Glut and the U.S. Current Account Deficit”, HomerJones Lecture, St. Louis, Missouri, 14 April 14 2005.
Bernanke, B. S., V. Reinhart and P. Sack (2004), “Monetary Policy Alternatives at the ZeroBound: An Empirical Assessment”, Brookings Papers on Economic Activity, 2, pp. 1-100.
Blanchard, O., F. Giavazzi and F. Sa (2005), “The US Current Account and the Dollar”, NBERWorking Paper No 11137, NBER, Cambridge, Massachusetts, USA.
Crockett, A. (1978), “Control over international reserves”, IMF Staff Papers 25:1-25.
De Beaufort Wijnholds, J. Onno and A. Kapteyn (2001), “Reserve adequacy in emerging marketeconomies”, IMF Working Paper WP/01/43, Washington, D.C.

68ECBOccasional Paper No. 43February 2006
Debelle, G. and G. Galati (2005), “Current account adjustment and capital flows”, BIS WorkingPaper No 169, February 2005, Bank for International Settlements, Basel, Switzerland.
Deutsche Bank (2005), “The Bond Puzzle”, Global Markets Research.
Dooley, M., D. Folkerts-Landau and P. Garber (2003), “An essay on the revived Bretton Woodssystem”, NBER Working Paper No 9971.
Edwards, S. (2004), “Thirty years of current account imbalances, current account reversals, andsudden stops”, IMF Staff Papers 51:1-49.
Eichengreen, B. (1998), “The Euro as a reserve currency”, Journal of the Japanese andInternational Economies.
Eichengreen, B. (2004), “Global imbalances and the lessons of Bretton Woods”, NBER WorkingPaper No 10497.
Eichengreen, B. (2005), “Sterling’s past, dollar future: historical perspectives on reservecurrency composition”, NBER Working Paper No 11336.
European Central Bank (2005), “Review of the international role of the euro”.
Evans, M. and R. Lyons (2002), “Order flow and exchange rate dynamics”, Journal of PoliticalEconomy, Vol. 110, No 1, 2002.
Federal Reserve Bank of New York (1998), “Foreign Ownership of U.S. Treasury Securities:What the Data Show and Do Not Show”, Current Issues in Economics and Finance, May 1998.
Federal Reserve Bank of San Francisco Economic Letter (2005), “The Long-Term Interest RateConundrum: Not Unraveled Yet?”
Friedman, B. and K. Kuttner (1998), “Indicator properties of the Paper-Bill Spread: Lessons fromRecent Experience”, Review of Economics and Statistics, 80, February.
García, P. and C. Soto (2004), “Large hoarding of international reserves: Are they worth it?”,Central Bank of Chile Working Paper No 299.
Garton, P. (2005), “Foreign reserve accumulation in Asia: Can it be sustained?”, mimeo.
Garzarelli, F. (2004), “How much is Asian buying worth?”, Goldman Sachs, December 2004.
Genberg, H., R. McCauley, Y. C. Park and A. Persaud (2005), “Official reserves and currencymanagement in Asia: Myth, reality and the future”, Geneva Reports on the World Economy,ICMB, CEPR.
Glick, R. and M. M. Hutchison (2005), “Capital controls and exchange rate instability indeveloping economies”, Journal of International Money and Finance, 24:387-412.

69ECB
Occasional Paper No. 43February 2006
REFERENCES
Goldman Sachs (2004), “How much is Asian buying worth?”, by F. Garzarelli, Global marketsresearch daily, 9 December 2004.
Goldman Sachs (2005a), “Exuberant Reserve Accumulation”, Global Viewpoint, 13 April 2005.
Goldman Sachs (2005b), “Asian Central Bank Buying – the Beginning of the End?”, GlobalViewpoint, 20 April 2005.
Goldman Sachs (2005c), Global Economics Paper No 124, May.
Gourinchas, P.-O. and H. Rey (2005), “International Financial Adjustment”, mimeo.
Hauner, D. (2005), “A fiscal price tag for international reserves”, IMF Working Paper WP/05/81,Washington, D.C.
Higgins, M. and T. Klitgaard (2004), “Reserve accumulation: Implications for global capitalflows and financial markets”, in “Current Issues in Economics and Finance”, Federal ReserveBank of New York.
Hortacsu and Sareen (2005), “Order flow and the formation of dealer bids: information flows andstrategic behaviour in the government of Canada securities auctions”, NBER working paperNo 11116.
Iankova, Lefeuvre and Teiletche (2004), “Un modèle de détermination économique des tauxd’intérêt”, CDC IXIS Flash, April 2004.
International Monetary Fund (2003), “Are foreign exchange reserves in Asia too high?”, WorldEconomic Outlook, September 2003, Washington, D.C.
International Monetary Fund (2004), “Guidelines for foreign exchange reserve management”,Washington, D.C.
International Monetary Fund (2005a), “Norway: Selected Issues”, IMF Country ReportNo 05/197, June 2005, Washington, D.C.
International Monetary Fund (2005b), “Globalization and external imbalances”, World EconomicOutlook, April 2005, Washington, D.C.
International Monetary Fund (2005c), “Annual Report 2005”, Washington, D.C.
International Monetary Fund (2005d), “United States: Selected Issues”, IMF Country ReportNo 05/258, July 2005, Washington, D.C.
JP Morgan (2004), “The Asian currency-policy link to US interest rates”, by B. Kasman andH. Malik, US fixed income markets weekly, February 2004.
Kasman, B. and H. Malik (2004), “Special topic: the Asian currency-policy link to the US interestrates”, JP Morgan fixed income strategy, February 2004.

70ECBOccasional Paper No. 43February 2006
Kawai, M. (1998), “The East Asian currency crisis: Causes and lessons”, ContemporaryEconomic Policy 16:157-172.
Kim, Y. (2000), “Causes of capital flows in developing countries”, Journal of InternationalMoney and Finance 19:235-253.
King, M. (2005), “The International Monetary System”. Remarks at “Advancing Enterprise2005” conference, London, 4 February 2005.
Lane, P. and G. M. Milesi-Ferretti (2004), “Financial globalization and exchange rates”,prepared for the “Dollars, Debt and Deficits–60 Years After Bretton Woods” InternationalConference co-organised by the Banco de España and the International Monetary Fund,Madrid, 12-14 June 2004.
Lane, P. R. and D. Burke (2001), “The empirics of foreign reserves”, Open Economics Review12:423-434.
Lehman Brothers (2005), “Correlation Risks: A Primer”, April 2005.
Lindert, P. (1969), “Key currencies and gold (1900–1913)”, International Finance Section,Department of Economics, Princeton University, 1969.
Ma, G. and R. McCauley (2003), “Opening China’s capital account amid ample dollar liquidity”,BIS Working Paper No 15, February 2003.
McCauley, R. and G. Jiang (2004), “Treasury yields and foreign official holdings of IS bonds”,BIS Quarterly Review, March 2004.
McKinnon, R. and G. Schnabl (2003), “The East Asian Dollar Standard, Fear of Floating andOriginal Sin”, mimeo.
Merrill Lynch (2005), “The Changing Role of Central Bank Reserves (Part I and II)”, EmergingMarkets Daily, February 2005.
Mody, A. and A. P. Murshid (2005), “Growing up with capital flows”, Journal of InternationalEconomics 65:249-266.
Moëc, G. and L. Frey (2005), “An econometric quantification of the impact of purchases of USTreasury securities by the foreign official sector on long-term yields in the United States”,Banque de France, February 2005.
Monetary Authority of Singapore (2001), “Monetary Policy Operations in Singapore”, January2001.
Nomura (2004), “¥en alert”, Japan Insight, 4 November 2004.
Obstfeld, M. and K. Rogoff (2004), “The Unsustainable US Current Account Position Revisited”,prepared for the NBER conference on “G-7 Current Account Imbalances: Sustainability andAdjustment”, 12-13 July 2004.

71ECB
Occasional Paper No. 43February 2006
REFERENCES
People’s Bank of China (2005), “Public Announcement of the People’s Bank of China onReforming the RMB Exchange Rate Regime”, 21 July 2005.
Prasad, E. S., T. Rumbaugh and Q. Wang (2005), “Putting the cart before the horse? Capitalaccount liberalization and exchange rate flexibility in China”, IMF Working Paper PDP/05/1,Washington, D.C.
Pringle, R. and N. Carver (eds.) (2003), “How countries manage reserve assets”, Central BankingPublications, London.
Pringle, R. and N. Carver (eds.) (2005), “Trends in reserve management – survey results”, TheRoyal Bank of Scotland, Reserve Management Trends 2005, Central Banking Publications,London.
Pritsker, M. (2002), “Large investors and liquidity: a review of the literature”, Paper preparedfor the third joint central bank research conference on risk measurement and systemic risk,7-8 March 2002, Basel.
Pritsker, M. (2002), “Large investors: implications for equilibrium assets returns, shockabsorption and liquidity”, Board of Governors of the Federal Reserve System, 9 October 2002.
Rigaudy, J.-F. (2005), “Ten years of reserve management”, The Royal Bank of Scotland ReserveManagement Trends 2005, Central Banking Publications, London.
Rodrick, D. and A. Velasco (1999), “Short-term Capital Flows”, NBER Working Paper No 7364.
Rogoff, K. S., A. M. Hussain, A. Mody, R. Brooks and N. Oomes (2004), “Evolution andperformance of exchange rate regimes”, IMF Occasional Paper 229, Washington, D.C.
Roley, V. (1982), “The Effect of Federal Debt-Management Policy on Corporate Bond and EquityYields”, Quarterly Journal of Economics, 97.
Roubini, N. and B. Setser (2005), “Will the Bretton Woods 2 Regime Unravel Soon?”, Symposiumon the “Revived Bretton Woods System: A New Paradigm for Asian Development?”, FederalReserve Bank of San Francisco and UC Berkeley, San Francisco, 4 February.
Skancke, M. (2003), “Fiscal Policy and Petroleum Fund Management in Norway”, in FiscalPolicy Formulation and Implementation in Oil-Producing Countries, edited by J. M. Davis,R. Ossowski, and A. Fedelino, International Monetary Fund, Washington, D.C.
The Bond Market Association (2005), “Research Quarterly”, February, New York.
Warnock, F. E. and V. C. Warnock (2005), “International Capital Flows and U.S. Interest Rates”,International Finance Discussion Papers, Number 840, September 2005, Board of Governorof the Federal Reserve System, Washington, D.C.
Wei, B. (2004), “China’s Macro-economy and Foreign Exchange Administration underGlobalization”, HSBC’s 14th Global Central Bank Symposium, 24-28 October 2004, Beijing.

72ECBOccasional Paper No. 43February 2006
Wong, C. H. and L. Carranza (1999), “Policy responses to external imbalances in emergingmarket economies: Further empirical results”, IMF Staff Papers 46:225-237, Washington,D.C.
UBS Investment Research (2005), “Special Report: Foreign Flows: What in the world is goingon?”, 31 January 2005.
US Treasury (2004), “Annual Survey of Foreign Holdings of US Securities”, June 2004.
US Treasury (2005), “Report on foreign portfolio holdings of US securities”, June 2004.

73ECB
Occasional Paper No. 43February 2006
L I S T O FOCCAS IONAL
PAPERSEUROPEAN CENTRAL BANKOCCASIONAL PAPER SERIES
1 “The impact of the euro on money and bond markets” by J. Santillán, M. Bayle andC. Thygesen, July 2000.
2 “The effective exchange rates of the euro” by L. Buldorini, S. Makrydakis and C. Thimann,February 2002.
3 “Estimating the trend of M3 income velocity underlying the reference value for monetarygrowth” by C. Brand, D. Gerdesmeier and B. Roffia, May 2002.
4 “Labour force developments in the euro area since the 1980s” by V. Genre andR. Gómez-Salvador, July 2002.
5 “The evolution of clearing and central counterparty services for exchange-tradedderivatives in the United States and Europe: a comparison” by D. Russo,T. L. Hart and A. Schönenberger, September 2002.
6 “Banking integration in the euro area” by I. Cabral, F. Dierick and J. Vesala,December 2002.
7 “Economic relations with regions neighbouring the euro area in the ‘Euro Time Zone’” byF. Mazzaferro, A. Mehl, M. Sturm, C. Thimann and A. Winkler, December 2002.
8 “An introduction to the ECB’s survey of professional forecasters” by J. A. Garcia,September 2003.
9 “Fiscal adjustment in 1991-2002: stylised facts and policy implications” by M. G. Briotti,February 2004.
10 “The acceding countries’ strategies towards ERM II and the adoption of the euro:an analytical review” by a staff team led by P. Backé and C. Thimann and includingO. Arratibel, O. Calvo-Gonzalez, A. Mehl and C. Nerlich, February 2004.
11 “Official dollarisation/euroisation: motives, features and policy implications of currentcases” by A. Winkler, F. Mazzaferro, C. Nerlich and C. Thimann, February 2004.
12 “Understanding the impact of the external dimension on the euro area: trade, capital flows andother international macroeconomic linkages“ by R. Anderton, F. di Mauro and F. Moneta,March 2004.
13 “Fair value accounting and financial stability” by a staff team led by A. Enria and includingL. Cappiello, F. Dierick, S. Grittini, A. Maddaloni, P. Molitor, F. Pires and P. Poloni,April 2004.
14 “Measuring Financial Integration in the Euro Area” by L. Baele, A. Ferrando, P. Hördahl,E. Krylova, C. Monnet, April 2004.

74ECBOccasional Paper No. 43February 2006
15 “Quality adjustment of European price statistics and the role for hedonics” by H. Ahnert andG. Kenny, May 2004.
16 “Market dynamics associated with credit ratings: a literature review” by F. Gonzalez, F. Haas,R. Johannes, M. Persson, L. Toledo, R. Violi, M. Wieland and C. Zins, June 2004.
17 “Corporate ‘Excesses’ and financial market dynamics” by A. Maddaloni and D. Pain, July 2004.
18 “The international role of the euro: evidence from bonds issued by non-euro area residents” byA. Geis, A. Mehl and S. Wredenborg, July 2004.
19 “Sectoral specialisation in the EU a macroeconomic perspective” by MPC task force of theESCB, July 2004.
20 “The supervision of mixed financial services groups in Europe” by F. Dierick, August 2004.
21 “Governance of securities clearing and settlement systems” by D. Russo, T. Hart,M. C. Malaguti and C. Papathanassiou, October 2004.
22 “Assessing potential output growth in the euro area: a growth accounting perspective”by A. Musso and T. Westermann, January 2005.
23 “The bank lending survey for the euro area” by J. Berg, A. van Rixtel, A. Ferrando,G. de Bondt and S. Scopel, February 2005.
24 “Wage diversity in the euro area: an overview of labour cost differentials acrossindustries” by V. Genre, D. Momferatou and G. Mourre, February 2005.
25 “Government debt management in the euro area: recent theoretical developments and changesin practices” by G. Wolswijk and J. de Haan, March 2005.
26 “The analysis of banking sector health using macro-prudential indicators” by L. Mörttinen,P. Poloni, P. Sandars and J. Vesala, March 2005.
27 “The EU budget – how much scope for institutional reform?” by H. Enderlein, J. Lindner,O. Calvo-Gonzalez, R. Ritter, April 2005.
28 “Reforms in selected EU network industries” by R. Martin, M. Roma, I. Vansteenkiste,April 2005.
29 “Wealth and asset price effects on economic activity”, by F. Altissimo, E. Georgiou,T. Sastre, M. T. Valderrama, G. Sterne, M. Stocker, M. Weth, K. Whelan, A. Willman,June 2005.
30 “Competitiveness and the export performance of the euro area”, by a Task Force of theMonetary Policy Committee of the European System of Central Banks, June 2005.
31 “Regional monetary integration in the member states of the Gulf Cooperation Council(GCC)” by M. Sturm and N. Siegfried, June 2005.

75ECB
Occasional Paper No. 43February 2006
L I S T O FOCCAS IONAL
PAPERS32 “Managing financial crises in emerging market economies: experience with the involvementof private sector creditors” by an International Relations Committee task force, July 2005.
33 “Integration of securities market infrastructures in the euro area” by H. Schmiedel,A. Schönenberger, July 2005.
34 “Hedge funds and their implications for financial stability” by T. Garbaravicius andF. Dierick, August 2005.
35 “The institutional framework for financial market policy in the USA seen from an EUperspective” by R. Petschnigg, September 2005.
36 “Economic and monetary integration of the new Member States: helping to chart the route”by J. Angeloni, M. Flad and F. P. Mongelli, September 2005.
37 “Financing conditions in the euro area” by L. Bê Duc, G. de Bondt, A. Calza, D. MarquésIbáñez, A. van Rixtel and S. Scopel, September 2005.
38 “Economic reactions to public finance consolidation: a survey of the literature” by M. G.Briotti, October 2005.
39 “Labour productivity in the Nordic EU countries: a comparative overview and explanatoryfactors – 1998-2004” by A. Annenkov and C. Madaschi, October 2005.
40 “What does European institutional integration tell us about trade integration?” by F. P.Mongelli, E. Dorrucci and I. Agur, December 2005.
41 “Trends and patterns in working time across euro area countries 1970-2004: causesand consequences” by N. Leiner-Killinger, C. Madaschi and M. Ward-Warmedinger,December 2005.
42 “The New Basel Capital Framework and its implementation in the European Union”by F. Dierick, F. Pires, M. Scheicher and K. G. Spitzer, December 2005.
43 “The accumulation of foreign reserves” by an International Relations Committee Task Force,February 2006.


ISSN 1607148-4
9 7 7 1 6 0 7 1 4 8 0 0 6