Embed Size (px)
Citation preview
Bank of Israel
Market Operations Department
Investment of the
Foreign Exchange
Reserves
Annual Report 2015
1
Contents
Main developments
A. The foreign exchange reserves—their level and the framework for managing them
1. The framework for holding and managing the reserves
2. The risk profile of the reserves
3. The risk management framework and strategic allocation
4. The level of Israel’s foreign exchange reserves
5. Changes in the level of the reserves in 2015
B. The global economic and financial environment
C. The holding rate of return on the reserves in 2015
1. The rate of return on the reserves portfolio
2. The active management contribution
2a. Duration and diversification
2b. Investment in equities
2c. Debt instruments that are not in the benchmark and other exposures
2d. Currency exposures
3. Risk-return indices
4. The reserves’ investment horizon
Appendix 1: Glossary
Appendix 2: Foreign exchange reserves: investment policy guidelines
Appendix 3: Principles for determining the desired level of the foreign exchange
reserves
2
Main developments
• Israel's foreign exchange reserves totaled $90.6 billion1 at the end of 2015, an increase of $4.5 billion over the course of the year.
• In 2015, the Bank of Israel purchased $8.8 billion. Approximately two-thirds of the sum were purchased within the framework of the Bank of Israel’s intervention intended to moderate exchange rate volatility that is not in line with fundamental economic conditions in Israel, and the other third was purchased within the framework of implementing the plan to moderate the effect of natural gas production on the exchange rate. The increase in the reserves through the purchases was offset by about $3 billion as a result of the strengthening of the dollar against the euro.
• In recent years, in order to attain a higher long-term yield on the reserves, the share of risk components in the portfolio was increased, subject to the desired risk level and while adhering to the two principles guiding the reserves holdings—maintaining their purchasing power and managing them with a high level of liquidity. Accordingly, the share of investment in equities increased from 8.2 percent to 9.2 percent, and it was allocated to additional equity markets. In addition, the share of investment in corporate bonds was increased from 0.9 percent to 4.6 percent.
• In 2015, the slowing in the real economy continued, primarily in emerging economies. Advanced economies were relatively stable. The market assessment that the US federal funds rate would be raised in the beginning of the year did not materialize and the rate was only increased at the end of the year. In contrast, other major markets further enhanced their accommodative monetary policy. As a result, yields to maturity of government bonds in the investment countries reached historic lows, and in Europe they declined to levels even more negative than before.
• Against this background, the holding rate of return on the reserves, in terms of the numeraire2, was low relative to previous years, reaching 0.64 percent, while the benchmark return was 0.1 percent.
• The difference between the holding rate of return on the reserves and that of the benchmark, which is risk-free, was 0.54 percent. This contribution is attributed mainly to the duration and diversification of the portfolio relative to the benchmark, and to investment in equities.
• Since 2012, the investment in equities has generated a significant contribution to the return on the reserves portfolio. This trend continued this year, although the contribution was low relative to previous years. The investment was characterized by high volatility, mainly in the second half of the year, among other things against the background of increased concerns over a sharp decline in the rate of growth in China.
1 Throughout the report, the level of the reserves includes allocations of Special Drawing Rights by the International Monetary Fund to member countries (SDR Allocation) and Israel's balance in the Reserve Tranche of the Fund. At the end of 2015 these totaled $1.6 billion. For more on this issue, see the Bank of Israel's Financial Statements for 2015. 2 The numeraire is a currency basket in which the foreign exchange reserves are measured. See Chapter 1, Section 3 in the report.
3
A. The foreign exchange reserves—their level and the framework for managing them
1. The framework for holding and managing the reserves
According to the Bank of Israel Law, 5770–2010, one of the Bank's functions is to hold and manage the country's foreign exchange reserves. In accordance with this law, the Monetary Committee, headed by the Governor, was granted the authority, among others, to manage the reserves. The Monetary Committee’s role is to establish the guidelines3 for the investment policy of the reserves, in consultation with the Minister of Finance, and to monitor the implementation of such policy. The Committee approves and revises the allocation of responsibilities for the investment of the reserves between it on the one hand and the Foreign Currency Committee4 and the Market Operations Department on the other. In addition, the Monetary Committee, with the approval of the Minister of Finance, has the power to change the guidelines according to which the Governor decides on the appropriate long-term level of foreign exchange reserves.
Countries hold foreign exchange reserves for three main purposes:
• To provide the economy with sufficient foreign currency for an emergency situation (such as war or natural disaster). In such instances, it may be necessary to maintain imports or to rapidly and markedly increase them in order to deal with the emergency, while exports are liable to be severely negatively impacted, so foreign currency inflows will be low. In such circumstances, the government and the private sector will find it difficult to raise foreign currency abroad, and the foreign exchange reserves will become the country’s main source for financing in foreign currency.
• To enable the central bank to intervene in the foreign currency market in the following circumstances: (1) the foreign exchange rate has deviated from the range that is consistent with the economy’s fundamental equilibrium; or (2) the foreign currency market is not functioning properly (market failure).
• To allow the central bank to operate in the foreign currency market in order to moderate the effect of significant capital flows of either nonresidents or local residents, which are liable to undermine the stability of the financial markets, thereby negatively impacting the stability of the economy as a whole (a specific case of the previous function).
In order to achieve these goals, the investment of the reserves is carried out according to the following three basic principles:
• Maintaining the purchasing power of the reserves • Managing the reserves at a high level of liquidity • Achieving a suitable holding rate of return on the reserves portfolio, as long as this
does not interfere with achieving the previous objectives (as detailed in Appendix 2—Foreign Exchange Reserves: Investment Policy Guidelines).
3 The guidelines are found in Appendix 2. 4 The Foreign Currency Committee is an internal committee of the Bank, headed by the Governor. Its function is to translate the guidelines for investing the reserves into detailed instructions for their management.
4
2. The risk profile of the reserves
The reserves portfolio is managed within a framework of investment rules. These rules were set in order to achieve the investment policy objectives, while controlling the exposure of the reserves to various financial risks—currency risk, price risk5, credit risk and liquidity risk. The rules are inherently conservative and reflect cautious management of the reserves.
The risk profile of the reserves portfolio is defined in terms of the maximum loss that the Committee is willing to accept, without affecting the attainment of the objectives for which the reserves are held. To that end, the CVaRp (Conditional Value at Risk) risk index is used. It measures the risk level in terms of the expected loss on the investment portfolio in a specific range of time and given a certain probability (p). It should be noted that CVaRp is an ex ante indicator, affected by changes in the portfolio holdings and the volatility of its assets.
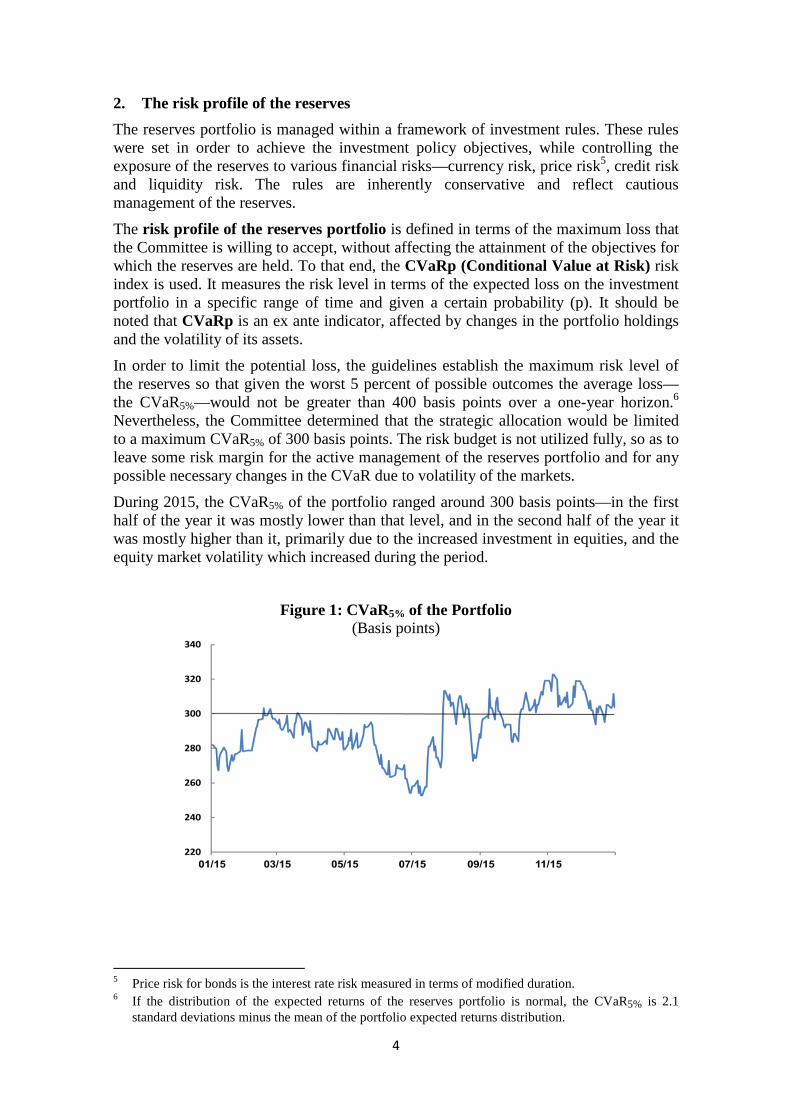
In order to limit the potential loss, the guidelines establish the maximum risk level of the reserves so that given the worst 5 percent of possible outcomes the average loss—the CVaR5%—would not be greater than 400 basis points over a one-year horizon.6 Nevertheless, the Committee determined that the strategic allocation would be limited to a maximum CVaR5% of 300 basis points. The risk budget is not utilized fully, so as to leave some risk margin for the active management of the reserves portfolio and for any possible necessary changes in the CVaR due to volatility of the markets.
During 2015, the CVaR5% of the portfolio ranged around 300 basis points—in the first half of the year it was mostly lower than that level, and in the second half of the year it was mostly higher than it, primarily due to the increased investment in equities, and the equity market volatility which increased during the period.
Figure 1: CVaR5% of the Portfolio (Basis points)
5 Price risk for bonds is the interest rate risk measured in terms of modified duration. 6 If the distribution of the expected returns of the reserves portfolio is normal, the CVaR5% is 2.1
standard deviations minus the mean of the portfolio expected returns distribution.
5
3. The risk management framework and strategic allocation
Like portfolios of other investors around the world, management of the various financial risks in the Bank of Israel’s foreign exchange reserves portfolio is based on management of the reserves portfolio vis-a-vis a benchmark. A benchmark is a hypothetical portfolio composed of various investable assets and formulated according to known and fixed rules. The benchmark provides a yardstick for measuring the performance of a portfolio manager’s investment decisions.
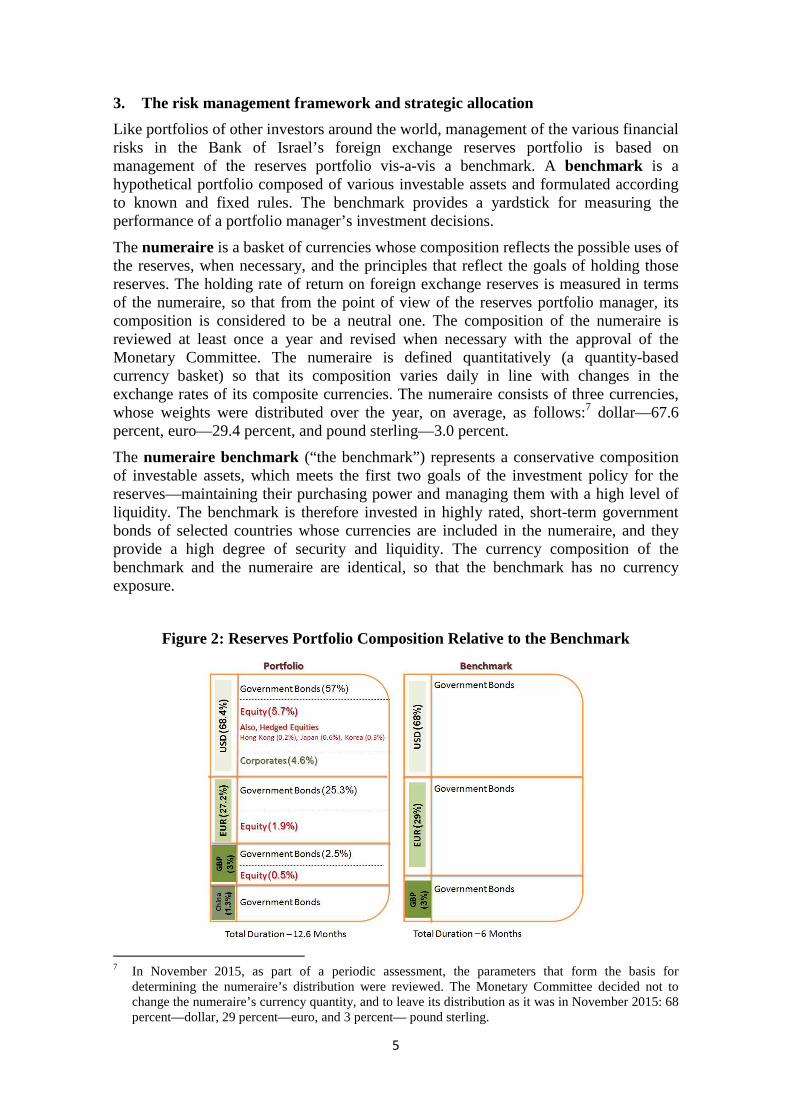
The numeraire is a basket of currencies whose composition reflects the possible uses of the reserves, when necessary, and the principles that reflect the goals of holding those reserves. The holding rate of return on foreign exchange reserves is measured in terms of the numeraire, so that from the point of view of the reserves portfolio manager, its composition is considered to be a neutral one. The composition of the numeraire is reviewed at least once a year and revised when necessary with the approval of the Monetary Committee. The numeraire is defined quantitatively (a quantity-based currency basket) so that its composition varies daily in line with changes in the exchange rates of its composite currencies. The numeraire consists of three currencies, whose weights were distributed over the year, on average, as follows:7 dollar—67.6 percent, euro—29.4 percent, and pound sterling—3.0 percent.
The numeraire benchmark (“the benchmark”) represents a conservative composition of investable assets, which meets the first two goals of the investment policy for the reserves—maintaining their purchasing power and managing them with a high level of liquidity. The benchmark is therefore invested in highly rated, short-term government bonds of selected countries whose currencies are included in the numeraire, and they provide a high degree of security and liquidity. The currency composition of the benchmark and the numeraire are identical, so that the benchmark has no currency exposure.
Figure 2: Reserves Portfolio Composition Relative to the Benchmark
7 In November 2015, as part of a periodic assessment, the parameters that form the basis for
determining the numeraire’s distribution were reviewed. The Monetary Committee decided not to change the numeraire’s currency quantity, and to leave its distribution as it was in November 2015: 68 percent—dollar, 29 percent—euro, and 3 percent— pound sterling.
6
At the beginning of 2015 a strategic allocation process, similar to the previous year, was conducted on the reserves portfolio. The various characteristics of this allocation were determined by the Monetary Committee in an effort to attain a suitable return, subject to the risk profile defined by the Committee, while meeting the first two goals of the reserves holding policy—maintaining the reserves’ purchasing power and managing them with a high level of liquidity.
As part of the strategic allocation, the strategic composition of the reserves portfolio was determined so that the expected return on the portfolio is adequate, within the framework of the desired risk level and the guidelines’ limitations.
Within the framework of the strategic allocation for 2015, the Monetary Committee approved increasing the investment in equities, to expand it to additional markets, to increase the investment in corporate bonds, and to increase the duration of the fixed income component of the reserves portfolio. It should be noted that there are degrees of freedom for the actual investment of the reserves in a composition that is different, to some extent, than the composition set in the allocation framework.
7
4. The level of Israel’s foreign exchange reserves
An adequate level of foreign exchange reserves is an important indicator of a country’s economic robustness, and supports the central bank in carrying out its functions. The reserves are a source of liquidity in foreign currency, which the bank can use when needed. Furthermore, an adequate level of foreign exchange reserves contributes to improving the country’s international financial standing by increasing confidence in its ability to withstand shocks to the economy. This advantage is manifested in the country’s credit rating and in the evaluations produced by rating agencies, which could allow the economy to reduce the financing costs of debt raised abroad.
The principles for determining the appropriate level of reserves were defined according to the goals for holding them.8 At the beginning of the year, the Governor determined the appropriate range to be between $70 and $110 billion.9 The reserve level is currently in the middle of this range.
The Bank of Israel’s intervention in the foreign exchange market for the purpose of carrying out its functions and attaining its objectives may lead to a deviation in the actual level of reserves from the determined appropriate level. Such a deviation is permitted under the Bank of Israel Law. Nevertheless, the Bank may take action to alter the level of reserves only when the deviation is significant and sustained, and only if such actions are consistent with attaining the Bank’s objectives as specified in the Bank of Israel Law—including price stability, support for other objectives of economic policy, and support for stability of the financial system. It is therefore possible for the foreign exchange reserves to deviate from the desired level for extended periods of time.
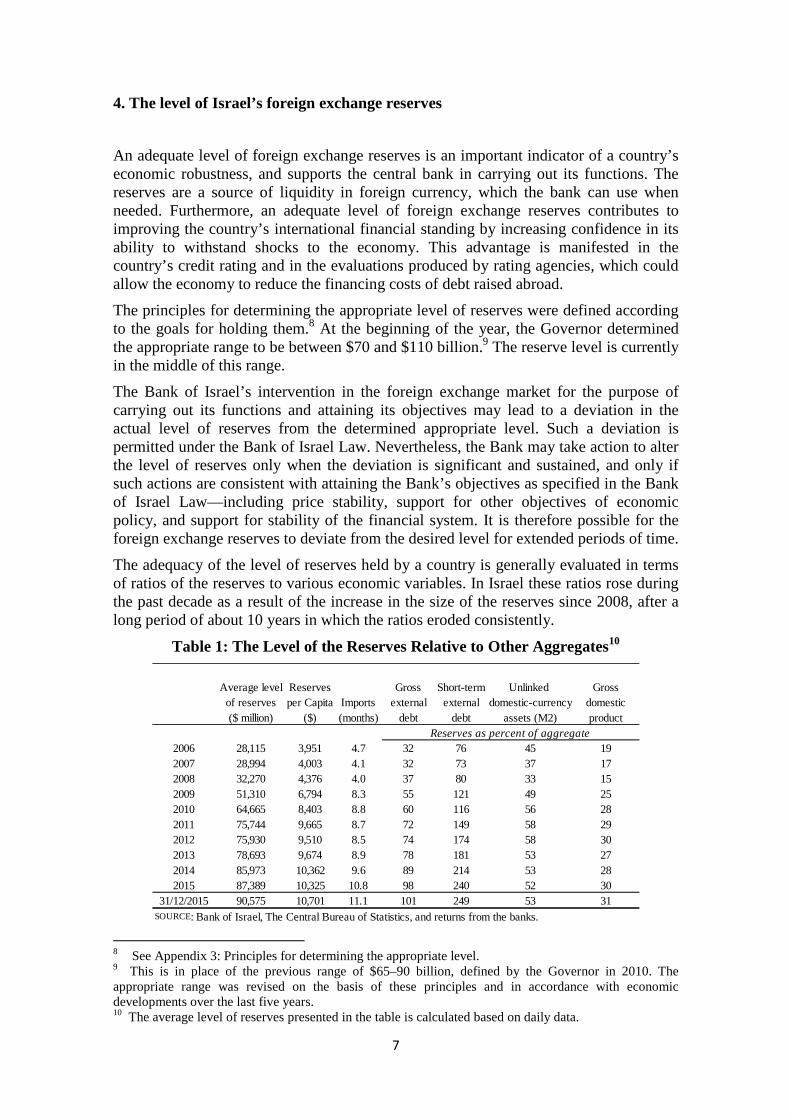
The adequacy of the level of reserves held by a country is generally evaluated in terms of ratios of the reserves to various economic variables. In Israel these ratios rose during the past decade as a result of the increase in the size of the reserves since 2008, after a long period of about 10 years in which the ratios eroded consistently.
Table 1: The Level of the Reserves Relative to Other Aggregates10
8 See Appendix 3: Principles for determining the appropriate level. 9 This is in place of the previous range of $65–90 billion, defined by the Governor in 2010. The appropriate range was revised on the basis of these principles and in accordance with economic developments over the last five years. 10 The average level of reserves presented in the table is calculated based on daily data.
Average level Reserves Gross Short-term Unlinked Grossof reserves per Capita Imports external externaldomestic-currency domestic($ million) ($) (months) debt debt assets (M2) product
2006 28,115 3,951 4.7 32 76 45 192007 28,994 4,003 4.1 32 73 37 172008 32,270 4,376 4.0 37 80 33 152009 51,310 6,794 8.3 55 121 49 252010 64,665 8,403 8.8 60 116 56 282011 75,744 9,665 8.7 72 149 58 292012 75,930 9,510 8.5 74 174 58 302013 78,693 9,674 8.9 78 181 53 272014 85,973 10,362 9.6 89 214 53 282015 87,389 10,325 10.8 98 240 52 30
31/12/2015 90,575 10,701 11.1 101 249 53 31SOURCE: Bank of Israel, The Central Bureau of Statistics, and returns from the banks.
Reserves as percent of aggregate
8
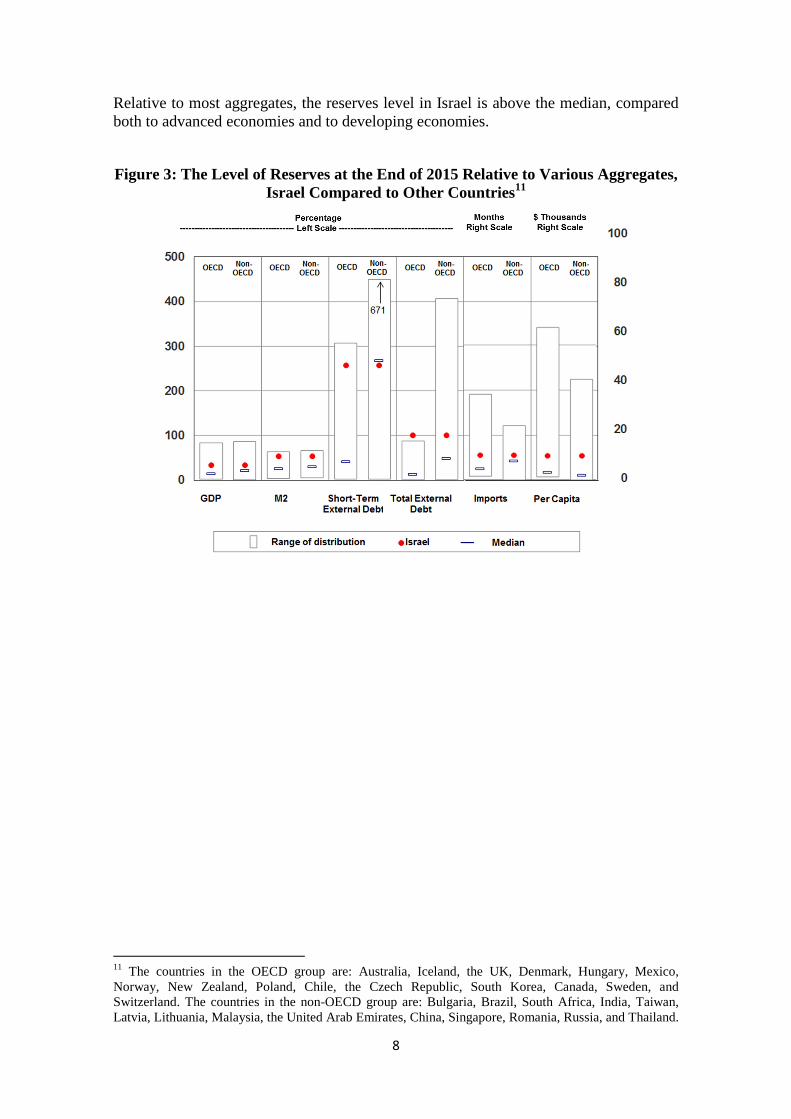
Relative to most aggregates, the reserves level in Israel is above the median, compared both to advanced economies and to developing economies.
Figure 3: The Level of Reserves at the End of 2015 Relative to Various Aggregates, Israel Compared to Other Countries11
11
The countries in the OECD group are: Australia, Iceland, the UK, Denmark, Hungary, Mexico, Norway, New Zealand, Poland, Chile, the Czech Republic, South Korea, Canada, Sweden, and Switzerland. The countries in the non-OECD group are: Bulgaria, Brazil, South Africa, India, Taiwan, Latvia, Lithuania, Malaysia, the United Arab Emirates, China, Singapore, Romania, Russia, and Thailand.
9
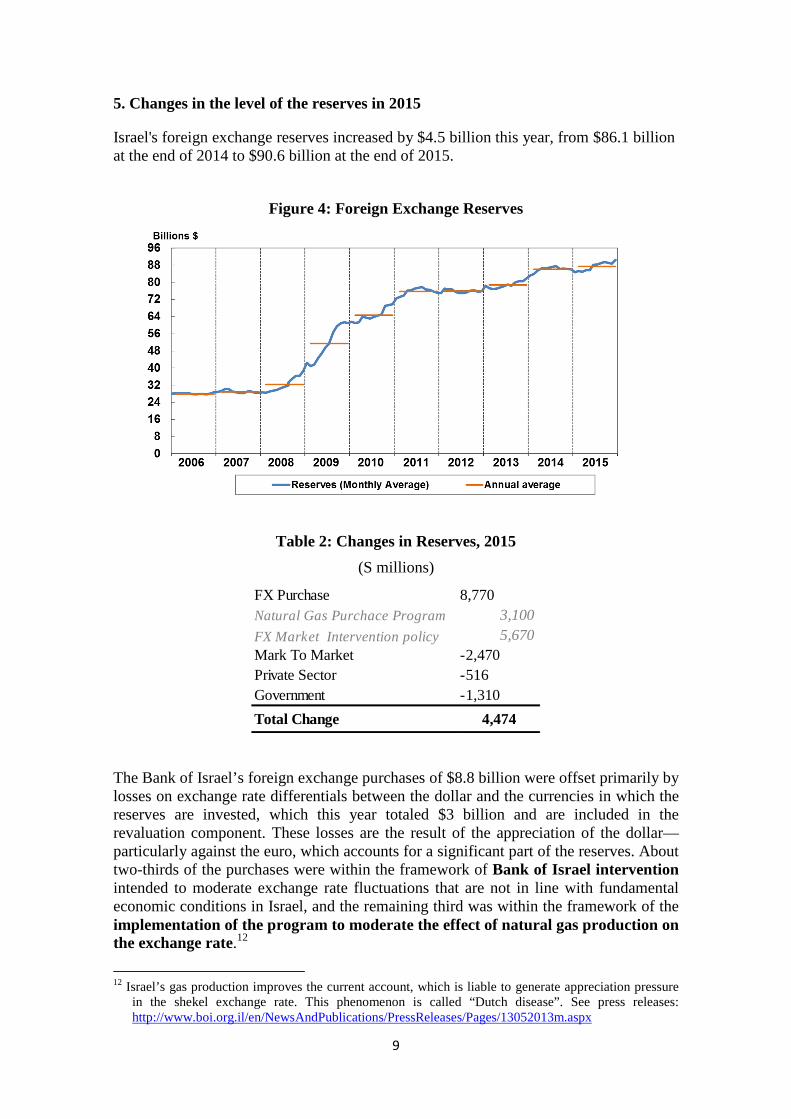
5. Changes in the level of the reserves in 2015
Israel's foreign exchange reserves increased by $4.5 billion this year, from $86.1 billion at the end of 2014 to $90.6 billion at the end of 2015.
Figure 4: Foreign Exchange Reserves
Table 2: Changes in Reserves, 2015
(S millions)
The Bank of Israel’s foreign exchange purchases of $8.8 billion were offset primarily by losses on exchange rate differentials between the dollar and the currencies in which the reserves are invested, which this year totaled $3 billion and are included in the revaluation component. These losses are the result of the appreciation of the dollar—particularly against the euro, which accounts for a significant part of the reserves. About two-thirds of the purchases were within the framework of Bank of Israel intervention intended to moderate exchange rate fluctuations that are not in line with fundamental economic conditions in Israel, and the remaining third was within the framework of the implementation of the program to moderate the effect of natural gas production on the exchange rate.12
12 Israel’s gas production improves the current account, which is liable to generate appreciation pressure
in the shekel exchange rate. This phenomenon is called “Dutch disease”. See press releases: http://www.boi.org.il/en/NewsAndPublications/PressReleases/Pages/13052013m.aspx
FX Purchase 8,770Natural Gas Purchace Program 3,100
FX Market Intervention policy 5,670Mark To Market -2,470Private Sector -516Government -1,310
Total Change 4,474
10
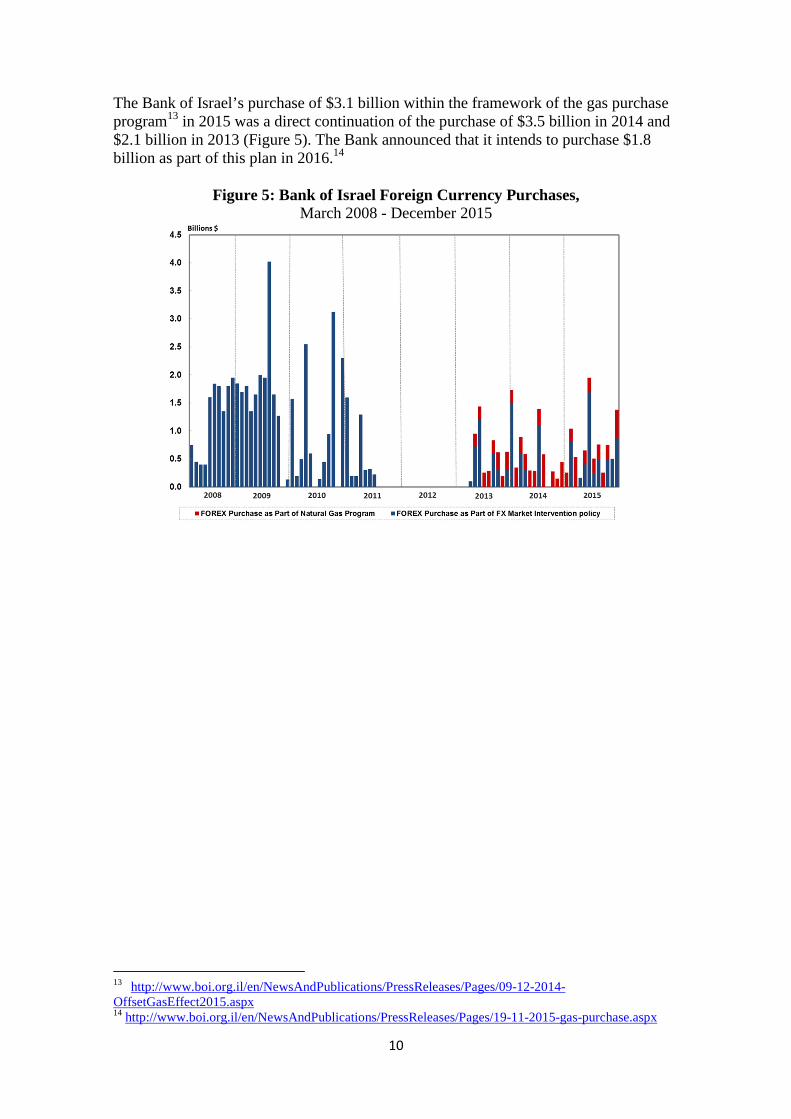
The Bank of Israel’s purchase of $3.1 billion within the framework of the gas purchase program13 in 2015 was a direct continuation of the purchase of $3.5 billion in 2014 and $2.1 billion in 2013 (Figure 5). The Bank announced that it intends to purchase $1.8 billion as part of this plan in 2016.14
Figure 5: Bank of Israel Foreign Currency Purchases,
March 2008 - December 2015
13 http://www.boi.org.il/en/NewsAndPublications/PressReleases/Pages/09-12-2014-OffsetGasEffect2015.aspx 14
http://www.boi.org.il/en/NewsAndPublications/PressReleases/Pages/19-11-2015-gas-purchase.aspx
11
B. The global economic and financial environment
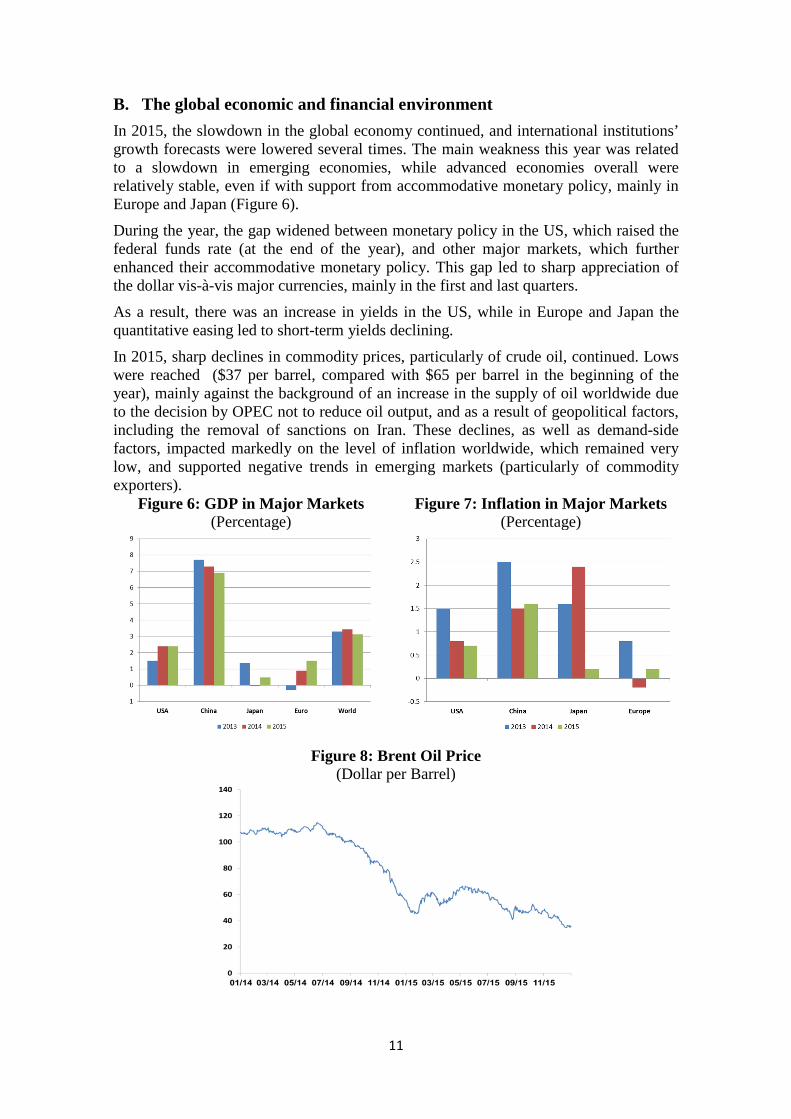
In 2015, the slowdown in the global economy continued, and international institutions’ growth forecasts were lowered several times. The main weakness this year was related to a slowdown in emerging economies, while advanced economies overall were relatively stable, even if with support from accommodative monetary policy, mainly in Europe and Japan (Figure 6).
During the year, the gap widened between monetary policy in the US, which raised the federal funds rate (at the end of the year), and other major markets, which further enhanced their accommodative monetary policy. This gap led to sharp appreciation of the dollar vis-à-vis major currencies, mainly in the first and last quarters.
As a result, there was an increase in yields in the US, while in Europe and Japan the quantitative easing led to short-term yields declining.
In 2015, sharp declines in commodity prices, particularly of crude oil, continued. Lows were reached ($37 per barrel, compared with $65 per barrel in the beginning of the year), mainly against the background of an increase in the supply of oil worldwide due to the decision by OPEC not to reduce oil output, and as a result of geopolitical factors, including the removal of sanctions on Iran. These declines, as well as demand-side factors, impacted markedly on the level of inflation worldwide, which remained very low, and supported negative trends in emerging markets (particularly of commodity exporters).
Figure 6: GDP in Major Markets Figure 7: Inflation in Major Markets (Percentage) (Percentage)
Figure 8: Brent Oil Price
(Dollar per Barrel)
12
Heading into 2015, assessments in the markets were that the US federal funds rate would be increased in the beginning of the year, and investors were very concerned about the materialization of a hard landing in China and the effects of a possible exit by Greece from the EU.
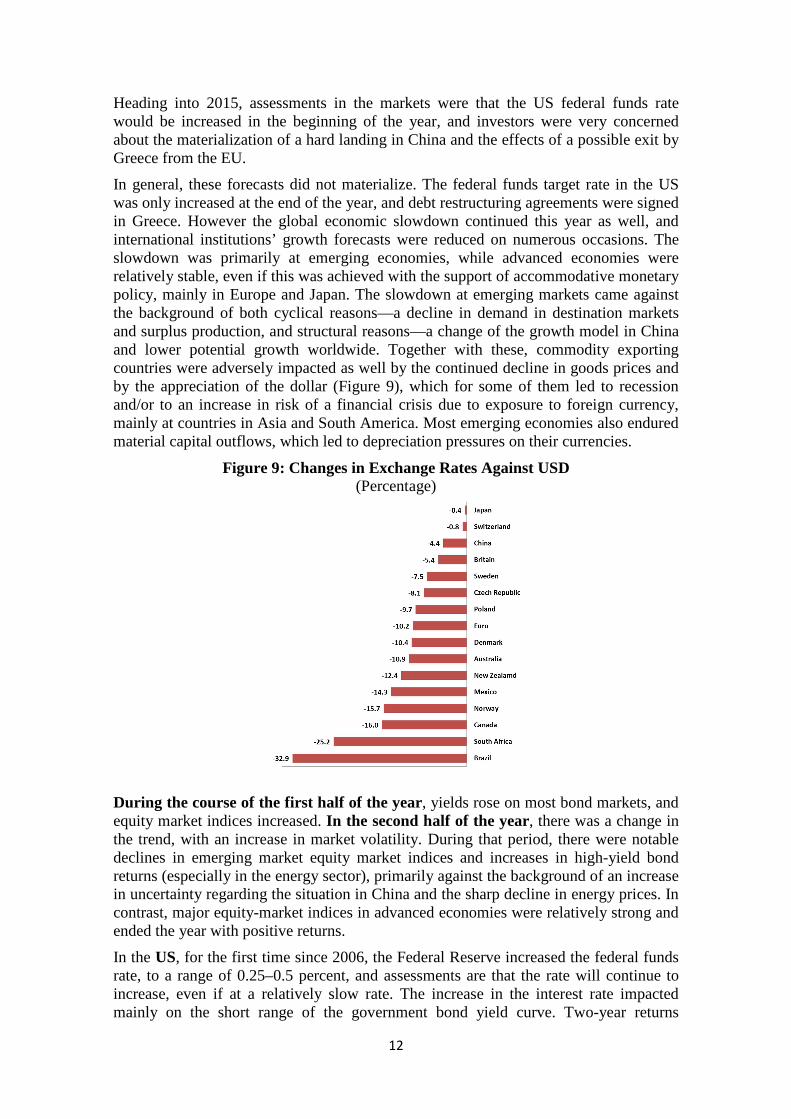
In general, these forecasts did not materialize. The federal funds target rate in the US was only increased at the end of the year, and debt restructuring agreements were signed in Greece. However the global economic slowdown continued this year as well, and international institutions’ growth forecasts were reduced on numerous occasions. The slowdown was primarily at emerging economies, while advanced economies were relatively stable, even if this was achieved with the support of accommodative monetary policy, mainly in Europe and Japan. The slowdown at emerging markets came against the background of both cyclical reasons—a decline in demand in destination markets and surplus production, and structural reasons—a change of the growth model in China and lower potential growth worldwide. Together with these, commodity exporting countries were adversely impacted as well by the continued decline in goods prices and by the appreciation of the dollar (Figure 9), which for some of them led to recession and/or to an increase in risk of a financial crisis due to exposure to foreign currency, mainly at countries in Asia and South America. Most emerging economies also endured material capital outflows, which led to depreciation pressures on their currencies.
Figure 9: Changes in Exchange Rates Against USD (Percentage)
During the course of the first half of the year, yields rose on most bond markets, and equity market indices increased. In the second half of the year, there was a change in the trend, with an increase in market volatility. During that period, there were notable declines in emerging market equity market indices and increases in high-yield bond returns (especially in the energy sector), primarily against the background of an increase in uncertainty regarding the situation in China and the sharp decline in energy prices. In contrast, major equity-market indices in advanced economies were relatively strong and ended the year with positive returns.
In the US, for the first time since 2006, the Federal Reserve increased the federal funds rate, to a range of 0.25–0.5 percent, and assessments are that the rate will continue to increase, even if at a relatively slow rate. The increase in the interest rate impacted mainly on the short range of the government bond yield curve. Two-year returns
13
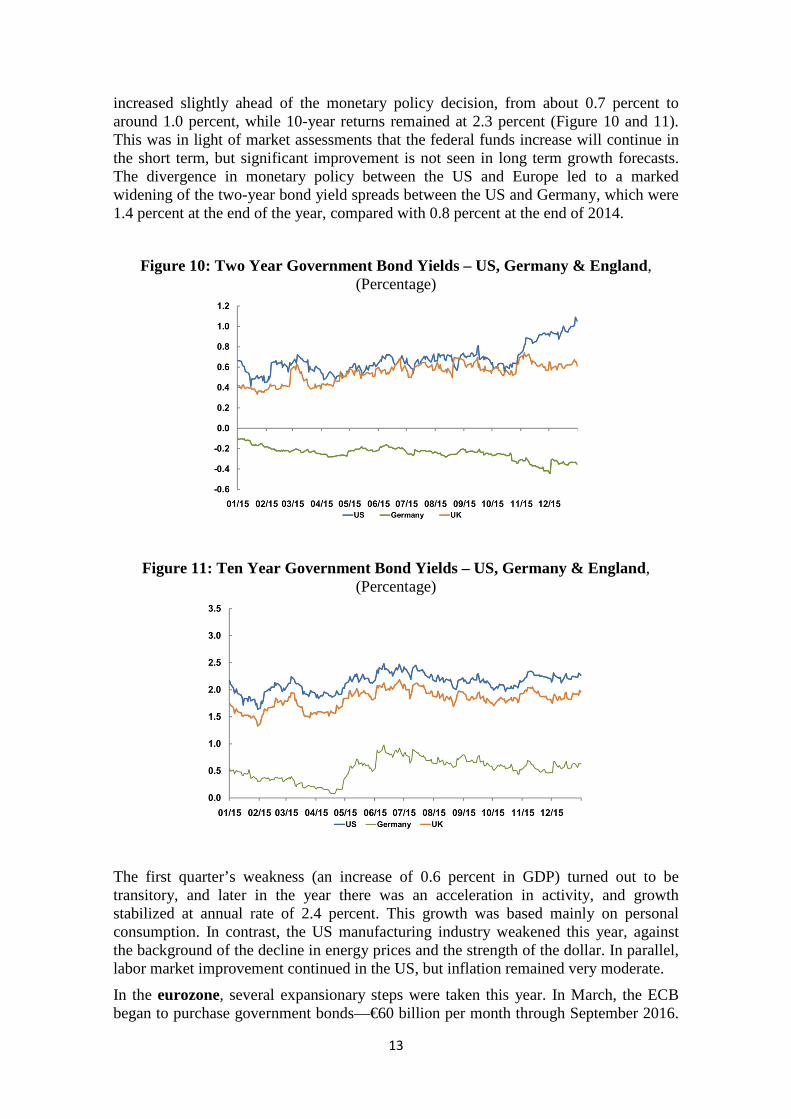
increased slightly ahead of the monetary policy decision, from about 0.7 percent to around 1.0 percent, while 10-year returns remained at 2.3 percent (Figure 10 and 11). This was in light of market assessments that the federal funds increase will continue in the short term, but significant improvement is not seen in long term growth forecasts. The divergence in monetary policy between the US and Europe led to a marked widening of the two-year bond yield spreads between the US and Germany, which were 1.4 percent at the end of the year, compared with 0.8 percent at the end of 2014.
Figure 10: Two Year Government Bond Yields – US, Germany & England , (Percentage)
Figure 11: Ten Year Government Bond Yields – US, Germany & England , (Percentage)
The first quarter’s weakness (an increase of 0.6 percent in GDP) turned out to be transitory, and later in the year there was an acceleration in activity, and growth stabilized at annual rate of 2.4 percent. This growth was based mainly on personal consumption. In contrast, the US manufacturing industry weakened this year, against the background of the decline in energy prices and the strength of the dollar. In parallel, labor market improvement continued in the US, but inflation remained very moderate.
In the eurozone, several expansionary steps were taken this year. In March, the ECB began to purchase government bonds—€60 billion per month through September 2016.
14
In November, it was decided to extend the program through March 2017 and to further reduce the negative interest rate on banks’ deposits to -0.3 percent. Influenced by these measures, short-term yields in the eurozone declined markedly throughout the year—2-year government notes in Germany declined from -0.1 percent to -0.4 percent, while the 10-year yield did not change substantially, and stands at 0.6 percent. The differing directions of monetary policy between the US and Europe led to a widening of the 2-year bond spread between the US and Germany, to 1.4 percent, as noted above.
In Europe’s economy there was further improvement in growth, and according to the IMF, eurozone actual growth in 2015 was 1.5 percent, with a forecast for 2016 of 1.6 percent. Despite this, and notwithstanding the near-zero percent interest rate and the quantitative easing measures, the inflation rate remained very low. The annual inflation rate was 0.2 percent in December, and core inflation around 1 percent. The main reasons for this are the level of unemployment (10.4 percent) and the output gap in the eurozone, which remained high. Although a continued decline in energy prices supports private consumption, it holds back, in contrast, an increase in inflation.
Against the background of the accommodative policy of the ECB, the euro weakened in 2015 against major currencies by up to 11 percent and reached lows against the dollar similar to those that prevailed in 2003. The main currencies against which the euro strengthened in 2015, by about 6 percent, were of energy exporters (Canada and Norway).
Another factor that impacted markedly on the European economy in the beginning of the year was the crisis in Greece, and the concern that Greece would default and/or leave the monetary union. This crisis, which peaked in June, led to considerable volatility in the markets, but in the second half of the year, the concerns from that crisis eased.
In Japan, the central bank continued this year as well its bond-purchase program, at ¥80 trillion per year, which was mainly intended to lead to depreciation of the domestic currency and reduce companies’ financing costs. Accordingly, the 10-year government bond yield remained low, at less than 0.3 percent, and the domestic currency maintained its low value—about ¥120 per dollar.
During the year, the Japanese economy continued to stagnate, and in the fourth quarter there was even a contraction of 1.4 percent in GDP. The effects of the quantitative easing and weakness of the yen mainly supported company profits, leading to an increase of 9 percent in the domestic equity market. In contrast, inflation remained low this year as well, and the central bank reduced its forecasts for expected inflation numerous times, while noting the low levels of energy prices as the main factor in the low inflation rate.
In the UK , the economy grew by a rapid rate this year as well, relative to the eurozone, but at a slower rate than in 2014. The growth rate in the fourth quarter of the year was about 2 percent in annual terms, compared with 2.8 percent last year. The decline in the growth rate reflects, among other things, the UK (like the US, as well) being in a more advanced stage of the business cycle. Despite this, due to the low inflation rate (0.1 percent), and the close connection with mainland Europe’s economy, the expected date of an increase in the interest rate in the UK continues to be pushed off, and assessments are than it will not occur in 2016. Over the full year, the yield on 10-year UK government notes increased from 1.8 percent to 2 percent.
15
China, which in recent years has been considered a stabilizing factor for the global economy, was a focal point of concerns in 2015 and made a marked contribution to the increase in uncertainty and volatility in markets. During the course of the year, concerns increased of a “hard landing” for the economy, and stock markets in China declined sharply. In order to support the economy, authorities adopted accommodative policy. This included six interest rate reductions during the course of the year, but also additional steps, including a reduction of banks’ reserves ratio and repeated interventions in the capital markets. These concerns led to capital outflows, which led the central bank to use part of its foreign exchange reserves that had been accumulated in order to control the depreciation in the domestic currency. Despite the increase in uncertainty in China, the main scenario remains continued controlled decline in the rate of growth with some variation in its sources—a “soft landing”. The official growth rate continued to moderate, and was 6.8 percent this year.
Developing economies continued to display signs of weakness, which led to marked declines on stock markets, especially in the second half of the year. Based on a World Bank estimate, developing economies’ growth in 2015 will be less than 4 percent (compared with a growth rate of 7.6 percent in 2010), with weakness in all regions, most notably in Latin America and the Caribbean.
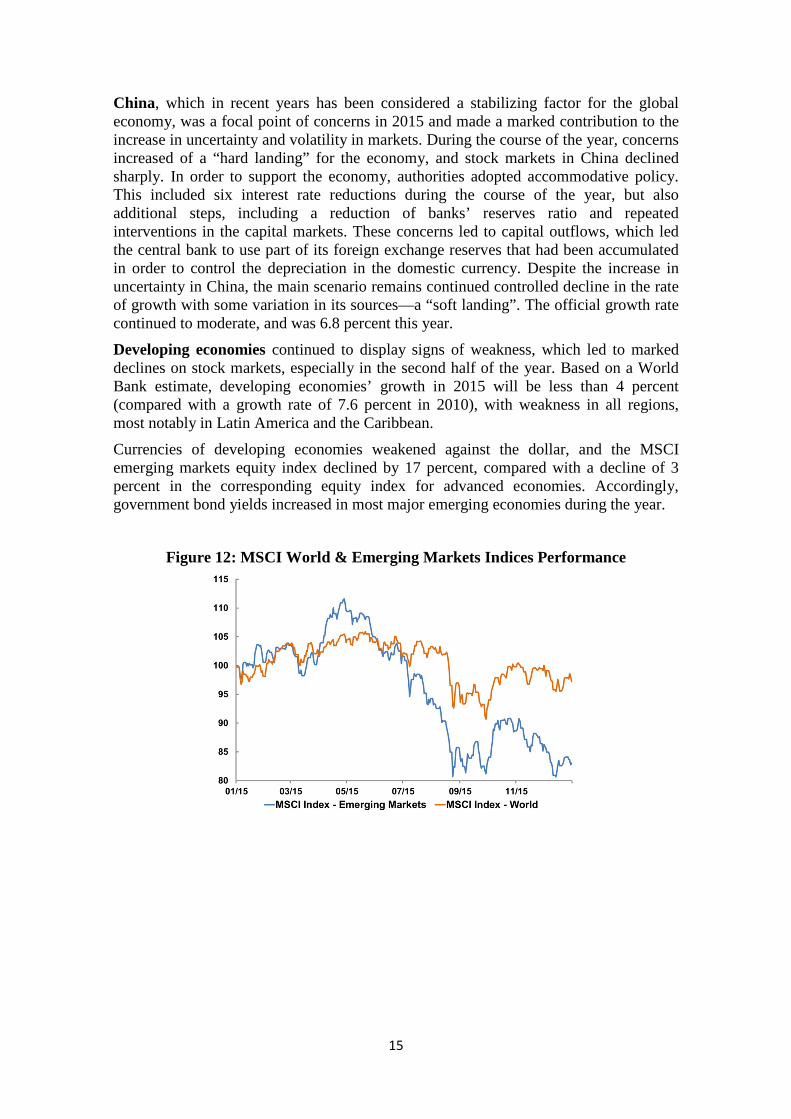
Currencies of developing economies weakened against the dollar, and the MSCI emerging markets equity index declined by 17 percent, compared with a decline of 3 percent in the corresponding equity index for advanced economies. Accordingly, government bond yields increased in most major emerging economies during the year.
Figure 12: MSCI World & Emerging Markets Indices Performance
16
C. The holding rate of return on the reserves in 2015
1. The rate of return on the reserves portfolio
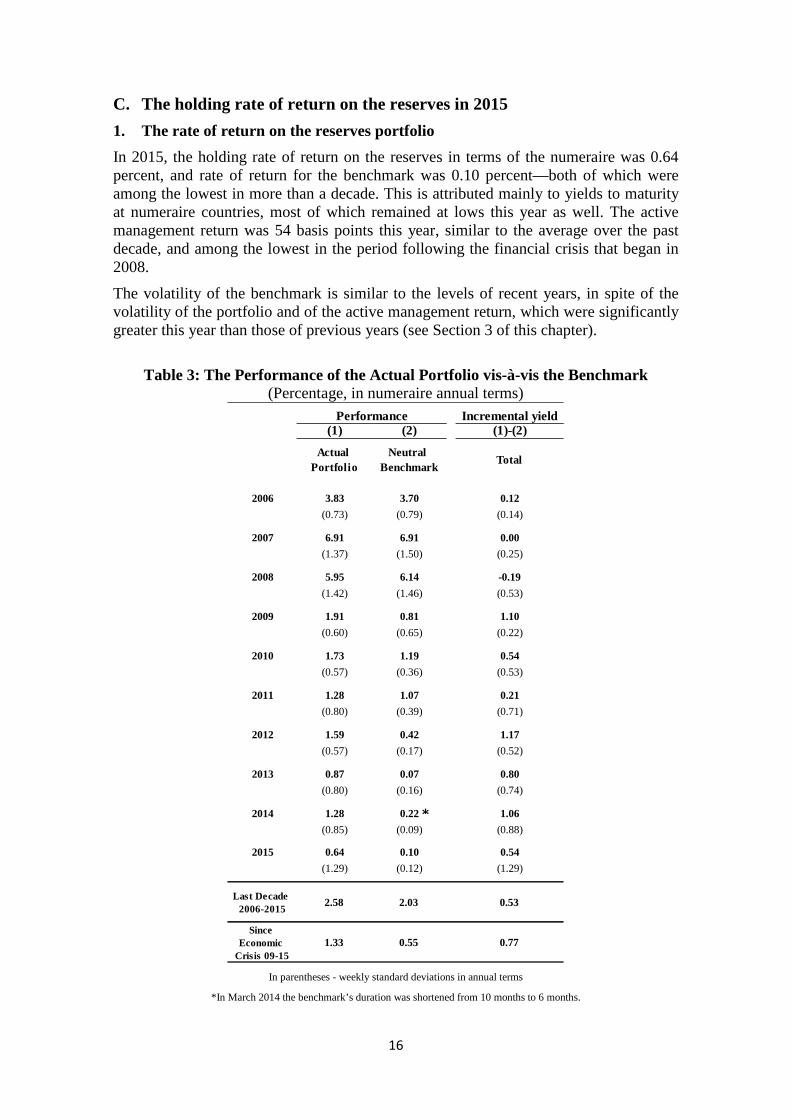
In 2015, the holding rate of return on the reserves in terms of the numeraire was 0.64 percent, and rate of return for the benchmark was 0.10 percent—both of which were among the lowest in more than a decade. This is attributed mainly to yields to maturity at numeraire countries, most of which remained at lows this year as well. The active management return was 54 basis points this year, similar to the average over the past decade, and among the lowest in the period following the financial crisis that began in 2008.
The volatility of the benchmark is similar to the levels of recent years, in spite of the volatility of the portfolio and of the active management return, which were significantly greater this year than those of previous years (see Section 3 of this chapter).
Table 3: The Performance of the Actual Portfolio vis-à-vis the Benchmark
(Percentage, in numeraire annual terms)
In parentheses - weekly standard deviations in annual terms
*In March 2014 the benchmark’s duration was shortened from 10 months to 6 months.
Incremental yield(1) (2) (1)-(2)
Actual Portfolio
Neutral Benchmark
Total
2006 3.83 3.70 0.12
(0.73) (0.79) (0.14)
2007 6.91 6.91 0.00
(1.37) (1.50) (0.25)
2008 5.95 6.14 -0.19
(1.42) (1.46) (0.53)
2009 1.91 0.81 1.10
(0.60) (0.65) (0.22)
2010 1.73 1.19 0.54
(0.57) (0.36) (0.53)
2011 1.28 1.07 0.21
(0.80) (0.39) (0.71)
2012 1.59 0.42 1.17
(0.57) (0.17) (0.52)
2013 0.87 0.07 0.80
(0.80) (0.16) (0.74)
2014 1.28 0.22 1.06
(0.85) (0.09) (0.88)
2015 0.64 0.10 0.54
(1.29) (0.12) (1.29)
Last Decade 2006-2015
2.58 2.03 0.53
Since Economic
Crisis 09-151.33 0.55 0.77
Performance
*
17
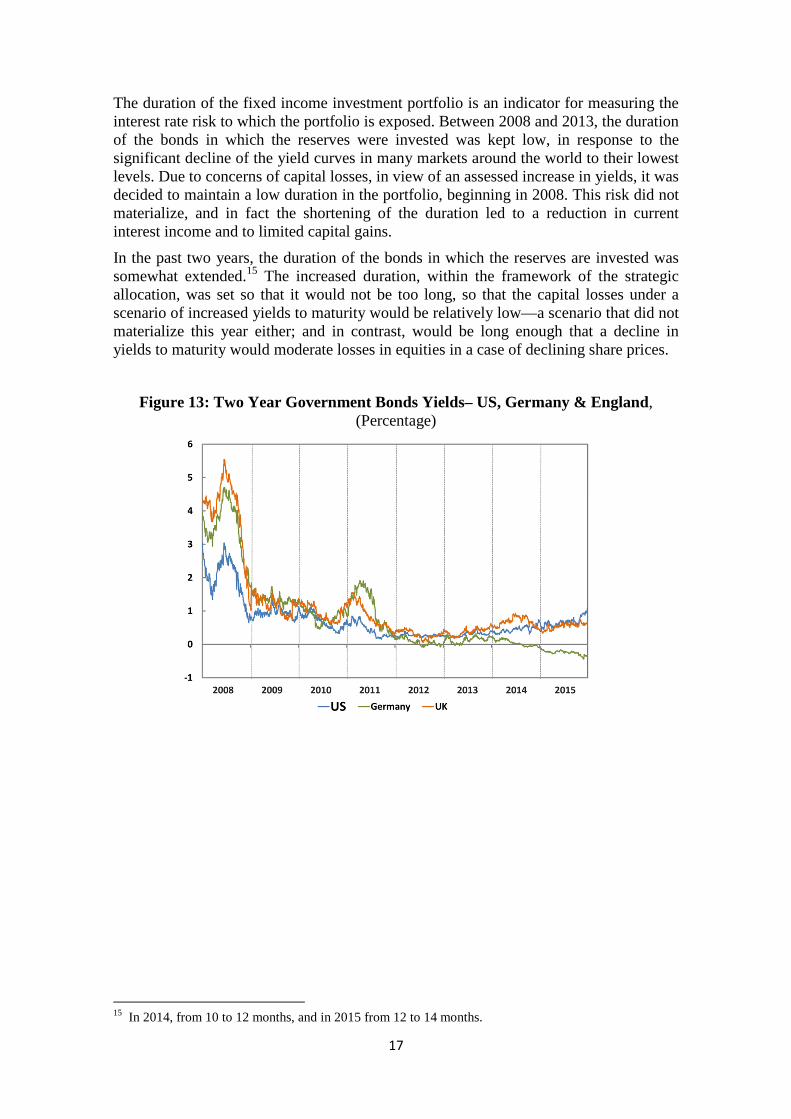
The duration of the fixed income investment portfolio is an indicator for measuring the interest rate risk to which the portfolio is exposed. Between 2008 and 2013, the duration of the bonds in which the reserves were invested was kept low, in response to the significant decline of the yield curves in many markets around the world to their lowest levels. Due to concerns of capital losses, in view of an assessed increase in yields, it was decided to maintain a low duration in the portfolio, beginning in 2008. This risk did not materialize, and in fact the shortening of the duration led to a reduction in current interest income and to limited capital gains.
In the past two years, the duration of the bonds in which the reserves are invested was somewhat extended.15 The increased duration, within the framework of the strategic allocation, was set so that it would not be too long, so that the capital losses under a scenario of increased yields to maturity would be relatively low—a scenario that did not materialize this year either; and in contrast, would be long enough that a decline in yields to maturity would moderate losses in equities in a case of declining share prices.
Figure 13: Two Year Government Bonds Yields– US, Germany & England , (Percentage)
15
In 2014, from 10 to 12 months, and in 2015 from 12 to 14 months.
18
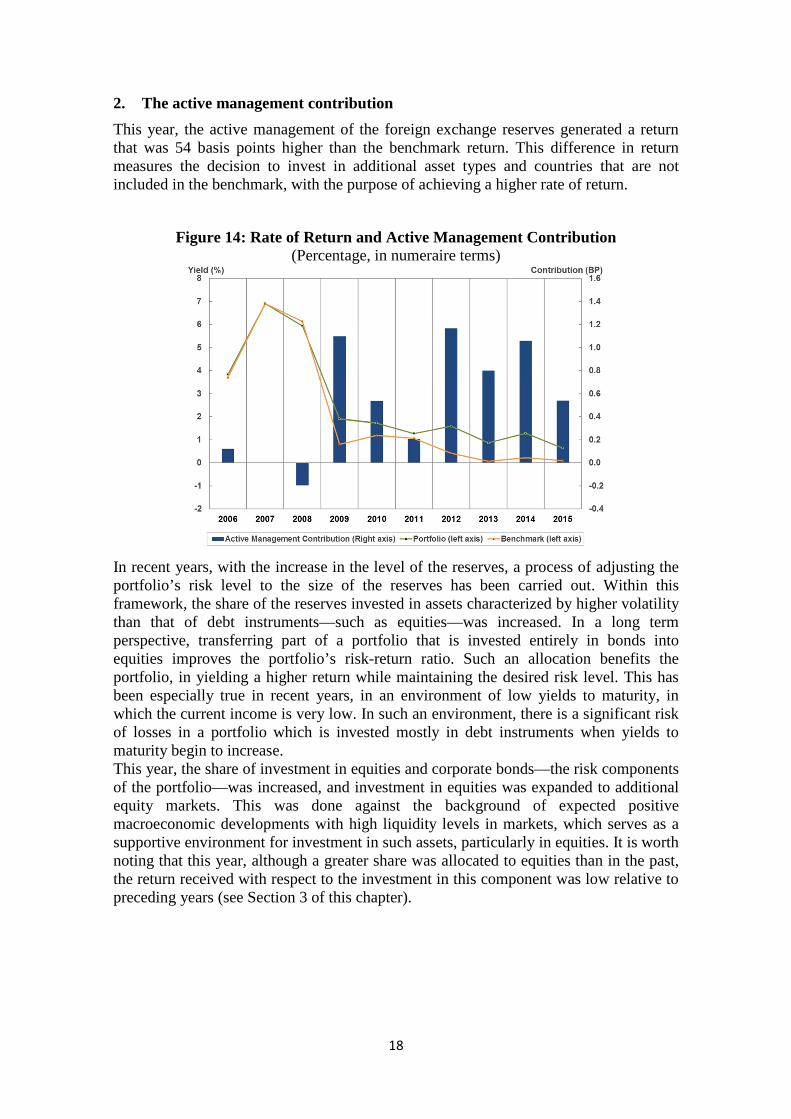
2. The active management contribution
This year, the active management of the foreign exchange reserves generated a return that was 54 basis points higher than the benchmark return. This difference in return measures the decision to invest in additional asset types and countries that are not included in the benchmark, with the purpose of achieving a higher rate of return.
Figure 14: Rate of Return and Active Management Contribution (Percentage, in numeraire terms)
In recent years, with the increase in the level of the reserves, a process of adjusting the portfolio’s risk level to the size of the reserves has been carried out. Within this framework, the share of the reserves invested in assets characterized by higher volatility than that of debt instruments—such as equities—was increased. In a long term perspective, transferring part of a portfolio that is invested entirely in bonds into equities improves the portfolio’s risk-return ratio. Such an allocation benefits the portfolio, in yielding a higher return while maintaining the desired risk level. This has been especially true in recent years, in an environment of low yields to maturity, in which the current income is very low. In such an environment, there is a significant risk of losses in a portfolio which is invested mostly in debt instruments when yields to maturity begin to increase. This year, the share of investment in equities and corporate bonds—the risk components of the portfolio—was increased, and investment in equities was expanded to additional equity markets. This was done against the background of expected positive macroeconomic developments with high liquidity levels in markets, which serves as a supportive environment for investment in such assets, particularly in equities. It is worth noting that this year, although a greater share was allocated to equities than in the past, the return received with respect to the investment in this component was low relative to preceding years (see Section 3 of this chapter).
19
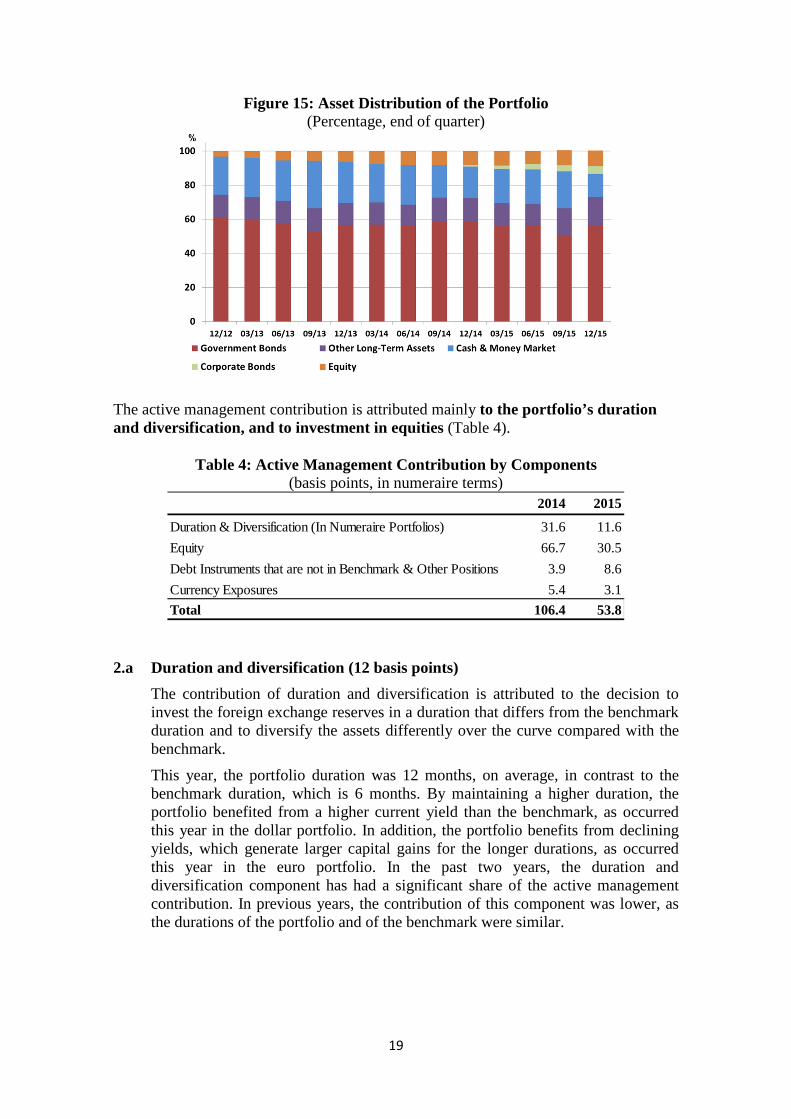
Figure 15: Asset Distribution of the Portfolio (Percentage, end of quarter)
The active management contribution is attributed mainly to the portfolio’s duration and diversification, and to investment in equities (Table 4).
Table 4: Active Management Contribution by Components
(basis points, in numeraire terms)
2.a Duration and diversification (12 basis points)
The contribution of duration and diversification is attributed to the decision to invest the foreign exchange reserves in a duration that differs from the benchmark duration and to diversify the assets differently over the curve compared with the benchmark.
This year, the portfolio duration was 12 months, on average, in contrast to the benchmark duration, which is 6 months. By maintaining a higher duration, the portfolio benefited from a higher current yield than the benchmark, as occurred this year in the dollar portfolio. In addition, the portfolio benefits from declining yields, which generate larger capital gains for the longer durations, as occurred this year in the euro portfolio. In the past two years, the duration and diversification component has had a significant share of the active management contribution. In previous years, the contribution of this component was lower, as the durations of the portfolio and of the benchmark were similar.
2014 2015
Duration & Diversification (In Numeraire Portfolios) 31.6 11.6
Equity 66.7 30.5
Debt Instruments that are not in Benchmark & Other Positions 3.9 8.6
Currency Exposures 5.4 3.1
Total 106.4 53.8
20
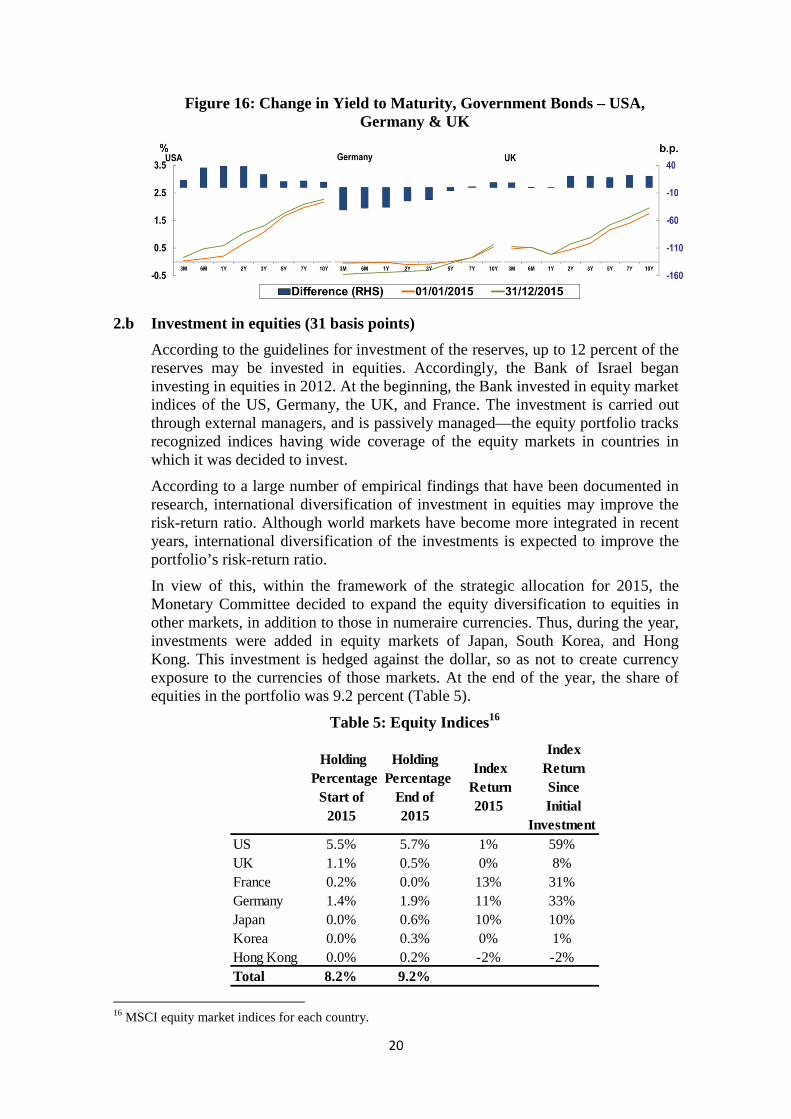
Figure 16: Change in Yield to Maturity, Government Bonds – USA, Germany & UK
2.b Investment in equities (31 basis points)
According to the guidelines for investment of the reserves, up to 12 percent of the reserves may be invested in equities. Accordingly, the Bank of Israel began investing in equities in 2012. At the beginning, the Bank invested in equity market indices of the US, Germany, the UK, and France. The investment is carried out through external managers, and is passively managed—the equity portfolio tracks recognized indices having wide coverage of the equity markets in countries in which it was decided to invest.
According to a large number of empirical findings that have been documented in research, international diversification of investment in equities may improve the risk-return ratio. Although world markets have become more integrated in recent years, international diversification of the investments is expected to improve the portfolio’s risk-return ratio.
In view of this, within the framework of the strategic allocation for 2015, the Monetary Committee decided to expand the equity diversification to equities in other markets, in addition to those in numeraire currencies. Thus, during the year, investments were added in equity markets of Japan, South Korea, and Hong Kong. This investment is hedged against the dollar, so as not to create currency exposure to the currencies of those markets. At the end of the year, the share of equities in the portfolio was 9.2 percent (Table 5).
Table 5: Equity Indices16
16
MSCI equity market indices for each country.
Index Return Since Initial
Investment
Index Return
2015
Holding Percentage
End of 2015
Holding Percentage
Start of 2015
59%1%5.7%5.5%US8%0%0.5%1.1%UK31%13%0.0%0.2%France33%11%1.9%1.4%Germany10%10%0.6%0.0%Japan1%0%0.3%0.0%Korea-2%-2%0.2%0.0%Hong Kong
9.2%8.2%Total
21
The investment in equities is for the long term, is characterized by high volatility, and is liable to generate short-term losses.
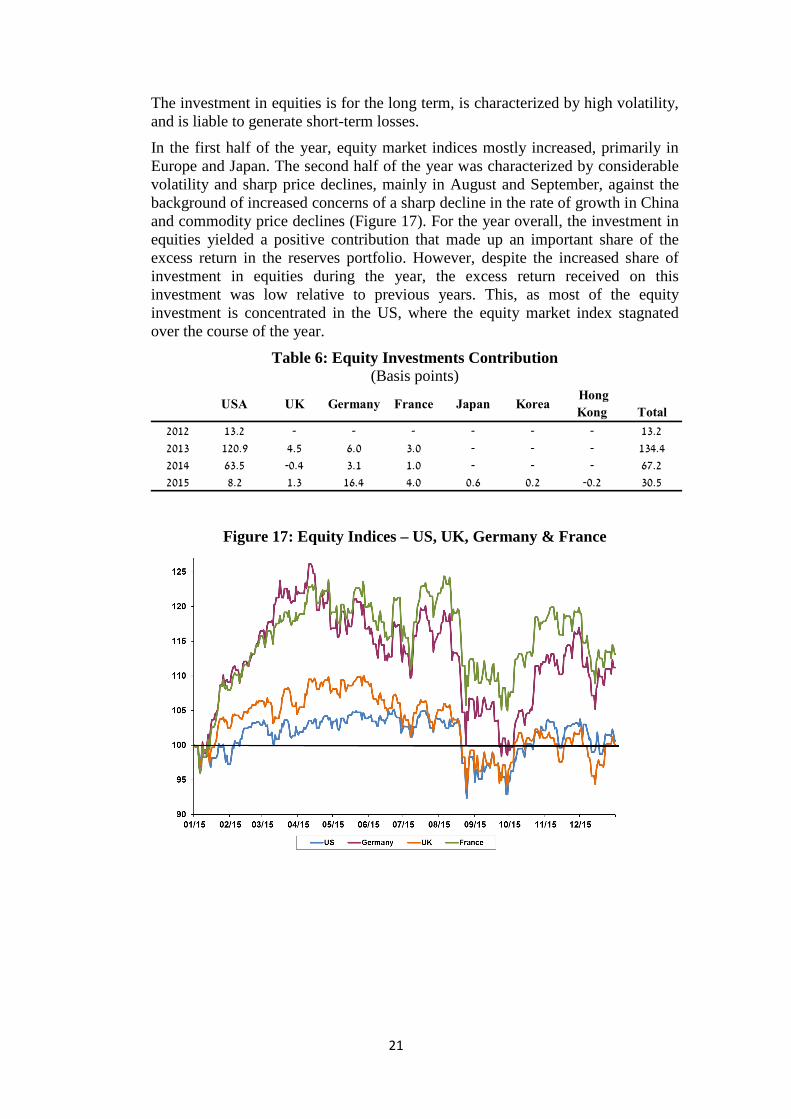
In the first half of the year, equity market indices mostly increased, primarily in Europe and Japan. The second half of the year was characterized by considerable volatility and sharp price declines, mainly in August and September, against the background of increased concerns of a sharp decline in the rate of growth in China and commodity price declines (Figure 17). For the year overall, the investment in equities yielded a positive contribution that made up an important share of the excess return in the reserves portfolio. However, despite the increased share of investment in equities during the year, the excess return received on this investment was low relative to previous years. This, as most of the equity investment is concentrated in the US, where the equity market index stagnated over the course of the year.
Table 6: Equity Investments Contribution (Basis points)
Figure 17: Equity Indices – US, UK, Germany & France
Total
Hong
KongKoreaJapanFranceGermanyUKUSA
13.2------13.22012
134.4---3.06.04.5120.92013
67.2---1.03.1-0.463.52014
30.5-0.20.20.64.016.41.38.22015
22
2.c Debt instruments that are not included in the benchmark and other exposures (8.6 basis points)
1. Investment in spread assets (8 basis points)
The benchmark represents a conservative, liquid, portfolio of assets that can be invested in with minimum risk. Therefore it consists solely of short-term high-grade government bonds, of selected countries whose currencies are included in the numeraire. In contrast, the active management includes investment in spread assets—which are assets whose yield spread is measured as the differential between their yield to maturity and that of government bonds with a similar term to maturity. This year, investment in spread assets stood out, yielding a return higher than that of government bonds with similar duration.
2. Investment in corporate bonds (0.2 basis points)
Within the framework of the strategic allocation for 2015, it was decided to increase the investment in corporate bonds rated BBB- and higher, in accordance with market conditions and with the expected level of spreads. This is subject to the guidelines, which allow investment in such bonds up to 6 percent of the reserves and in continuation of the initial pilot investment in this component, of 1 percent, in 2014.
The investment in the US corporate bond market is carried out both via internal management and via external money managers who specialize in investments in this asset class. The investment is actively managed within the limitation of degrees of freedom against a recognized benchmark with broad coverage of the US corporate bond market. Throughout the year, the investment in this component was increased, ending the year at 4.6 percent of the reserves.
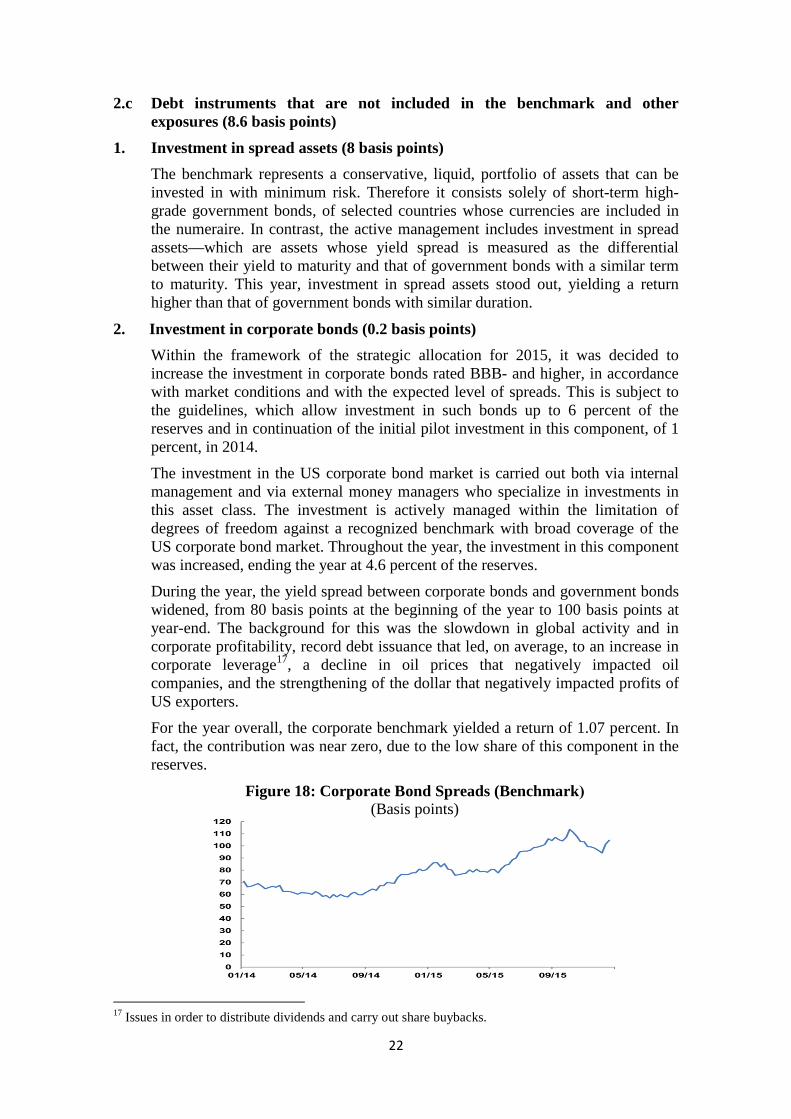
During the year, the yield spread between corporate bonds and government bonds widened, from 80 basis points at the beginning of the year to 100 basis points at year-end. The background for this was the slowdown in global activity and in corporate profitability, record debt issuance that led, on average, to an increase in corporate leverage17, a decline in oil prices that negatively impacted oil companies, and the strengthening of the dollar that negatively impacted profits of US exporters.
For the year overall, the corporate benchmark yielded a return of 1.07 percent. In fact, the contribution was near zero, due to the low share of this component in the reserves.
Figure 18: Corporate Bond Spreads (Benchmark) (Basis points)
17
Issues in order to distribute dividends and carry out share buybacks.
23
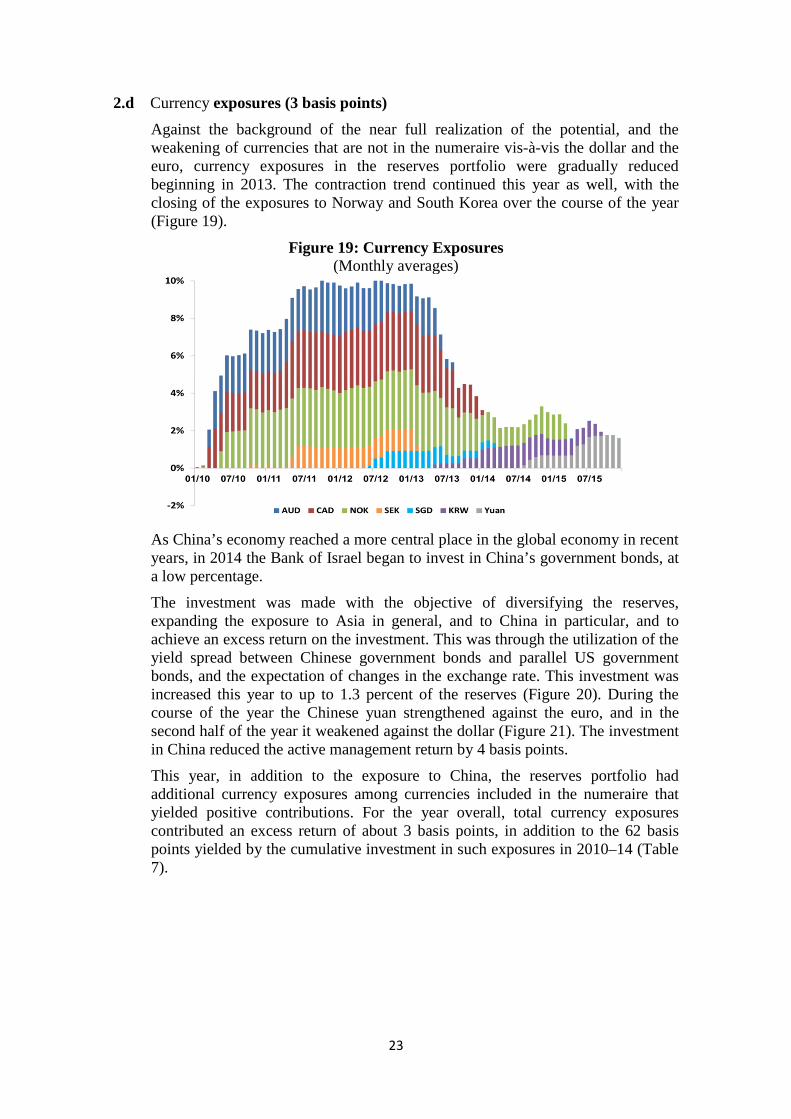
2.d Currency exposures (3 basis points)
Against the background of the near full realization of the potential, and the weakening of currencies that are not in the numeraire vis-à-vis the dollar and the euro, currency exposures in the reserves portfolio were gradually reduced beginning in 2013. The contraction trend continued this year as well, with the closing of the exposures to Norway and South Korea over the course of the year (Figure 19).
Figure 19: Currency Exposures (Monthly averages)
As China’s economy reached a more central place in the global economy in recent years, in 2014 the Bank of Israel began to invest in China’s government bonds, at a low percentage.
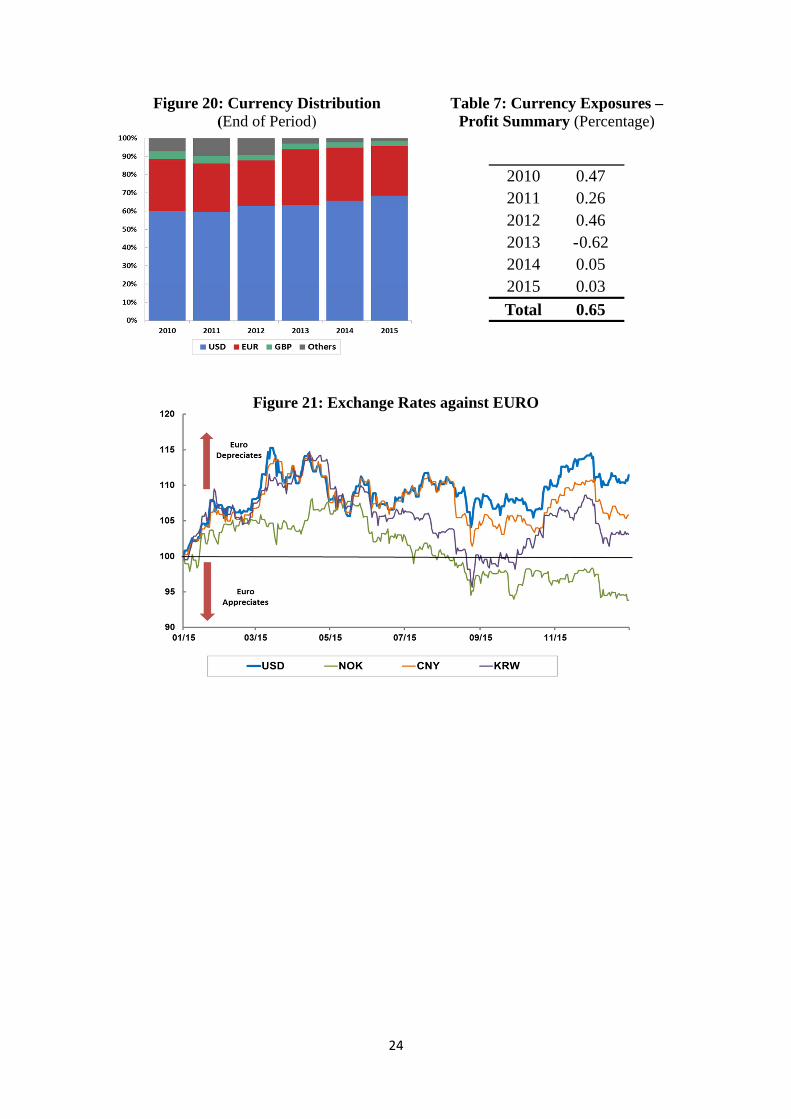
The investment was made with the objective of diversifying the reserves, expanding the exposure to Asia in general, and to China in particular, and to achieve an excess return on the investment. This was through the utilization of the yield spread between Chinese government bonds and parallel US government bonds, and the expectation of changes in the exchange rate. This investment was increased this year to up to 1.3 percent of the reserves (Figure 20). During the course of the year the Chinese yuan strengthened against the euro, and in the second half of the year it weakened against the dollar (Figure 21). The investment in China reduced the active management return by 4 basis points.
This year, in addition to the exposure to China, the reserves portfolio had additional currency exposures among currencies included in the numeraire that yielded positive contributions. For the year overall, total currency exposures contributed an excess return of about 3 basis points, in addition to the 62 basis points yielded by the cumulative investment in such exposures in 2010–14 (Table 7).
24
Figure 20: Currency Distribution (End of Period)
Table 7: Currency Exposures – Profit Summary (Percentage)
Figure 21: Exchange Rates against EURO
2010 0.472011 0.262012 0.462013 -0.622014 0.052015 0.03
Total 0.65
25
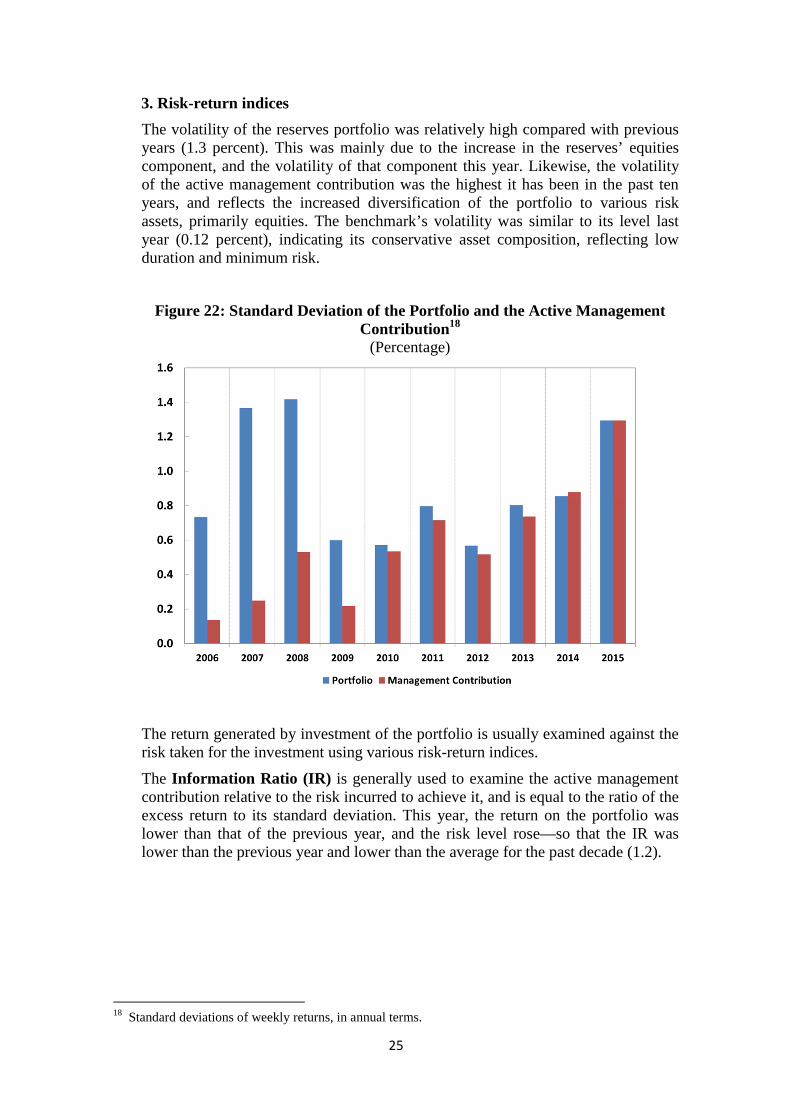
3. Risk-return indices
The volatility of the reserves portfolio was relatively high compared with previous years (1.3 percent). This was mainly due to the increase in the reserves’ equities component, and the volatility of that component this year. Likewise, the volatility of the active management contribution was the highest it has been in the past ten years, and reflects the increased diversification of the portfolio to various risk assets, primarily equities. The benchmark’s volatility was similar to its level last year (0.12 percent), indicating its conservative asset composition, reflecting low duration and minimum risk.
Figure 22: Standard Deviation of the Portfolio and the Active Management Contribution 18
(Percentage)
The return generated by investment of the portfolio is usually examined against the risk taken for the investment using various risk-return indices.
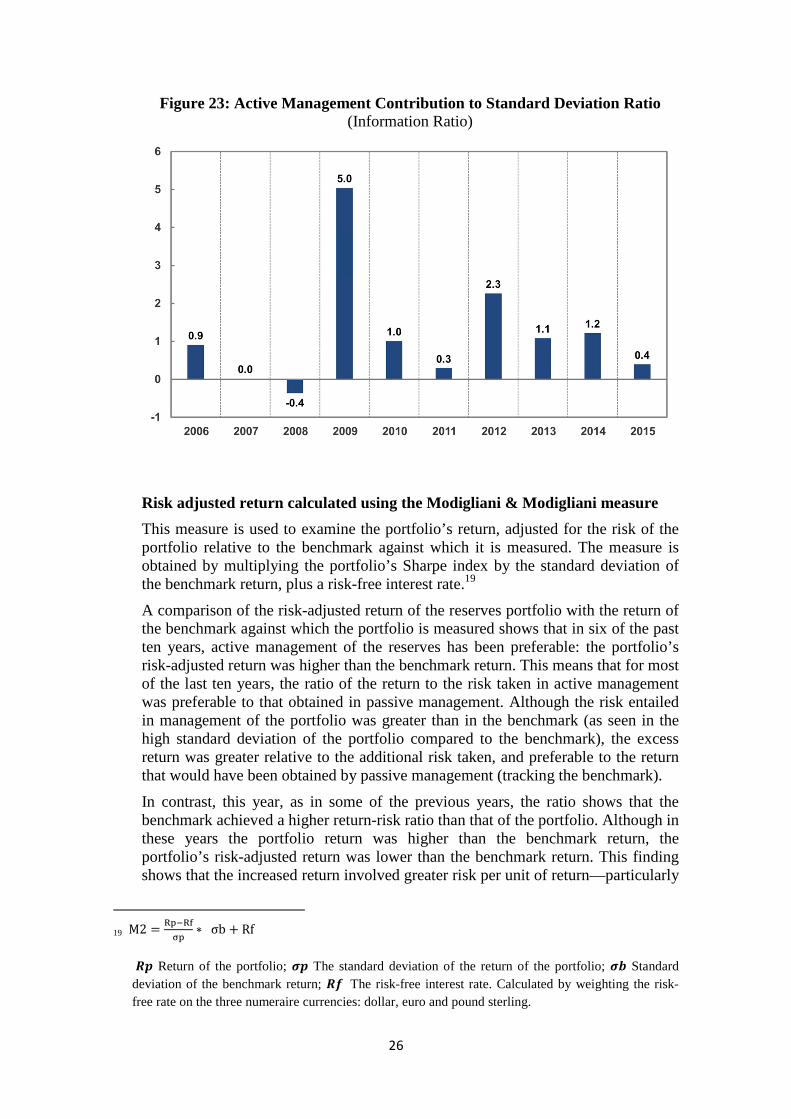
The Information Ratio (IR) is generally used to examine the active management contribution relative to the risk incurred to achieve it, and is equal to the ratio of the excess return to its standard deviation. This year, the return on the portfolio was lower than that of the previous year, and the risk level rose—so that the IR was lower than the previous year and lower than the average for the past decade (1.2).
18
Standard deviations of weekly returns, in annual terms.
26
Figure 23: Active Management Contribution to Standard Deviation Ratio (Information Ratio)
Risk adjusted return calculated using the Modigliani & Modigliani measure
This measure is used to examine the portfolio’s return, adjusted for the risk of the portfolio relative to the benchmark against which it is measured. The measure is obtained by multiplying the portfolio’s Sharpe index by the standard deviation of the benchmark return, plus a risk-free interest rate.19
A comparison of the risk-adjusted return of the reserves portfolio with the return of the benchmark against which the portfolio is measured shows that in six of the past ten years, active management of the reserves has been preferable: the portfolio’s risk-adjusted return was higher than the benchmark return. This means that for most of the last ten years, the ratio of the return to the risk taken in active management was preferable to that obtained in passive management. Although the risk entailed in management of the portfolio was greater than in the benchmark (as seen in the high standard deviation of the portfolio compared to the benchmark), the excess return was greater relative to the additional risk taken, and preferable to the return that would have been obtained by passive management (tracking the benchmark).
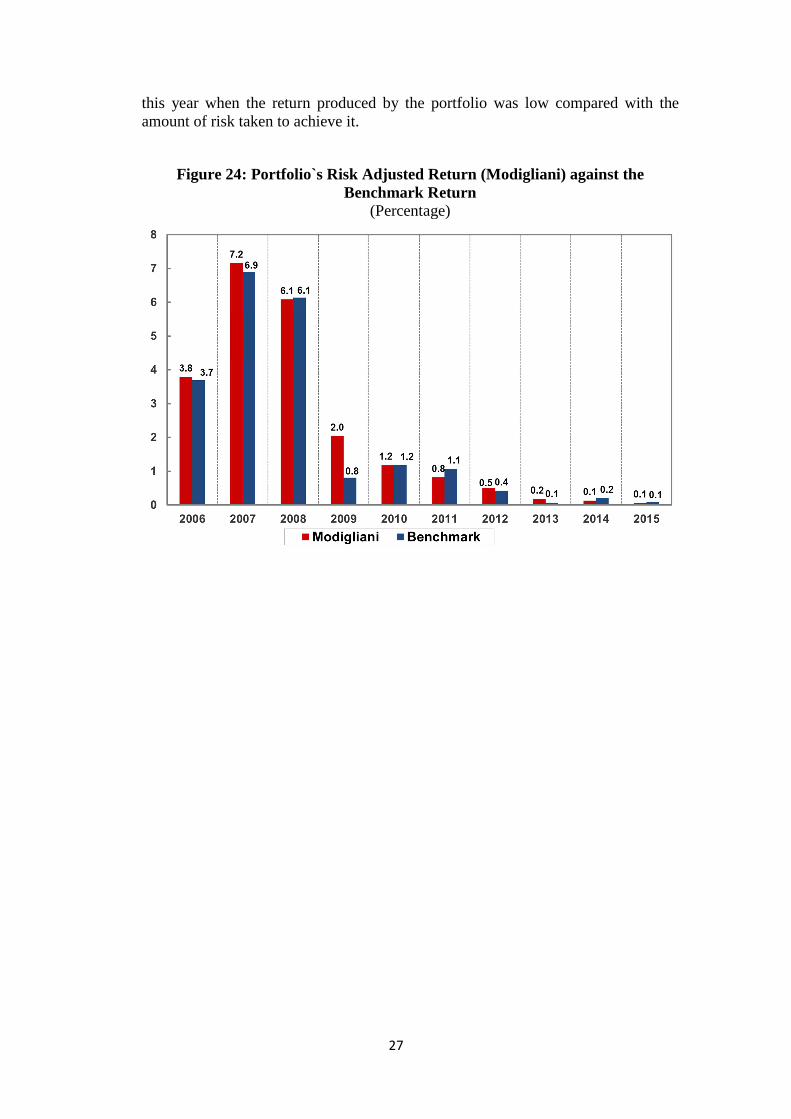
In contrast, this year, as in some of the previous years, the ratio shows that the benchmark achieved a higher return-risk ratio than that of the portfolio. Although in these years the portfolio return was higher than the benchmark return, the portfolio’s risk-adjusted return was lower than the benchmark return. This finding shows that the increased return involved greater risk per unit of return—particularly
19 M2 ������
��∗ σb Rf
�� Return of the portfolio; �� The standard deviation of the return of the portfolio; �� Standard deviation of the benchmark return; �� The risk-free interest rate. Calculated by weighting the risk-free rate on the three numeraire currencies: dollar, euro and pound sterling.
27
this year when the return produced by the portfolio was low compared with the amount of risk taken to achieve it.
Figure 24: Portfolio`s Risk Adjusted Return (Modigliani) against the Benchmark Return
(Percentage)
28
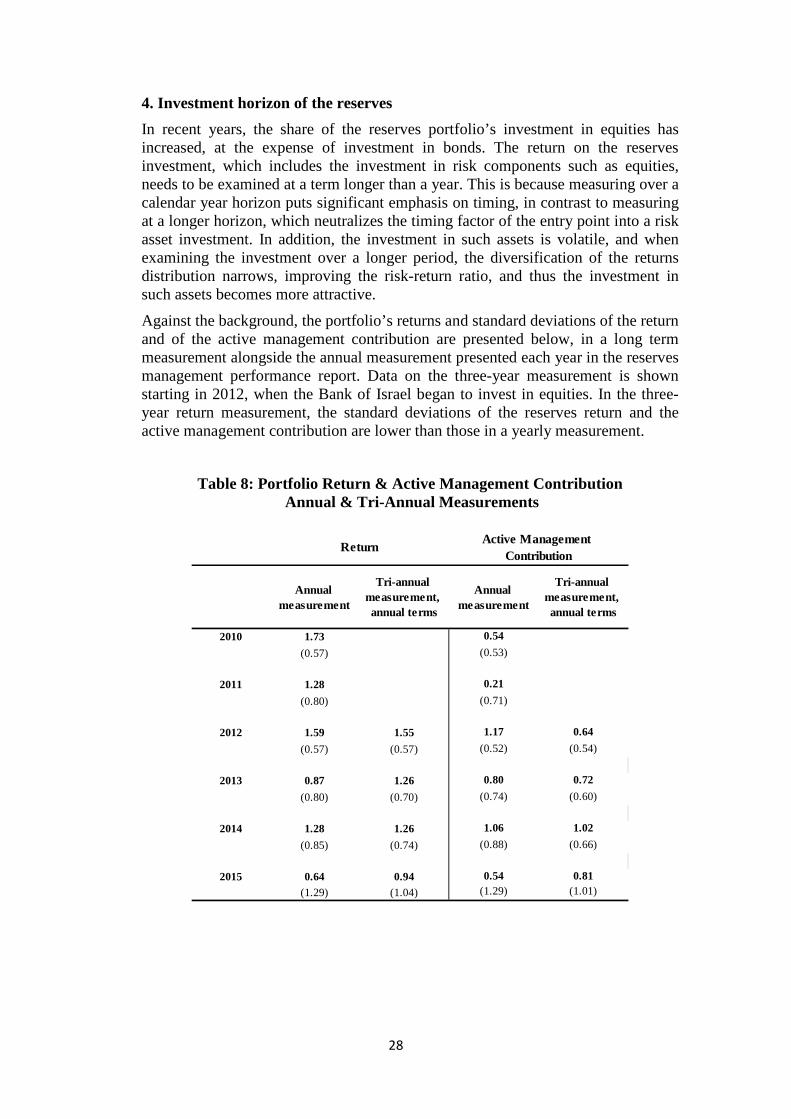
4. Investment horizon of the reserves
In recent years, the share of the reserves portfolio’s investment in equities has increased, at the expense of investment in bonds. The return on the reserves investment, which includes the investment in risk components such as equities, needs to be examined at a term longer than a year. This is because measuring over a calendar year horizon puts significant emphasis on timing, in contrast to measuring at a longer horizon, which neutralizes the timing factor of the entry point into a risk asset investment. In addition, the investment in such assets is volatile, and when examining the investment over a longer period, the diversification of the returns distribution narrows, improving the risk-return ratio, and thus the investment in such assets becomes more attractive.
Against the background, the portfolio’s returns and standard deviations of the return and of the active management contribution are presented below, in a long term measurement alongside the annual measurement presented each year in the reserves management performance report. Data on the three-year measurement is shown starting in 2012, when the Bank of Israel began to invest in equities. In the three-year return measurement, the standard deviations of the reserves return and the active management contribution are lower than those in a yearly measurement.
Table 8: Portfolio Return & Active Management Contribution Annual & Tri-Annual Measurements
2010 1.73 0.54
(0.57) (0.53)
2011 1.28 0.21
(0.80) (0.71)
2012 1.59 1.55 1.17 0.64
(0.57) (0.57) (0.52) (0.54)
2013 0.87 1.26 0.80 0.72
(0.80) (0.70) (0.74) (0.60)
2014 1.28 1.26 1.06 1.02
(0.85) (0.74) (0.88) (0.66)
2015 0.64 0.94 0.54 0.81
(1.29) (1.04) (1.29) (1.01)
Annual measurement
Tri-annual measurement, annual terms
Annual measurement
ReturnActive Management
Contribution
Tri-annual measurement, annual terms
29
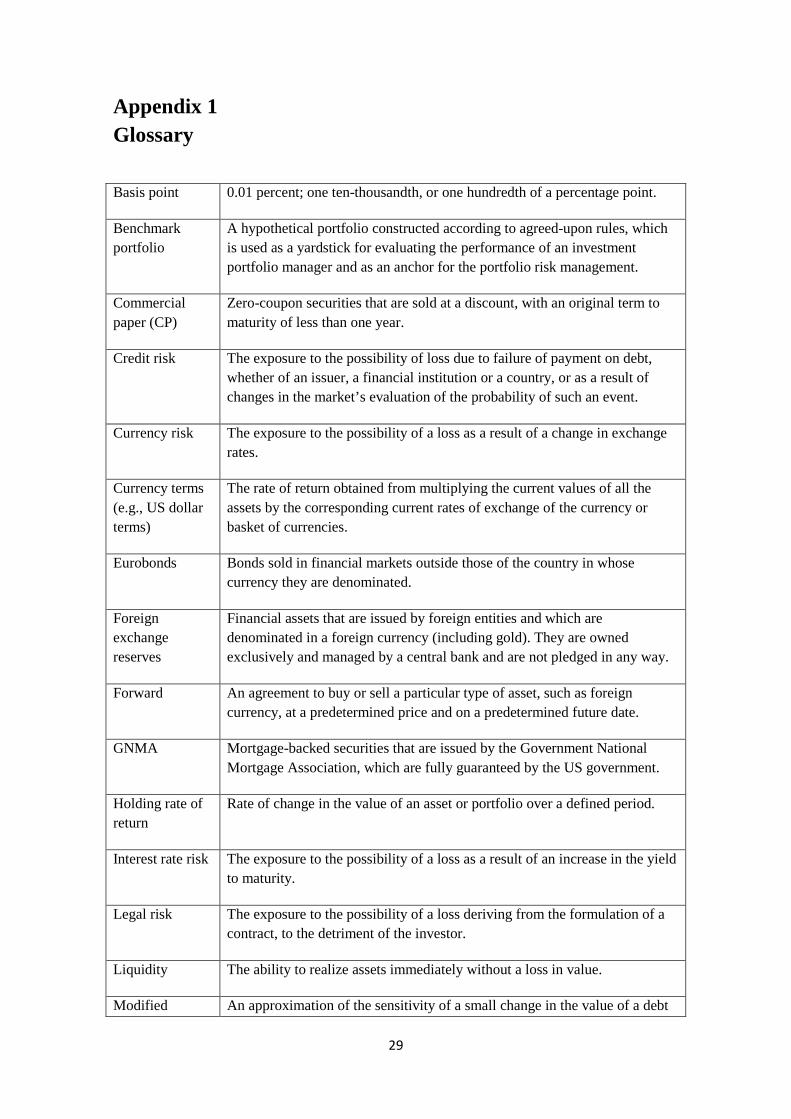
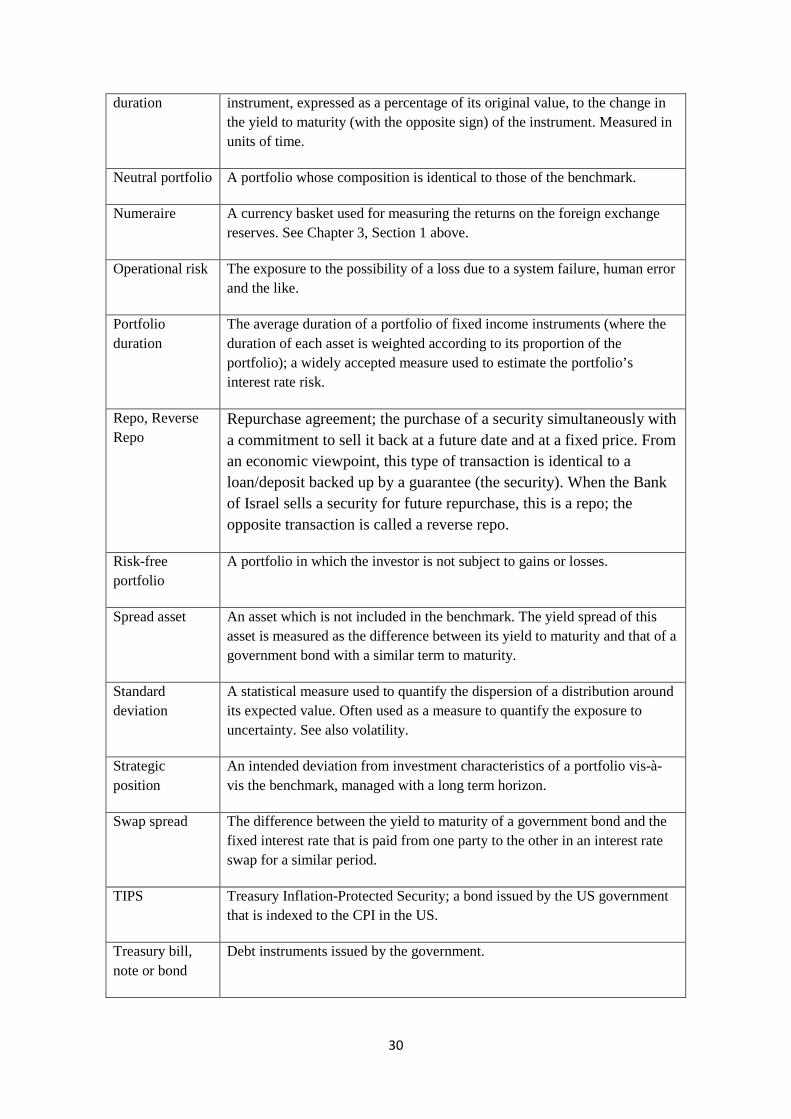
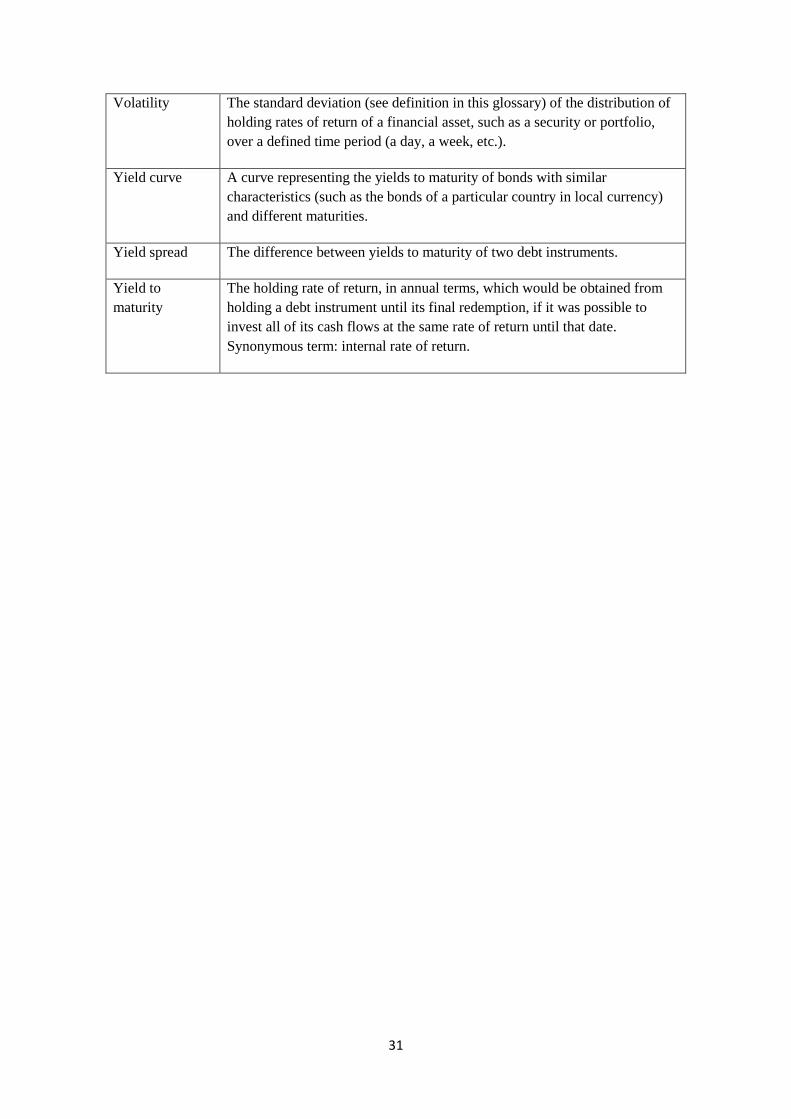
Appendix 1 Glossary
0.01 percent; one ten-thousandth, or one hundredth of a percentage point. Basis point
A hypothetical portfolio constructed according to agreed-upon rules, which is used as a yardstick for evaluating the performance of an investment portfolio manager and as an anchor for the portfolio risk management.
Benchmark portfolio
Zero-coupon securities that are sold at a discount, with an original term to maturity of less than one year.
Commercial paper (CP)
The exposure to the possibility of loss due to failure of payment on debt, whether of an issuer, a financial institution or a country, or as a result of changes in the market’s evaluation of the probability of such an event.
Credit risk
The exposure to the possibility of a loss as a result of a change in exchange rates.
Currency risk
The rate of return obtained from multiplying the current values of all the assets by the corresponding current rates of exchange of the currency or basket of currencies.
Currency terms (e.g., US dollar terms)
Bonds sold in financial markets outside those of the country in whose currency they are denominated.
Eurobonds
Financial assets that are issued by foreign entities and which are denominated in a foreign currency (including gold). They are owned exclusively and managed by a central bank and are not pledged in any way.
Foreign exchange reserves
An agreement to buy or sell a particular type of asset, such as foreign currency, at a predetermined price and on a predetermined future date.
Forward
Mortgage-backed securities that are issued by the Government National Mortgage Association, which are fully guaranteed by the US government.
GNMA
Rate of change in the value of an asset or portfolio over a defined period. Holding rate of return
The exposure to the possibility of a loss as a result of an increase in the yield to maturity.
Interest rate risk
The exposure to the possibility of a loss deriving from the formulation of a contract, to the detriment of the investor.
Legal risk
The ability to realize assets immediately without a loss in value. Liquidity
An approximation of the sensitivity of a small change in the value of a debt Modified
30
instrument, expressed as a percentage of its original value, to the change in the yield to maturity (with the opposite sign) of the instrument. Measured in units of time.
duration
A portfolio whose composition is identical to those of the benchmark. Neutral portfolio
A currency basket used for measuring the returns on the foreign exchange reserves. See Chapter 3, Section 1 above.
Numeraire
The exposure to the possibility of a loss due to a system failure, human error and the like.
Operational risk
The average duration of a portfolio of fixed income instruments (where the duration of each asset is weighted according to its proportion of the portfolio); a widely accepted measure used to estimate the portfolio’s interest rate risk.
Portfolio duration
Repurchase agreement; the purchase of a security simultaneously with a commitment to sell it back at a future date and at a fixed price. From an economic viewpoint, this type of transaction is identical to a loan/deposit backed up by a guarantee (the security). When the Bank of Israel sells a security for future repurchase, this is a repo; the opposite transaction is called a reverse repo.
Repo, Reverse Repo
A portfolio in which the investor is not subject to gains or losses. Risk-free portfolio
An asset which is not included in the benchmark. The yield spread of this asset is measured as the difference between its yield to maturity and that of a government bond with a similar term to maturity.
Spread asset
A statistical measure used to quantify the dispersion of a distribution around its expected value. Often used as a measure to quantify the exposure to uncertainty. See also volatility.
Standard deviation
An intended deviation from investment characteristics of a portfolio vis-à-vis the benchmark, managed with a long term horizon.
Strategic position
The difference between the yield to maturity of a government bond and the fixed interest rate that is paid from one party to the other in an interest rate swap for a similar period.
Swap spread
Treasury Inflation-Protected Security; a bond issued by the US government that is indexed to the CPI in the US.
TIPS
Debt instruments issued by the government. Treasury bill, note or bond
31
The standard deviation (see definition in this glossary) of the distribution of holding rates of return of a financial asset, such as a security or portfolio, over a defined time period (a day, a week, etc.).
Volatility
A curve representing the yields to maturity of bonds with similar characteristics (such as the bonds of a particular country in local currency) and different maturities.
Yield curve
The difference between yields to maturity of two debt instruments. Yield spread
The holding rate of return, in annual terms, which would be obtained from holding a debt instrument until its final redemption, if it was possible to invest all of its cash flows at the same rate of return until that date. Synonymous term: internal rate of return.
Yield to maturity
32
Appendix 2 Foreign Exchange Reserves: Investment Policy Guidelines
Foreign Exchange Reserves: Investment Policy Guidelines20 In effect from January 7, 2014
In accordance with Section 40(b) of the Bank of Israel Law, 5770-2010, the Monetary Committee is to establish the guidelines for the investment policy of the foreign exchange reserves. 1. Basic guidelines derived from the goals of holding the reserves
The investment policy of the reserves portfolio is based on the main goal of achieving the Bank of Israel's objectives and proper fulfillment of its functions as they are detailed in the Bank of Israel Law. Subject to that, the investment policy is also based on the following goals:
a) Maintaining the purchasing power of the reserves: This principle is interpreted as preserving the value of the reserves in terms of measurement currency chosen by the Bank—the numeraire (see 3 below).
b) Managing the reserves with a high level of liquidity: A large part of the reserves are to be invested in assets that can be liquidated rapidly at short notice and without negatively impacting their value. The precise level of liquidity is to be increased to the extent that the actual level of reserves relative to the desired level is low (5(e) below).
c) Achieving an appropriate return on the reserves portfolio, at an acceptable level of risk, to the extent that it does not negatively impact the achievement of the previous goals (see 4 below).
2. The division of work between the Monetary Committee, the Foreign Currency Committee, and the Markets Operations Department
In implementing Section 40(b) of the Bank of Israel Law, the Committee made a distinction between establishing the guidelines and periodic monitoring, and setting the detailed instructions for the day to day management of the portfolio.
The Monetary Committee will set the guidelines, in consultation with the Minister of Finance as established by law, will update the guidelines to the extent necessary, and will monitor the implementation of the investment policy by the Markets Operations Department.
The Foreign Currency Committee Committee—an internal Bank of Israel committee headed by the Governor—will translate the guidelines into the detailed foreign exchange reserves investment policy.
20 The characteristics of the reserves portfolio are reported to the public in an annual report published on the Bank of Israel website.
33
The Market Operations Department will implement the investment policy, within the framework of degrees of freedom which will be set periodically by the Monetary Committee and the Foreign Currency Committee, and will report to the Monetary Committee and the Foreign Currency Committee on a quarterly basis on the implementation of the policy: developments in international markets and their impact on the management of the reserves, the investment decisions reached by the Department, the portfolio's rate of return, and the financial and other risks to which the portfolio is exposed.
The Market Operations Department will advise the Monetary Committee and the Foreign Currency Committee on fulfilling their functions, through position papers and suggestions for discussion in the Committees.
The Monetary Committee will approve and update periodically the division of authorities regarding the investment policy of the foreign exchange reserves.
3. The measurement currency for the holding rate of return on the foreign exchange reserves and the principles for its determination
The measurement currency for the holding rate of return on the reserves—hereinafter, the numeraire—is a basket of currencies and its composition allocation21 is decided by the Monetary Committee. The allocation of the numeraire is set according to principles which reflect the goals of holding the reserves.
The principles according to which the composition of the numeraire is set are:
a) The currency composition of actual imports, and of imports expected in an emergency situation
b) The composition of the short and medium term external debt c) Assessments regarding the liquidity of the various currencies in which investment is
possible.
The composition of the numeraire is also examined from the perspective of the currency composition of foreign exchange reserves portfolios of all central banks of countries that are IMF members, as reported by the IMF.
21 The numeraire is defined in terms of units of currency (i.e., X dollars, Y euro, and Z pound sterling). The ratio between the currency units (in the above example, X:Y:Z) is determined by the currency composition of the portfolio (in the above example, % of dollars in the portfolio, % euro, and % pound sterling), which is set by the Committee and the exchange rates of the numeraire currencies at the time of the decision.
34
The composition of the numeraire will be set at the end of each year by the Monetary Committee, on the basis of the Market Operations Department’s recommendation, in accordance with changes in domestic and global market conditions. If there are significant changes in one or more of principles (a)–(c), the composition of the numeraire will be brought to discussion by the Monetary Committee.
The reserves portfolio holding rate of return is measured in terms of the numeraire, so that the currency basket which makes up the numeraire is seen by the reserves portfolio managers as a risk-free currency composition.
4. The risk profile
The risk profile determines the maximum level of risk that the Monetary Committee is willing to accept in order to achieve the goals of holding the reserves. In establishing the risk profile, scenario analysis and a range of analytical tools to measure risk, such as VaR, CVaR, and others should be used. The risk profile is to be set by the Committee on a periodic basis in accordance with the changing conditions in the global capital markets.
The risk profile will be set so that given the worst 5 percent of outcomes, the average loss will not be greater than 400 basis points over a 1-year horizon.
5. The rules for managing the financial risks of the reserves
The rules for managing the financial risks to which the reserves are exposed, and their asset allocation, are to be set in accordance with the goals of the investment policy of the reserves (Section 1 above) and subject to the risk profile set by the Monetary Committee (Section 4). The asset allocation of the foreign exchange reserves will be approved at least once a year by the Monetary Committee.
a) The types of assets approved for use in managing the reserves are: 1. Bonds (including bonds with fixed interest, with variable interest, and CPI-indexed
bonds) 2. Mortgage-backed securities (MBS) and asset-backed securities (ABS), a maximum of
6% of total reserves 3. Tradable Certificates of Deposit (CDs) 4. Fixed term deposits 5. Commercial Paper (CP) 6. Equities, a maximum of 12% of total reserves 7. Derivatives whose underlying asset is permitted for investment.
35
b) Management against a benchmark Control over most features of the financial risk of the reserves is anchored in their management against a system of benchmarks. The rules for managing the financial risks of the reserves generate the currency allocation of the benchmarks, the features of their price risk (such as duration) in each currency, and the asset types included in it. The investment returns of the portfolio managers are measured against these benchmarks.
c) Currency risk: The currency exposure of the reserves is set by:
1) The composition of the numeraire. 2) Strategic currency positions relative to the composition of the numeraire: The extent of the
strategic currency positions is limited to 10 percent of total reserves. The composition and amounts of the positions will be set by the Monetary Committee.
3) Short and medium term currency positions relative to the composition of the numeraire: Their amount is limited to 2 percent of the total reserves. The composition and amounts of the positions will be set by the Market Operations Department.
d) Credit risk: In order to limit the credit risk inherent in day-to-day management of the reserves portfolio, the Monetary Committee set the following rules:
1. Investment is permitted in the currency of countries for which their major credit rating category is at least A. Investment in countries for which their credit rating group is BBB requires the specific authorization of the Monetary Committee.
2. Investment in bonds and commercial paper issued by governments, or with government guarantees, is permitted if their major rating category is at least BBB. Investment in the BBB major rating category is limited to 1 percent of total reserves. Investment in such assets, if their major credit rating category is BBB, requires the specific authorization of the Monetary Committee.
3. Investment in bonds of public sector entities (PSE) is limited to a maximum of 15 percent of total reserves, and only in bonds those whose major credit rating category is at least A. Investment in such assets, if their major credit rating category group is below AA, is limited to 1 percent of total reserves.
4. Investment in corporate bonds is limited to 6 percent of total reserves, and only in bonds whose major credit rating category is at least BBB.
5. Investment in bonds and deposits of international financial institutions is limited to 15 percent of the reserves.
6. The exposure of the reserves to the international banking system should not be greater than 10 percent of total reserves, and that is only to banks whose major credit rating category is at least A. Activity with banks and brokers whose major credit rating category is BBB is limited to DVP22 (delivery versus payment) alone.
22 DVP activity is when the payment and the asset are transferred between the sides at the same time and thus the credit risk in such activity is essentially zero.
36
e) Liquidity risk: In order to provide an immediate response to the financial problems which arise during emergencies, a large portion of the reserves should be invested in assets that can be liquidated in large amounts at short notice and without negatively impacting their realization value.
The assets in which the reserves are invested are classified into 3 levels of liquidity:
1. Assets that can be realized within a week without negatively impacting their realization value.
2. Assets that can be realized within a month without negatively impacting their realization value.
3. Assets that can be realized within six months without negatively impacting their realization value.
There is a minimum level of investment in the two highest liquidity levels, and there is a maximum threshold for the third level. Classification into the various liquidity levels can change due to changes in market conditions. In order to meet the liquidity demands, the Committee established that at least 45 percent of the total reserves are to be invested in government bonds.
f) Active management and compliance rules:
The reserves portfolio is actively managed within the framework of limited and well defined degrees of freedom, as long as the investment policy adheres to the guidelines.
6. The nonfinancial risks inherent in managing the reserves
In determining the investment policy for the reserves, there must be taken into account the exposure of the Bank and of the portfolio to the various nonfinancial risks inherent in investing the reserves—reputation risk, legal risk, political risk, operational risk, and so forth.
7. Measuring returns and reporting them
The reserves are managed with transparency. The Market Operations Department shall report periodically to the Monetary Committee (see 2 above) on the amount of the reserves and changes in them, the currency composition, changes in currency positions, the asset allocation, portfolio duration, country exposure, credit risk, liquidity risk, and the return on the portfolio and its various components. The report should include an analysis of the current developments in the financial markets and their effect on the management of the reserves.
37
Appendix 3 Principles for Determining the Desired Level of Foreign Exchange Reserves
1. The appropriate level of foreign exchange reserves as an indicator of the economic strength of the country
Countries hold foreign exchange reserves for three main purposes:
A. To enable the central bank to intervene in the foreign exchange market in circumstances in which (1) the exchange rate deviates from the range that is consistent with the economy’s fundamental equilibrium; or (2) the foreign exchange market is not functioning adequately (market failure);
B. To enable the central bank to operate in the foreign exchange market in order to moderate the effect of large capital flows from either foreign or local residents, which are liable to undermine the stability of the financial markets, and thus negatively impact the stability of the economy as a whole (a specific case of A);
C. To allow for the provision of sufficient foreign currency to the economy in an emergency situation (such as a war or a strong earthquake). In such circumstances, there will be a need to increase imports rapidly and by a significant amount in order to deal with the emergency, while exports may also be adversely affected and therefore this source of foreign currency will also be reduced. Under such circumstances, the government and the private sector will find it difficult to raise foreign currency abroad and the foreign exchange reserves will be left as the country's main source for financing in foreign currency.
Therefore, holding an appropriate level of foreign exchange reserves is considered by local and foreign financial institutions, companies, households and rating agencies as a main indicator of a country’s economic resilience. The larger a country’s foreign exchange reserves are, the greater the ability of policy makers to deal with unavoidable economic and political pressures. Furthermore, large foreign exchange reserves tend to reduce the rates of interest paid both by the government and by the private sector for financing from abroad. In short, in the eyes of the financial markets and of individuals, foreign exchange reserves at an appropriate level make an important contribution to the confidence in a country’s ability to deal with economic, financial and political shocks to the economy.
2. There are various approaches to the calculation of the appropriate level of foreign exchange reserves:
a. Relative to import months: For most of the post-World War II period, the appropriate level of foreign exchange reserves was measured in terms of "import
38
months"—the number of months of imports that the reserves would be able to finance. This approach dominated as long as international capital flows were limited, and the main source of difficulties in foreign exchange was the current account of the balance of payments.
b. Relative to capital flows: During the 1990s, it became clear that many financial crises were caused by large-scale capital flows, that is, disruptions in the capital account, rather than by disruptions in the current account of the balance of payments. At the end of the 1990s, wide use was made of the Greenspan-Guidotti rule, according to which a country's foreign exchange reserves should be at least as much as the country’s foreign currency liabilities (of both the public and private sectors) during the coming twelve- month period, thus allowing a country to deal with a complete cutoff from sources of foreign currency for a period of one year. The 100 percent rule (according to which the reserves must be equal to the full amount of foreign currency liabilities for one year) was based on an empirical study—how countries survived the financial crises of the 1990s and early 2000s: it was found that countries which operated according to the 100 percent rule were prone to fewer foreign currency attacks, and were better able to deal with them. During the global crisis which began in 2007 it became clear that countries which held foreign exchange reserves exceeding 100 percent were better able to deal with the crisis. The main examples are Brazil, Russia, and South Korea. Each of those countries held foreign exchange reserves that exceeded 100 percent of their foreign exchange liabilities, and they used them effectively to stabilize the exchange rate and/or to maintain financial stability. It is currently recognized that foreign exchange reserves of between 100 percent and 200 percent of an economy's foreign currency liabilities are more effective than a reserves level which meets the Greenspan-Guidotti rule precisely.
c. Relative to potential uses in the future (the eclectic approach): In calculating the appropriate level of foreign exchange reserves for Israel, the Bank of Israel adopted the eclectic approach, which is based on the potential uses of the reserves in an emergency. Clearly, in a time of national emergency, Israel will likely require reserves, both to finance imports (according to the import months approach, including imports of goods and services related to the emergency situation) as well as to deal with capital flows – payments of existing debts to foreign residents, with potential capital flows.
Based on the range of factors listed above and in accordance with the current conditions in Israel's economy, the Governor revised the desired level of reserves to a range of $70–110 billion.23 Additionally, in setting the level of foreign exchange reserves, the cost of holding the reserves24 was taken into account. However, in terms of a risk-reward analysis of holding the reserves, it is difficult to measure quantitatively the advantages and benefits of holding them. The contribution of the reserves to the economy cannot be quantified and priced, among other reasons because their contribution may be critical in emergency situations whose nature and severity are difficult to predict.
23 The Governor updated the range in the beginning of 2015 from the range of $65–90 billion that was set in 2010, and which had remained unchanged since then. The increase in the range of the desired level of reserves is consistent with the changes that occurred in the Israeli economy over the past 5 years. 24 The accounting cost of the Bank of Israel's activity is recorded in the Bank's general ledger. At the same time, the Bank's accounts do not include the expected profit (in terms of stability of the economy) derived from the expected use of the reserves in various situations in the future, nor that derived from market assessments that larger reserves contribute to the economy, as described above.
39
3. Israel's actual level of foreign exchange reserves
Implementing the eclectic approach, which takes into account both the need to import goods and services as well as the potential capital flows related to a crisis situation, must take into account Israel's unique geopolitical situation, which requires a higher level of reserves relative to economic variables which are generally taken into account when calculating the appropriate level of foreign exchange reserves.25
4. Intervention in the foreign exchange market and the appropriate level
It is important to note that, as explained in Section 53 of the Bank of Israel Law, the intervention of the Bank of Israel in the foreign exchange market, in order to fulfill its functions and attain its objectives, may lead to a deviation in the actual level of the reserves from their desirable level. Government and banking system activity can also lead to such a deviation. In general, the Bank will act to change the level of the reserves only when the deviation is significant and prolonged, and only if such action is in line with attaining the Bank's objectives as established in the Bank of Israel Law, which include maintaining price stability, supporting other economic policy goals, and supporting the stability of the financial system. Thus, the foreign currency reserves could deviate from the desired level for extended periods of time.
25 For a discussion on the ratios of the actual reserves to economic variables and a comparison with other countries, please see Part 4 of Chapter A of this report.