Embed Size (px)
Citation preview
The Abundance of Free Oxygen Atoms in the Local ISM from Absorption Lines
Edward B. JenkinsPrinceton University Observatory
Absorption Lines in the Ultraviolet Region
• Only forms of O that can be detected in absorption at wavelengths longward of the Lyman limit at 912 Å:– Neutral oxygen atoms in H I regions– Five-times ionized O ions that are created by
collisional ionization in plasmas with temperatures ≈ 3×10⁵K
Objectives of Measuring the Abundance of Atomic Oxygen in the Neutral ISM and Relating it to that of Hydrogen
• Find out how much oxygen is tied up in the form of molecules and dust grains.
• Understand how the depletion of oxygen is related to other parameters, such as local gas density and the depletions of other elements.
The Spirit of this Conference
• “It is time to confront all these determinations and discuss thoroughly the biases and uncertainties to provide a firm ground for theories and models of chemical evolution of galaxies.”
• “This workshop would then not be principally one of `results’ but rather one of `confrontations and discussions’.”
Biases and Uncertainties
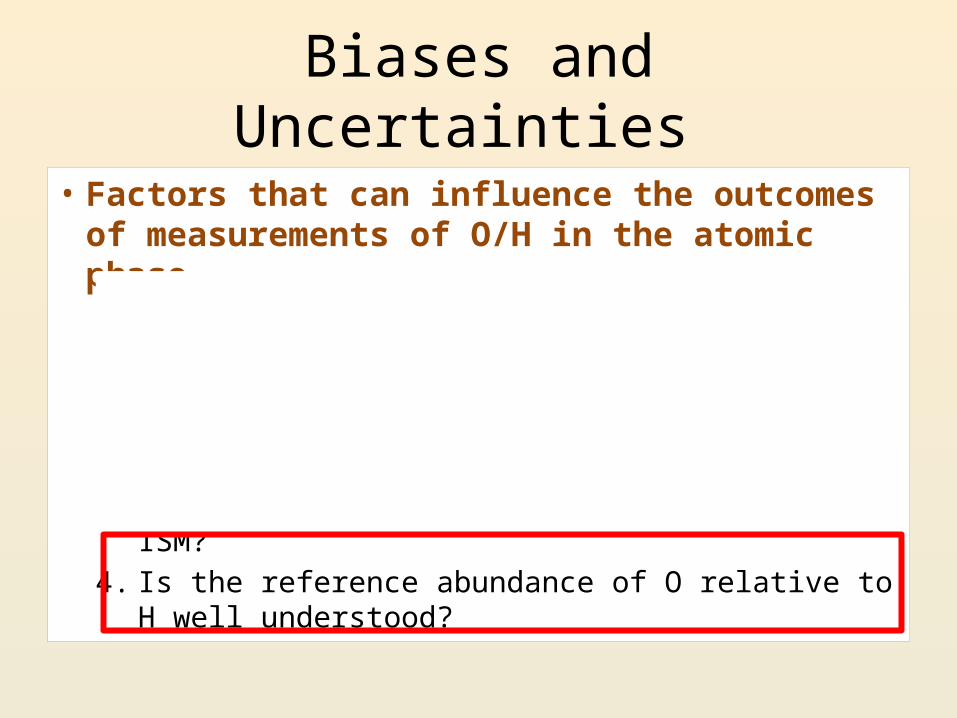
• Factors that can influence the outcomes of measurements of O/H in the atomic phase1. Are all of the O and H atoms in a neutral form
inside H I regions? (or must one apply ionization corrections?)
2. Can we trust measurements of N(H I) in the ISM?3. Can we trust measurements of N(O I) in the ISM?4. Is the reference abundance of O relative to H
well understood?
Ionization Balance of O and H
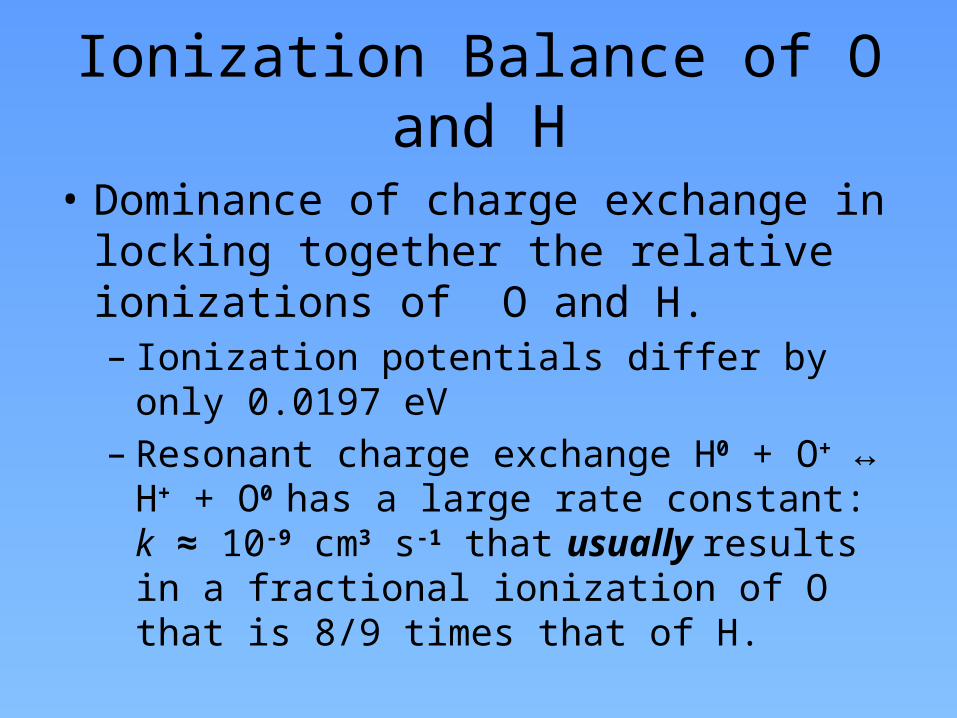
• Dominance of charge exchange in locking together the relative ionizations of O and H.– Ionization potentials differ by only 0.0197 eV– Resonant charge exchange H0 + O+ ↔ H+ + O0 has
a large rate constant: k ≈ 10-9 cm3 s-1 that usually results in a fractional ionization of O that is 8/9 times that of H.
Ionization Balance of O and H
• Dominance of charge exchange in locking together the relative ionizations of O and H.– Ionization potentials differ by only 0.0197 eV– Resonant charge exchange H0 + O+ ↔ H+ + O0 has
a large rate constant: k ≈ 10-9 cm3 s-1 that usually results in a fractional ionization of O that is 8/9 times that of H.
From Draine, B. T. , Physics of the Interstellar and Intergalactic Medium © 2011 Princeton U. Press
Note: This plot in the first printing of this textbook was in error. This is a corrected version that will appear in the second printing.
Biases and Uncertainties
• Factors that can influence the outcomes of measurements of O/H in the atomic phase1. Are all of the O and H atoms in a neutral form
inside H I regions? (or must one apply ionization corrections?)
2. Can we trust measurements of N(H I) in the ISM?3. Can we trust measurements of N(O I) in the ISM?4. Is the reference abundance of O relative to H
well understood?
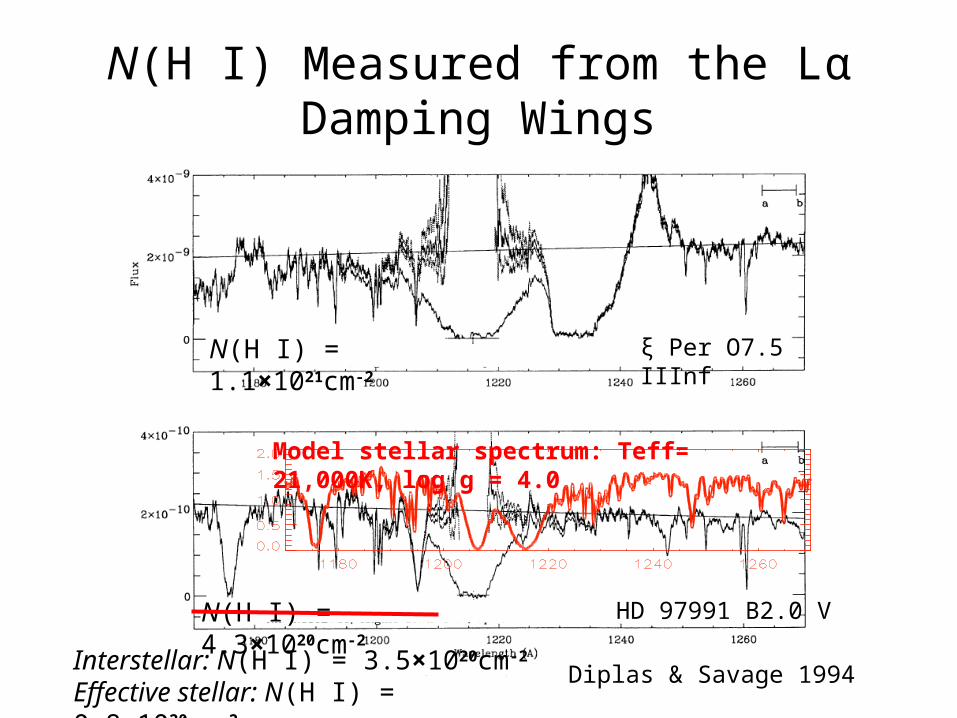
N(H I) Measured from the Lα Damping Wings
ξ Per O7.5 IIInf
HD 97991 B2.0 V
Model stellar spectrum: Teff= 21,000K, log g = 4.0
Diplas & Savage 1994
N(H I) = 1.1×1021cm-2
N(H I) = 4.3×1020cm-2
Interstellar: N(H I) = 3.5×1020cm-2
Effective stellar: N(H I) = 0.8×1020cm-2
Biases and Uncertainties
• Factors that can influence the outcomes of measurements of O/H in the atomic phase1. Are all of the O and H atoms in a neutral form
inside H I regions? (or must one apply ionization corrections?)
2. Can we trust measurements of N(H I) in the ISM?3. Can we trust measurements of N(O I) in the ISM?4. Is the reference abundance of O relative to H
well understood?
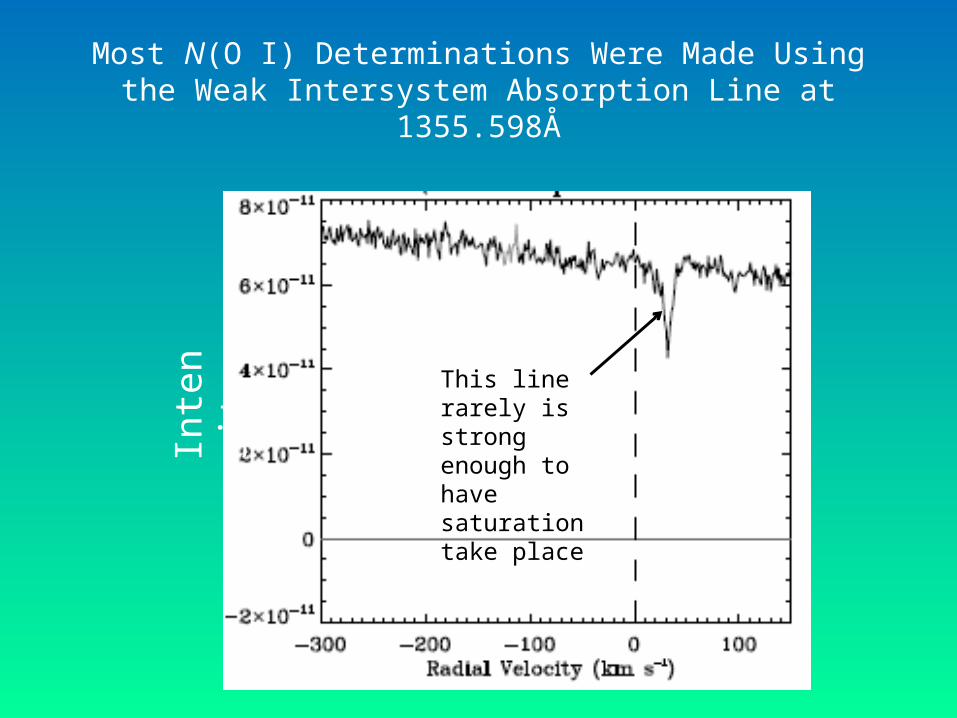
Most N(O I) Determinations Were Made Using the Weak Intersystem Absorption Line at 1355.598Å
Inte
nsit
y
This line rarely is strong enough to have saturation take place
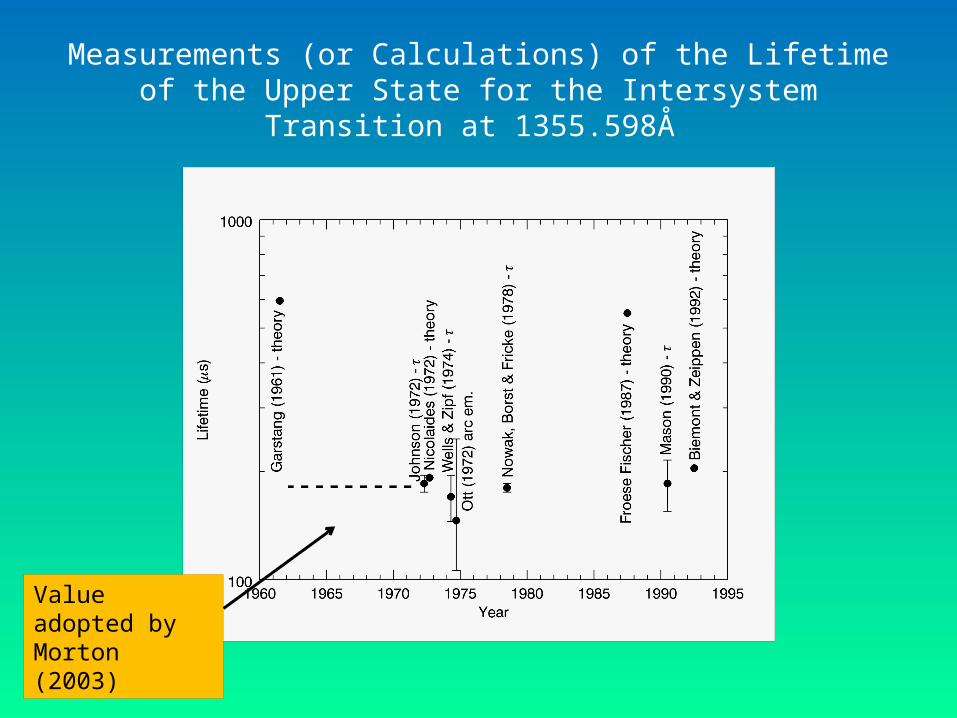
Measurements (or Calculations) of the Lifetime of the Upper State for the Intersystem Transition at 1355.598Å
Value adopted by Morton (2003)
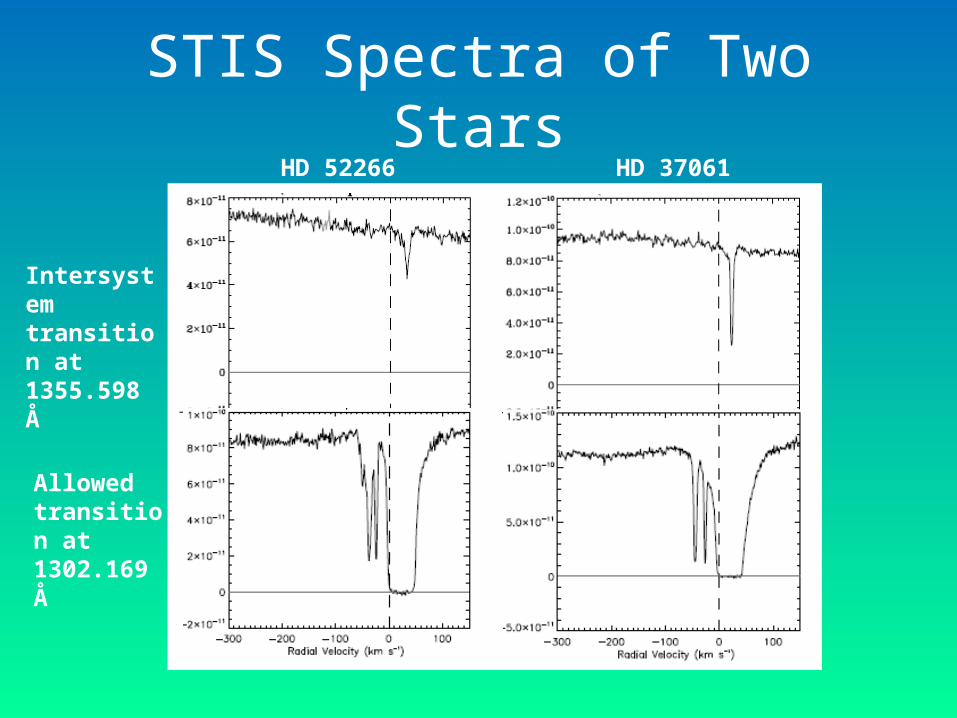
STIS Spectra of Two StarsHD 37061HD 52266
Intersystem transition at 1355.598 Å
Allowed transition at 1302.169 Å
Intersystem transition at 1355.598 Å
Allowed transition at 1302.169 Å
If the f-value of the intersystem transition is correct, this is where we expect to see the damping wings of the allowed transition
1021
1020
1019
1018
1017
1016
1015
1014
Na [
cm-2
(km
/s)-1
]
v (km/s)100500-50-100
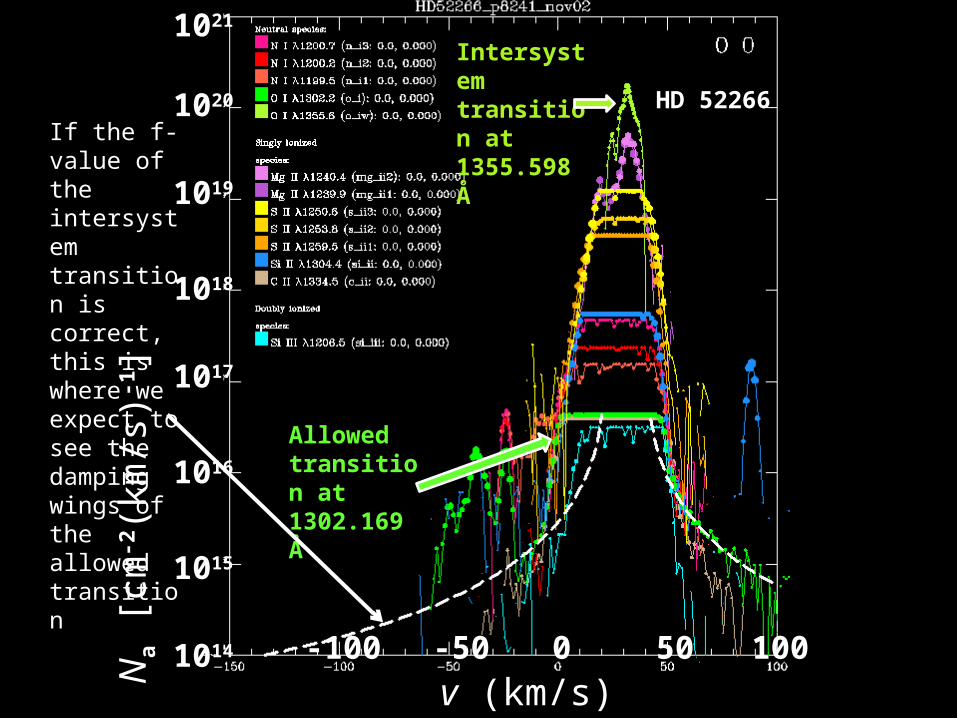
HD 52266
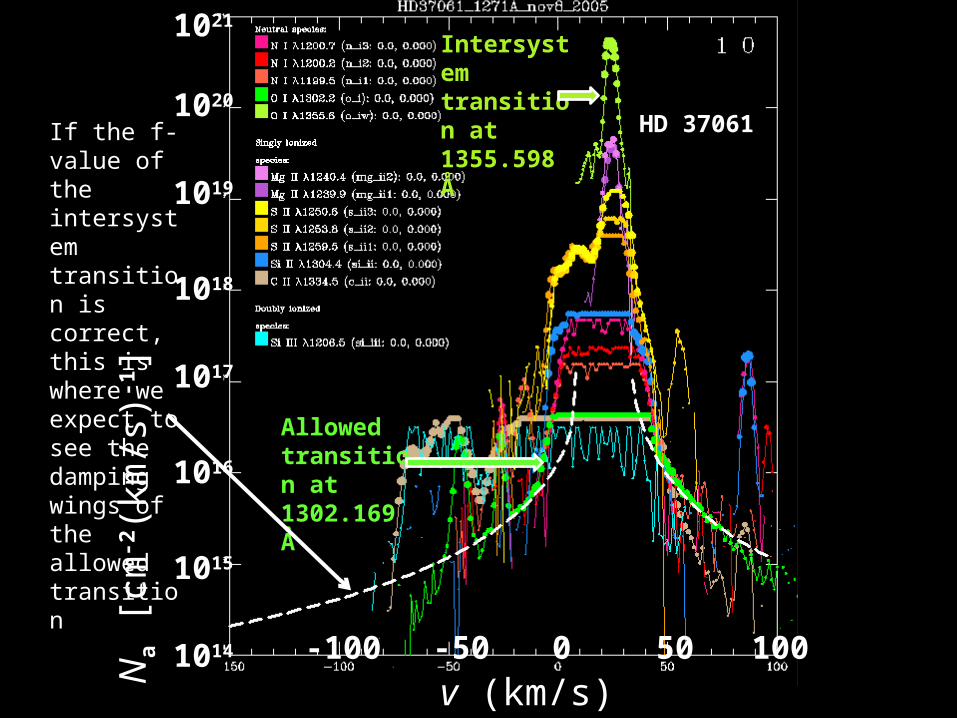
Intersystem transition at 1355.598 Å
Allowed transition at 1302.169 Å
If the f-value of the intersystem transition is correct, this is where we expect to see the damping wings of the allowed transition
1021
1020
1019
1018
1017
1016
1015
1014
Na [
cm-2
(km
/s)-1
]
v (km/s)100500-50-100
HD 37061
Biases and Uncertainties
• Factors that can influence the outcomes of measurements of O/H in the atomic phase1. Are all of the O and H atoms in a neutral form
inside H I regions? (or must one apply ionization corrections?)
2. Can we trust measurements of N(H I) in the ISM?3. Can we trust measurements of N(O I) in the ISM?4. Is the reference abundance of O relative to H
well understood?
Underlying Strategy of the Unified Depletions Study (Jenkins 2009)
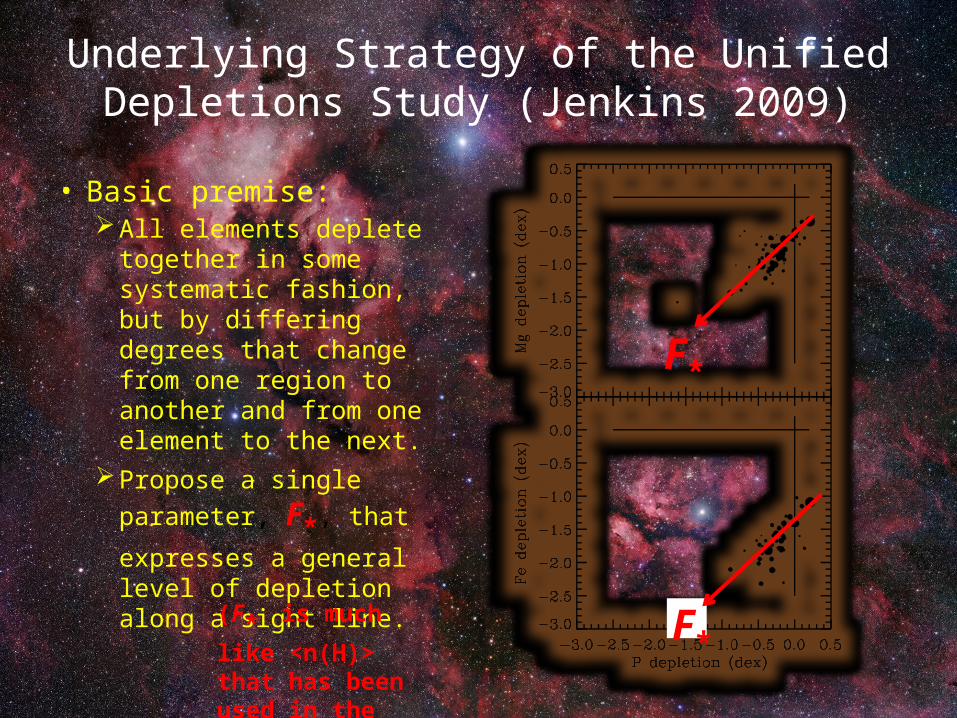
• Basic premise: All elements deplete
together in some systematic fashion, but by differing degrees that change from one region to another and from one element to the next.
Propose a single parameter, F*, that
expresses a general level of depletion along a sight line.
F*
F*(F* is much
like <n(H)> that has been used in the past.)
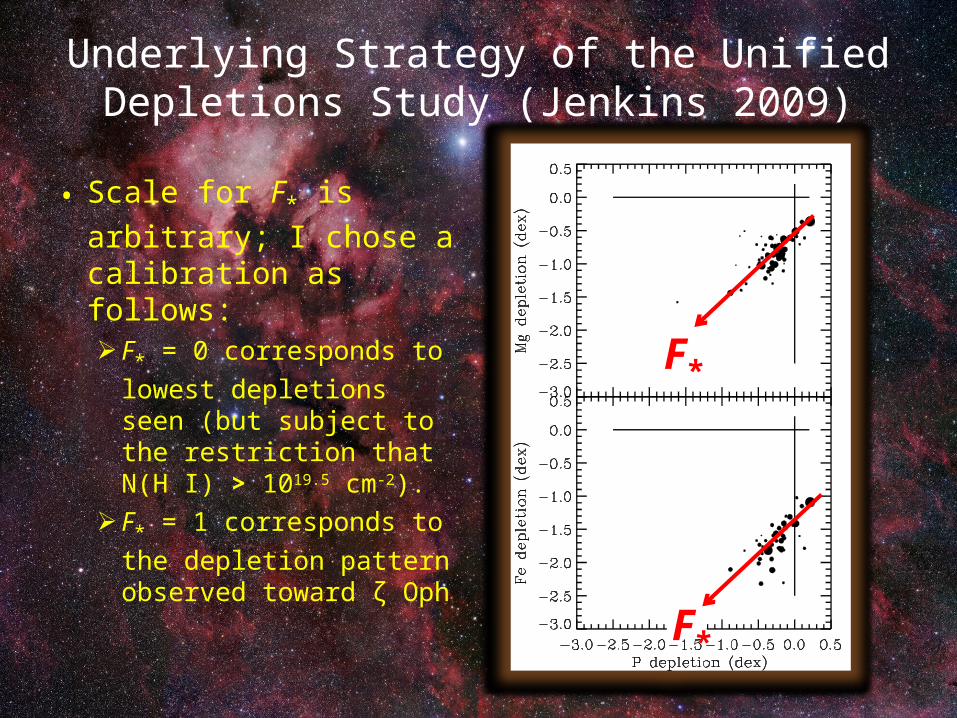
• Scale for F* is arbitrary;
I chose a calibration as follows:F* = 0 corresponds to
lowest depletions seen (but subject to the restriction that N(H I) > 1019.5 cm-2).
F* = 1 corresponds to the
depletion pattern observed toward ζ Oph
F*
F*
Underlying Strategy of the Unified Depletions Study (Jenkins 2009)
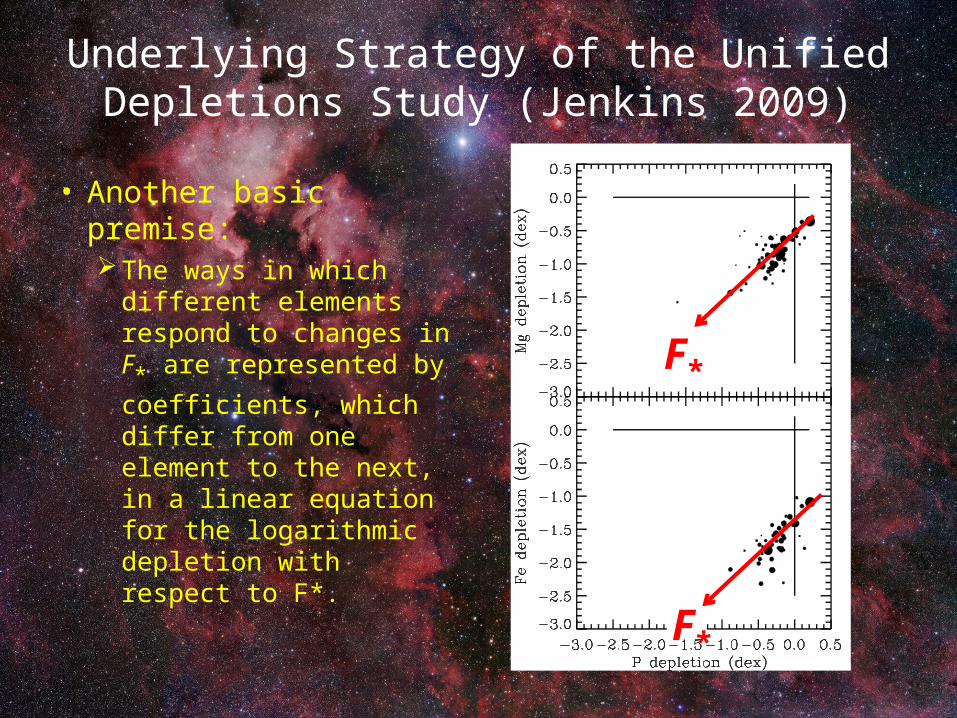
• Another basic premise:The ways in which
different elements respond to changes in F* are represented by
coefficients, which differ from one element to the next, in a linear equation for the logarithmic depletion with respect to F*.
F*
F*
Underlying Strategy of the Unified Depletions Study (Jenkins 2009)
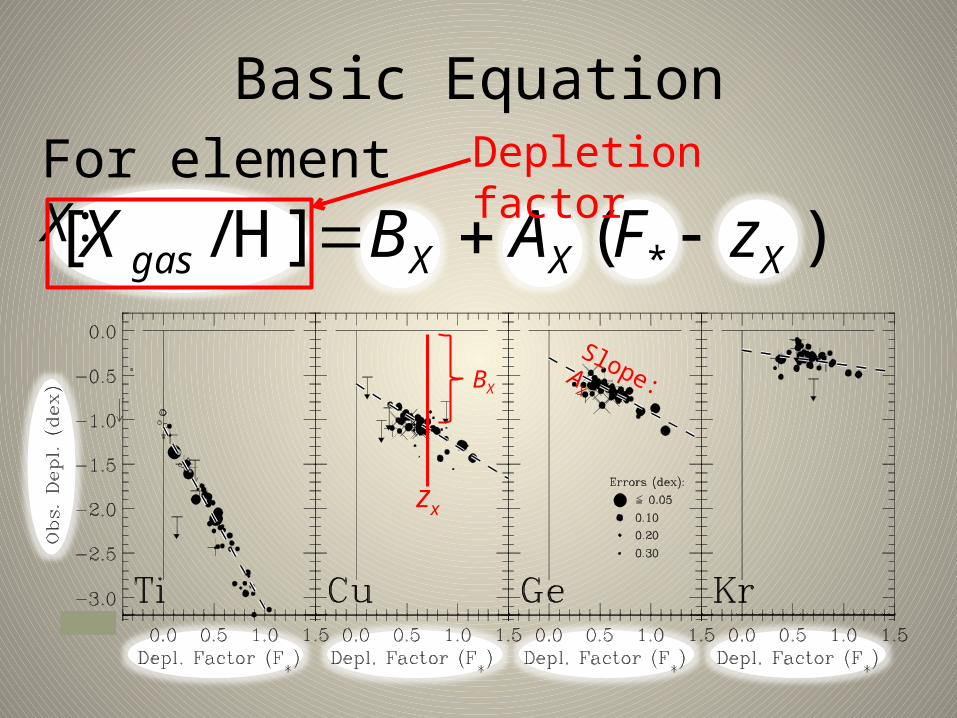
Basic Equation
)(]H/[ * XXXgas zFABX For element X:
zx
BX
Slope: AX
Depletion factor
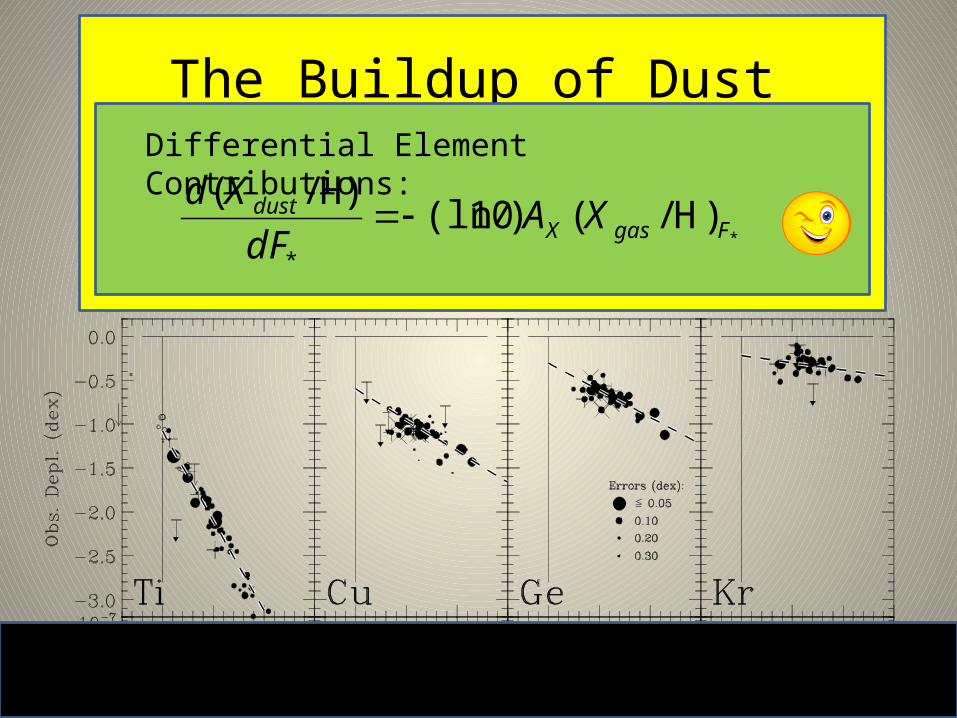
The Buildup of Dust GrainsConventional
Formula:)101((X/H)H)/( ]H/[ gasX
dustX
Differential Element Contributions:
*)H/()10(ln
H)/(
*FgasX
dust XAdF
Xd
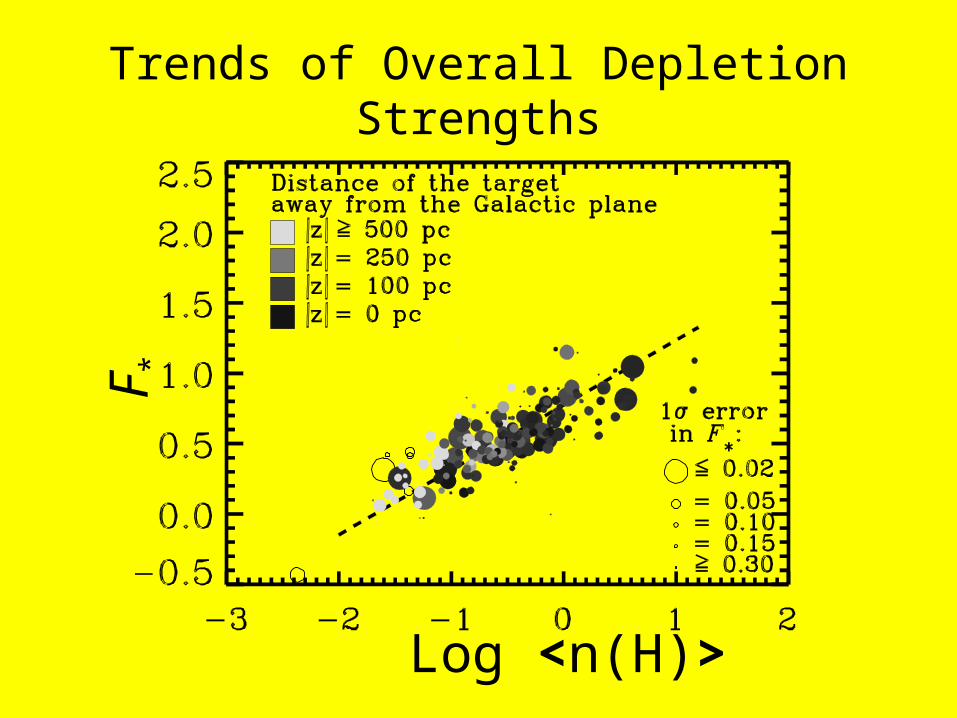
Trends of Overall Depletion Strengths
Log <n(H)>
F*
The Consumption of Oxygen Compared to other Elements
• Conventional view: oxygen is mostly incorporated into refractory compounds such as silicates and oxides.
• Let’s examine whether or not this is consistent with our determinations of d(Xdust/H)/dF*
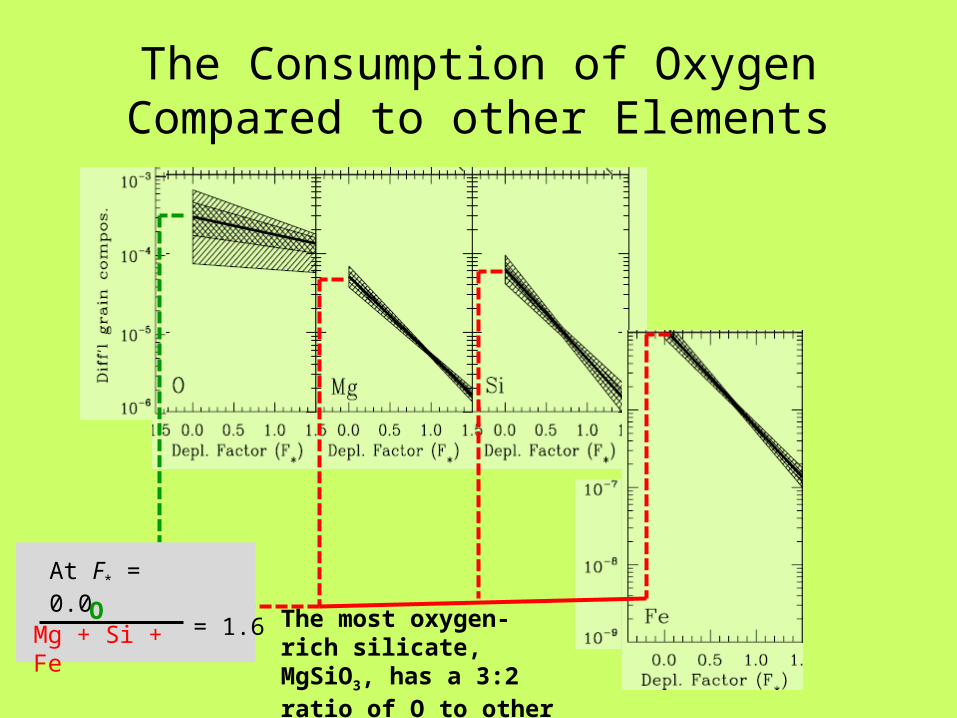
The Consumption of Oxygen Compared to other Elements
OMg + Si + Fe
= 1.6
At F* = 0.0
The most oxygen-rich silicate, MgSiO3, has a 3:2 ratio of O to other atoms
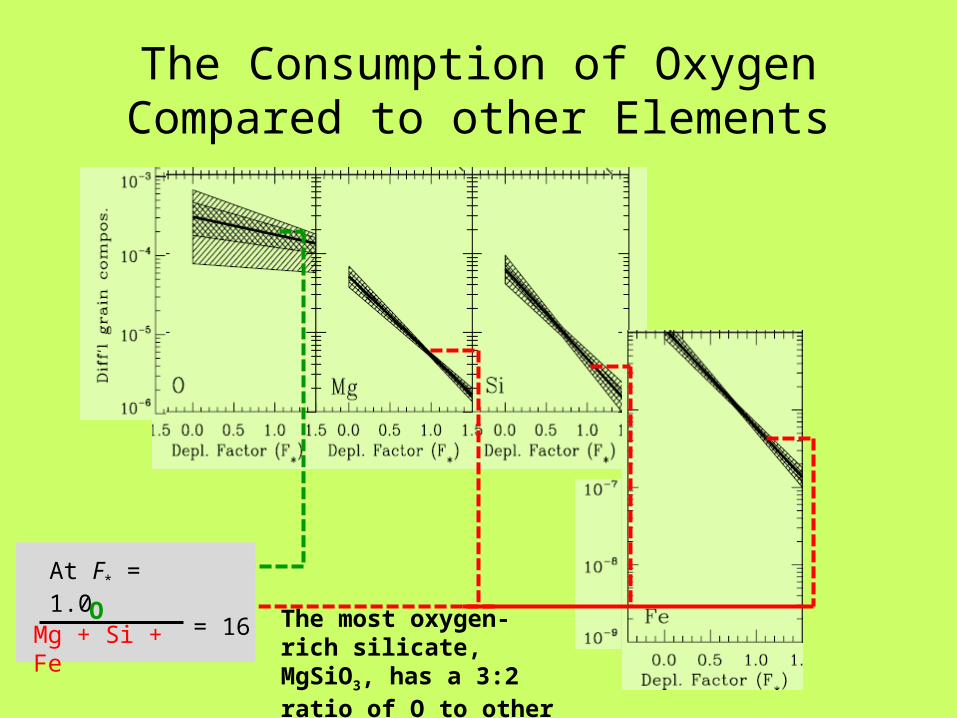
The Consumption of Oxygen Compared to other Elements
OMg + Si + Fe
At F* = 1.0
= 16 The most oxygen-rich silicate, MgSiO3, has a 3:2 ratio of O to other atoms
The Consumption of Oxygen Compared to other Elements
• Another interpretation: Use absolute abundances of O in dust instead of differential ones, but this requires an assumed reference abundance for O/H. Assume that this is equal to 575 ppm (or log abund +12 = 8.76).
• Using the conventional formula, we find that at F*=1, (Odust/H) = 240±70 ppm. The nominal value is larger than a maximum value 180 ppm that can be accommodated by the total availability of other elements that can be incorporated into silicates or metallic oxides or some combination of the two, but the lower limit for the observations is consistent with expectation.
The Consumption of Oxygen Compared to other Elements
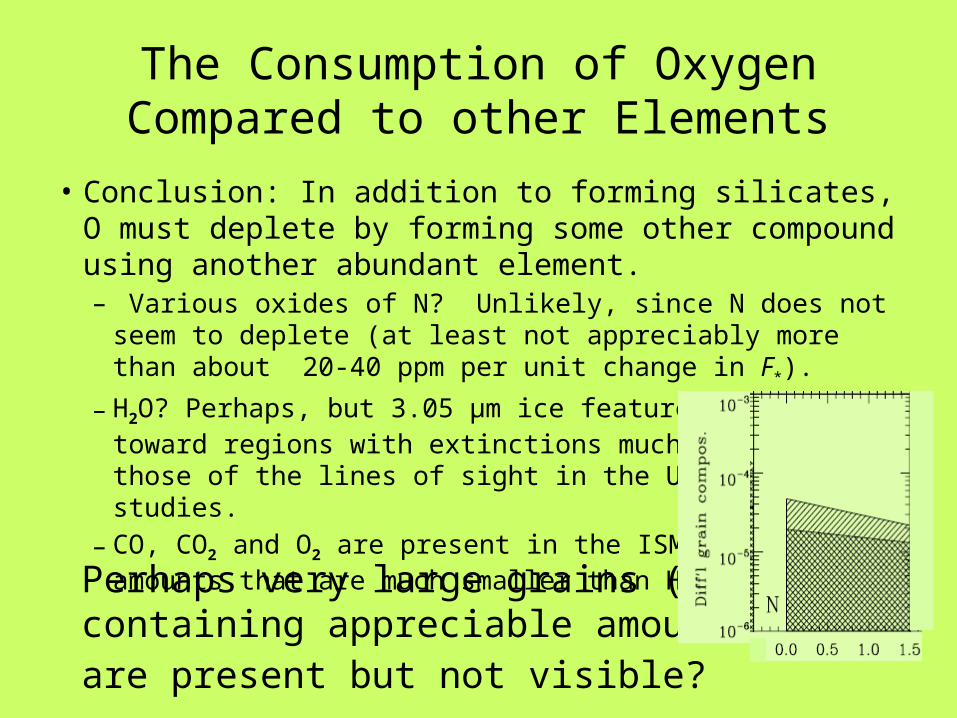
• Conclusion: In addition to forming silicates, O must deplete by forming some other compound using another abundant element.– Various oxides of N? Unlikely, since N does not seem to
deplete (at least not appreciably more than about 20-40 ppm per unit change in F*).
– H2O? Perhaps, but 3.05 μm ice feature only seen toward regions with extinctions much larger than those of the lines of sight in the UV absorption studies.
– CO, CO2 and O2 are present in the ISM, but in amounts that are much smaller than H2O
Perhaps very large grains (d >> 1μm) containing appreciable amounts of H2O are present but not visible?
One Other Method of Measuring O Bound in Molecules and Grains
• Again, independent of adopted reference abundance:
• High resolution X-ray absorption spectroscopy at wavelengths in the vicinity of the K absorption edge, which can distinguish various stages of ionization of O atoms, as well as those which have chemical bonds.
• This topic should be covered by the next speaker