Embed Size (px)
Citation preview

Contract No. NAGS-859
SemiAnnual Report
Y
The Absolute Rad'KxneVic Calibration of the
Advanced Very High Resolution Radiometer
(_ASA-CR-183256) _h£ A5SCL[_} EACZCSETfiZC
_ECCLEIIE_ 5AD_£_E_ _emiaz_ual Eepoz:t(&rizcna Univ.) _I p CSCL 14B
63/J5
_89-12039
P. N. Slate& P. M. Teillet and Y C_ng
Optical Sciences CenterThe University of ArizonaTucson, Arizona 84721
Goddard Space Flight CenterGreenbelt, Maryland 20771
October 1988
https://ntrs.nasa.gov/search.jsp?R=19890002668 2020-05-22T21:51:37+00:00Z

Summary
During the last six months of grant NAG5-859 there have been several additional calibration
campaigns involving the NOAA-9 AVHRR. This report describes work conducted at Rogers
(Dry) Lake, California.
Those involved in the measurements and data reduction were P. M. Teillet, Y. Ding, D. I.
Gellman, R. D. Jackson, M. S. Moran and P. N. Slater.
1. Introduction
An increasing number of remote sensing investigations require radiometrically calibrated
imagery from NOAA Advanced Very High Resolution Radiometer (AVHRR) sensors. Although a
prelaunch calibration is done for these sensors, there is no capability for monitoring any changes in
the in-flight absolute calibration for the visible and near infrared spectral channels. Hence, the
possibility of using the reflectance-based method developed at White Sands for in-orbit calibration
of Landsat Thematic Mapper (TM) and SPOT Haute Resolution Visible (HRV) data to calibrate
the AVHRR sensor has been under investigation. Three different approaches have been
considered.
(i) Method 1: Ground and atmospheric measurements and reference to another calibrated
satellite sensor.
Ground reflectance measurements can be made over terrain areas corresponding to numerous
Landsat TM pixels, but such measurements become impractical for the calibration of the AVHRR
image data with pixel dimensions of 1.1 km by 1.1 km or greater. An alternative is to acquire
AVHRR imagery of White Sands on the same day that a TM calibration has been carried out on
the basis of ground reflectance factor and atmospheric measurements at Chuck Site in the alkali-
flat region of White Sands. The methodology then takes advantage of the accurate calibration
results for TM bands 3 and 4 to effect a calibration of AVHRR channels 1 and 2.
More specifically, a relatively uniform area corresponding to several AVHRR pixels is selected
in the alkali-flat region and average digital counts are extracted for these AVHRR pixels and for
pixels from the matching area in the TM imagery. With the help of radiative transfer

-2-
computations and bidirectional reflectance data for the gypsum surface at White Sands, radiance at
the entrance aperture of the AVHRR sensor is predicted. The analysis takes into account
differences in spectral response, sun angle, and viewing geometry between the TM and AVHRR
data acquisitions.
(ii) Method 2: Ground and atmospheric measurements with no reference to another sensor.
The second approach is somewhat analogous to the original reflectance-based approach used at
White Sands to calibrate the TM or HRV sensors (Slater et al., 1987a). It is based on detailed
ground and atmospheric measurements near the time of AVHRR overpass, but it necessarily
assumes the reflectance values to be representative of the whole pixel since these ground
measurements can only encompass a portion of one AVHRR pixel. The availability of aircraft
data can assist in the selection of an appropriately uniform area for this purpose. Although this
method is not likely to be as accurate as the first, it has the distinct advantage of not requiring
nearly coincident data acquisition from two different sensors.
(iii) Method 3: No ground and atmospheric measurements but reference to another satellite
sensor.
As with the first method, this approach achieves a calibration of the first two AVHRR
channels by reference to another satellite sensor such as the TM on the same day. However, it
differs significantly in that no ground and atmospheric measurements on the overpass day are
needed. Instead, a standard data set of atmospheric conditions is used to approximate the actual
atmosphere and historical bidirectional reflectance data are used to adjust for differences in
illumination and viewing geometries. The same atmospheric parameters are adopted to estimate
surface reflectance from the TM imagery and then to predict radiance at the AVHRR sensor from
that surface reflectance (suitably adjusted for bidirectional effects and spectral bandpass
differences). Because of this two-way use of the atmospheric model, errors introduced in one
direction will be compensated to some extent in the reverse direction so that reasonable calibration
results can be obtained if the procedure is not overly sensitive to the choice of atmospheric model.

-3-
If it provesto be viable, this approachwill be a valuableone because it will facilitate in=orbit
sensor calibration without the complexity and expense of field measurements.
The purpose of this report is to describe an investigation on the use of Method 2 (Figure 1.1)
to calibrate NOAA-9 AVHRR channels 1 and 2 with the help of ground and atmospheric
measurements at Rogers (dry) Lake, Edwards Air Force Base (EAFB) in the Mojave desert of
California. NOAA-9 has an ascending orbit in the daytime, with an equatorial crossing near three
o'clock in the afternoon, local time. The first two AVHRR channels are rather broad, spanning
the spectral regions from 570 to 700 nanometers and 714 to 983 nanometers. Three NOAA-9
AVHRR images were studied: October 14, 1986, May 4, 1987, and May 5, 1987.
The ground measurement area is located at the North end of EAFB on the dry lakebed of
Rogers Lake. Compared to White Sands, New Mexico, the dry mud surface is flatter, more
uniform spatially, and spectrally fairly flat. The ground does have a network of cracks
everywhere, but on a scale that is not important for the measurements involved. More
troublesome is the strong non-lambertian character of the surface, which can exhibit strong
specular reflection when off-nadir observations are made in the direction toward the sun. Another
disadvantage of the site is the need for constant radio contact with the air-traffic control in case
the area has to be cleared rapidly. Nevertheless, the site lends itself well to the in-flight
calibration of sensors such as the Airborne Imaging Spectrometer (AIS) and the Advanced Visible
and Infrared Imaging Spectrometer (AVIRIS), as well as the in-orbit calibration of satellite sensors.

-4-
m
"a Q3 0 _,_
_ °_
_ (0 ,,., m
.< _ _'"rE,
IT
m
0
L-
e-
>°_
°_
e-
ff'J
u
lIi
- I_" =:_>_ _._
.._;_ =-- o rn.__
"-- C:>
m
e-e-
u
n,-
--t-'
><
0
I"-- C_II _ _I
-- I_.__I
I_'rlI_>II_<_I
ii
r-e-
t--
n"rr""r
>
O
e-o
(..3i i
O
¢-
Oe-
O
¢j¢,.
Oe"
,D
E
E(.3
.m
e-
OE
e-
¢--I
p
.o
(,3m
m
O,_
m
m
&
O¢-
I

2. Atmospheric "Data Reduction
-5-
The Method 2 calibration approach discussed in this report relies on atmospheric
In particular, Rayleigh, aerosol andmeasurements made at the site on the day of an overpass.
ozone optical depth values are required by the radiative transfer code used to predict radiance at
the entrance aperture of the satellite sensor from the terrain reflectance measured on the ground.
The Rayleigh optical depth was determined from a knowledge of the barometric pressure and
wavelength. The total optical depths were determined from the slopes of Langley plots in which
the log voltages from solar radiometers were plotted against air masses. In spectral regions
unaffected by absorption, the Mie (aerosol) optical depth at any wavelength was determined by
subtracting the Rayleigh from the total optical depth at that wavelength. An optical depth versus
wavelength curve was fitted through the points that spanned the absorption region due to ozone.
The differences between the values on this curve at a given wavelength and the total minus
Rayleigh value at the same wavelength gave the ozone optical depth at that wavelength. A Junge
radial size distribution (Junge, 1963) was assumed for the aerosols. The Junge parameter, v, is
given by
d_..NN= cr_(V+z),dr
where N is the number of particles, r is their radius, and c is a constant. The value of v, needed
to find the aerosol phase function, was determined from the slope of the log (Mie optical depth)
versus log (wavelength) curve.
Solar radiometer measurements were made next to the dry lakebed at EAFB on October 14,
1986, May 4, 1987, and May 5, 1987. More specifically, on October 14, data were collected
throughout the morning in order to generate a Langley plot. On May 4, it was only possible to
obtain some instantaneous extinction data within a few minutes of the NOAA-9 overpass. The
next day, May 5, data were collected from early morning to mid-afternoon, after the NOAA-9
overpass. In all cases, a manually operated solar radiometer designed by Dr. John A. Reagan of
the University of Arizona was used. The Reagan instrument uses a single spectral filter wheel and
a single silicon detector, obtaining readings in nine spectral bands from 0.400 to 1.03 micrometers.

-6-
Optical depth values obtained from the atmospheric data reduction involving nine wavelengths
were then interpolated at the wavelengths used later in the analysis of AVI-_ channels 1 and 2.
Since the NOAA-9 AVHRR spectral channels 1 (0.568 - 0.698 #m) and 2 (0.704 - 0.990/_m) are
not narrow bands and the radiative transfer code assumes monochromaticity, they were subdivided
!into segments. Channel 1 was divided into three bands centered at 0.595, 0.635, and 0.680 #m,
whereas channel 2 was divided into four bands centered at 0.760, 0.840, 0.900, and 0.960 /Jm.
Table 2.1 lists optical depth results for these wavelengths, as well as for the central wavelengths of
the AVHRR bands as calculated by the moments method (Palmer and Tomasko, 1980).
-7-
Table 2.1 Optical depth results derived from atmospheric measurements atEdwards Air Force Base. Barometric pressure was measured at 963.03 mb on
October 14 and 943.08 mb on May 5, and was assumed to be 943.08 on May 4.
Wavelength
(micrometers)
Optical Depth
Total Aerosol Rayleigh Ozone
October 14
0.5950
0.6350
0.6800
0.7600
0.8400
0.9000
0.9600
0.6329
0.8471
0.1292 0.0299 0.0662 0.0330
0.0995 0.0272 0.0508 0.0214
0.0732 0.0247 0.0385 O.OlO0
0.0495 0.0210 0.0246 0.0039
0.0362 0.0182 0.0164 0.0015
0.0289 0.0165 0.0124 0.0000
0.0246 0.0150 0.0096 0.0000
O.lOll 0.0274 0.0505 0.0222
0.0352 0.0180 0.0159 0.0014
May 4
0.59500.6350
0.6800
0.76000.8400
0.9000
0.96000.63290.8471
0.1796 0.0740 0.0649 0.0407
0.1468 0.0706 0.0498 0.0264
0.1172 0.0672 0.0377 0.01230.0909 0.0620 0.0241 0.0048
0.0757 0.0577 0.0161 0.00190.0670 0.0549 0.0122 0.0000
0.0618 0.0524 0.0094 0.00000.1486 0.0708 0.0505 0.0273
0.0746 0.0573 0.0155 0.0017
May 5
0.5950
0.6350
0.6800
0.7600
0.8400
0.9000
0.9600
0.6329
0.8471
0.2425 0.1401 0.0649 0.03750.2096 0.1355 0.0498 0.02430.1799 0.1309 0.0377 O.Oll3
0.1521 0.1236 0.0241 0.00450.1353 0.1175 0.0161 0.0018
0.1256 0.1134 0.0122 0.0000
O.ll91 0.1097 0.0094 0.00000.2114 0.1357 0.0505 0.0252
0.1340 0.1170 0.0155 0.0016
o
(i)
-8-
Surface Reflectance Determination
Pixel Area Measurements
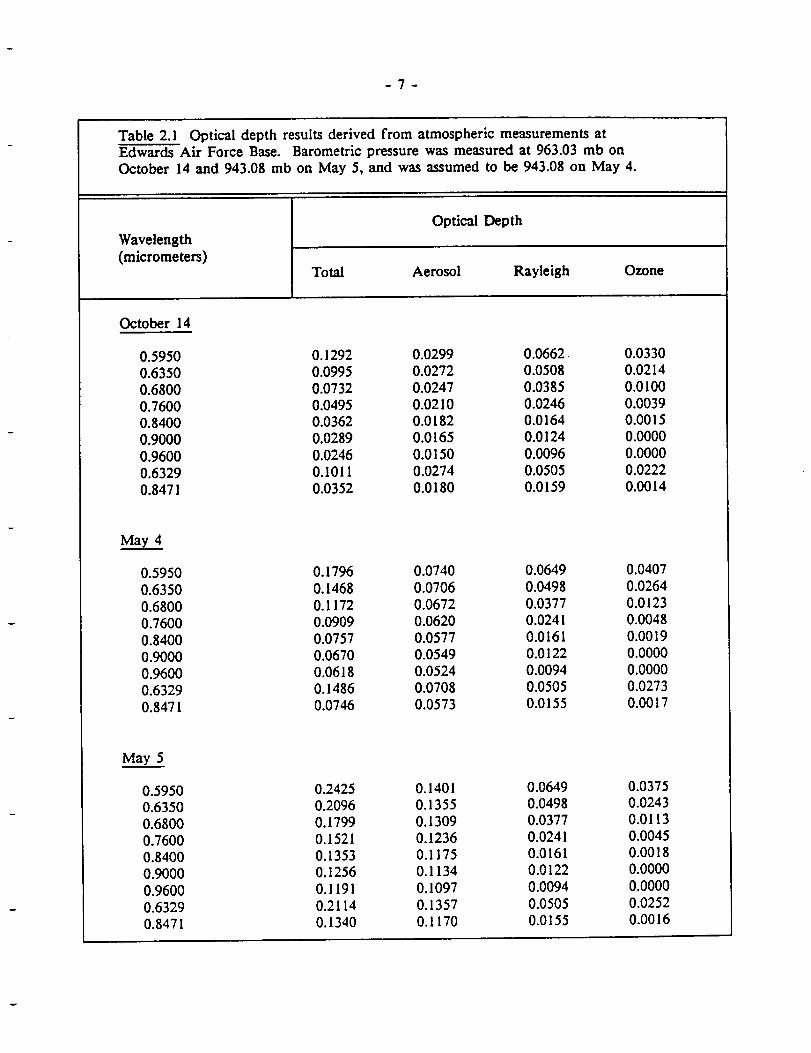
Reflectance factor measurements were made on the dry lakebed at EAFB on October 14,
1986, May 5, 1987, and May 6, 1987. On October 14 and May 5, data were collected over a
target area related to AVIRIS overflights. The target consisted of 64 20-meter pixels configured in
a 16 by 4 pixel rectangle. The long side of the rectangle was oriented 10 degrees west of north.
Ground spectral data were collected using two radiometers: a Barnes MMR (8 bands) and an
Exotech (4 bands), both collecting data in spectral bands similar to the Landsat TM bandpasses.
The instruments were suspended about 2 meters above ground by attachment to a backpack frame.
The operators walked along a transect intersecting pixel centers and collected 8 samples per pixel
with each instrument. These 8 readings were then averaged and a single reflectance factor
determined for each pixel. The MMR was carried along the primarily north-south transects and
the Exotech along the primarily east-west transects.
On May 6, data were collected in a similar manner over a target area related to a Landsat TM
overpass. The TM target consisted of 64 30-meter pixels configured in a 16 by 4 pixel rectangle
and oriented 9 degrees east of north. Twelve readings were collected along a transect through each
pixel. The MMR was carried along the primarily east-west transect and the Exotech along the
primarily north-south transect.
Weather on all three days was clear and the sun was never hidden by clouds throughout the
measurement period. October 14 was an extremely clear day with a visibility calculated to be at
least 300 kin. There were no clouds on that clay and on May 5, but a small growth of cumulus
clouds was observed low on the horizon on May 6. There was also a significant amount of haze
on the last clay due to a nearby fire and smog.
Reflectance factors for all three dates were computed using the same barium sulfate panel
(panel #11). For each instrument on each date, an average reflectance factor was computed for
the entire 64-pixel site. The values from the MMR were used in this particular study because

=9=
they include more extensive wavelength coverage (Table 3.1). On all three days, the ground
measurements were completed in less than one hour during the morning.
Table 3.1 Pixel area measurements of surface reflectance factor at Edwards Air Force
Base. The reflectance factors are averages of the MMR data acquired over
a 64 pixel site.
October 14, 1986 May 5, 1987 May 6, 1987
Average solarzenithangle 44.50 30.00 30.00
MMR band I (0.48223#m) 0.2550 0.2566 0.2503
MMR band 2 (0.56137/Jm) 0.3425 0.3361 0.3346
MMR band 3 (0.66021 /Jm) 0.4095 0.3969 0.4002
MMR band 4 (0.82138 #m) 0.4446 0.4272 0.4306
MMR band 5 (I.25405 /_m) 0.4675 0.4450 0.4415
MMR band 6 (1.68790 #m) 0.4938 0.4673 0.4605
MMR band 7 (2.21736#m) 0.4351 0.4090 0.3983
i
.°
(ii) Bidirectional Reflectance Measurements
At a representative spot on the dry lakebed at EAFB, bidirectional reflectance measurements
were made on May 5, 1987, May 6, 1987, and September 14, 1987. No effort was made to use
exactly the same spot on all three dates, but the same general location was used each time. A
special apparatus was used to measure surface reflectance factors at a number of view angles in a
plane perpendicular to the SPOT satellite orbital path. More specifically, the set-up consisted of
an arm to hold an Exotech radiometer at a distance of about 2.5 meters above the surface when in
the vertical configuration. The arm could be tilted to provide view angles every .5 degrees from
-45 to +45 degrees with respect to zenith. The apparatus was designed to measure the radiation
from the same spot on the surface (± 2 cm) at all view angles. Each measurement sequence started
at -45 degrees, proceeded to +45 degrees in 5 degree increments, and returned beginning with +45

back to -45 degrees.
the two measurements, to minimize variations due to changing solar zenith angle.
with this instrument will hereafter be referred to as "BRF' data.
Several BRF data sets were obtained at various times on each of the three dates.
reflectance factors from these measurement sets are listed in Table 3.2.
(iii)
- 10-
The two measurements for each angle were averaged, as were the times of
Data collected
Nadir
Surface Reflectance Estimates
Atmospheric radiative transfer computations require a surface reflectance value as one of the
inputs at any given wavelength. The surface reflectance value should be appropriate for the solar
zenith angle and the nadir view angle pertaining to the satellite sensor overpass of interest. Sun
and view angle geometries for the NOAA-9 AVHRR overpasses of EAFB are given in Table 3.3.
Because the reflectance data were acquired in TM bands, surface reflectance estimates were
obtained in those bands first and later changed to values relevant to the first two AVHRR
channels.
The pixel area measurements of surface reflectance at EAFB were made with nadir geometry
and in the morning in support of different sensor overpasses, whereas the NOAA-9 AVHRR
overpasses took place in the afternoon with the test site at off-nadir view angles. Therefore, the
BRF data were used to adjust t.he pixel area reflectance values accordingly. An additional
assumption is that the pixel area data are representative of an entire AVHRR picture element,
which encompasses over one square kilometer (Table 3.3).
There are three steps involved in using the BRF data to obtain the proper surface reflectances
(a detailed description may be found in Appendix A). First the nadir reflectance factors obtained
during the bidirectional measurements (Table 3.2) are interpolated for the solar zenith angle at the
time of NOAA-9 AVHRR overpasses. Secondly, an adjustment is made for the slight difference
in surface reflectance between the pixel area site and the BRF site nearby. Finally, a view angle
correction is made using BRF data for the appropriate solar zenith angle and nadir view angle,
with a solar azimuth as close to the sensor view azimuth as possible. Tabulations of these
adjustment steps are given in Table 3.4 for the first four TM bands.

-II-
Table 3.2 Nadir reflectance factors obtained during bidirectionalreflectance measurements with an Exotech radiometer atEdwards Air Force Base.
Solar
Universal zenith
Time (degrees)
May 5, 1987
15:2h15 61.9
16:13:04 51.316:59:09 42.0
18:55:53 22.022:16:02 27.1
23:22:00 39.0
Solarazimuth TM TM TM
(degrees) Band 1 Band 2 Band 3
TMBand 4
89.2
97.1 0.2443 0.3278 0.3903 0.4252
105.4 0.2491 0.3339 0.3976 0.4334
144.7
232.1 0.2619 0.3471 0.4136 0.4494
251.5 0.2567 0.3398 0,4058 0.4401
May 6, 1987
15:05:41 64.915:46:31 56.6
16:54:57 42.7
20:09:53 20.320:45:07 18.4
20:59:27 18.6
86.8 0.2428 0.3234 0.3849 0.419192.6 0.2451 0.3270 0.3901 0.4246
104.2 0.2492 0.3332 0.3963 0.4319
152.7 0.2693 0.3556 0.4235 0.4588177.8 0.2702 0.3563 0.4244 0.4598
188.6 0.2698 0.3564 0.4246 0.4605
September 14, 1987
15:53:09 62.5
16:02:38 60.616:39:49 53.5
17:15:32 47.217:35:50 43.8
18:00:01 40.1
18:22:20 37.218:38:49 35.318:51:44 34.1
19:14:08 32.5
19:40:45 31.6
HRV HRV HRV
Bandl Band2 Band3
106.3 0.2860 0.3690 0.4129
108.0 0.2863 0.3701 0.4152
I15.2 0.2922 0.3794 0.4240
123.3 0.2936 0.3815 0.4278
128.6 0.2933 0.3811 0.4282
135.8 0.2957 0.3843 0.4324
143.3 0.2977 0.3871 0.4355
149.5 0.2977 0.3868......0.4356
154.8 0.2983 0.3891 0.4365
164.6 0,2993 0.3952 0.4381
177.0 0.3014 0.3938 0.4423

- 12-
Table 3.3 Sun and view angle geometries for the NOAA-9 AVI_RR overpasses of
EAFB. The nadir view angles are relative to vertical at ground level andview azimuth angles are in the satellite direction from the ground location
(340 57" N, 1170 51"W).
Date
1986.10.14
1987.05.04
1987.05.05
Solar Solar Solar Off=Nadir View Approximate
Overpass Zenith Azimuth Distance View Azimuth Pixel
Time (U.T.) (Degrees) (Degrees) (A.U.) (Degrees) (Desrees) Dimensions (km)
21:46:55 53.0 221.6 0.9972 44.5 259 2.2 x 1.6
22:29:54 40.7 252.8 1.0087 15.3 79 1.3 x 1.2
22:19:03 38.5 250.8 1.0087 31.3 79 1.6 x 1.3
(iv) Change to AVHRR Channels
Since NOAA-9 AVHRR spectral channels 1 (570-700 nanometers) and 2 (714-983
nanometers) are not narrow bands and the Herman radiative transfer code assumes
monochromaticity, they were subdivided into smaller segments. Channel 1 was divided into three
bands centered at 595, 635, and 680 nm, whereas channel 2 was split into four bands centered at
760, 840, 900, and 960 nm. In order to run the Herman code at these seven wavelengths, the TM
reflectance values obtained in the previous section were interpolated accordingly. However,
because BRF data were only available in the first four TM bands, the surface reflectance factors
computed in the previous section were limited to those bands and do not encompass the AVHRR
channel segments at 900 and 960 nm. Therefore, estimates for MMR band 5 were also obtained
(Appendix A), based on the relationship between MMR bands 5 and 4 as measured for the pixel
area. It was then possible to interpolate at all seven AVHRR segment wavelengths, as well as at
the central wavelengths of the two AVHRR channels (Table 3.5).

- 13-
Table 3.4 Surface reflectance estimation for the EAFB pixel area site at the NOAA-
9 AVHRR overpass. Solar zenith angle - 0_; off-nadir view angle = 0v
(negative if satellite is viewing from East of the site). Details arediscussed in Appendix A.
October 14, 1986
Nadir BRF (May 6) for 0. = 53.00
Siteadjustment
View adjustment (May 5 BRF)
for 0v = +44.50
TM TM TM TM
Band I Band 2 Band 3 Band 4
0.2462 0.3286 0.3917 0.4265
i.0270 1.0304 1.0351 1.03130.2528 0.3386 0.4055 0.4399
1.3400 1.2900 1.2800 1.2310
0.3388 0.4368 0.5190 0.5415
May 4, 1987
Nadir BRF (May 5 and 6) for 0_= 40.70
Site adjustment
View adjustment (May 5 BRF)
for av = -15.30
0.2506 0.3351 0.3989 0.4345
_).9748 0.9715 0.9695 0.9600
0.2443 0.3255 0.3867 0.4171
0.9860 0.9820 0.9970 0.9800
0.2409 0.3197 0.3778 0.4088
May 5, 1987
Nadir BRF (May 5) for 0, = 38.50
Site adjustment
View adjustment (May 5 BRF)
for 0v = -31.30
0.2521 0.3370 0.4014 0.4372
0.9892 0.9756 0.9669 0.95720.2494 0.3288 0.9881 0.4185
1.0000 0.9860 0.9770 0.9760
0.2494 0.3242 0.3792 0.4084

- 14-
Table 3.5 Surface reflectance factors in the seven AVHRR channel segments based
on wavelength interpolations of the adjusted TM band values (also listed).
Center Wavelength (Micrometers)
0.48223 (TM Band I)
0.56137 (TM Band 2)
0.66021 (TM Band 3)
0.82138 (TM Band 4)
1.25405 (M.MR Band 5)
0.595 (AVHRR Channel 1, Segment 1)
0.635 (AHVRR Channel 1, Segment 2)
0.680 (AHVRR Channel 1, Segment 3)0.760 (AHVRR Channel 2, Segment 1)0.840 (AHVRR Channel 2, Segment 2)0.900 (AHVRR Channel 2, Segment 3)
0.960 (AHVRR Channel 2, Segment 4)
0.63288 (AVHRR Channel 1)
0.84709 (AVHRR Channel 2)
October 14, May 4, May 5,1986 1987 1987
0.3388 0.2409 0.2494
0.4369 0.3197 0.3242
0.5198 0.3778 0.3791
0.5415 0.4088 0.4084
0.5694 0.4259 0.4255
0.4648 0.3395 0.3429
0.4981 0.3630 0.3651
0.5218 0.3816 0.3827
0.5329 0.3910 0.3973
0,5427 0.4096 0.4091
0,5466 0.4119 0.4115
0.5504 0.4143 0.4139
0.4963 0.3617 0.3639
0.5431 0.4098 0.4094

- 15-
4. Radiative Transfer Computations
Atmospheric parameters (Section 2) and ground reflectances (Section 3) for the seven wave-
lengths were input to the Herman radiative transfer code (Herman and Browning, 1975). Output
from the code includes radiance at the entrance aperture of the AVHRR sensor, normalized for
unity exo-atmospheric solar irradiance. For use in the code, the atmosphere is divided into a suf-
ficient number of plane-parallel layers such that changes within each layer are due only to single-
scattering processes. The Gauss-Seidel iterative technique is used to solve the equation of radiative
transfer. Upon convergence, all multiple scattering effects have been taken into account. Values
of 5.02, 0.02, and 0.04 /_m were used for the maximum and minimum radii and incremental step
size, respectively, for the aerosols. A vertical aerosol distribution as measured by Elterman (1966)
was assumed and the aerosols were given a refractive index of 1.54-0.01i. Other important inputs
to the Herman code include the Rayleigh, aerosol, and ozone optical depth values, as well as the
Junge parameter.
The spectral radiance is ultimately calculated as the product of the exo-atmospheric irradiance
and the normalized radiance determined from the Herman code, divided by the square of the solar
distance in astronomical units. The exo-atmospheric solar irradiance data are those recommended
by Frohlich and published by Iqbal (1983). They represent a carefully edited combination of res-
ults published by Neckel and Labs, Thekaekara, Arvesen, and others. The values were adjusted to
yield an integrated value of 1367 Wm -2, the solar constant as proposed by the World Radiation
Center.
In order to combine the code spectral radiance results for the narrower bands, weighting coef-
ficients were determined from the areas under selected intervals of the relative spectral response
profiles, R(A), for each AVHRR band. For example, the weighting coefficient for 595 nm is
given by

- 16-
.610
"' Js30R(a)aX
800
530 R(A)d_
The code spectral radiance in each AVHRR band is then the weighted sum of code spectral radi-
ances for the narrower bands. For comparison, the code spectral radiance was also determined
from Herman code computations at the central wavelengths of AVHRR channels 1 and 2.
A final adjustment is applied to the code spectral radiances to correct for gaseous absorption.
The Herman code takes into account ozone optical depth but does not consider H20, CO=, and O,
transmittance. In AVHRR band 2 especially, there is significant absorption around 0.94 #m due to
water vapor and around 0.76/_m due to oxygen. Thus the "5-S" atmospheric program of Tanr6 et
al. (1985) is run to obtain the total gaseous transmittance due to the four gases (H20, O 3, CO=,
02). The final radiance values predicted at the AVHRR sensor are the product of total gas
transmittance except ozone and the code spectral radiance.

- 17-
5. Image Data Manipulation
Bright and dark features were identified in SPOT HRV and AVIRIS imagery (Vane, 1987),
acquired at other times for the EAFB area, that were also distinguishable in the AVHRR scenes.
The features used for this purpose were not likely to have changed places in time and were suffi-
ciently numerous to minimize the effect of systematic geometric distortions. The location of the
ground measurement site on the dry lakebed could then be estimated visually in the AVHRR
imagery using relative distances and triangulation. Digital image analysis facilities were used for
this purpose. The corresponding digital counts were then interpolated from the image values in
channels 1 and 2 (Figure 5.1). The results are given in Table 5.1 and are denoted as "best esti-
mate'.
The surface at Rogers Lake is quite flat for many kilometers in all directions but its reflec-
tance characteristics are reasonably uniform only in a limited area, roughly 1 3/4 kilometers in the
predominantly East-West direction and roughly double thai distance in the predominantly North-
South direction. Thus, although that part of the dry lakebed provides a large uniform target for
high-resolution sensors, it can accommodate the area of only one AVHRR pixel (the approximate
pixel dimensions on the various dates are listed in Table 3.3). Because this site is not easy to pin-
point in the AVHRR imagery, digital counts were also obtained for locations plus or minus half a
pixel away in the direction of the strongest radiance gradient (Table 5.1).

- 18-
Figure 5.1 Digital counts (10-bit scale) of NOAA-9 AVHRR channels 1 and 2 atEdwards Air Force Base for three dates. In each case, the dot indicates the esti-
mated location of the ground measurement site. Since the off-nadir view anglediffered from date to date, the digital counts correspond to different pixel sizes on
different dates (Table 2.3).
October 14, 1986
AVHRR Channel 1 AVHRR Channel 2
126 147 176 184 169 143 160 184 191 180
147 196 203 192 181 159 203 208 196 189
173 221 202 188 189 184 227 207 191 197
205 225 196 184 185 210 230 201 188 190
211 221 195 181 184 216 226 200 186 188
190 213 196 186 189 198 220 200 192 194
May 4, 1987
188 224 233 224 225 202 235 242 232 232
251 249 230 217 214 262 258 238 225 221
266 246 232 218 213 275 255 240 226 220
268 247 231 220 224 277 256 239 227 230
266 251 237 224 224 276 260 245 230 231
257 247 232 222 224 266 255 240 229 230
May 5, 1987
180 216 232 227 193 227 240 235
238 256 232 217 249 265 241 225
268 253 230 216 277 263 238 222
278 252 230 223 286 261 238 229
271 255 236 226 280 263 243 232

- 19-
Table 5.1 Digital counts (10-bit scale) from the NOAA-9 AVHRR imaging thedry lakebed at EAFB on three dates. The best estimate is the valuecorresponding to the area where ground reflectance measurements weremade. Because this area is not easy to pin-point, digital counts were
also obtained plus or minus half a pixel away in the direction of the
strongest radiance gradient.
Central wavelength (micrometers)
October 14, 1986 digital counts:Best estimate
Half-pixel shifts in"East-West" direction
AVHRR AVHRR
Channel 1 Channel 2
0.63288 0.84709
199.00 204.00
192.50 196.75
211.00 216.25
May 4, 1987 digital counts:
Best estimate 231.50 239.50
Half-pixel shifts in 225.25 233.00"East-West" direction 239.00 247.50
May 5, 1987 digital counts:
Best estimate
Half-pixel shifts in"East-West" direction
241.25 250.00
230.00 238.00
252.50 262.00

- 20 -
6. Calibration of AVHRR Channels 1 and 2
A prelaunch calibration of the reflective channels of the NOAA-9 AV'HRR was obtained
from Smith (1987) (Table 6.0). It can be represented by
Lx _, 0.05246 D I - 2.0465
and
L 2 = 0.03363 D: - 1.3440,
where radiance L is in units of mWcm-2sr-l#m -t, D represents digital counts, and the subscripts 1
and 2 identify AVHRR channels 1 and 2, respectively. Both relations are highly linear, with r:
values of 0.999999.
In-orbit calibration results from the present methodology are given in Tables 6.1 - 6.3 for
October 14, 1986, Table 6.4 - 6.6 for May 4, 1987, and Tables 6.7 ° 6.9 for May 5, 1987. The
first of three tables for each date concerns results for channel 1 based on three narrower bands,
the second table concerns channel 2 based on four narrower bands, and the third table presents
results for channels l and 2 without subdivision. Calibration coefficients are presented in terms of
counts per unit radiance and three values are given in each case, corresponding to the best estimate
and results for locations plus or minus half a pixel to either side in the scan direction (as discussed
in Section 5). Note that in these tables, radiance values are given in Wm-Zsr-:_m-L
It is evident from the Tables 6.1-6.9 that the results based on narrower bands differ somewhat
from those for the corresponding chanhels without subdivision. A study to assess the validity of
band subdivision for the purposes of running monochromatic radiative transfer codes is currently
in progress. Preliminary results indicate that it is better to use the Palmer central wavelength
rather than subdividing AVHRR channels into a few segments. Thus, for the purposes of discus-
sion, the results based on single wavelength calculations only will be considered.
The calibration results can also be expressed in terms of gain. Based on space views taken by
the sensor, the number of digital counts corresponding to zero radiance has remained fairly con-
stant with time for the AVHRR sensors (Frouin and Gautier, 1987; Markham, 1988). For the
NOAA-9 AVHRR, prelaunch digital count values are 39 and 40 for channels 1 and 2, respectively

-21 -
(Table 6.0). Thus, a gain coefficient is obtained by dividing predicted radiance by the corres-
ponding digital image count from which the dark count has been subtracted; i.e., gain., predicted
radiance/(digital image count = dark image count).
Absolute calibration gain coefficients for the reflective channels of the NOAA=9 AVHRR are
listed in Table 6.10 and portrayed as a function of time in Figures 6.1 and 6.2. Results (slightly
revised) from a Method I analysis on August 28, 1985 at White Sands (Slater et al., 1987b) are also
included. Clearly, the sensor's responsivity has degraded significantly with time, with the greater
change occurring in channel 2. That the gain coefficients in October 1986 should be somewhat
higher than in May 1987 is largely due to the difficulty in making a precise BRF correction for
the earlier date when the nadir view angle was nearly 45 degrees, but also partly due to the prob=
lem of having a 2.2 kilometer pixel dimension in the scan line direction, which exceeds the size of
the uniform reflectance patch at EAFB. The results for May 4 and May 5, 1987, are reasonably
consistent. Although the same surface reflectance measurements were used for both days since no
reflectance measurements were made on May 4th, different atmospheric parameters were used and
the off-nadir view angles differed considerably.

-22-
Table 6.0. Prelaunch calibration for the NOAA-9
AVHRR sensor (Smith, 1987). Radiance
values are in units of mWcm-Zsr-Zpm -1.Digital counts are on a 10-bit scale.
Channel I Channel 2Counts Radiance Counts Radiance
812 40.55
745 37.04
683 33.78618 30.37
551 26.86485 23.40
421 20.04357 16.68
294 13.38227 9.86
161 6.4097 3.04
39 0.00
940 30.27
789 25.19
640 20.18
484 14.93
332 9.82
179 4.68
4O 0.00

- 23 -
Table 6.1 Calibration of NOAA-9 AVHRR Channel 1 at EAFB on October 14, 1986.
Solar Zenith Angle: 53.00
Solar Azimuth Angle: 221.60Solar Distance (AU): 0.9972
Junge Size Distribution: 4.040Aerosol Size Range: 0.02 to 5.02 _mRefractive Index: 1.54 - 0.01 i
Calculated Visibility: 300 km
Wavelength in nmBandwidth
Time of Overpass: 21:46:55 (UT)
Location: EAFB Mojave, CA.Latitude: 34 deg. 58 min.
Longitude: 117 deg. 51 min.NOAA Zenith Angle: 44.50
NOAA Azimuth Angle: 255.00
Relative Azimuth Angle: 33.40
595 635 680
530-610 610-660 660-800
Mie Optical DepthRayleigh Optical Depth
Ozone Optical DepthSpectral Reflectance
Exoatmospheric E0 (W/m2.pm)Normalized Code Radiance
Spectral Radiance
Weighting CoefficientsWeighted Spectral Radiance
0.0299 0.0272 0.0247
0.0662 0.0508 0.0385
0.0330 0.0214 0.0100
0.3932 0.4195 0.4388
1785 1630 1473
0.0744 0.0790 0.0824
133.60 129.43 122.00
0.2912 0.3677 0.3411
38.90 47.59 41.61
Central Wavelength (_m):Code Spectral Radiance (W/m2._m.sr):Total Gaseous Transmittance:
Radiance Predicted at the Sensor (Pcode):
Image Digital Counts (10-bit scale):
Spectral Radiance from Preflight Calibration:
Pcode Counts Per Unit Radiance:
Preflight Counts Per Unit Radiance:
0.63288128.11
0.9200117.86
199.00
83.93
1.69
2.37
192.5080.52
1.63
2.39
211.0090.23
1.79
2.34
(Pcode-Pre)/Pre (%)(radiance): 40.43 46.37 30.63

- 24 -
Table 6.2 Calibration of NOAA-9 AVHRR Channel 2 at EAFB on October 14, 1986.
Solar Zenith Angle: 53.00Solar Azimuth Angle: 221.60Solar Distance (AU): 0.9972
Junge Size Distribution: 4.040Aerosol Size Range: 0.02 to 5.02 _mRefractive Index: 1.54 - 0.01 i
Calculated Visibility:. 300 km
Wavelength in nmBandwidth
Time of Overpass: 21:46:55 (UT)Location: EAFB Mojave, CA.Latitude: 34 deg. 58 rain.
Longitude: 117 deg. 51 min.NOAA Zenith Angle: 44.50
NOAA Azimuth Angle: 255.00Relative Azimuth Angle: 33.40
760 840 900 960
680-800 800-870 870-950 950-I160
Mie Optical Depth
Rayleigh Optical DepthOzone Optical Depth
Spectral ReflectanceExoatmospheric E0 (W/m2._m)Normalized Code Radiance
Spectral Radiance
Weighting Coefficients
Weighted Spectral Radiance
0.0210 0.0182 0.0165 0.0150
0.0246 0.0164 0.0124 0.00960.0039 0.0015 0.0000 0.00000.4496 0.4627 0.4782 0.4936
1222.5 1020.0 913.0 771.00.0844 0.0869 0.0899 0.0929
103.79 89.17 82.53 72.00
0.3403 0.2601 0.2728 0.1268
35.32 23.19 22.51 9.13
Central Wavelength (pm):
Code Spectral Radiance (W/m2._m.sr):Total Gaseous Transmittance:
Radiance Predicted at the Sensor (Pcode):
Image Digital Counts (10-bit scale):
Spectral Radiance from Preflight Calibration:
Pcode Counts Per Unit Radiance:
• Preflight Counts Per Unit Radiance:
0.8470990.16
0.888080.06
204.00
55.17
2.55
3.70
196.75
52.73
2.463.73
216.25
59.28
2.70
3.65
(Pcode-Pre)/Pre (%)(radiance): 45.13 51.84 35.04

- 25 -
Table 6.3 Calibration of NOAA-9 AVHRR Channels 1 and 2 (without subdivision)at EAFB on October 14, 1986.
Solar Zenith Angle: 53.00Solar Azimuth Angle: 221.60
Solar Distance (AU): 0.9972
Junge Size Distribution: 4.040Aerosol Size Range: 0.02 to 5.02 #mRefractive Index: 1.54 - 0.01 i
Calculated Visibility:. 300 km
Wavelength in nmBandwidth
Time of Overpass: 21:46:55 (UT)Location: EAFB Mojave, CA.
Latitude: 34 deg. 58 min.
Longitude: 117 deg. 51 min.NOAA Zenith Angle: 44.50NOAA Azimuth Angle: 255.00
Relative Azimuth Angle: 33.40
632.88568-698
847.09
704-990
Mie Optical Depth
Rayleigh Optical DepthOzone Optical Depth
Spectral Reflectance
Exoatmospheric E0 (W/m2._m)Normalized Code Radiance
Spectral Radiance
Weighting Coefficients
Weighted Spectral Radiance
Central Wavelength (#m):Code Spectral Radiance (W/m2.#m.sr):Total Gaseous Transmittance:
Predicted Sensor Radiance (Pcode):
Image Digital Counts (10-bit scale):Spectral Radiance from Preflight Cal:
Pcode Counts Per Unit Radiance:
Preflight Counts Per Unit Radiance:
0.02740.05150.0222
0.4182
15440.0787
122.191.0000
122.19
0.63288122.19
0.9200112.41
199.0083.93
1.77
2.37
192.50
80.52
1.71
2.39
211.00
90.23
1.88
2.34
0.01800.01590.0014
0.4645
999.20.0863
86.731.0000
86.73
0.8470986.73
0.888077.02
204.00
55.17
2.65
3.70
196.75
52.73
2.55
3.73
216.25
59.28
2.81
3.65
(Pcode-Pre)/Pre (%)(radiance): 33.94 39.61 24.59 39.61 46.07 29.91
- 26 -
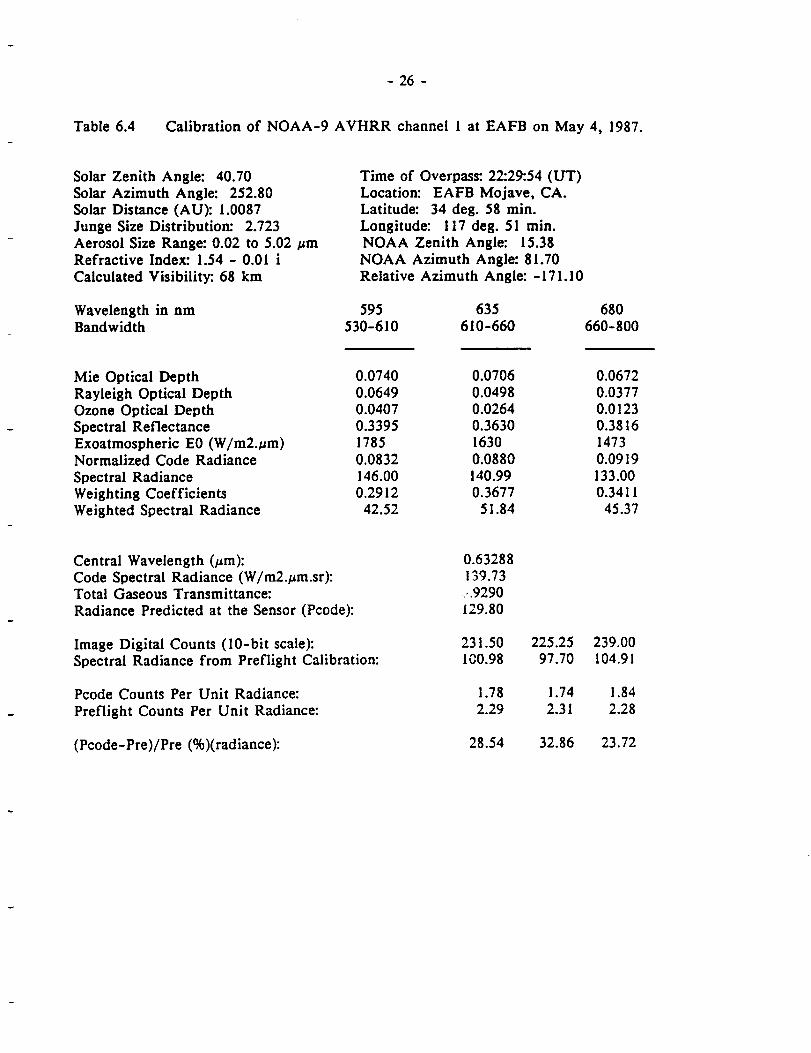
Table 6.4 Calibration of NOAA-9 AVHRR channel 1 at EAFB on May 4, 1987.
Solar Zenith Angle: 40.70Solar Azimuth Angle: 252.80
Solar Distance (AU): 1.0087Junge Size Distribution: 2.723
Aerosol Size Range: 0.02 to 5.02 _mRefractive Index: 1.54 - 0.01 i
Calculated Visibility:. 68 km
Wavelength in nmBandwidth
Time of Overpass: 22:29:54 (UT)
Location: EAFB Mojave, CA.Latitude: 34 deg. 58 min.
Longitude: 117 deg. 51 min.NOAA Zenith Angle: 15.38
NOAA Azimuth Angle: 81.70Relative Azimuth Angle: - 171.10
595 635 680
530-610 610-660 660-800
Mie Optical Depth
Rayleigh Optical DepthOzone Optical Depth
Spectral ReflectanceExoatmospheric E0 (W/m2._m)Normalized Code Radiance
Spectral Radiance
Weighting Coefficients
Weighted Spectral Radiance
0.0740 0.0706 0.0672
0.0649 0.0498 0.0377
0.0407 0.0264 0.0123
0.3395 0.3630 0.3816
1785 1630 1473
0.0832 0.0880 0.0919
146.00 140.99 133.00
0.2912 0.3677 0.3411
42.52 51.84 45.37
Central Wavelength (_,m):Code Spectral Radiance (W/m2./Jm.sr):Total Gaseous Transmittance:
Radiance Predicted at the Sensor (Pcode):
Image Digital Counts (10-bit scale):
Spectral Radiance from Preflight Calibration:
Pcode Counts Per Unit Radiance:
Preflight Counts Per Unit Radiance:
0.63288
139.73:.9290
129.80
231.50100.98
1.78
2.29
225.2597.70
1.74
2.31
239.00104.91
1.84
2.28
(Pcode-Pre)/Pre (%)(radiance): 28.54 32.86 23.72

- 27 -
Table 6.5 Calibration of NOAA-9 AVHRR Channel 2 at EAFB on May 4, 1987.
Solar Zenith Angle: 40.70
Solar Azimuth Angle: 252.80Solar Distance (AU): 1.0087
Junge Size Distribution: 2.723Aerosol Size Range: 0.02 to 5.02 #mRefractive Index: 1.54 - 0.01 i
Calculated Visibility:. 68 km
Time of Overpass: 22:29:54 (UT)
Location: EAFB Mojave, CA.Latitude: 34 deg. 58 rain.
Longitude: 117 deg. 51 min.NOAA Zenith Angle: 15.38
NOAA Azimuth Angle: 81.70Relative Azimuth Angle: - 171.10
Wavelength in nmBandwidth
760 840 900 960
680-800 800-870 870-50 950-160
Mie Optical Depth
Rayleigh Optical DepthOzone Optical Depth
Spectral ReflectanceExoatmospheric E0 (W/m2._m)Normalized Code Radiance
Spectral Radiance
Weighting CoefficientsWeighted Spectral Radiance
0.0620 0.0577 0.0549 0.0524
0.0241 0.0161 0.0122 0.0094
0.0048 0.0019 0.0000 0.0000
0.3970 0.4096 0.4119 0.4143
1222.5 I020.0 913.0 771.0
0.0951 0,0978 0.0983 0.0988
I14.29 98.08 88.21 74.90
0.3403 0.2601 0.2728 0.1268
38.89 25.51 24.06 9.50
Central Wavelength (pm):
Code Spectral Radiance (W/m2.#m.sr):Total Gaseous Transmittance:Radiance Predicted at the Sensor (Pcode):
Image Digital Counts (10-bit scale):
Spectral Radiance from Preflight Calibration:
Pcode Counts Per Unit Radiance:
Preflight Counts Per Unit Radiance:
0.84709
97.96
0.9110
89.25
239.5067.10
2.68
3.57
233.00
64.92
2.61
3.59
247.50
69.79
2.77
3.55
(Pcode-Pre)/Pre (%)(radiance): 33.00 37.47 27.87

- 28 -
Table 6.6 Calibration of NOAA-9 AVHRR Channesl 1 and 2 (without subdivision) at
EAFB on May 4, 1987.
Solar Zenith Angle: 40.70Solar Azimuth Angle: 252.80Solar Distance (AU): 1.0087
Junge Size Distribution: 2.723
Aerosol Size Range: 0.02 to 5.02 pmRefractive Index: 1.54 - 0.01 i
Calculated Visibility:. 300 km
Time of Overpass: 22:29:54 (LIT)
Location: EAFB Mojave, CA.Latitude: 34 deg. 58 min.
Longitude: 117 deg. 51 rain.NOAA Zenith Angle: 15.30
NOAA Azimuth Angle: 81.70Relative Azimuth Angle: - 171.10
Wavelength in nmBandwidth
632.88568-698
847.09704-990
Mie Optical DepthRayleigh Optical DepthOzone Optical Depth
Spectral Reflectance
Exoatmospheric E0 (W/m2._m)Normalized Code Radiance
Spectral Radiance
Weighting CoefficientsWeighted Spectral Radiance
Central Wavelength (#m):Code Spectral Radiance (W/m2.#m.sr):Total Gaseous Transmittance:
Predicted Sensor Radiance (Pcode):
Image Digital Counts (10-bit scale):Spectral Radiance from Preflight Cal:
Pcode Counts Per Unit Radiance:
Preflight Counts Per Unit Radiance:
0.07080.05050.273
0.3617
15440.0877133.14
1.0000
133.14
0.63288133.14
0.9290
123.69
231.50100.98
1.87
2.29
225.25
97.70
1.822.31
239.00107.91
1.93
2.28
0.05730.0155
0.00170.4098
999.20.0975
95.761.0000
95.76
0.84709
95.760.9110
87.24
239.5067.10
2.75
3.57
233.0064.92
2.67
3.59
247.5069.79
2.84
3.55
(Pcode-Pre)/Pre (%)(radiance): 22.48 26.60 17.89 30.01 34.39 25.00

= 29 =
Table 6.7 Calibration of NOAA=9 AVHRR Channel 1 at EAFB on May 5, 1987.
Solar Zenith Angle: 38.50
Solar Azimuth Angle: 250.80Solar Distance (AU): 1.0087Junge Size Distribution: 2.511
Aerosol Size Range: 0.02 to 5.02 _mRefractive Index: 1.54 = 0.01 i
Calculated Visibility: 68 km
Wavelength in nmBandwidth
Time of Overpass: 22:19:03 (UT)
Location: EAFB Mojave, CA.Latitude: 34 deg. 58 rain.
Longitude: 117 deg. 51 rain.NOAA Zenith Angle: 31.30
NOAA Azimuth Angle: 81.70
Relative Azimuth Angle: =169.10
595 635 680
530-610 610=660 660-800
Mie Optical Depth
Rayleigh Optical DepthOzone Optical Depth
Spectral ReflectanceExoatmospheric E0 (W/m2./zm)Normalized Code Radiance
Spectral RadianceWeighting Coefficients
Weighted Spectral Radiance
0.1401 0.1355 0.13090.0649 0.0498 0.0377
0.0375 0.0243 0.0113
0.3429 0.3651 0.38271785 1630 1473
0.0873 0.0915 0.0950
153.15 146.64 137.540.2912 0.3677 0.3411
44.60 53.92 46.91
Central Wavelength (pm):Code Spectral Radiance (W/m2./Jm.sr):Total Gaseous Transmittance:
Radiance Predicted at the Sensor (Pcode):
Image Digital Counts (10-bit scale):Spectral Radiance from Preflight Calibration:
Pcode Counts Per Unit Radiance:
Preflight Counts Per Unit Radiance:
0.63288
145.430.9260
134.67
241.25
106.09
1.79
2.27
230.00100.19
1.712.30
252.50
112.00
1.87
2.25
(Pcode=Pre)/Pre (%)(radiance): 26.93 34.41 20.24

- 30 -
Table 6.8 Calibration of NOAA-9 AVHRR Channel 2 at EAFB on May 5, 1987.
Solar Zenith Angle: 38.50Solar Azimuth Angle: 250.80
Solar Distance (AU): 1.0087Junge Size Distribution: 2.511
Aerosol Size Range: 0.02 to 5.02 pmRefractive Index: 1.54 - 0.01 i
Calculated Visibility:. 68 km
Time of Overpass: 22:19:03 (UT)Location: EAFB Mojave, CA.
Latitude: 34 deg. 58 min.Longitude: 117 deg. 51 rain.
NOAA Zenith Angle: 31.38NOAA Azimuth Angle: 81.70
Relative Azimuth Angle: -169.10
Wavelength in nmBandwidth
760 840 900 960
680-800 800-870 870-950 950--4160
Mie Optical DepthRayleigh Optical Depth
Ozone Optical DepthSpectral Reflectance
Exoatmospheric E0 (W/m2.pm)Normalized Code Radiance
Spectral Radiance
Weighting CoefficientsWeighted Spectral Radiance
0.1236 0.I175 0.I134
0.0241 0.0161 0.0122
0.0045 0.0018 0.0000
0.3973 0.4091 0.4115
1222.5 I020.0 913.0
0.0980 0.1005 O.lOlO
I17.71 100.79 90.67
0.3403 0.2601 0.2728
40.06 26.21 24.73
0.1097
0.0094
0.0000
0.4139
771.0
0.I016
76.98
0.1268
9.76
Central Wavelength (pm):
Code Spectral Radiance (W/m2._m.sr):Total Gaseous Transmittance:
Radiance Predicted at the Sensor (Pcode):
Image Digital Counts (10-bit scale):Spectral Radiance from Preflight Calibration:
Pcode Counts Per Unit Radiance:
Preflight Counts Per Unit Radiance:
0.84709
100.77
0.909091.60
250.00
70.64
2.73
3.54
238.00
66.60
2.60
3.57
262.00
74.67
2.86
3.51
(Pcode-Pre)/Pre (%)(radiance): 29.68 37.53 22.67

-31 -
Table 6.9 Calibration of NOAA-9 AVHRR Channels 1 and 2 (without subdivision) at EAFBon May 5, 1987.
Solar Zenith Angle: 38.00
Solar Azimuth Angle: 250.80Solar Distance (AU): 2.511
Junge Size Distribution: 2.511
Aerosol Size Range: 0.02 to 5.02 ;_mRefractive Index: 1.54 - 0.01 i
Calculated Visibility:. 68 km
Time of Overpass: 22:19:03(UT)Location: EAFB Mojave, CA.
Latitude: 34 deg. 58 rain.Longitude: 117 deg. 51 rain.
NOAA Zenith Angle: 31.30
NOAA Azimuth Angle: 81.70Relative Azimuth Angle: - 169.10
Wavelength in nmBandwidth
632.88568-698
847.09
704-990
Mie Optical Depth
Rayleigh Optical Depth
Ozone Optical DepthSpectral Reflectance
Exoatmospheric E0 (W/m2./_m)Normalized Code Radiance
Spectral Radiance
Weighting CoefficientsWeighted Spectral Radiance
Central Wavelength (;Jm):Code Spectral Radiance (W/m2./_m.sr):Total Gaseous Transmittance:
Predicted Sensor Radiance (Pcode):
Image Digital Counts (10-bit scale):
Spectral Radiance from Preflight Cal:
Pcode Counts Per Unit Radiance:
Preflight Counts Per Unit Radiance:
0.1357
0.0505
0.02520.3639
15440.0913
138.541.0000
138.54
0.63288
138.540.9260
128.29
241.25
I06.09
1.882.27
230.00
100.19
1.79
2.30
252.50
112.00
1.97
2.25
0.1170
0.0155
0.0016
0.4094
999.2
0.1006
98.79
1.0000
98.79
0.84709
98.79
0.9090
89.80
250.00
70.64
2.78
3.54
238.00
66.60
2.65
3.57
262.00
74.67
2.92
3.51
(Pcode-Pre)/Pre (%)(radiance): 20.92 28.04 14.55 27.13 34.83 20.26

- 32 -
Table6.10. NOAA-9 AVHRR radiometric calibration results. For Method 2 atEAFB, resultsare given in parentheses for locations plus or minus half a pixel awayin the scan direction. Gain coefficients are in units of Wm-:sr-X_m-Xcount -x.
Date
Difference Difference
Channel 1 from Channel 2 fromMethod Gain Prelaunch Gain Prelaunch
Prelauneh
1985.08.28
1986.10.14
1987.05.04
1987.05.05
0.5243 0.3286
1 0.552 5.2% 0.390 18.7%
2 0.703 34.1% 0.470 43.0%
(0.654, 0.732) (0.437, 0.491)
2 0.674 28.6% 0.447 36.0%
(0.649, 0.697) (0.430, 0.462)
2 0.666 27.0% 0.436 32.7%
(0.631, 0.705) (0.413, 0.463)

ZI--I
¢.9
ZI-=)
U=!t=9Z
=r"¢_l
45
40-
35-
3O-
25-
2O--
iS-
10-
5-
0
- 33 -I ! I
_mo_ 1
Iq85
_1_o_ 2
ocrL%6
tV_T'HO02
MAY_
i
I :o
DAYS FROM LAUNCH
Figure 6.1. NOAA-9 AVHRR channel 1 calibration results expressed as percent change in gain asa function of time. In Method 2 cases at EAFB, results for locations plus or minus half a pixel
away in the scan direction give rise to the error bars. The May 1987 results are averages from
May 4 and May 5.
50-
Z 40-I-=l
Z
ILl
Z
"r 20-
10-
i i I
_ETHOOi
WS_
AUG]q85
EAFB w_nqoD 2
oct19_5 EAFB
MAY 1987
_o s_o _o
DAYS FROM LAUNCH
i oo
Figure 6.2. As for Figure 6.1, except for NOAA-9 AVHRR channel 2.

= 34 -
7. Concluding Remarks
A significant degradation in NOAA=9 AVHRR responsivity has occurred since the prelaunch
calibration and with time since launch. As of May 1987, the change has been on the order of 25
to 30 percent in channel 1 and approximately 35 percent in channel 2. The analysis of more
recent data sets is needed to update and further characterize the degradation. In this regard, a
data set involving T/vI, HRV, and AVHRR imagery is currently being assembled after a successful
field trip to White Sands on February 8-10, 1988.
There are some limitations to the use of Method 2 at the Rogers (dry) Lake site at Edwards
Air Force Base. The uniform area is limited to one AVHRR pixel and is surrounded by terrain of
much brighter and much darker reflectance on either side. In addition, unlike the gypsum at
White Sands, the surface is not very lambertian so that BRF corrections are important. (It should
also be noted that the radiative transfer codes assume lambertian reflectance.) Method 2 using the
Rogers (dry) Lake site is not likely to be able to track gain changes less than about 10 percent.

- 35 -
8. References
Elterman. L. (1966), Aerosol measurements in the troposphere and stratosphere, Appl. Opt.,5:1769-1776.
Frouin, R., and Gautier, C. (1987), Calibration and NOAA-7 AVHRR, GOES-5, and GOES-6VISSR/VAS solar channels, Remote Sens. Environ., 22:73-101.
Herman, B. M. and Browning, S. R. (1975) The effect of aerosols on the earth-atmosphere albedo,J. Atmos. Sci., 22:158-165.
Iqbal, M. (1983), An Introduction to Solar Radiation, Academic Press, New York.
Junge, C. E. (1963), Air Chemistry and Radioactivity, Academic Press, New York.
Markham, B. L. (1988),communication to the authors.
Palmer, I. M., and Tomasko, M. G. (1980), Broadband radiometry with spectrally selective detec-tors, Optics Letters, 5:208-210.
Slater, P. N., Bigger, S. F., Holm, R. G., Jackson, R. D., Mao, Y., Moran, M. S., Palmer, J. M.and Yuan, B. (1987a), Reflectance- and radiance-based methods for the in-flight absolute calibra-tion of multispectral sensors, Remote Sens. Environ., 22:11-37.
Slater, P. N. Teillet, P. M., and Mao, Y. (1987b), The absolute radiometric calibration of the
Advanced Very High Resolution Radiometer, Semi-Annual Status Report, NASA GrantNAG5-859, Optical Sciences Center, University of Arizona, Tucson, Arizona, 26 pages.
Smith, G. R. (1987), communication to the authors.
Tanr6, D., Deroo, C., Duhaut, P., Herman, M., Morcrette, J. J., Perbos, J., and Deschamps, P. Y.
(1985), Effets atmosph6riques en t616d6tection--logiciel de simulation du signal satellitaire dans lespectre solaire, Proc. Third Int. Colloq. on Spectral Signatures of Objects in Remote Sensing, ESA
SP-247, pp. 315-319.
= 36 -
9. Appendix
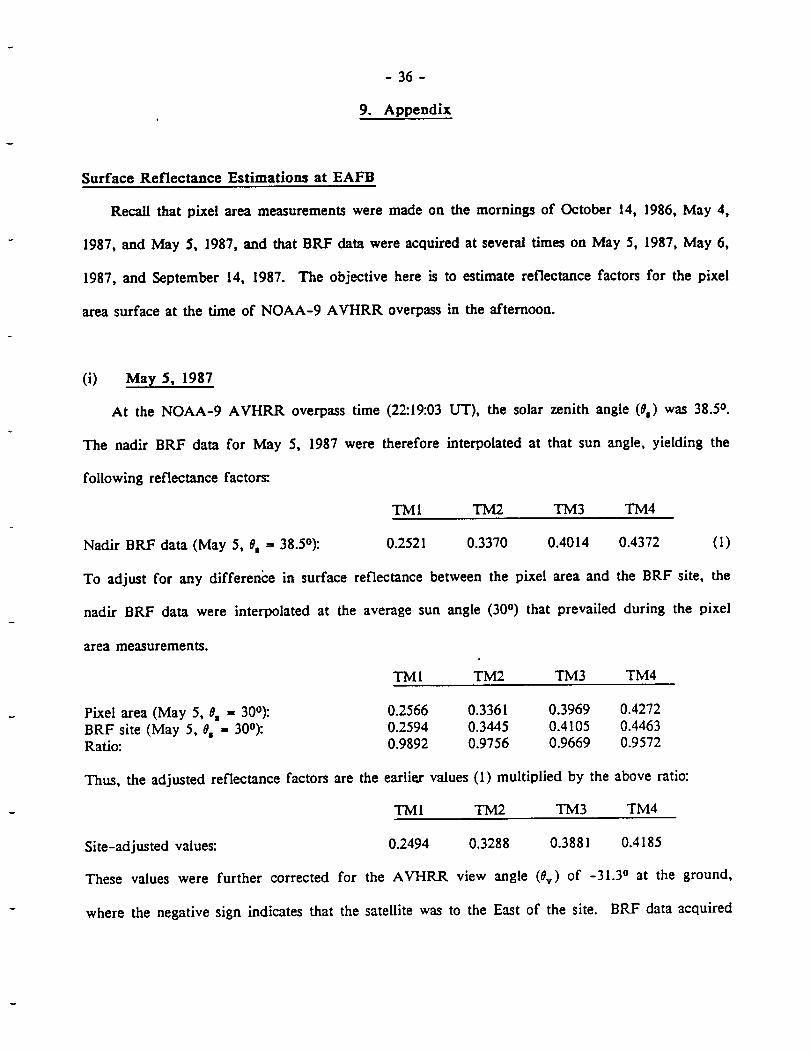
Surface Reflectance Estimations at EAFB
Recall that pixel area measurements were made on the mornings of October 14, 1986, May 4,
1987, and May 5, 1987, and that BRF data were acquired at several times on May 5, 1987, May 6,
1987, and September 14, 1987. The objective here is to estimate reflectance factors for the pixel
area surface at the time of NOAA-9 AVHRR overpass in the afternoon.
(i) May 5, 1987
At the NOAA-9 AVHRR overpass time (22:19:03 UT), the solar zenith angle (0,) was 38.5 o.
The nadir BRF data for May 5, 1987 were therefore interpolated at that sun angle, yielding the
following reflectance factors:.
TMI TM2 TM3 Tlvl4
Nadir BRF data (May 5, 0, = 38.5°): 0.2521 0.3370 0.4014 0.4372 (I)
To adjust for any difference in surface reflectance between the pixel area and the BRF site, the
nadir BRF data were interpolated at the average sun angle (30 o) that prevailed during the pixel
area measurements.
Pixel area (May 5, 0. = 30°):
BRF site (May 5, 0. ffi 30°):Ratio:
TMI TM2 TM3 TM4
0.2566 0.3361 0.3969 0.42720.2594 0.3445 0.4105 0.4463
0.9892 0.9756 0.9669 0.9572
Thus, the adjusted reflectance factors are the earlier values (I)multiplied by the above ratio:
TMI TM2 TM3 TM4
Site-adjusted values: 0.2494 0.3288 0.3881 0.4185
These values were further corrected for the AVI-IRR view angle (0v) of -31.30 at the ground,
where the negative sign indicates that the satellite was to the East of the site. BRF data acquired
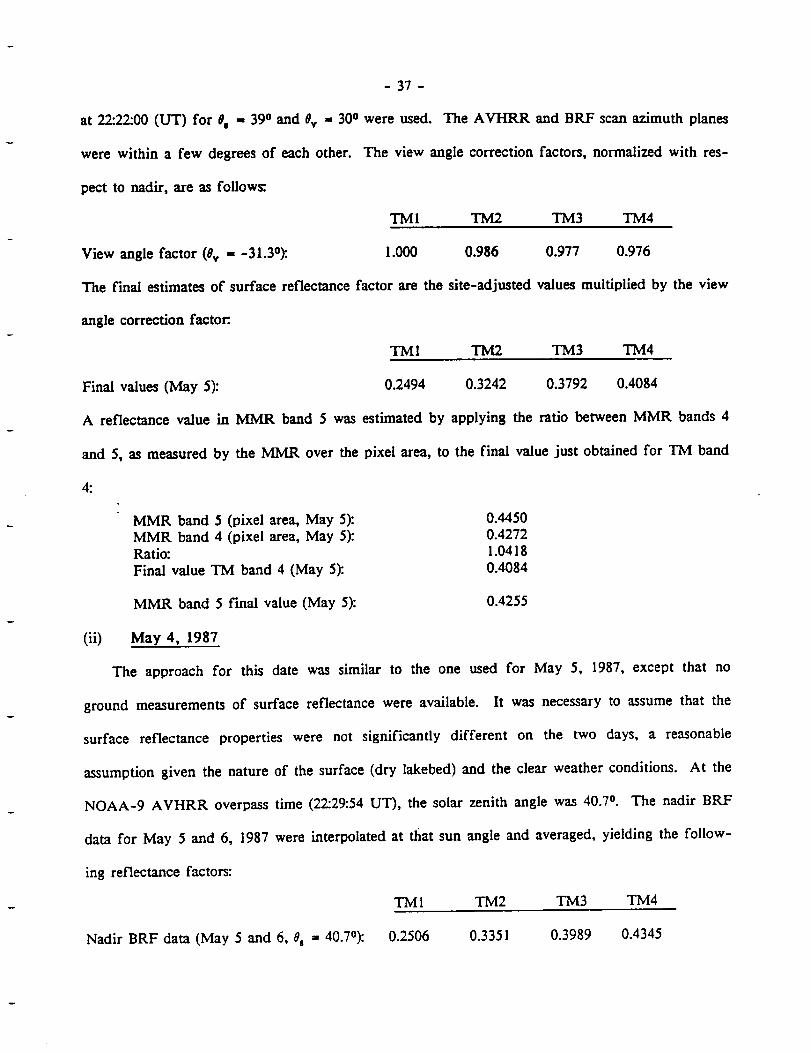
- 37 -
at 22:22:00 (UT) for 0, = 390 and 0,, ,. 30 o were used.
were within a few degrees of each other.
pect to nadir, are as follows:
View angle factor (0v - -31.3o):.
The AVHRR and BRF scan azimuth planes
The view angle correction factors, normalized with res-
TMI TM2 TM3 _4
1.000 0.986 0.977 0.976
The final estimates of surface reflectance factor are the site=adjusted values multiplied by the view
angle correction factor:.
TMI TM2 TM3 TM4
Final values (May 5): 0.2494 0.3242 0.3792 0.4084
A reflectance value in MMR band 5 was estimated by applying the ratio between MMR bands 4
and 5, as measured by the MMR over the pixel area, to the final value just obtained for TM band
4"
MMR band 5 (pixel area, May 5):
MMR band 4 (pixel area, May 5):Ratio:
Final value TM band 4 (May 5):
MMR band 5 final value (May 5):
(ii) May 4, 1987
0.4450
0.4272
1.0418
0.4084
0.4255
The approach for this date was similar to the one used for May 5, 1987, except that no
ground measurements of surface reflectance were available. It was necessary to assume that the
surface reflectance properties were not significantly different on the two days, a reasonable
assumption given the nature of the surface (dry lakebed) and the clear weather conditions. At the
NOAA-9 AVHRR overpass time (22:29:54 UT), the solar zenith angle was 40.7 o. The nadir BRF
data for May 5 and 6, 1987 were interpolated at that sun angle and averaged, yielding the follow-
ing reflectance factors:
TM 1 TM2 TM3 TM4
Nadir BRF data (May 5 and 6, Oj = 40.7°): 0.2506 0.3351 0.3989 0.4345

- 38 -
To adjust for any difference in surface reflectance between the pixel area and the BRF site, the
nadir BRF data for May 5 and 6 were interpolated at the average sun angle (30 o) that prevailed
during the pixel area measurements on May 5 and 6, and then averaged.
TMI _2 TM3 TM4
Pixel area (May 5, 0, = 30 °)BRF site (May 5, 0_, - 30°):Ratio (May 5):
Pixel area (May 6, 0, = 300):
BRF site (May 6, 0, - 30°):.Ratio (May 6):Average ratio:
0.2566 0.3361 0.3969 0.4272
0.2594 0.3445 0.4105 0.44630.9892 0.9756 0.9669 0.95720.2503 0.3346 0.4002 0.4306
0.2606 0.3459 0.4117 0.44720.9605 0.9673 0.9721 0.9629
0.9748 0.9715 0.9695 0.9600
The adjusted reflectance factors are the initial values multiplied by the above average ratio:
TM 1 TM2 TM3 TM4
Site-adjusted values: 0.2443 0.3255 0.3867 0.4171
The AVHRR view angle was -15.30 at the ground and so BRF data acquired on May 5 at 22:22:00
(UT) for 0, = 39 ° and 9v = -15 ° were used to correct for view angle:
TMI TM2 TM3 TM4
View angle factor (0v = - 15.3 °)Final values (May 4):
0.986 0.982 0.977 0.9800.2409 0.3197 0.9778 0.4088
In this case, a reflectance value in MMR band 5 was obtained by applying the ratio between final
values of TM band 4 and MMR band 5 on May 4 to the final value just obtained for TM band 4:
Final value, MMR band 5 (May 5):
Final value, TM band 4 (May 5):Ratio:
Final value TM band 4 (May 4):
0.42550.4084
1.04180.4088
MMR band 5 final value (May 4): 0.4259
(iii) October 14, 1986
On this date, surface reflectance data were acquired over the pixel area site, but no BRF
measurements were made. At the NOAA-9 AVHRR overpass time (21:46:55 UT), the solar zenith
angle was 53.0 o. The nadir data for May 6, 1987 were interpolated at the sun angle, yielding the

following reflectance factors:
Nadir BRF data (May 6, 0, **53°):
- 39 -
TMI TM2 TM3 TM4
0.2462 0.3286 0.3917 0.4265
The site adjustment was based on the average of the site adjustment factors for May 4 and May 5.
May 4 site adjustment:
May 5 site adjustment:
Average:
Site-adjusted values:
TMI TM2 TM3 TM4
0.9892 0.9756 0.9669 0.9572
0.9748 0.9715 0.9695 0.9600
0.9820 0.9736 0.9682 0.9586
0.2418 0.3199 0.3792 0.4088
The AVHRR view angle was +44.50 at the ground, where the positive sign indicates that the satel-
lite was West of the site. There were no BRF data sets collected on any day with solar zenith
angles as large as 53.00 in the afternoon. Instead, a roughly suitable _nfiguration from a morning
BRF data set was used, namely the BRF data acquired on May 5 at 16:13:04 (UT) for 0s ffi 51.30
and 0v ,. -44.50 (interpolated between -400 and -45°). A negative view angle was used for the
BRF data because it is on the side of the sun (Eastward) in the morning, just as the satellite was
View angle factor (0v *. -44.5°):
on the side of the sun (Westward) in the afternoon.
lowing view angle factors:
TMI
1.340
These BRF dat._ _,ould give rise to the fol-
TM2 TM3 TM4
1.290 1.280 1.231
However, the relative azimuth between solar and sensor directions is not well matched to the BRF
measurement configuration, being approximately 380 at the AVHRR observation and 20 for the
relevant BRF data set. In order to compensate for this azimuth difference, the May and Sep-
tember BRF factors were compared, since the two time frames have different solar zenith/azimuth
distributions. Comparing a May BRF data set with a small relative azimuth to a September BRF
data set at the same solar zenith angle with a larger relative azimuth indicates that the view angle
correction is reduced by close to a factor of two. The view angle correction that results is as fol-
lows:

View angle factor (0v ffi -44.50):Final values (October 14):
- 40 -
TMI TM2 TM3 TM4
1.170 1.150 1.140 1.120
0.2828 0.3679 0.4323 0.4579
The reflectance value in MMR band 5 was estimated by applying the ratio between MMR bands 4
and 5, as measured by the MMR over the pixel area, to the final value just obtained for "I'M band
4:
MMR band 5 (pixel area, Oct. 14):MMR band 4 (pixel, area, Oct. 14):Ratio:
Final value TM band 4 (OCt. 14):
0.4675
0.4446
1.0515
0.4579
MMR band 5 final value (OCt. 14): 0.4815