Embed Size (px)
Citation preview
The ABC of
Trabecular Bone Score (TBS)
From Theory to Clinical Practice
Prof. Didier Hans
Center for Bone diseases, DAL
Lausanne University Hospital, Switzerland
Conflict of interest
Didier Hans is co-owner of the TBS patent and has corresponding
ownership shares into medimaps group as well as chairman of the
Board & part time CEO
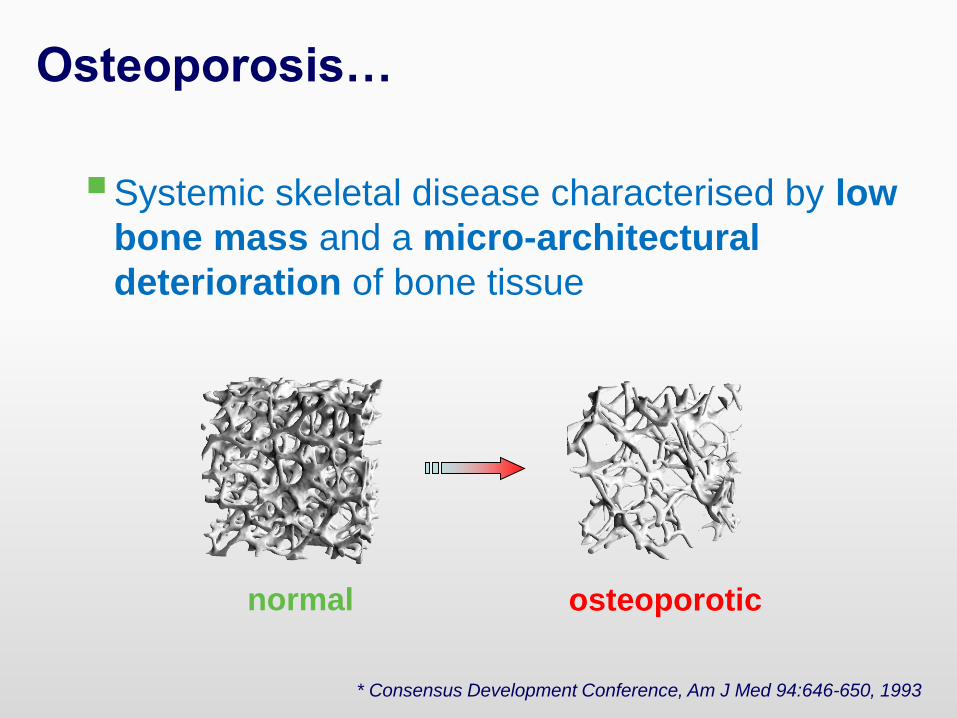
Osteoporosis…
Systemic skeletal disease characterised by low
bone mass and a micro-architectural
deterioration of bone tissue
normal osteoporotic
* Consensus Development Conference, Am J Med 94:646-650, 1993
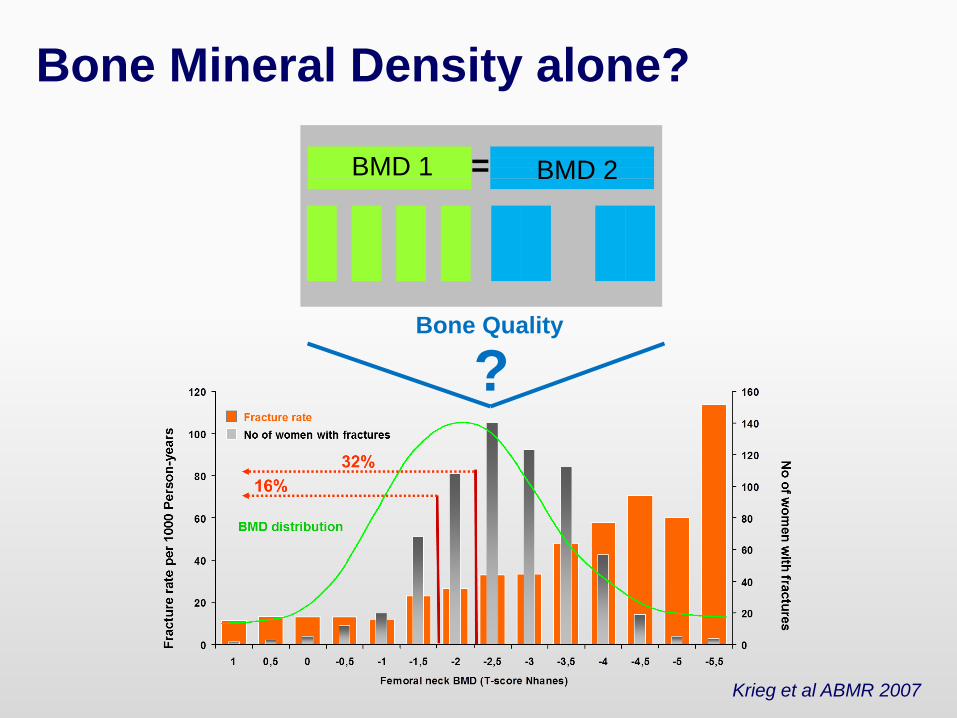
BMD 1 BMD 2=
?
Bone Mineral Density alone?
Bone Quality
Krieg et al ABMR 2007
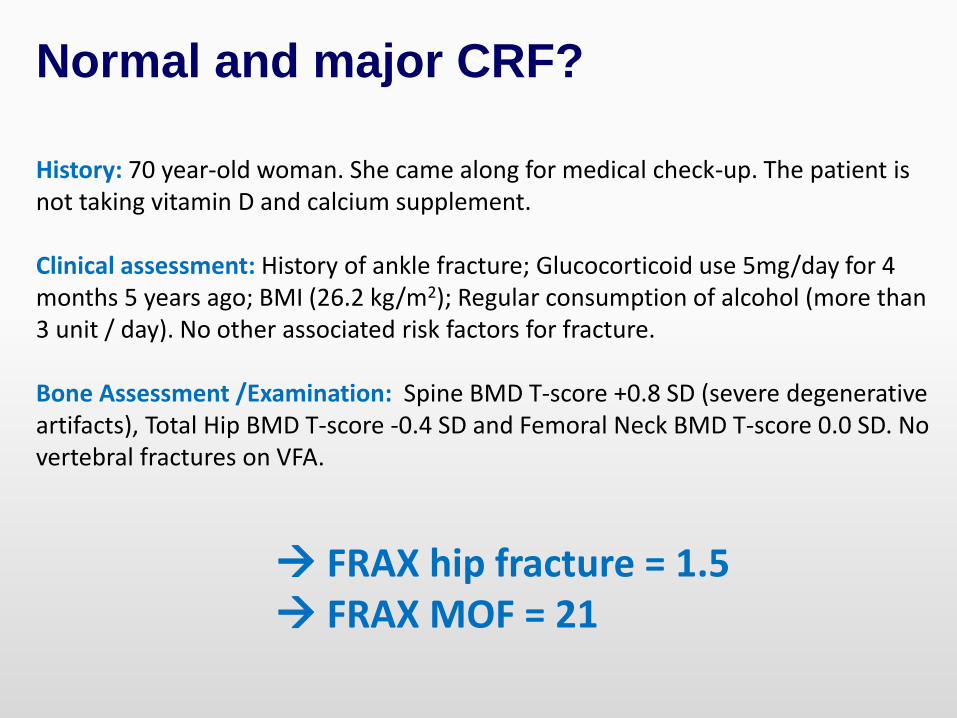
Normal and major CRF?
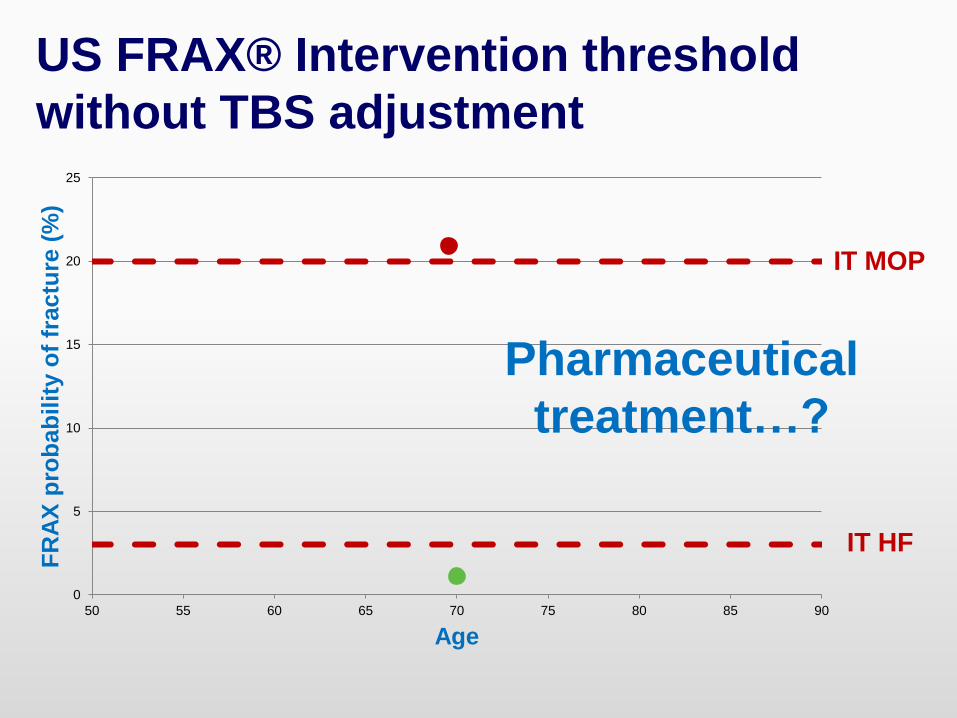
History: 70 year-old woman. She came along for medical check-up. The patient is not taking vitamin D and calcium supplement.
Clinical assessment: History of ankle fracture; Glucocorticoid use 5mg/day for 4 months 5 years ago; BMI (26.2 kg/m2); Regular consumption of alcohol (more than 3 unit / day). No other associated risk factors for fracture.
Bone Assessment /Examination: Spine BMD T-score +0.8 SD (severe degenerative artifacts), Total Hip BMD T-score -0.4 SD and Femoral Neck BMD T-score 0.0 SD. No vertebral fractures on VFA.
FRAX hip fracture = 1.5 FRAX MOF = 21
0
5
10
15
20
25
50 55 60 65 70 75 80 85 90
FR
AX
pro
bab
ilit
y o
f fr
actu
re (
%)
Age
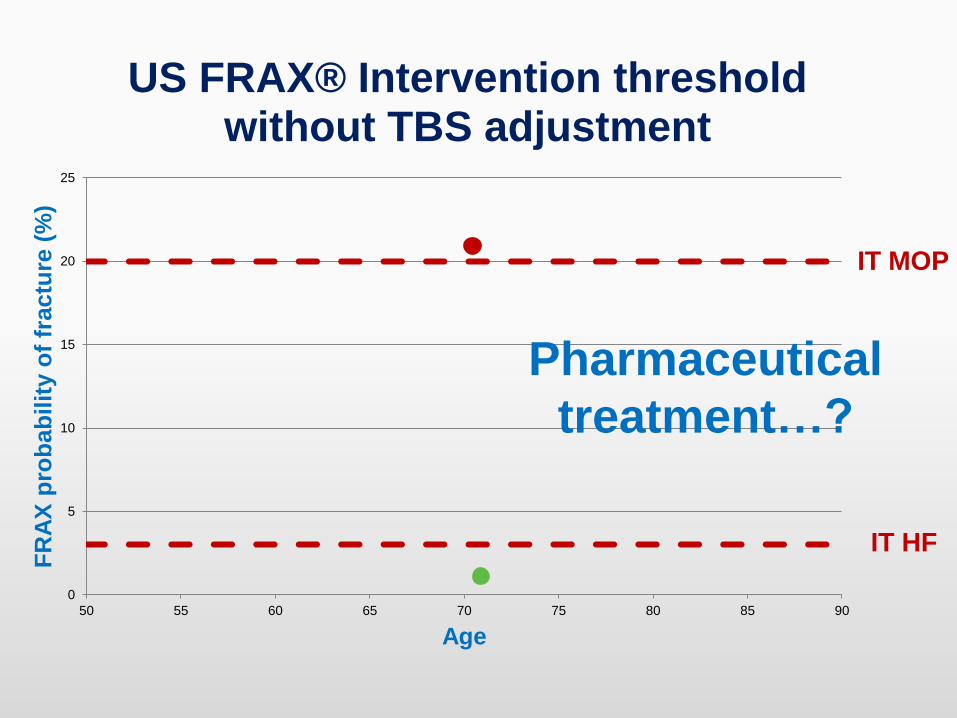
IT MOP
IT HF
Pharmaceutical
treatment…?
US FRAX® Intervention threshold
without TBS adjustment
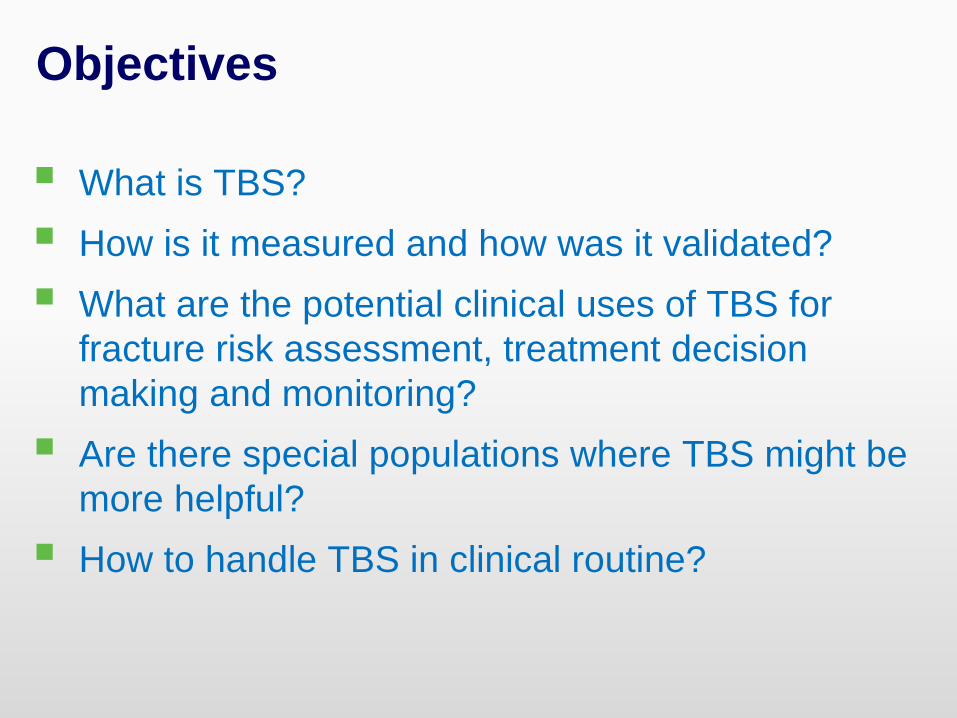
Objectives
What is TBS?
How is it measured and how was it validated?
What are the potential clinical uses of TBS for
fracture risk assessment, treatment decision
making and monitoring?
Are there special populations where TBS might be
more helpful?
How to handle TBS in clinical routine?
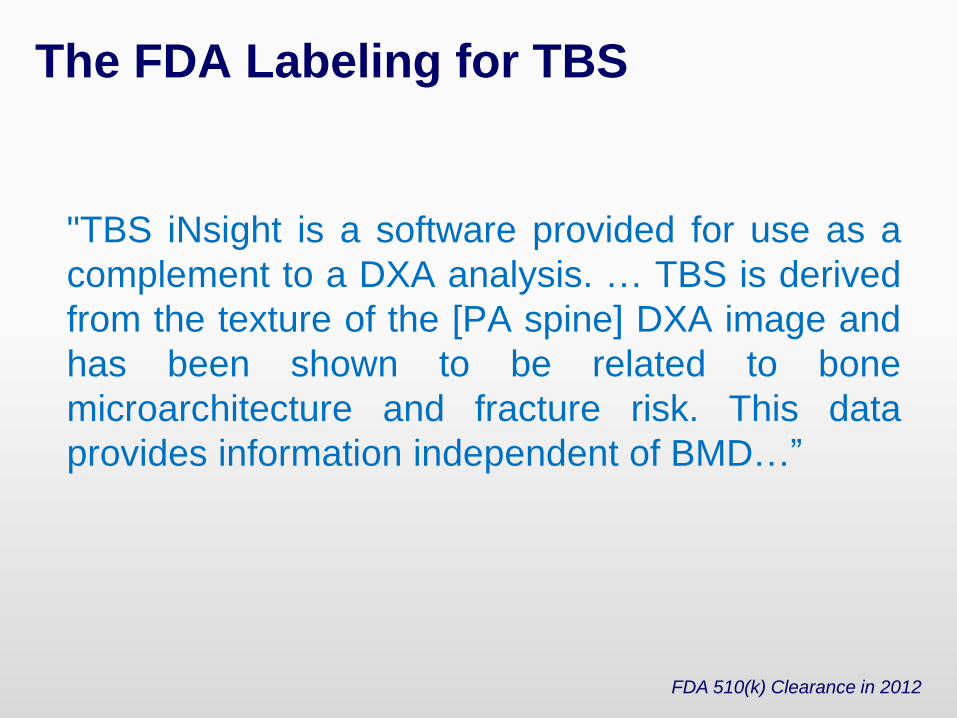
The FDA Labeling for TBS
"TBS iNsight is a software provided for use as a
complement to a DXA analysis. … TBS is derived
from the texture of the [PA spine] DXA image and
has been shown to be related to bone
microarchitecture and fracture risk. This data
provides information independent of BMD…”
FDA 510(k) Clearance in 2012

Can we assess bone
micro-architecture in
routine clinical practice?
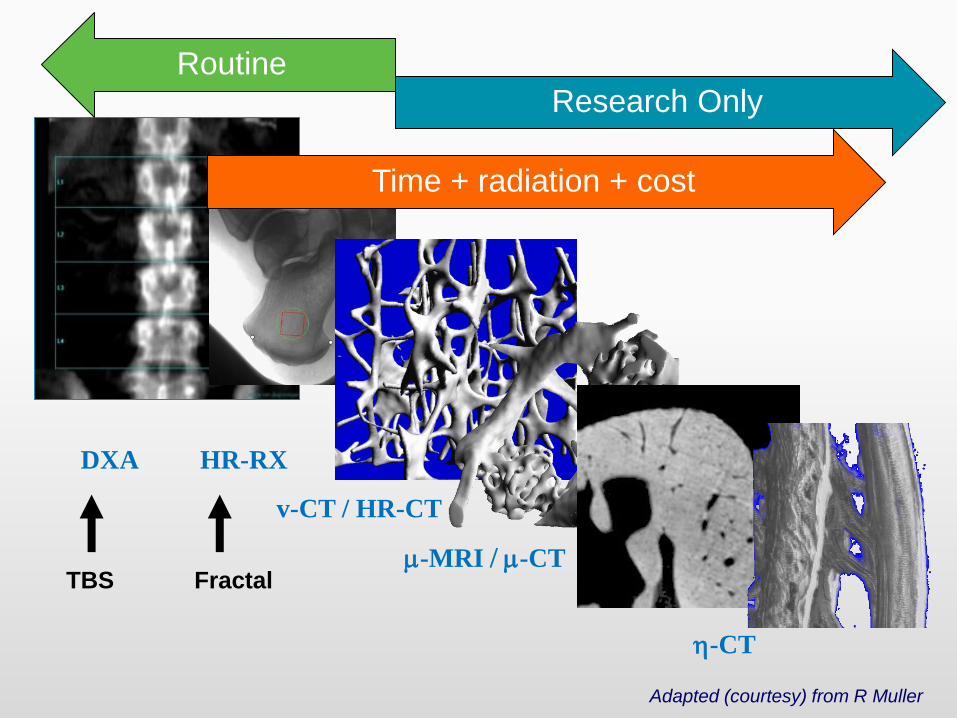
DXA HR-RX
v-CT / HR-CT
m-MRI / m-CT
h-CT
Research Only
Routine
Time + radiation + cost
TBS Fractal
Adapted (courtesy) from R Muller

How Can TBS Assess Microarchitecture?
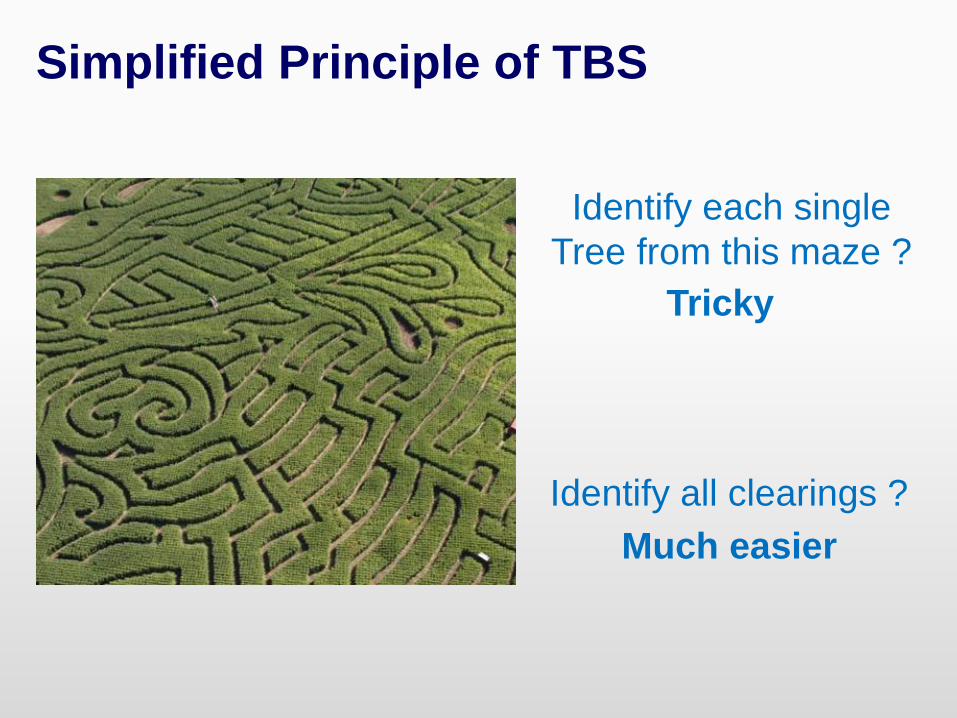
Identify each single
Tree from this maze ?
Tricky
Identify all clearings ?
Much easier
Simplified Principle of TBS
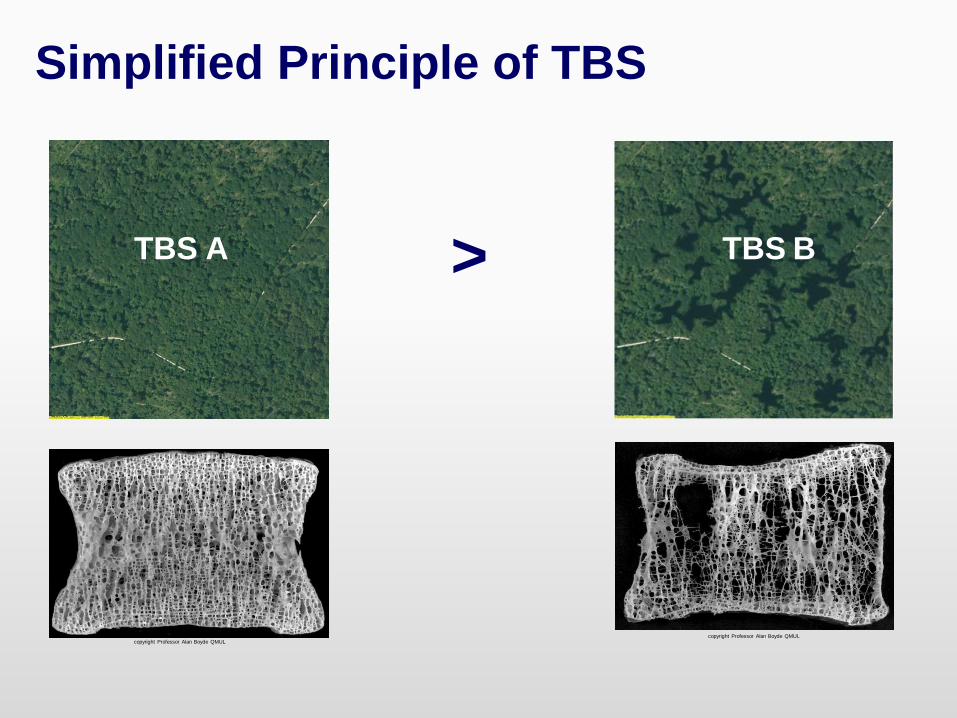
TBS BTBS A >
copyright Professor Alan Boyde QMULcopyright Professor Alan Boyde QMUL
Simplified Principle of TBS
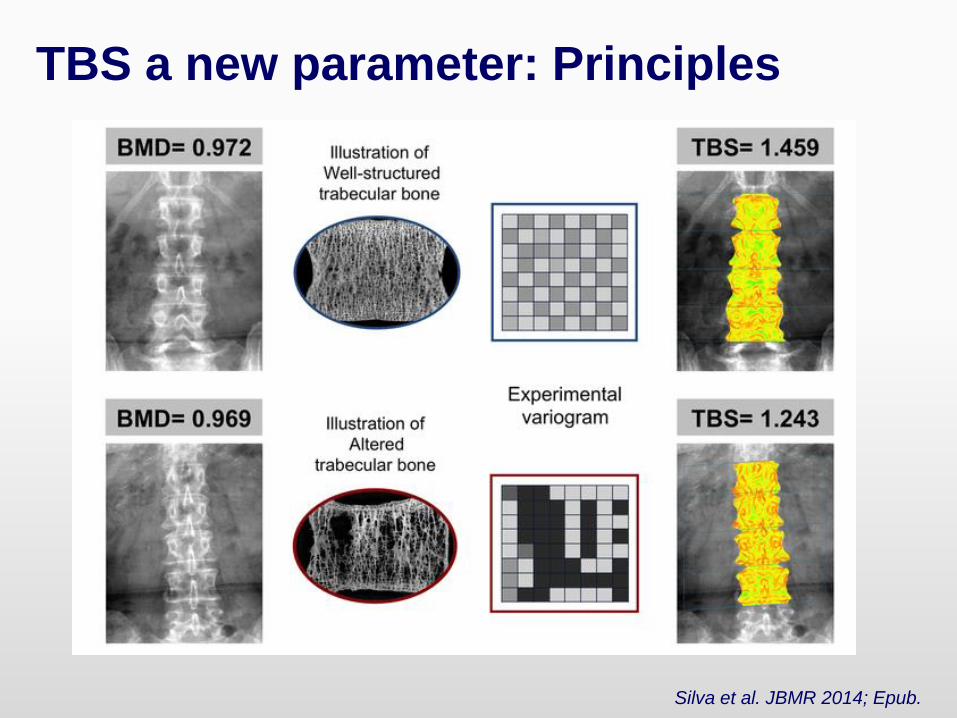
TBS a new parameter: Principles
Silva et al. JBMR 2014; Epub.
TBS is a bone texture index
correlated with bone
microarchitecture parameters and
provides information beyond BMD
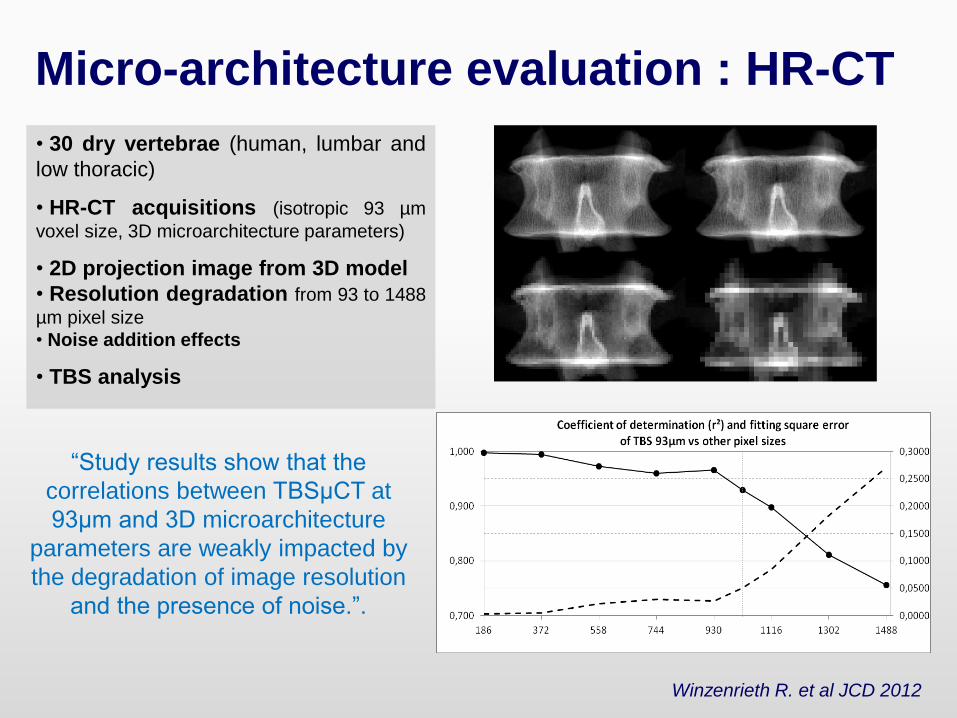
Micro-architecture evaluation : HR-CT
• 30 dry vertebrae (human, lumbar and
low thoracic)
• HR-CT acquisitions (isotropic 93 µm
voxel size, 3D microarchitecture parameters)
• 2D projection image from 3D model
• Resolution degradation from 93 to 1488
µm pixel size
• Noise addition effects
• TBS analysis
“Study results show that the
correlations between TBSμCT at
93μm and 3D microarchitecture
parameters are weakly impacted by
the degradation of image resolution
and the presence of noise.”.
Winzenrieth R. et al JCD 2012
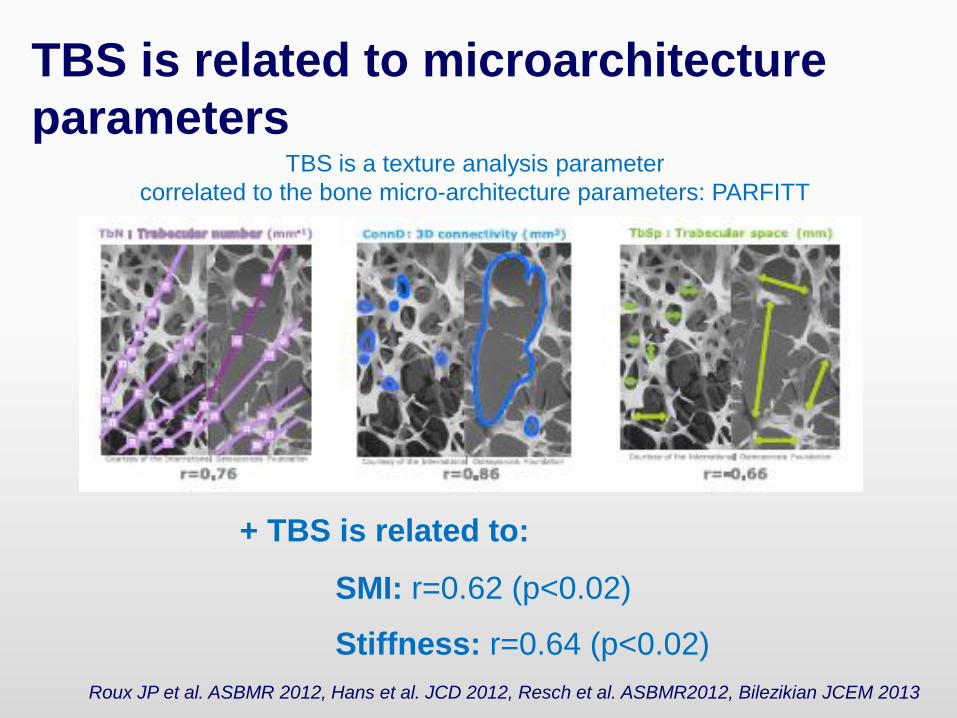
TBS is related to microarchitecture
parametersTBS is a texture analysis parameter
correlated to the bone micro-architecture parameters: PARFITT
+ TBS is related to:
SMI: r=0.62 (p<0.02)
Stiffness: r=0.64 (p<0.02)
Roux JP et al. ASBMR 2012, Hans et al. JCD 2012, Resch et al. ASBMR2012, Bilezikian JCEM 2013
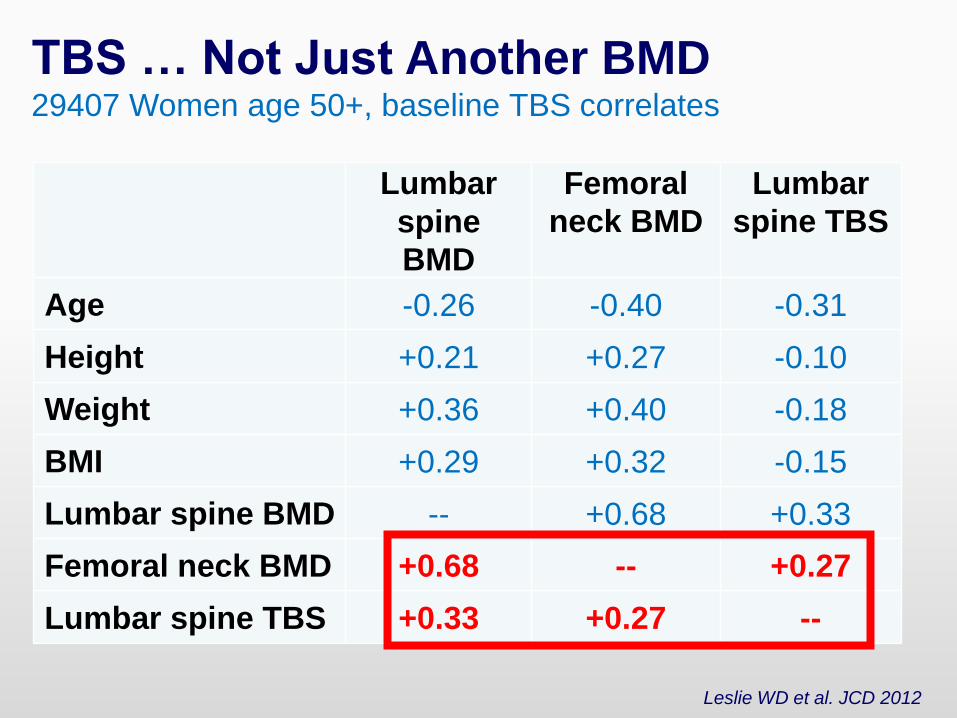
TBS … Not Just Another BMD29407 Women age 50+, baseline TBS correlates
Leslie WD et al. JCD 2012
Lumbar
spine
BMD
Femoral
neck BMD
Lumbar
spine TBS
Age -0.26 -0.40 -0.31
Height +0.21 +0.27 -0.10
Weight +0.36 +0.40 -0.18
BMI +0.29 +0.32 -0.15
Lumbar spine BMD -- +0.68 +0.33
Femoral neck BMD +0.68 -- +0.27
Lumbar spine TBS +0.33 +0.27 --

Why the BUZZ
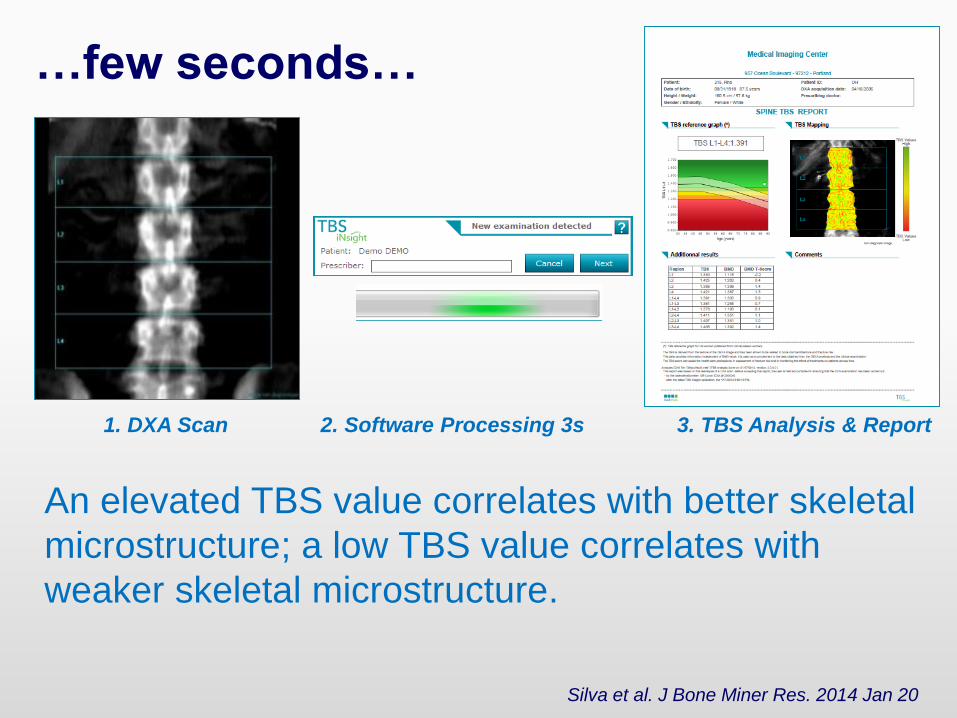
1. DXA Scan 2. Software Processing 3s 3. TBS Analysis & Report
An elevated TBS value correlates with better skeletal
microstructure; a low TBS value correlates with
weaker skeletal microstructure.
Silva et al. J Bone Miner Res. 2014 Jan 20
…few seconds…
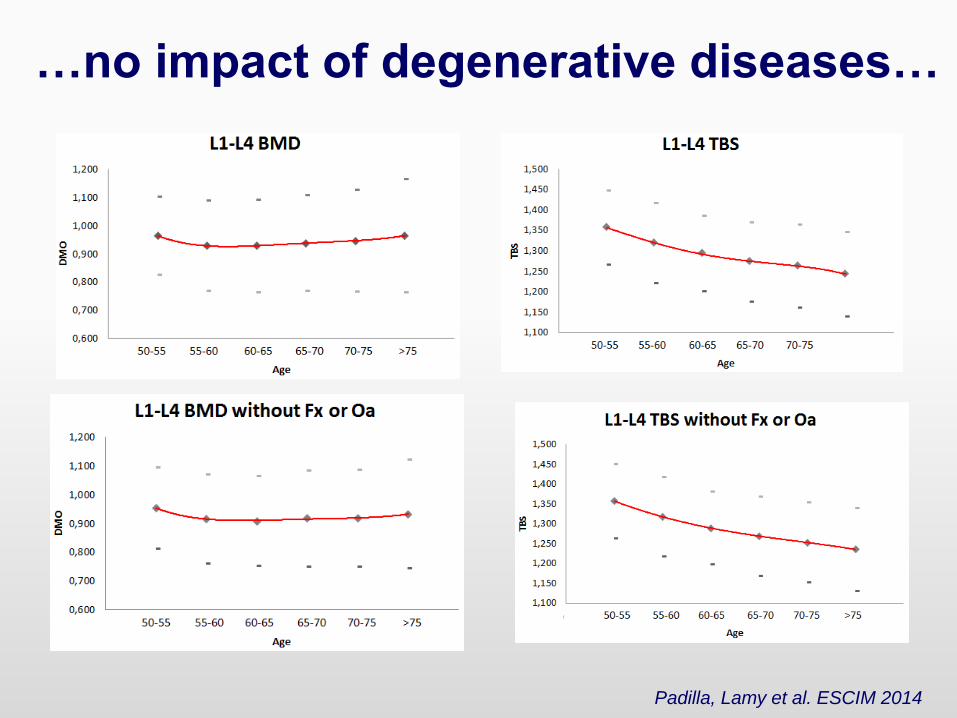
…no impact of degenerative diseases…
Padilla, Lamy et al. ESCIM 2014
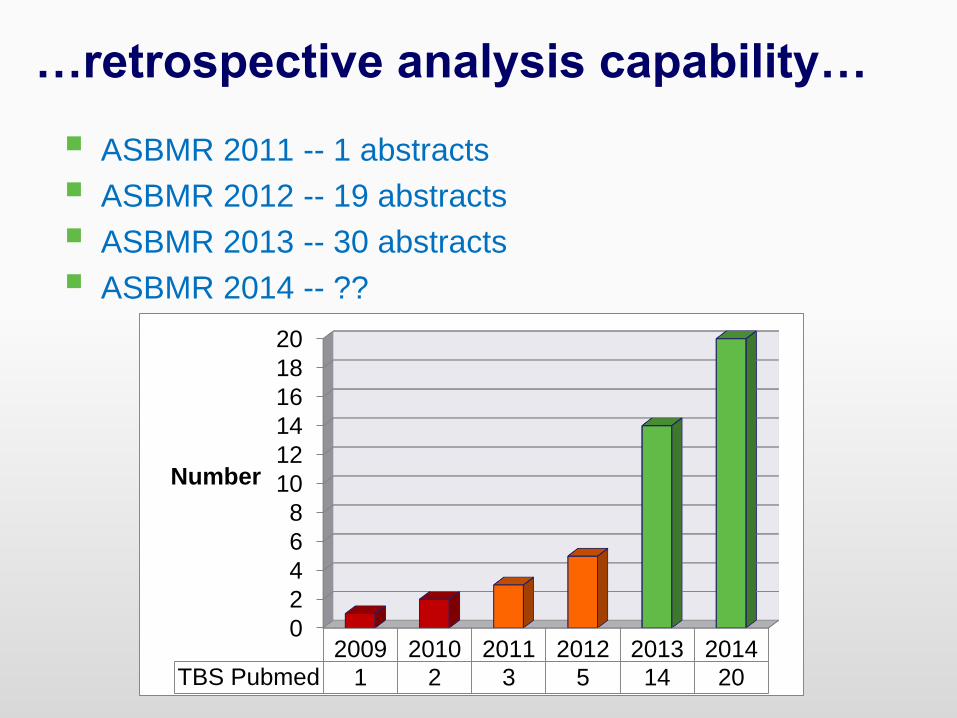
…retrospective analysis capability…
ASBMR 2011 -- 1 abstracts
ASBMR 2012 -- 19 abstracts
ASBMR 2013 -- 30 abstracts
ASBMR 2014 -- ??
0
2
4
6
8
10
12
14
16
18
20
2009 2010 2011 2012 2013 2014TBS Pubmed 1 2 3 5 14 20
Number
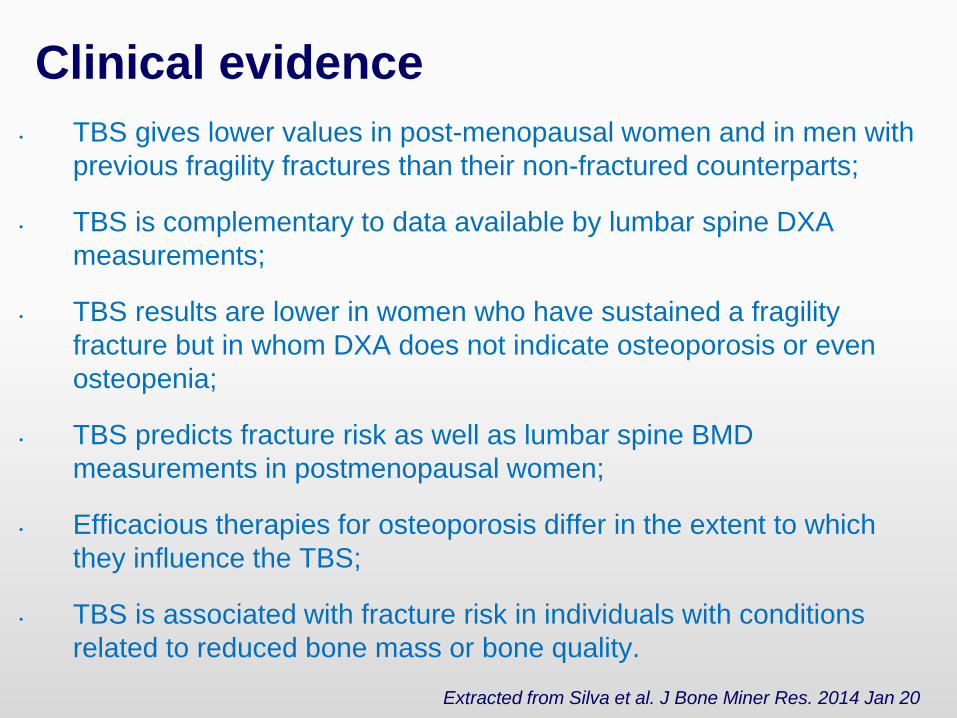
Clinical evidence
• TBS gives lower values in post-menopausal women and in men with
previous fragility fractures than their non-fractured counterparts;
• TBS is complementary to data available by lumbar spine DXA
measurements;
• TBS results are lower in women who have sustained a fragility
fracture but in whom DXA does not indicate osteoporosis or even
osteopenia;
• TBS predicts fracture risk as well as lumbar spine BMD
measurements in postmenopausal women;
• Efficacious therapies for osteoporosis differ in the extent to which
they influence the TBS;
• TBS is associated with fracture risk in individuals with conditions
related to reduced bone mass or bone quality.
Extracted from Silva et al. J Bone Miner Res. 2014 Jan 20
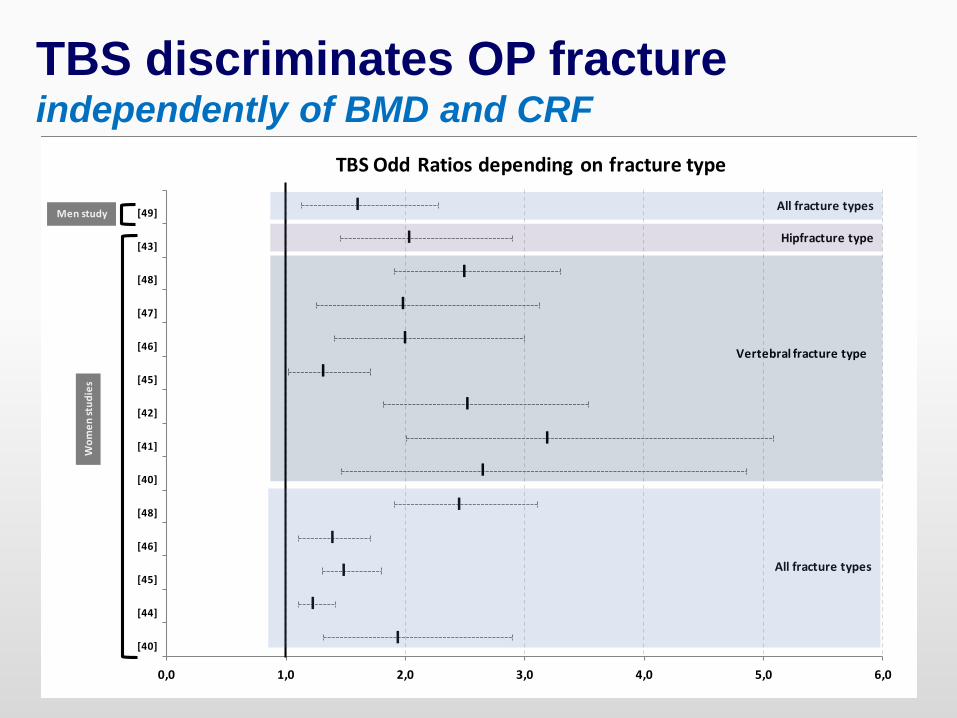
TBS Has a High Fracture
Discrimination Ability in Complement
of BMD in Both Women and Men
0,0 1,0 2,0 3,0 4,0 5,0 6,0
[40]
[44]
[45]
[46]
[48]
[40]
[41]
[42]
[45]
[46]
[47]
[48]
[43]
[49]
TBS Odd Ratios depending on fracture type
I
I
I
I
I
I
I
I
I
I
I
I
I
I
Wo
me
nst
ud
ies
Men study
All fracture types
All fracture types
Vertebral fracture type
Hipfracture type
TBS discriminates OP fractureindependently of BMD and CRF
TBS Can Predict Fractures
Independently and in Conjunction
with BMD
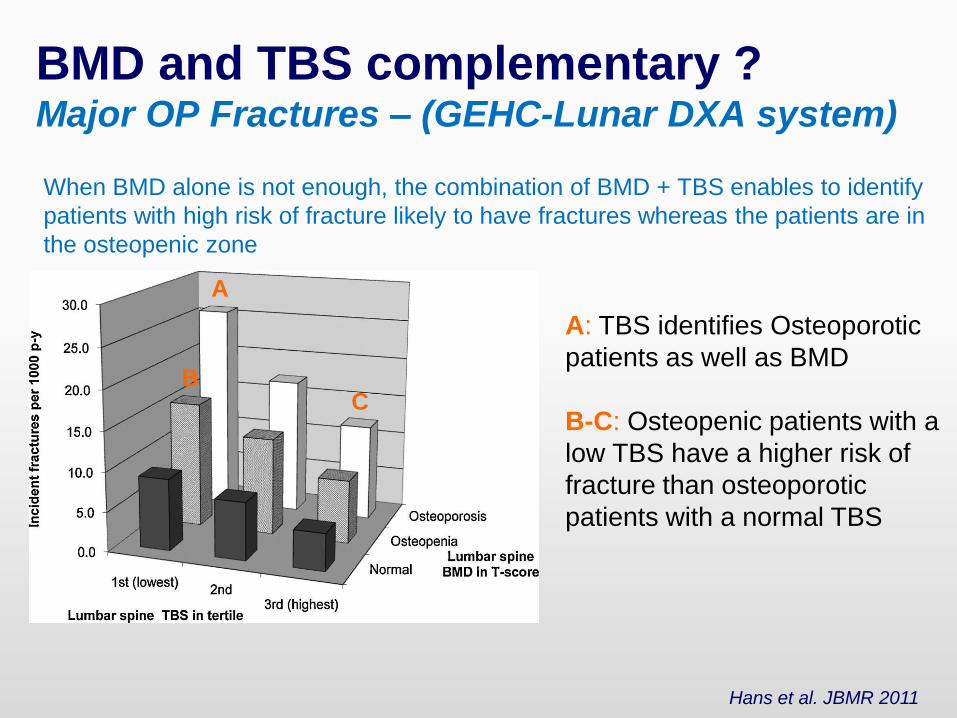
When BMD alone is not enough, the combination of BMD + TBS enables to identify
patients with high risk of fracture likely to have fractures whereas the patients are in
the osteopenic zone
BMD and TBS complementary ?Major OP Fractures – (GEHC-Lunar DXA system)
Hans et al. JBMR 2011
A: TBS identifies Osteoporotic
patients as well as BMD
B-C: Osteopenic patients with a
low TBS have a higher risk of
fracture than osteoporotic
patients with a normal TBS
A
BC
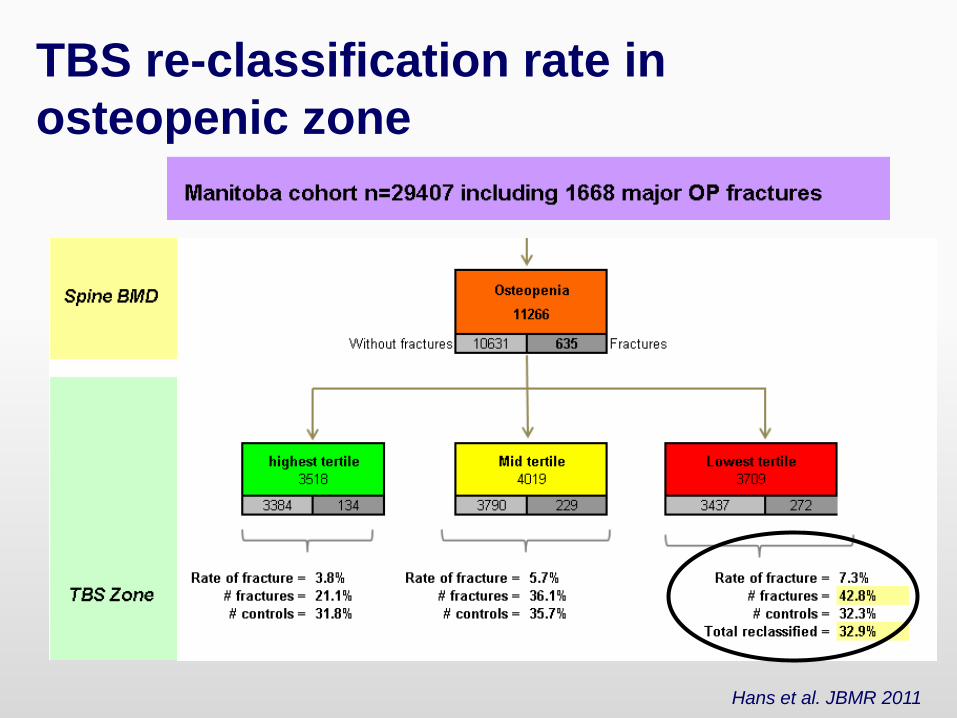
TBS re-classification rate in
osteopenic zone
Hans et al. JBMR 2011
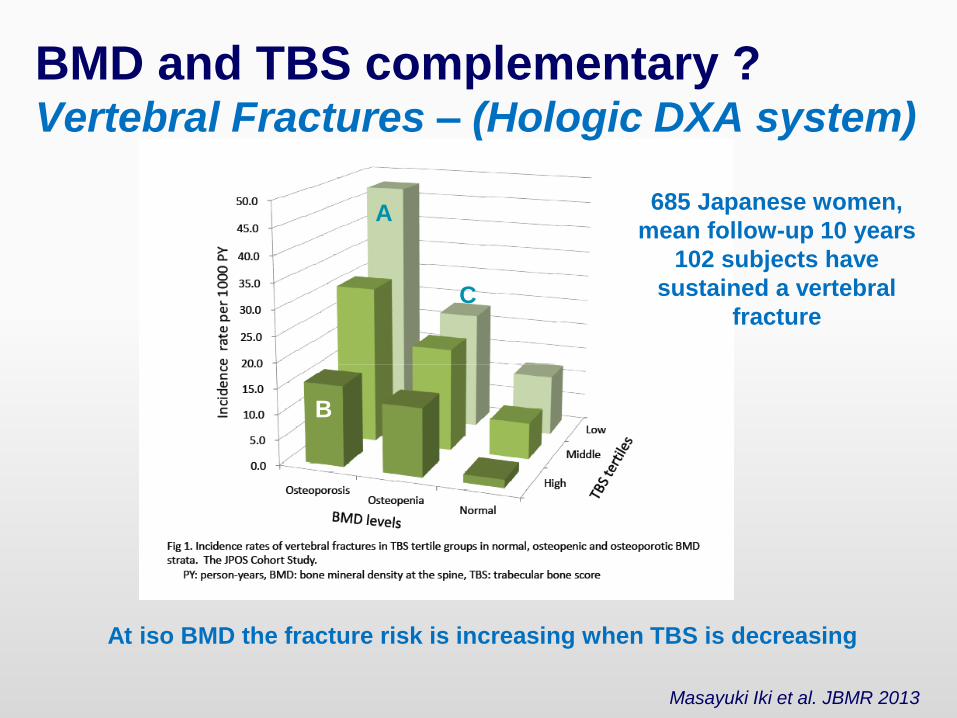
At iso BMD the fracture risk is increasing when TBS is decreasing
A
B
C
685 Japanese women,
mean follow-up 10 years
102 subjects have
sustained a vertebral
fracture
Masayuki Iki et al. JBMR 2013
BMD and TBS complementary ?Vertebral Fractures – (Hologic DXA system)
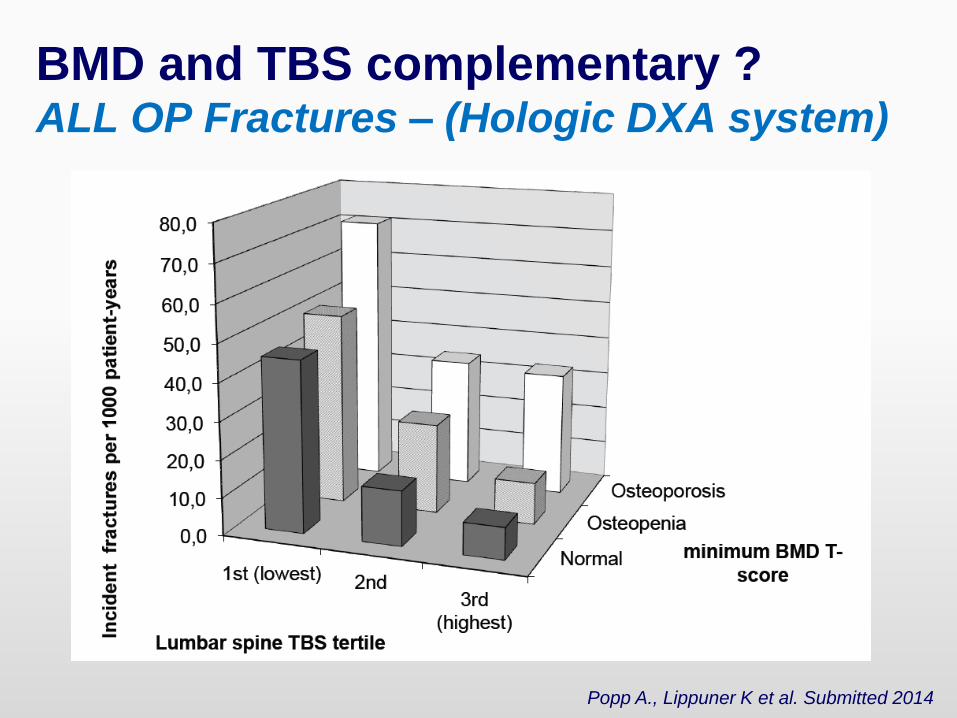
Popp A., Lippuner K et al. Submitted 2014
BMD and TBS complementary ?ALL OP Fractures – (Hologic DXA system)
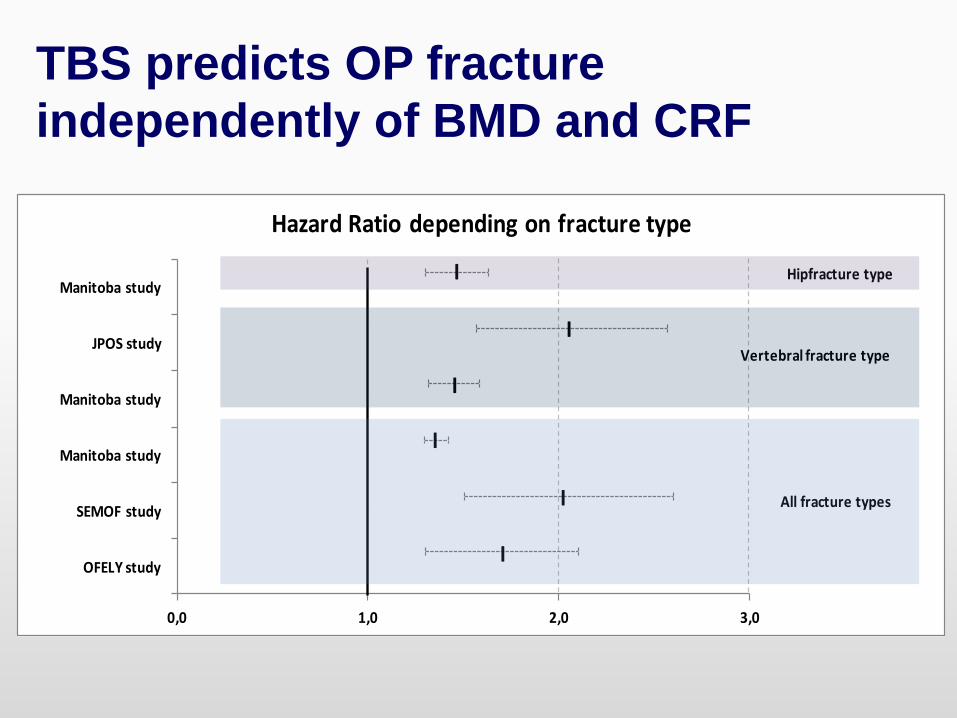
0,0 1,0 2,0 3,0
OFELY study
SEMOF study
Manitoba study
Manitoba study
JPOS study
Manitoba study
Hazard Ratio depending on fracture type
I
I
I
I
I
I
All fracture types
Hipfracture type
Vertebral fracture type
TBS predicts OP fracture
independently of BMD and CRF
TBS can be used to monitor changes
across time and particularly for
treatments follow-up.
Differential effect upon the molecule
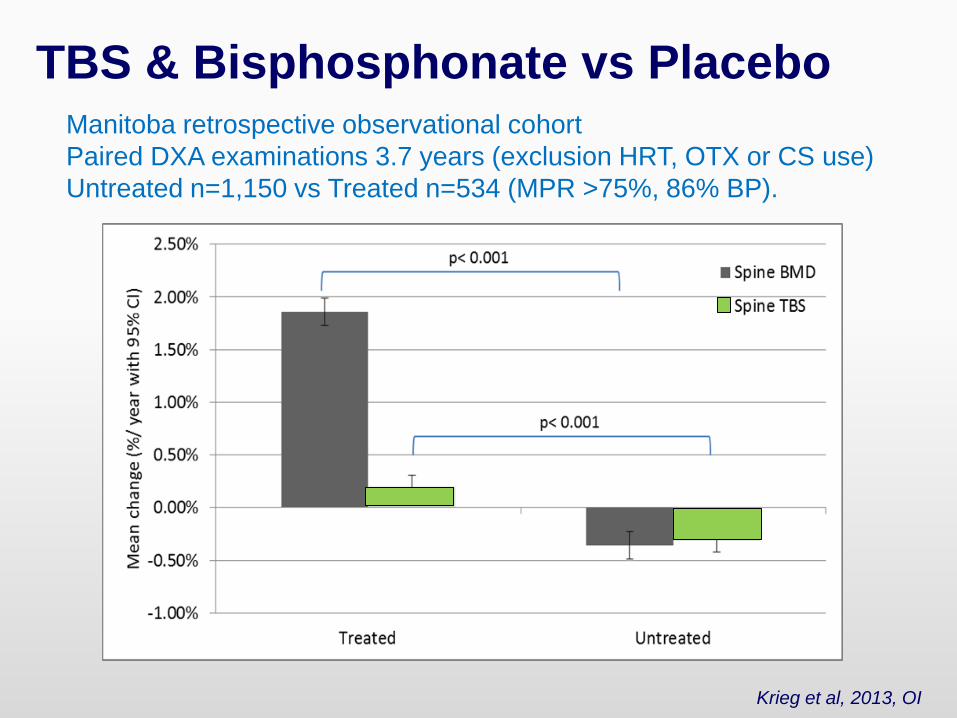
Manitoba retrospective observational cohort
Paired DXA examinations 3.7 years (exclusion HRT, OTX or CS use)
Untreated n=1,150 vs Treated n=534 (MPR >75%, 86% BP).
TBS & Bisphosphonate vs Placebo
Krieg et al, 2013, OI
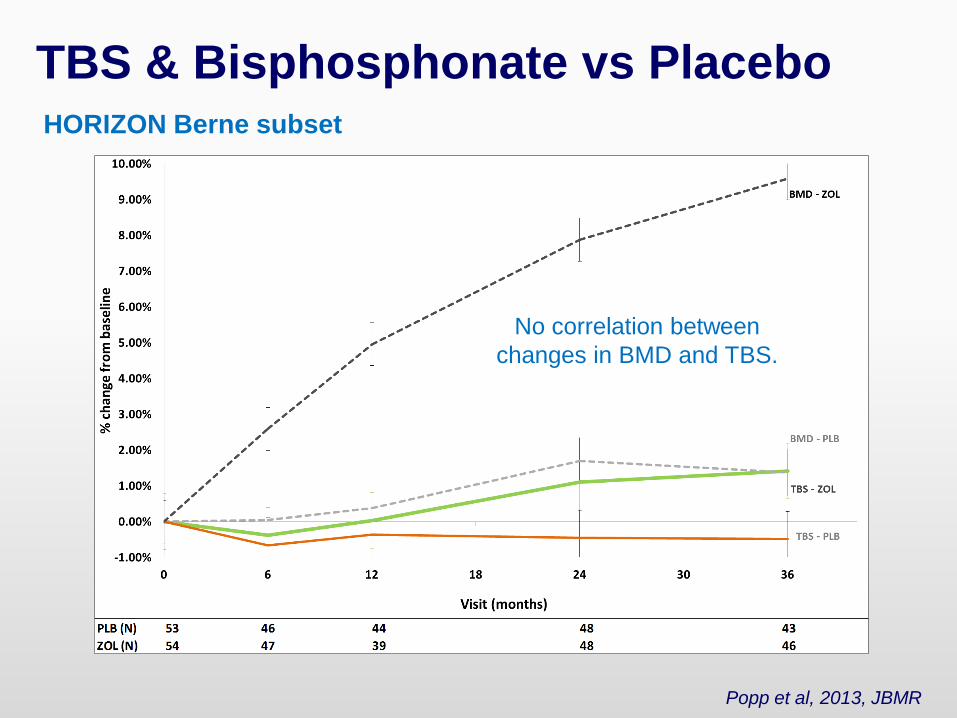
HORIZON Berne subset
TBS & Bisphosphonate vs Placebo
Popp et al, 2013, JBMR
No correlation between
changes in BMD and TBS.
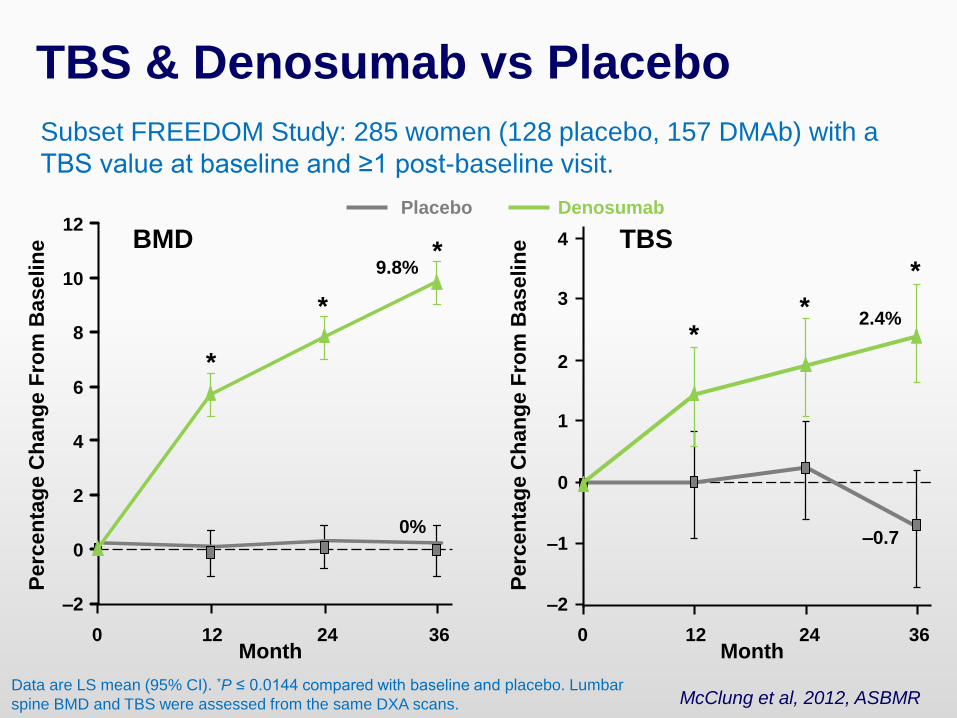
Subset FREEDOM Study: 285 women (128 placebo, 157 DMAb) with a
TBS value at baseline and ≥1 post-baseline visit.
TBS & Denosumab vs Placebo
McClung et al, 2012, ASBMR
Month
Perc
en
tag
e C
han
ge F
rom
Baselin
e
Data are LS mean (95% CI). *P ≤ 0.0144 compared with baseline and placebo. Lumbar
spine BMD and TBS were assessed from the same DXA scans.
0
2
4
6
8
10
12
–2
0 12 24 36Month
Perc
en
tag
e C
han
ge F
rom
Baselin
e
*
*
*9.8%
0%
BMD
–2
0
2
4
0
3
1
–1
12 24 36
2.4%
–0.7
*
*
TBS
DenosumabPlacebo
*
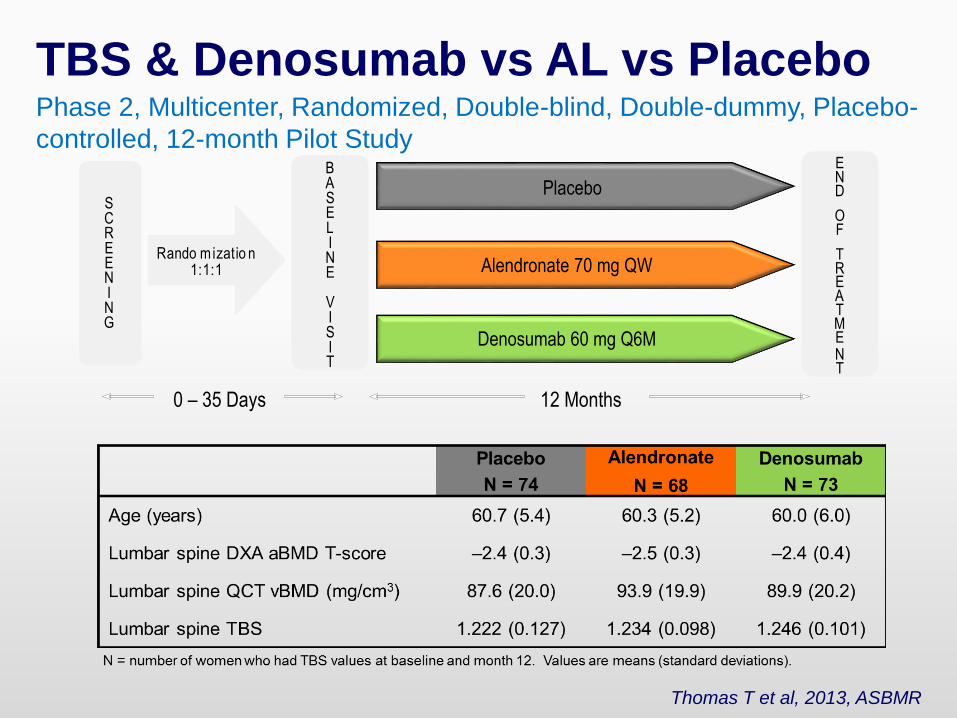
Phase 2, Multicenter, Randomized, Double-blind, Double-dummy, Placebo-
controlled, 12-month Pilot Study
SCREENING
Denosumab 60 mg Q6M
BASELINE
VISIT
Alendronate 70 mg QWRando mizatio n
1:1:1
Placebo
0 – 35 Days
END
OF
TREATMENT
12 Months
TBS & Denosumab vs AL vs Placebo
Thomas T et al, 2013, ASBMR
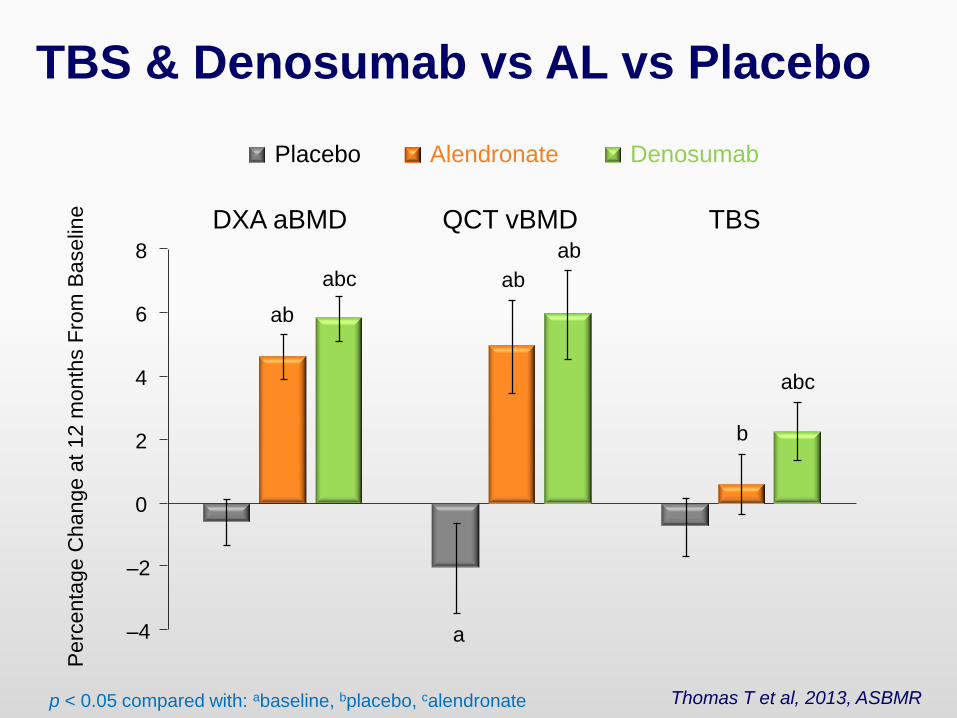
ab
abc
DXA aBMD
p < 0.05 compared with: abaseline, bplacebo, calendronate
–4
–2
0
2
4
6
8
Placebo Alendronate Denosumab
ab
ab
a
QCT vBMD
b
abc
TBS
Perc
enta
ge C
hange a
t 12 m
on
ths F
rom
Baselin
eTBS & Denosumab vs AL vs Placebo
Thomas T et al, 2013, ASBMR
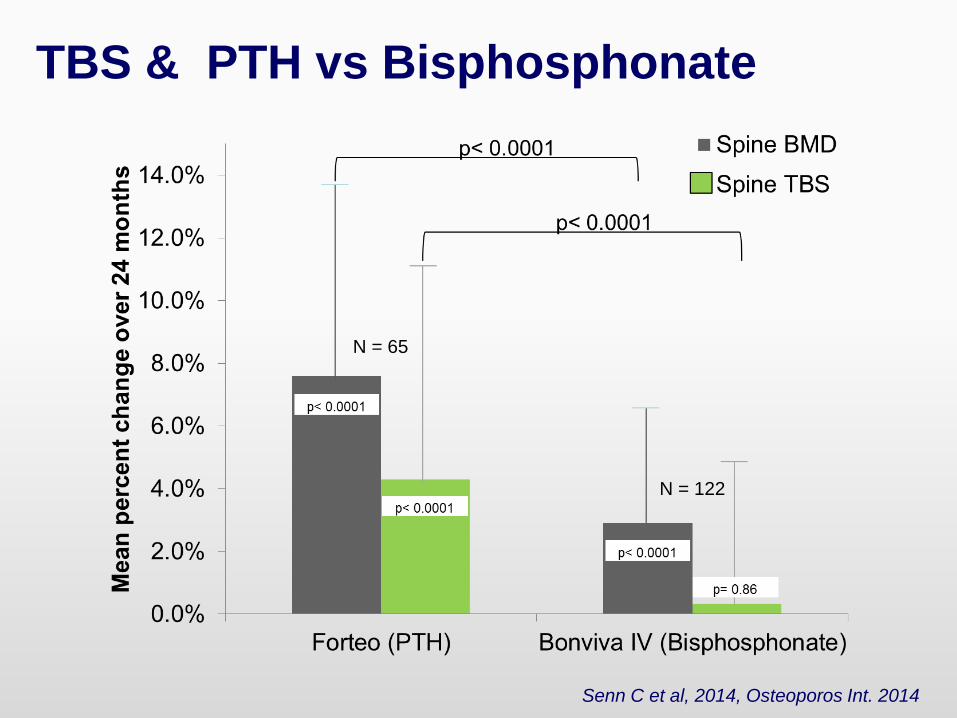
TBS & PTH vs Bisphosphonate
Senn C et al, 2014, Osteoporos Int. 2014
N = 65
N = 122
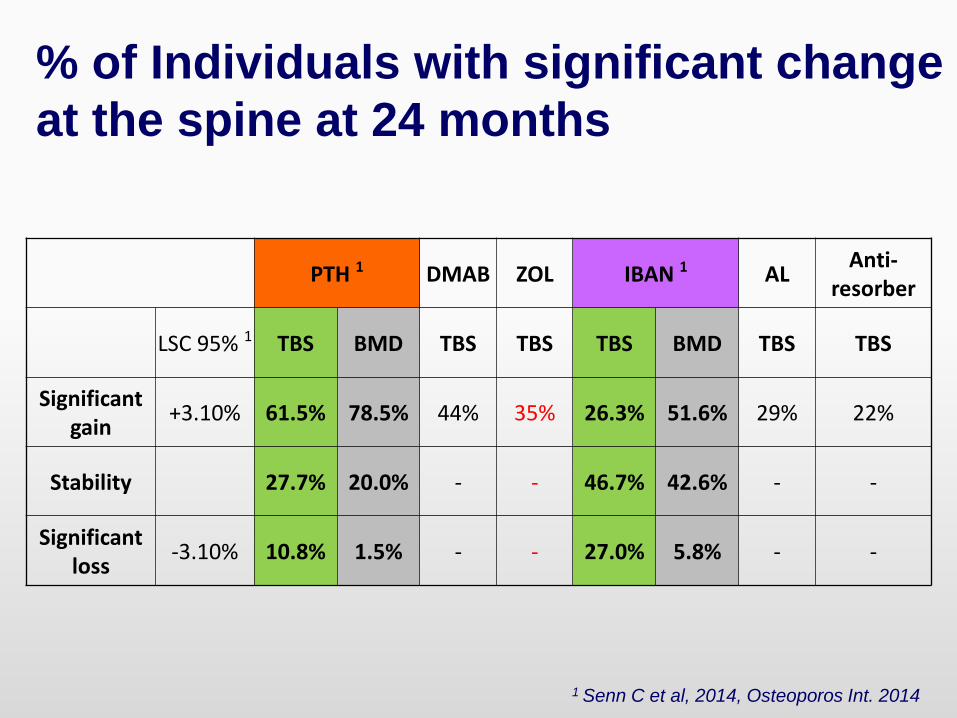
% of Individuals with significant change
at the spine at 24 months
PTH 1 DMAB ZOL IBAN 1 ALAnti-
resorber
LSC 95% 1 TBS BMD TBS TBS TBS BMD TBS TBS
Significantgain
+3.10% 61.5% 78.5% 44% 35% 26.3% 51.6% 29% 22%
Stability 27.7% 20.0% - - 46.7% 42.6% - -
Significantloss
-3.10% 10.8% 1.5% - - 27.0% 5.8% - -
1 Senn C et al, 2014, Osteoporos Int. 2014
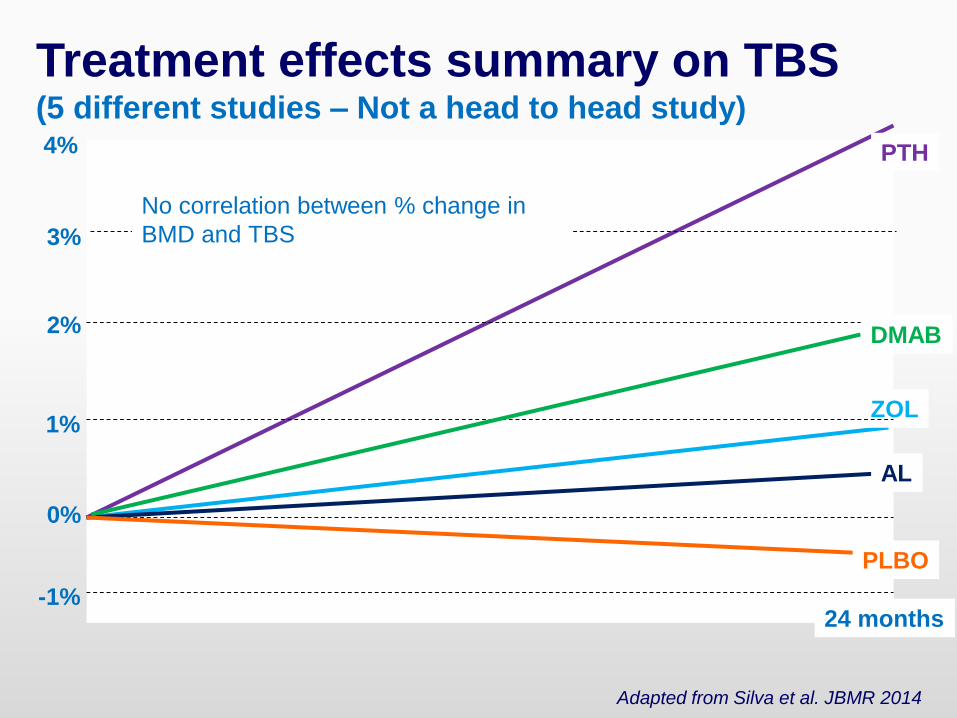
Treatment effects summary on TBS(5 different studies – Not a head to head study)
PTH
ZOL
AL
PLBO
0%
24 months
1%
4%
3%
2%
-1%
No correlation between % change in
BMD and TBS
DMAB
Adapted from Silva et al. JBMR 2014
TBS High Added Value in Case
of Secondary osteoporosis
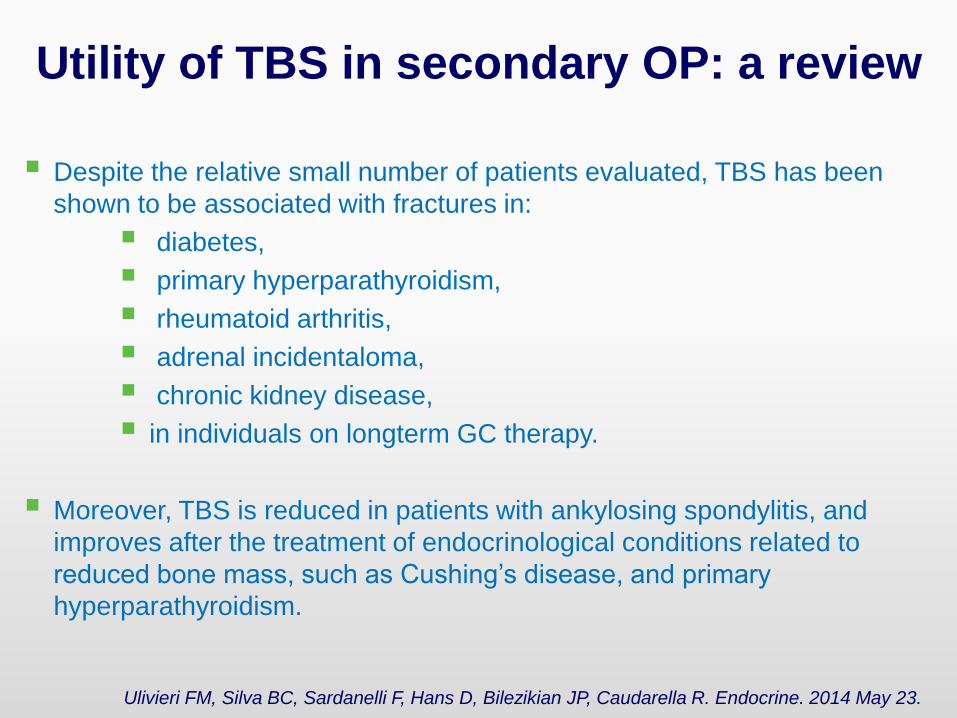
Utility of TBS in secondary OP: a review
Despite the relative small number of patients evaluated, TBS has been
shown to be associated with fractures in:
diabetes,
primary hyperparathyroidism,
rheumatoid arthritis,
adrenal incidentaloma,
chronic kidney disease,
in individuals on longterm GC therapy.
Moreover, TBS is reduced in patients with ankylosing spondylitis, and
improves after the treatment of endocrinological conditions related to
reduced bone mass, such as Cushing’s disease, and primary
hyperparathyroidism.
Ulivieri FM, Silva BC, Sardanelli F, Hans D, Bilezikian JP, Caudarella R. Endocrine. 2014 May 23.
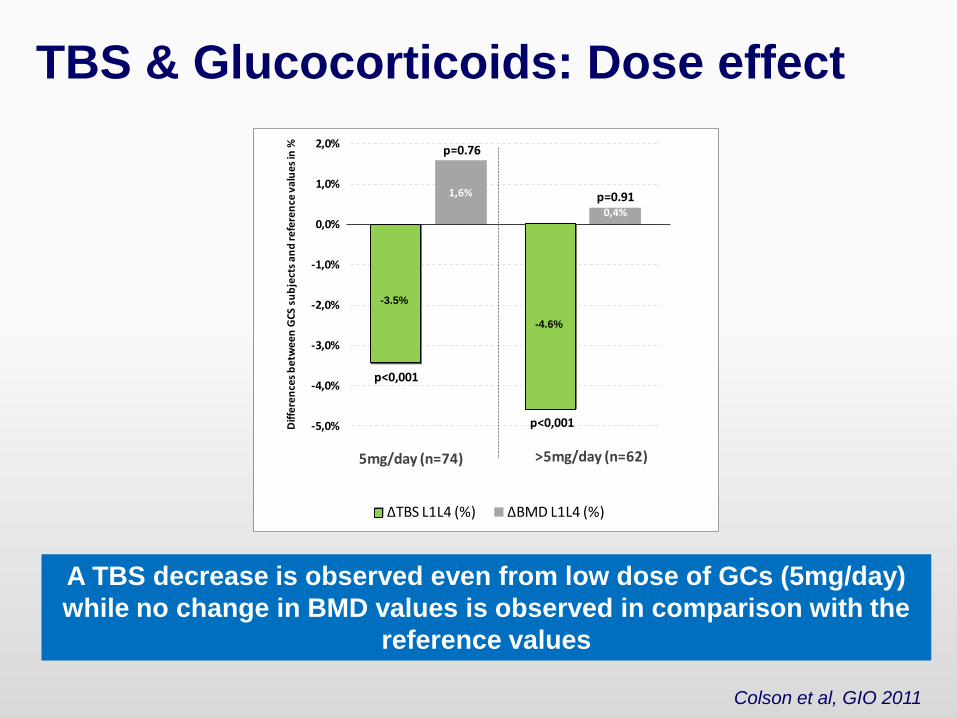
A TBS decrease is observed even from low dose of GCs (5mg/day)
while no change in BMD values is observed in comparison with the
reference values
TBS & Glucocorticoids: Dose effect
Colson et al, GIO 2011
-3,5%
-4,6%
1,6%
0,4%
-5,0%
-4,0%
-3,0%
-2,0%
-1,0%
0,0%
1,0%
2,0%
Diff
ere
nce
s b
etw
ee
n G
CS
su
bje
cts
an
d re
fere
nce
va
lue
s in
%
ΔTBS L1L4 (%) ΔBMD L1L4 (%)
5mg/day (n=74) >5mg/day (n=62)
p=0.76
p=0.91
p<0,001
p<0,001
-3.5%
-4.6%
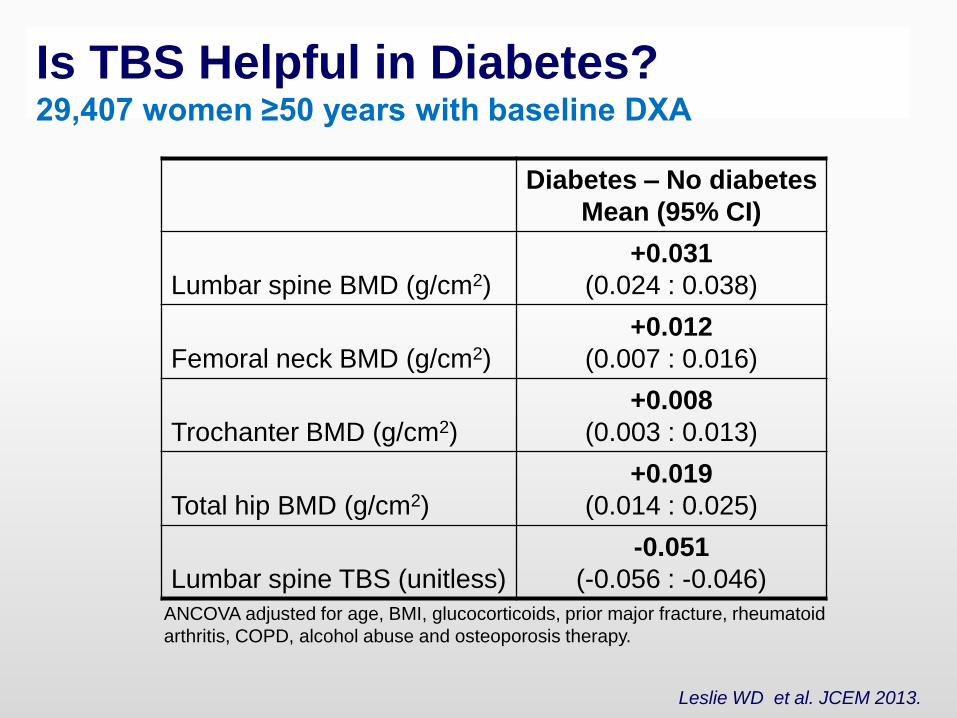
Is TBS Helpful in Diabetes?29,407 women ≥50 years with baseline DXA
Diabetes – No diabetes
Mean (95% CI)
Lumbar spine BMD (g/cm2)
+0.031
(0.024 : 0.038)
Femoral neck BMD (g/cm2)
+0.012
(0.007 : 0.016)
Trochanter BMD (g/cm2)
+0.008
(0.003 : 0.013)
Total hip BMD (g/cm2)
+0.019
(0.014 : 0.025)
Lumbar spine TBS (unitless)
-0.051
(-0.056 : -0.046)
ANCOVA adjusted for age, BMI, glucocorticoids, prior major fracture, rheumatoid
arthritis, COPD, alcohol abuse and osteoporosis therapy.
Leslie WD et al. JCEM 2013.
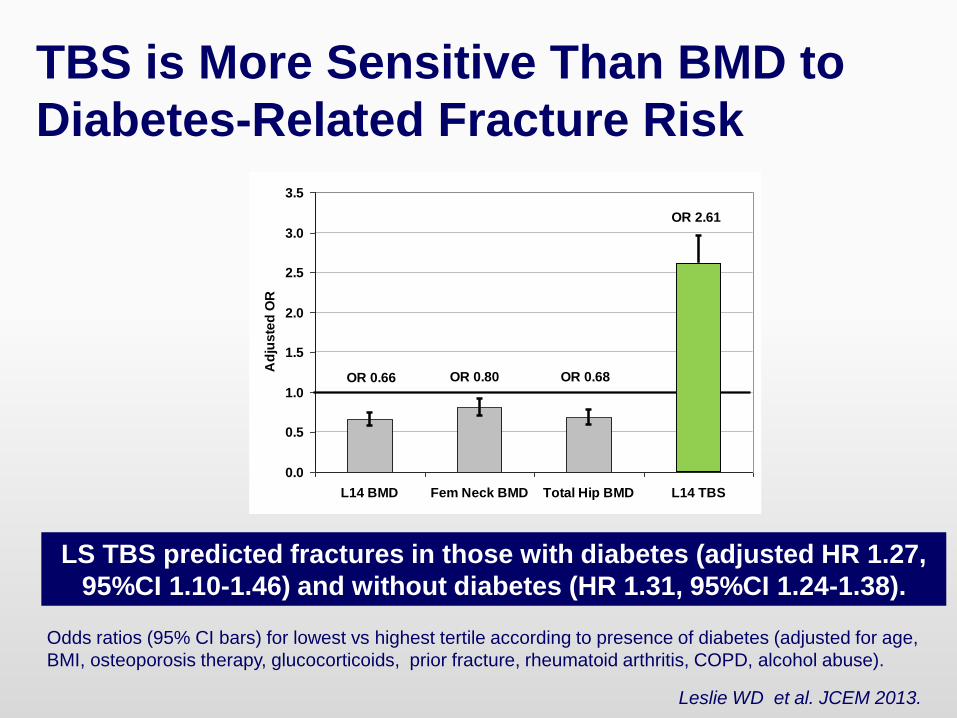
TBS is More Sensitive Than BMD to
Diabetes-Related Fracture Risk
Odds ratios (95% CI bars) for lowest vs highest tertile according to presence of diabetes (adjusted for age,
BMI, osteoporosis therapy, glucocorticoids, prior fracture, rheumatoid arthritis, COPD, alcohol abuse).
LS TBS predicted fractures in those with diabetes (adjusted HR 1.27,
95%CI 1.10-1.46) and without diabetes (HR 1.31, 95%CI 1.24-1.38).
OR 0.66
OR 2.61
OR 0.68OR 0.80
0.0
0.5
1.0
1.5
2.0
2.5
3.0
3.5
L14 BMD Fem Neck BMD Total Hip BMD L14 TBS
Ad
jus
ted
OR
Leslie WD et al. JCEM 2013.
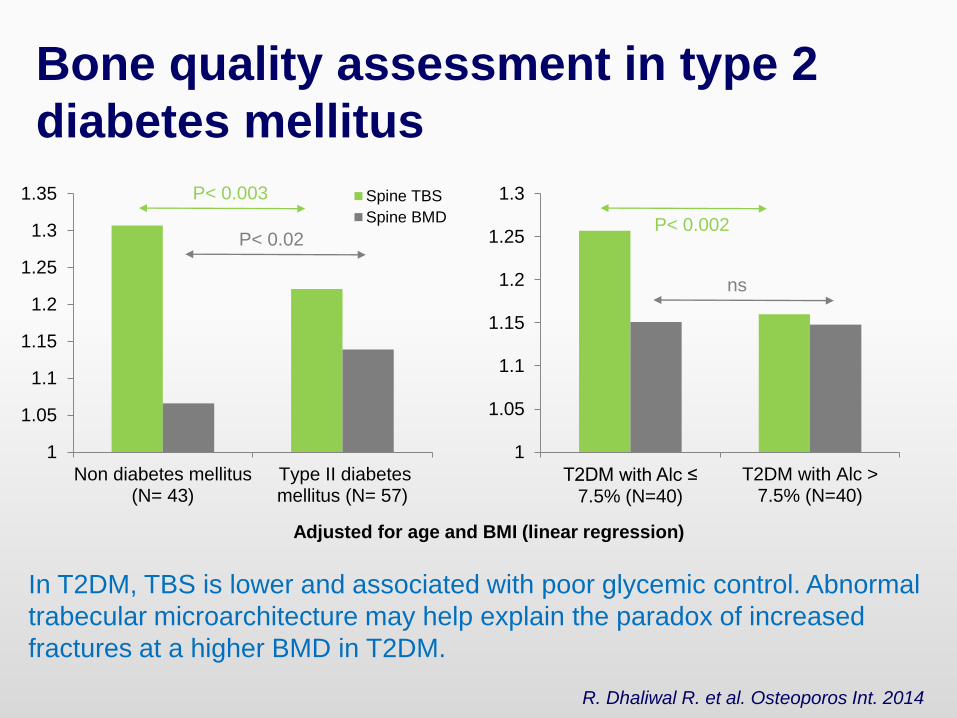
Bone quality assessment in type 2
diabetes mellitus
In T2DM, TBS is lower and associated with poor glycemic control. Abnormal
trabecular microarchitecture may help explain the paradox of increased
fractures at a higher BMD in T2DM.
R. Dhaliwal R. et al. Osteoporos Int. 2014
1
1.05
1.1
1.15
1.2
1.25
1.3
1.35
Non diabetes mellitus(N= 43)
Type II diabetesmellitus (N= 57)
Spine TBS
Spine BMD
1
1.05
1.1
1.15
1.2
1.25
1.3
T2DM with Alc ≤ 7.5% (N=40)
T2DM with Alc >7.5% (N=40)
P< 0.002
ns
P< 0.003
P< 0.02
Adjusted for age and BMI (linear regression)
How to use TBS in Clinical
Routine
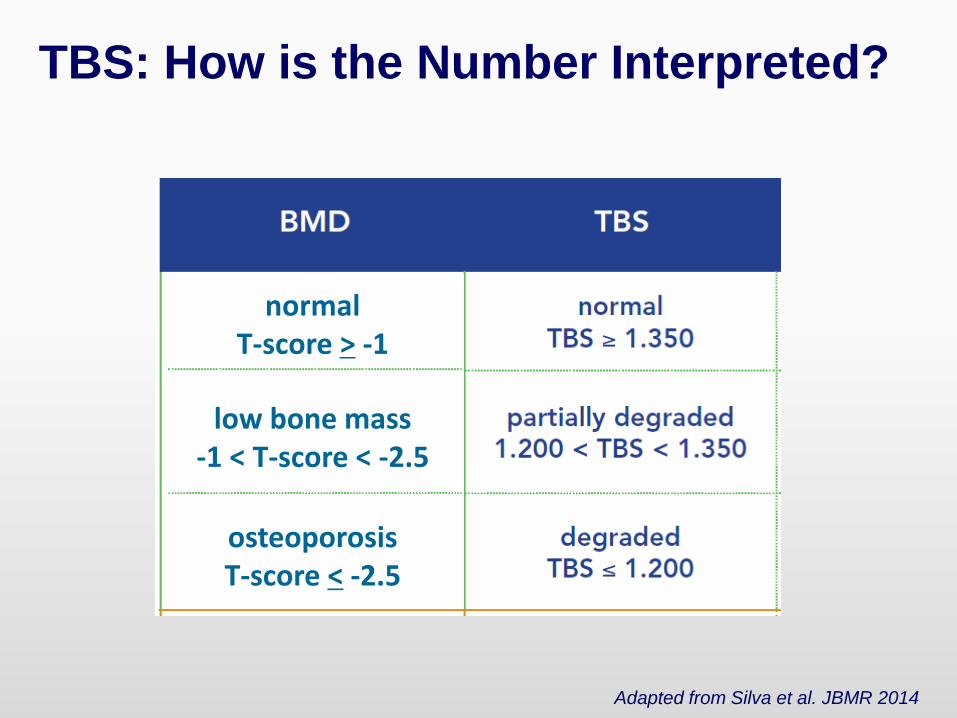
TBS: How is the Number Interpreted?
normalT-score > -1
osteoporosisT-score < -2.5
low bone mass-1 < T-score < -2.5
Adapted from Silva et al. JBMR 2014
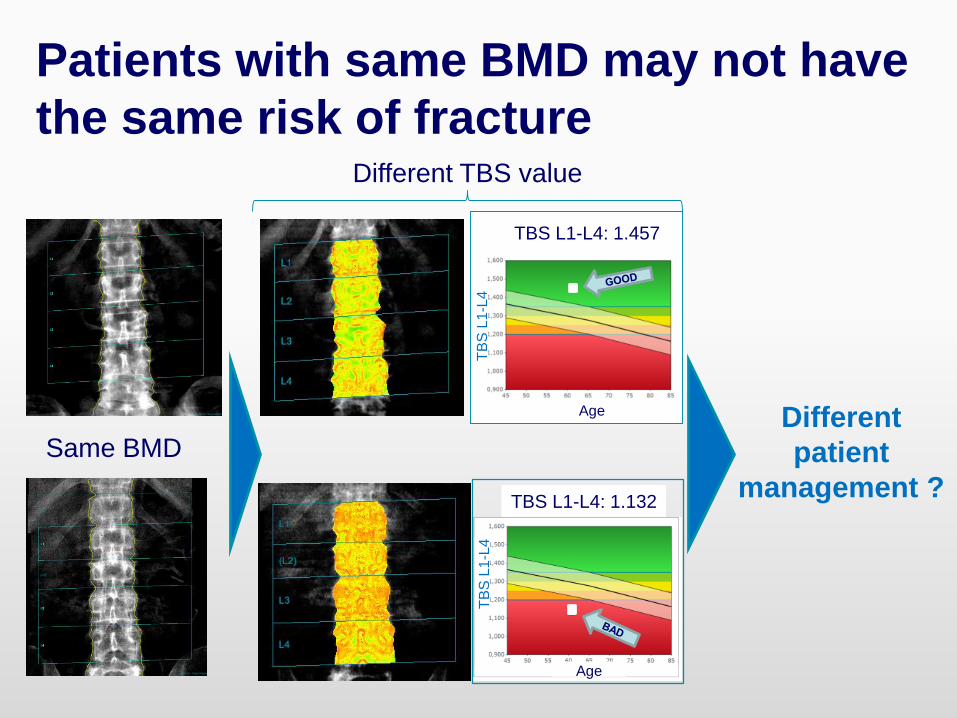
Patients with same BMD may not have
the same risk of fractureDifferent TBS value
TBS L1-L4: 1.457
TBS L1-L4: 1.132
Age
Age
TB
S L
1-L
4T
BS
L1-L
4
Same BMDDifferent
patient
management ?
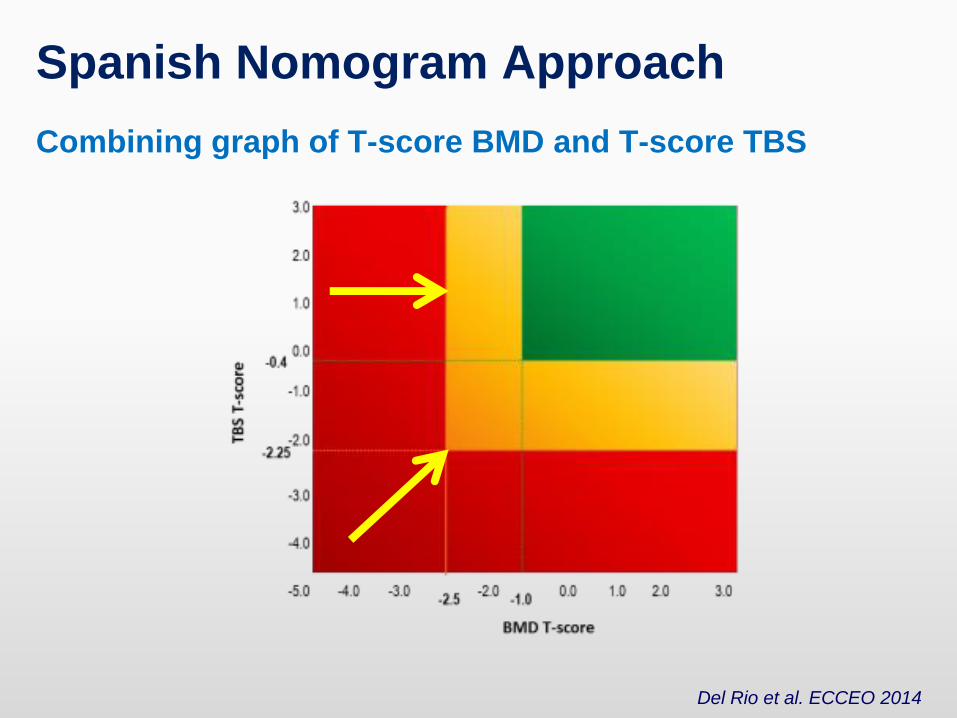
Spanish Nomogram Approach
Combining graph of T-score BMD and T-score TBS
Del Rio et al. ECCEO 2014
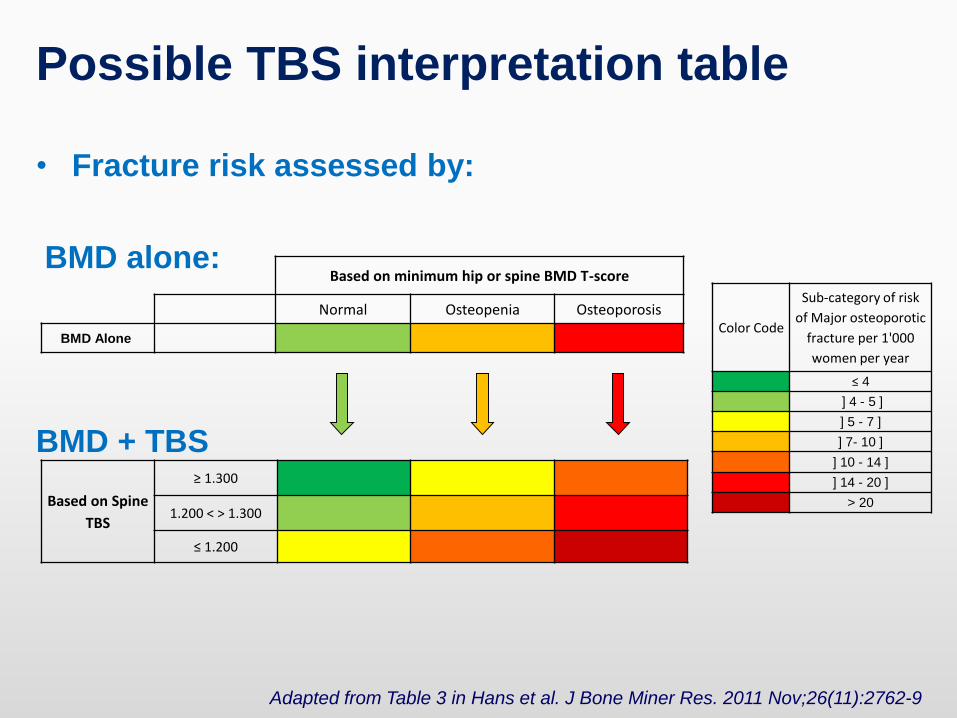
Possible TBS interpretation table
• Fracture risk assessed by:
BMD alone:
BMD + TBS
Based on Spine
TBS
≥ 1.300
1.200 < > 1.300
≤ 1.200
Based on minimum hip or spine BMD T-score
Normal Osteopenia Osteoporosis
BMD AloneColor Code
Sub-category of risk
of Major osteoporotic
fracture per 1'000
women per year
≤ 4
] 4 - 5 ]
] 5 - 7 ]
] 7- 10 ]
] 10 - 14 ]
] 14 - 20 ]
> 20
Adapted from Table 3 in Hans et al. J Bone Miner Res. 2011 Nov;26(11):2762-9
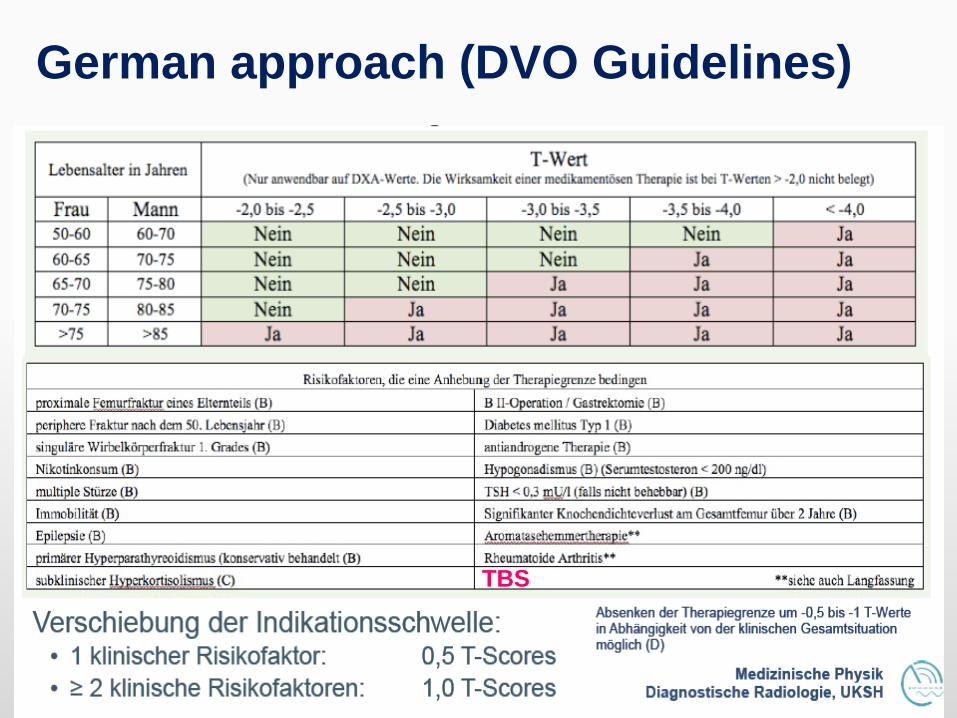
German approach (DVO Guidelines)
TBS
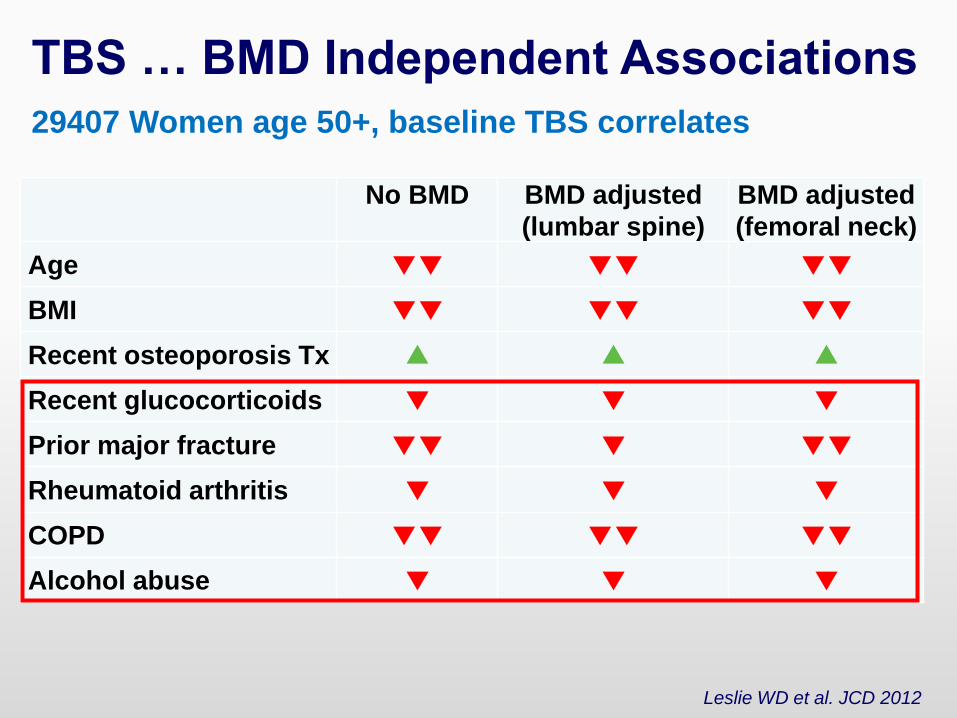
TBS … BMD Independent Associations
29407 Women age 50+, baseline TBS correlates
Leslie WD et al. JCD 2012
No BMD BMD adjusted
(lumbar spine)
BMD adjusted
(femoral neck)
Age ▼▼ ▼▼ ▼▼
BMI ▼▼ ▼▼ ▼▼
Recent osteoporosis Tx ▲ ▲ ▲
Recent glucocorticoids ▼ ▼ ▼
Prior major fracture ▼▼ ▼ ▼▼
Rheumatoid arthritis ▼ ▼ ▼
COPD ▼▼ ▼▼ ▼▼
Alcohol abuse ▼ ▼ ▼
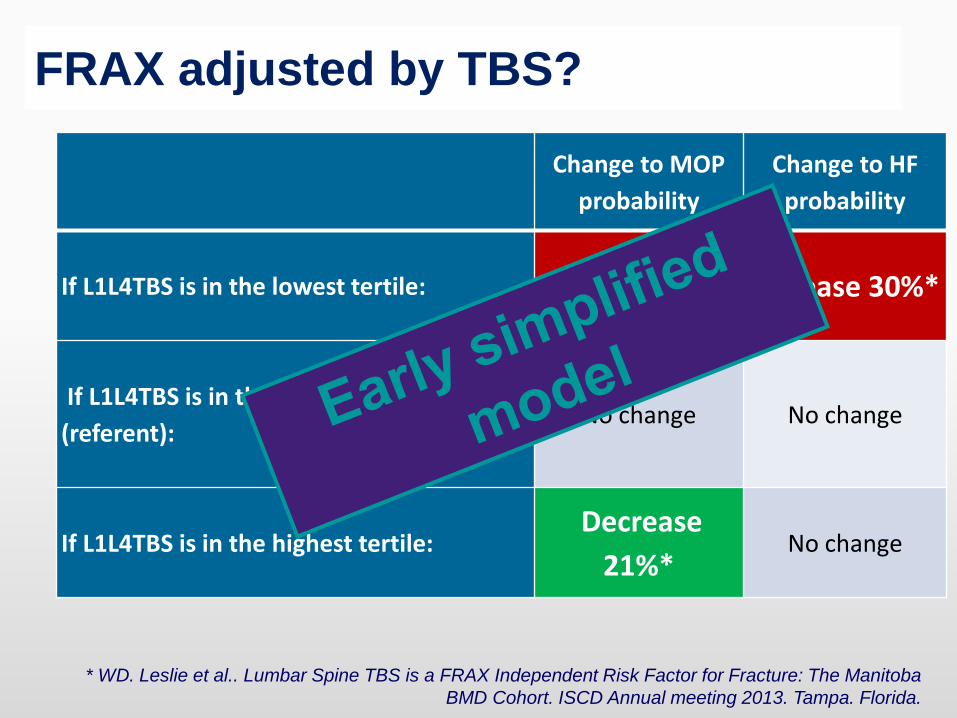
FRAX adjusted by TBS?
Change to MOP
probability
Change to HF
probability
If L1L4TBS is in the lowest tertile: Increase 25%* Increase 30%*
If L1L4TBS is in the middle tertile
(referent):No change No change
If L1L4TBS is in the highest tertile:Decrease
21%*No change
* WD. Leslie et al.. Lumbar Spine TBS is a FRAX Independent Risk Factor for Fracture: The Manitoba
BMD Cohort. ISCD Annual meeting 2013. Tampa. Florida.
IT
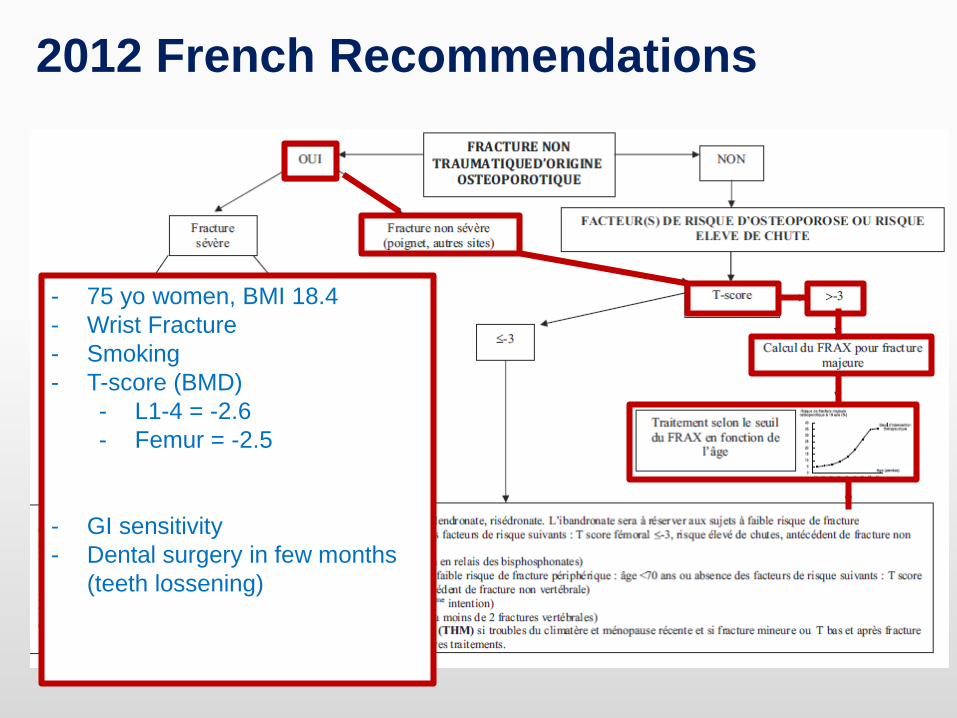
- 75 yo women, BMI 18.4
- Wrist Fracture
- Smoking
- T-score (BMD)
- L1-4 = -2.6
- Femur = -2.5
- GI sensitivity
- Dental surgery in few months
(teeth lossening)
2012 French Recommendations
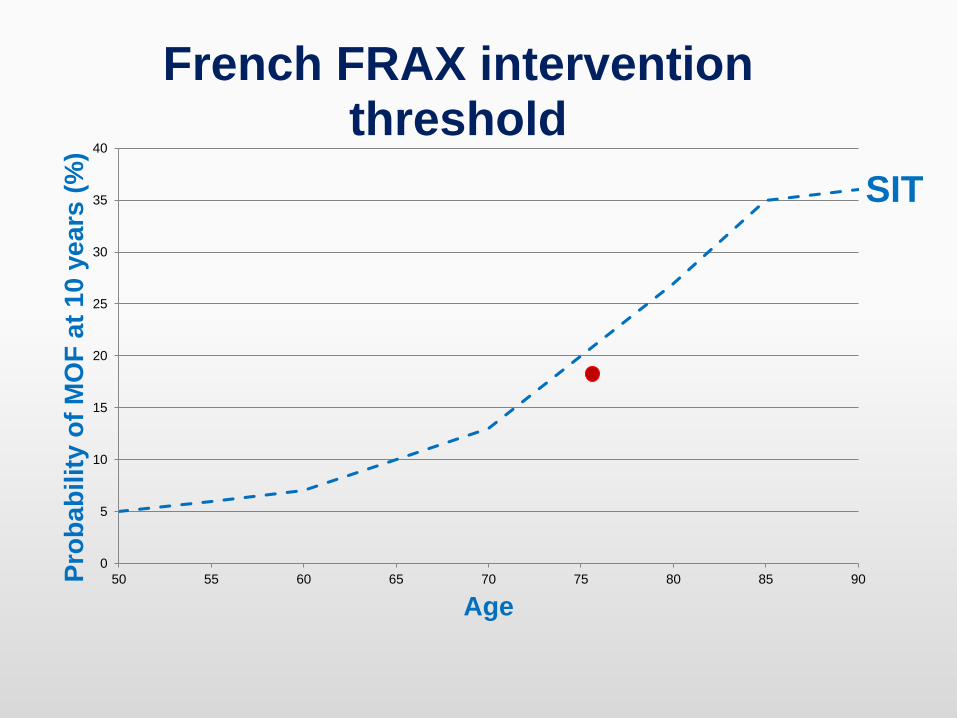
0
5
10
15
20
25
30
35
40
50 55 60 65 70 75 80 85 90Pro
ba
bilit
yo
f M
OF
at
10
ye
ars
(%)
Age
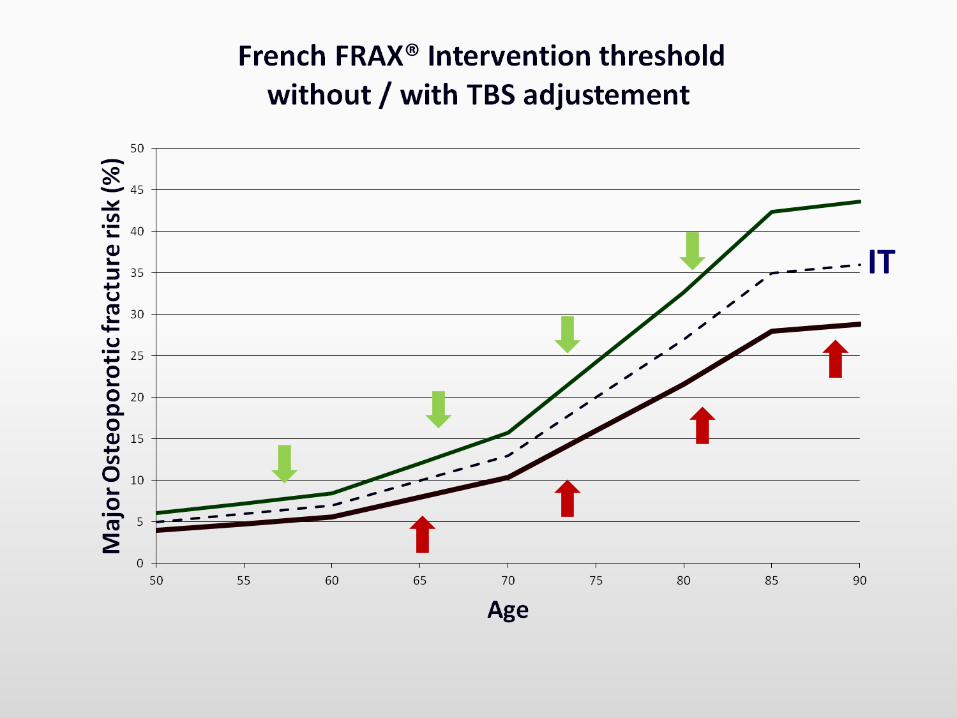
French FRAX intervention threshold
SIT
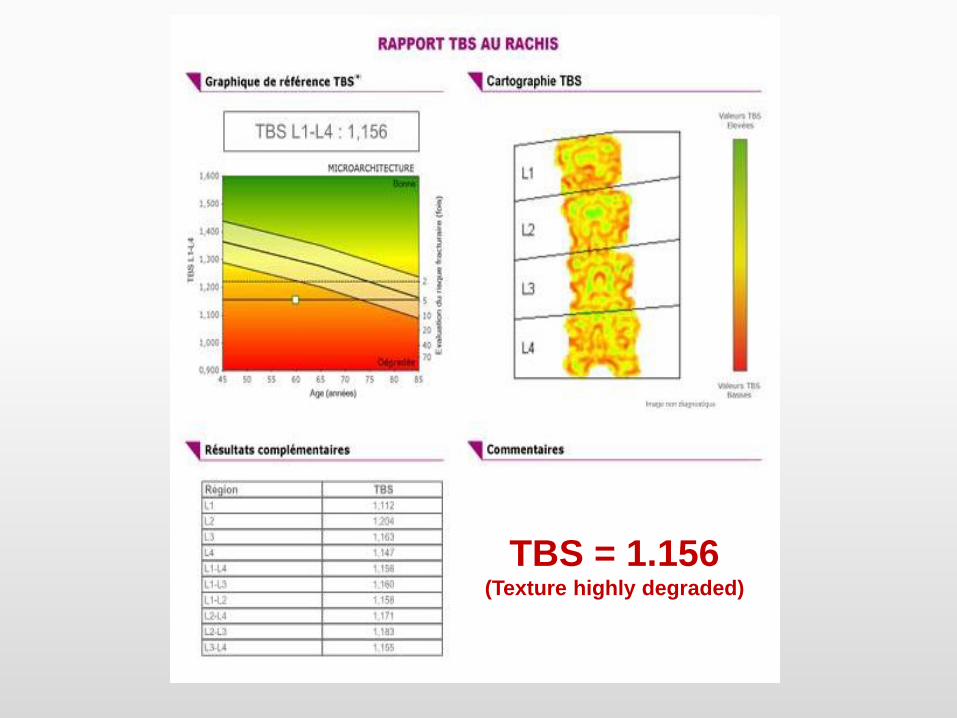
TBS = 1.156(Texture highly degraded)
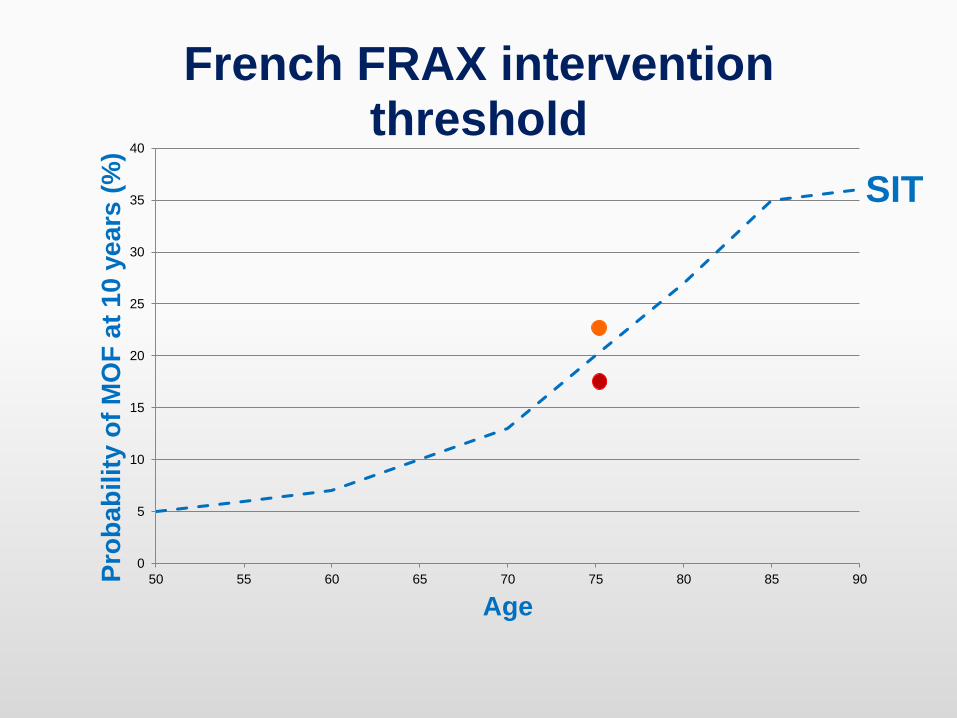
0
5
10
15
20
25
30
35
40
50 55 60 65 70 75 80 85 90Pro
ba
bilit
y o
f M
OF
at
10
ye
ars
(%
)
Age
French FRAX intervention threshold
SIT
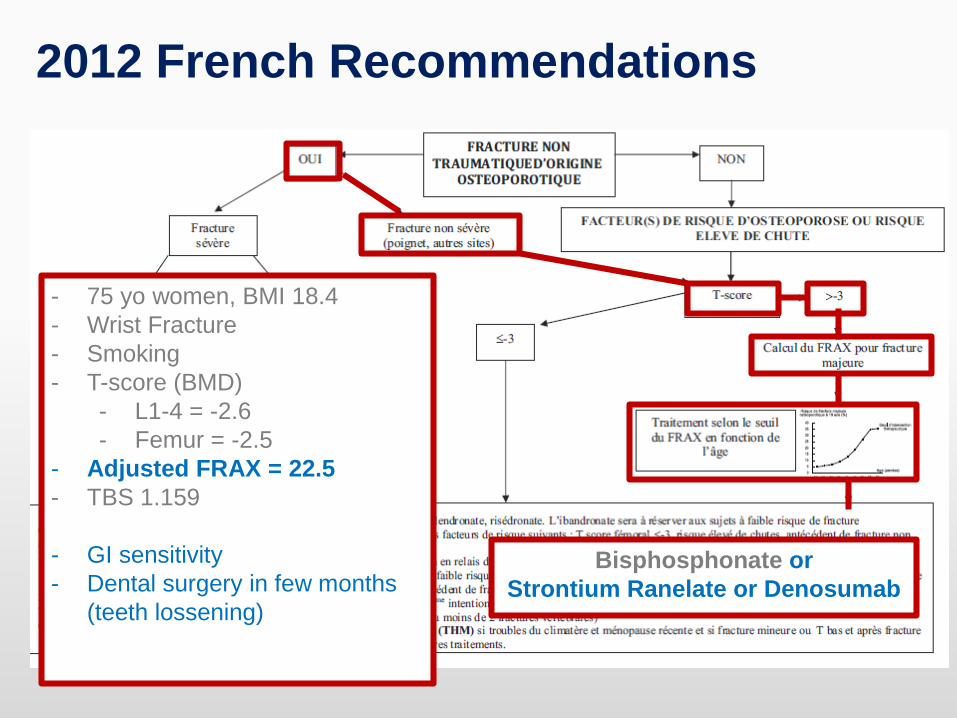
2012 French Recommendations
- 75 yo women, BMI 18.4
- Wrist Fracture
- Smoking
- T-score (BMD)
- L1-4 = -2.6
- Femur = -2.5
- Adjusted FRAX = 22.5
- TBS 1.159
- GI sensitivity
- Dental surgery in few months
(teeth lossening)
Bisphosphonate or
Strontium Ranelate or Denosumab
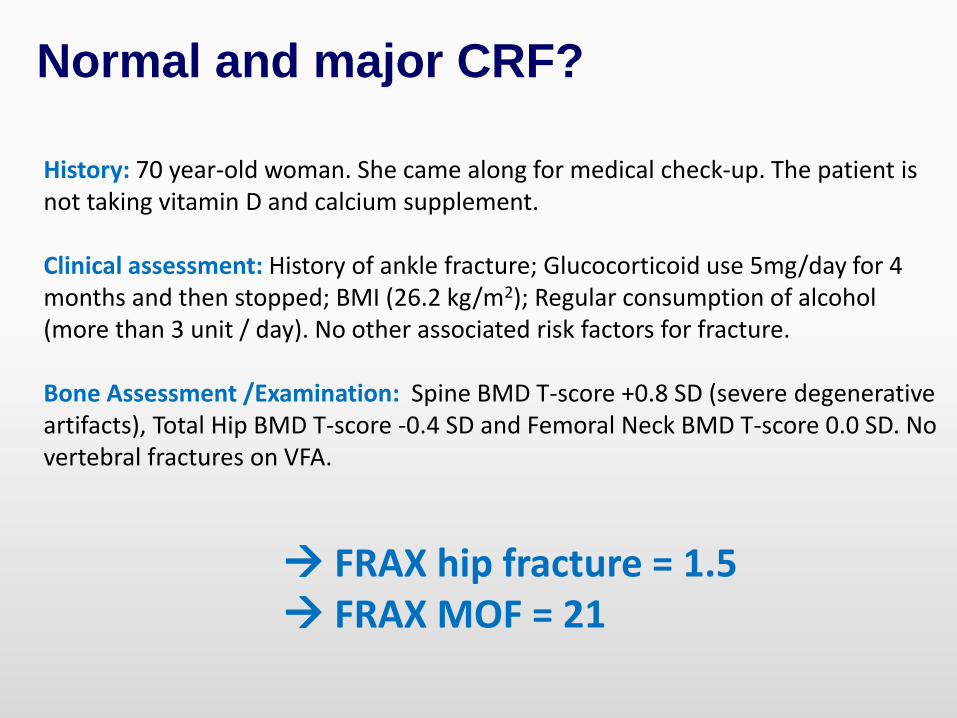
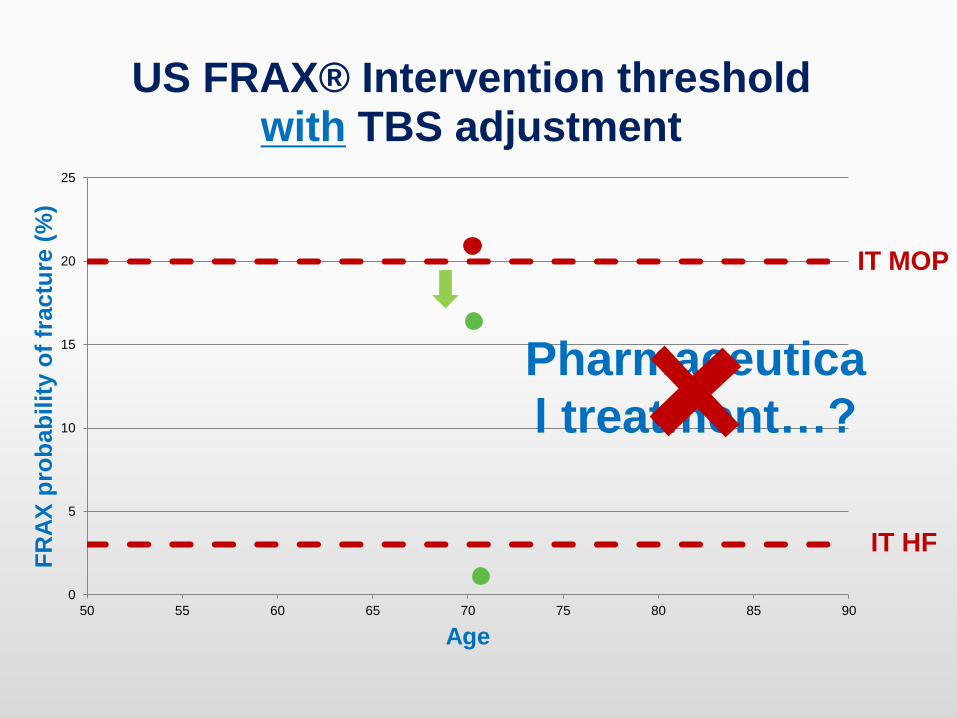
Normal and major CRF?
History: 70 year-old woman. She came along for medical check-up. The patient is not taking vitamin D and calcium supplement.
Clinical assessment: History of ankle fracture; Glucocorticoid use 5mg/day for 4 months and then stopped; BMI (26.2 kg/m2); Regular consumption of alcohol (more than 3 unit / day). No other associated risk factors for fracture.
Bone Assessment /Examination: Spine BMD T-score +0.8 SD (severe degenerative artifacts), Total Hip BMD T-score -0.4 SD and Femoral Neck BMD T-score 0.0 SD. No vertebral fractures on VFA.
FRAX hip fracture = 1.5 FRAX MOF = 21
0
5
10
15
20
25
50 55 60 65 70 75 80 85 90
FR
AX
pro
bab
ilit
y o
f fr
actu
re (
%)
Age
US FRAX® Intervention thresholdwithout TBS adjustment
IT MOP
IT HF
Pharmaceutical
treatment…?
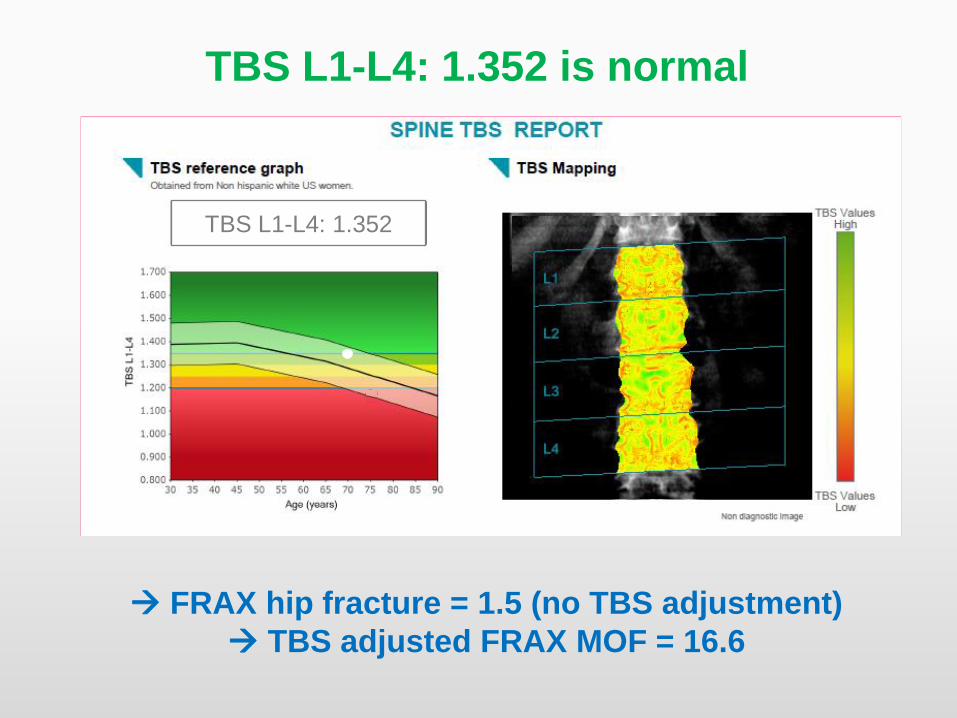
TBS L1-L4: 1.352 is normal
FRAX hip fracture = 1.5 (no TBS adjustment)
TBS adjusted FRAX MOF = 16.6
TBS L1-L4: 1.352
0
5
10
15
20
25
50 55 60 65 70 75 80 85 90
FR
AX
pro
bab
ilit
y o
f fr
actu
re (
%)
Age
US FRAX® Intervention thresholdwith TBS adjustment
IT MOP
IT HF
Pharmaceutica
l treatment…?
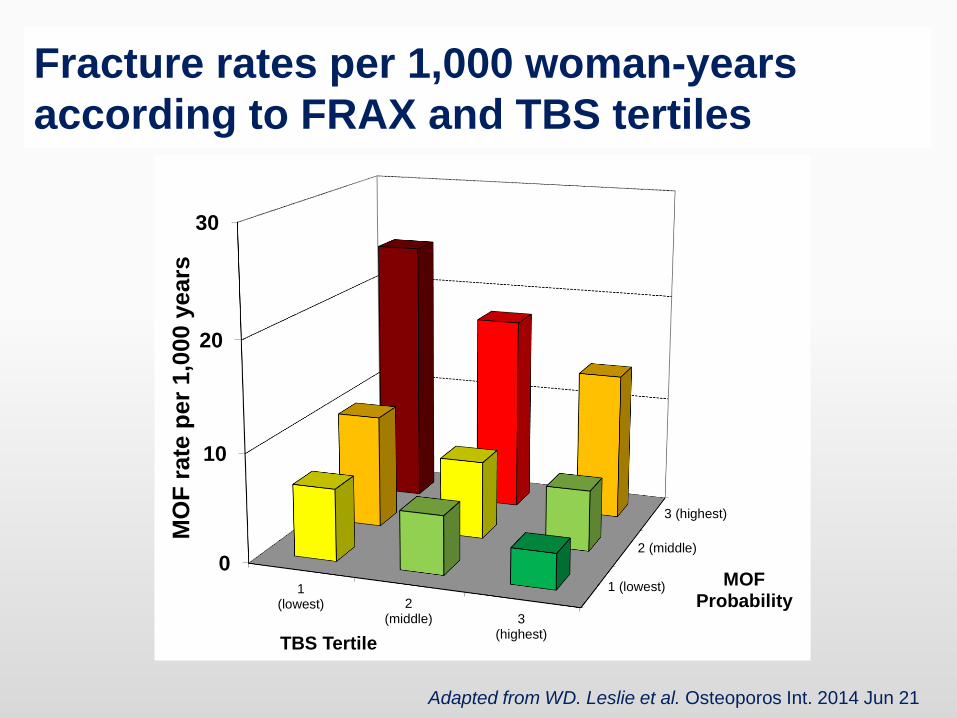
Fracture rates per 1,000 woman-years
according to FRAX and TBS tertiles
Adapted from WD. Leslie et al. Osteoporos Int. 2014 Jun 21
1 (lowest)
2 (middle)
3 (highest)
0
10
20
30
1(lowest) 2
(middle) 3(highest)
MOF Probability
MO
F r
ate
per
1,0
00 y
ears
TBS Tertile
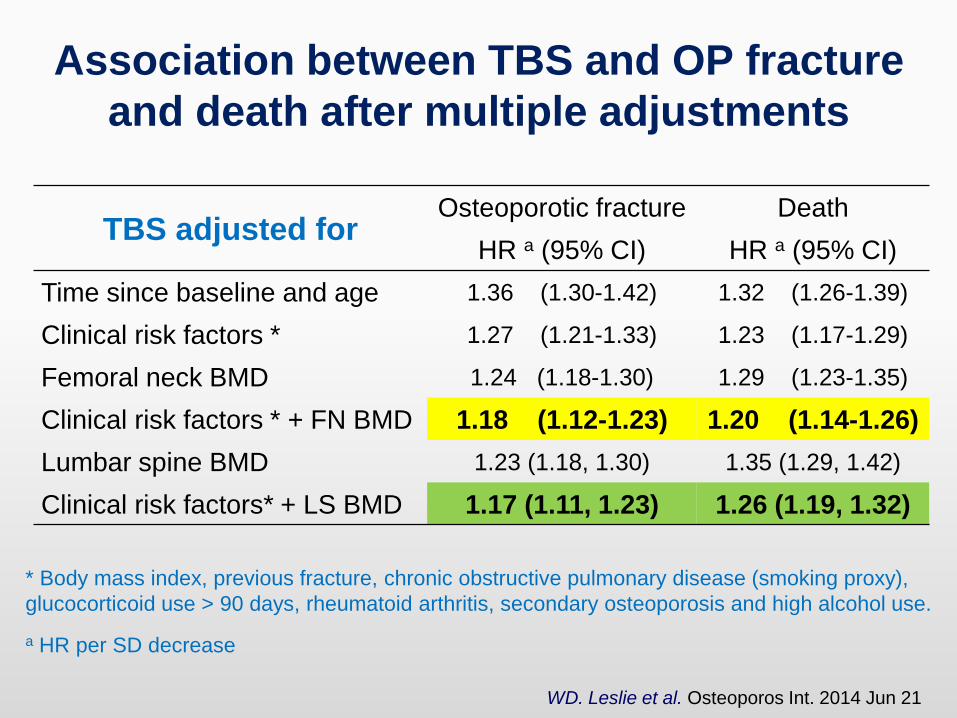
Association between TBS and OP fracture
and death after multiple adjustments
TBS adjusted forOsteoporotic fracture Death
HR a (95% CI) HR a (95% CI)
Time since baseline and age 1.36 (1.30-1.42) 1.32 (1.26-1.39)
Clinical risk factors * 1.27 (1.21-1.33) 1.23 (1.17-1.29)
Femoral neck BMD 1.24 (1.18-1.30) 1.29 (1.23-1.35)
Clinical risk factors * + FN BMD 1.18 (1.12-1.23) 1.20 (1.14-1.26)
Lumbar spine BMD 1.23 (1.18, 1.30) 1.35 (1.29, 1.42)
Clinical risk factors* + LS BMD 1.17 (1.11, 1.23) 1.26 (1.19, 1.32)
* Body mass index, previous fracture, chronic obstructive pulmonary disease (smoking proxy),
glucocorticoid use > 90 days, rheumatoid arthritis, secondary osteoporosis and high alcohol use.
a HR per SD decrease
WD. Leslie et al. Osteoporos Int. 2014 Jun 21
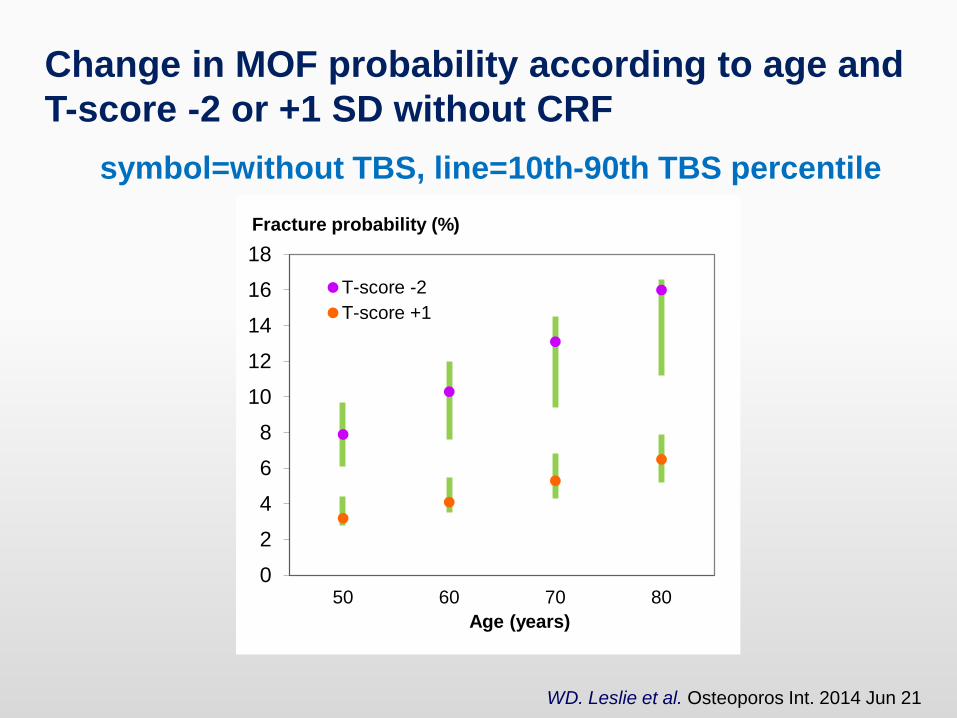
WD. Leslie et al. Osteoporos Int. 2014 Jun 21
Change in MOF probability according to age and
T-score -2 or +1 SD without CRF
symbol=without TBS, line=10th-90th TBS percentile
0
2
4
6
8
10
12
14
16
18
50 60 70 80
Age (years)
T-score -2
T-score +1
Fracture probability (%)
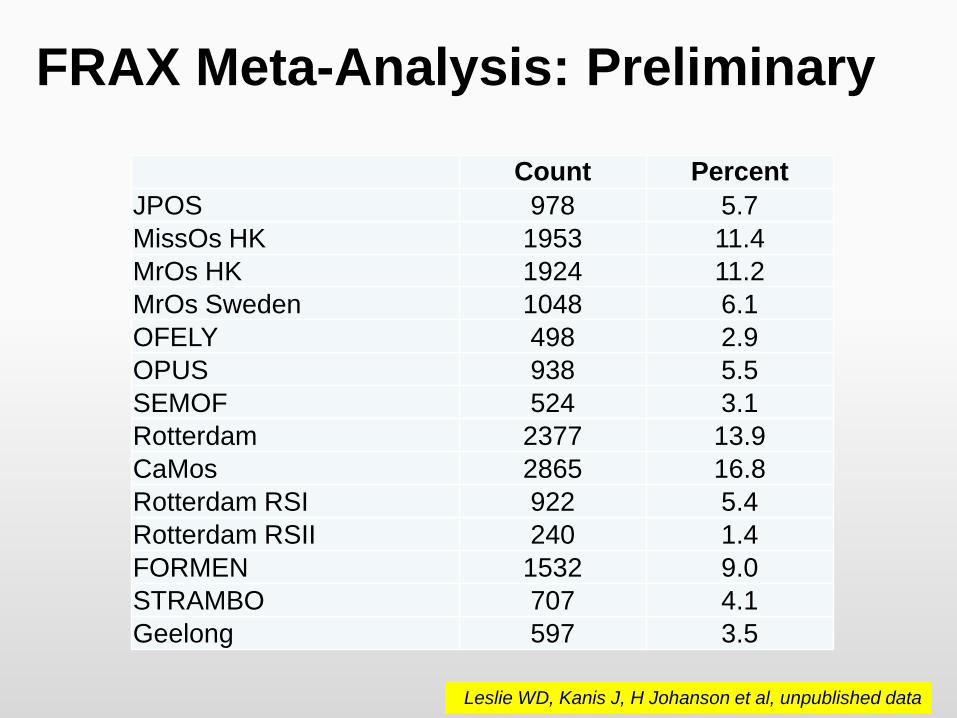
FRAX Meta-Analysis: Preliminary
Count Percent
JPOS 978 5.7
MissOs HK 1953 11.4
MrOs HK 1924 11.2
MrOs Sweden 1048 6.1
OFELY 498 2.9
OPUS 938 5.5
SEMOF 524 3.1
Rotterdam 2377 13.9
CaMos 2865 16.8
Rotterdam RSI 922 5.4
Rotterdam RSII 240 1.4
FORMEN 1532 9.0
STRAMBO 707 4.1
Geelong 597 3.5
Leslie WD, Kanis J, H Johanson et al, unpublished data
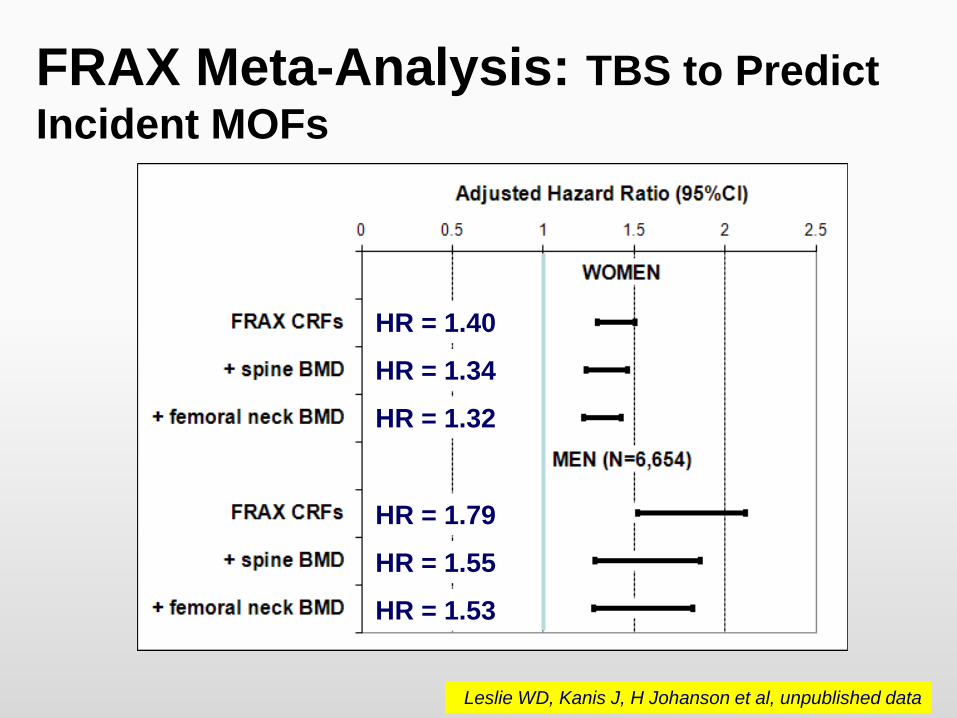
FRAX Meta-Analysis: TBS to Predict
Incident MOFs
HR = 1.40
HR = 1.34
HR = 1.79
HR = 1.55
HR = 1.53
HR = 1.32
Leslie WD, Kanis J, H Johanson et al, unpublished data
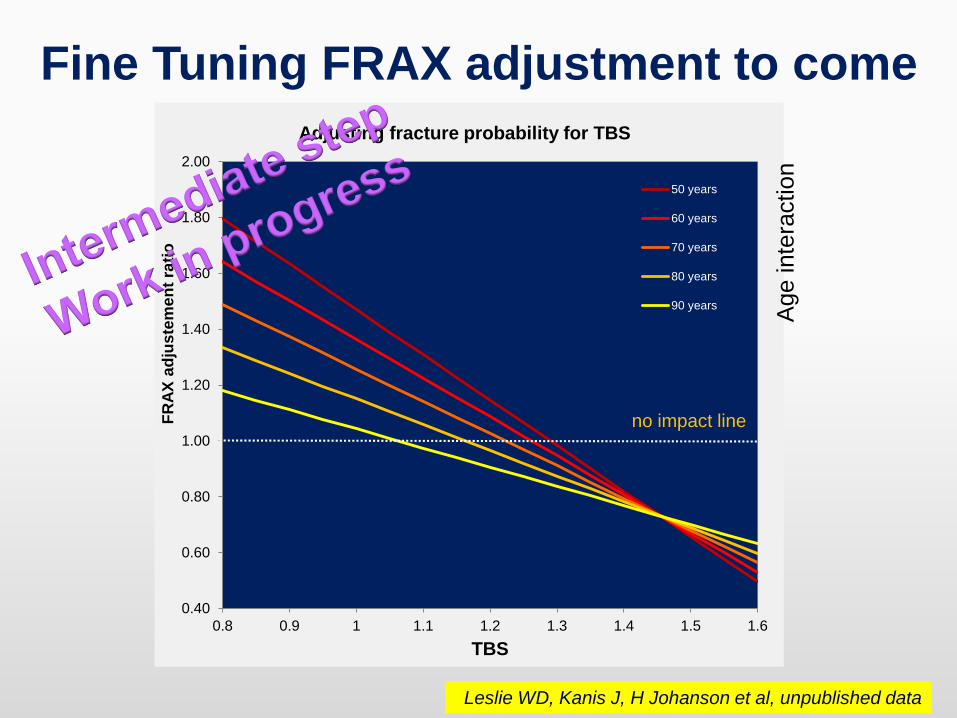
0.40
0.60
0.80
1.00
1.20
1.40
1.60
1.80
2.00
0.8 0.9 1 1.1 1.2 1.3 1.4 1.5 1.6
FR
AX
ad
jus
tem
en
t ra
tio
TBS
50 years
60 years
70 years
80 years
90 years
no impact line
Adjusting fracture probability for TBS
Fine Tuning FRAX adjustment to come
Age inte
raction
Leslie WD, Kanis J, H Johanson et al, unpublished data
Conclusions There is sufficient evidence today to use TBS in clinical
routine as one of the risk factors of the fracture
While the optimal threshold for TBS should be confirmed, an
incremental improvement in fracture identification was seen
by using lumbar spine TBS in combination with FRAX.
Once cross-validated in the individual level meta-analysis,
lumbar spine TBS will be integrated into the FRAX model as
an add on.
Such simple way to take TBS into account would allow the
use of current medical society recommendation regarding
osteoporosis management with only minor adaptation.
Thank
you for
your
attention
Density BMD
Macro-Architecture
Micro-Achitecture
Morphometry
Body Composition
BMD
TBS