Embed Size (px)
Citation preview

With the support of Government of Korea
Co-organised with: Korea Institute of Public Finance (KIPF)
Vietnam Institute for Development Strategies (VIDS)Korea Development Institute (KDI)
The 8th Meeting of the Asia Network on Corporate Governance of State-Owned Enterprises
Part 2: Workshop on Improving the Performance of SOEs
16-17 November 2015
Hanoi, Viet Nam
Sheraton Hanoi

With the support of Government of Korea
Co-organised with: Korea Institute of Public Finance (KIPF)
Vietnam Institute for Development Strategies (VIDS)Korea Development Institute (KDI)
Session 4: Good practices of Performance Management in Asia
Part 2: Workshop on Improving the Performance of SOEs
16-17 November 2015
Hanoi, Viet Nam
Sheraton Hanoi

Institutionalizing Performance
Management among DHI SOEs in Bhutan
November 2015 – Hanoi
Dr. Damber S. Kharka, Officiating CEO, DHI

SOE Definition: In Bhutan, a state-owned enterprise is any enterprise with state ownership. They are legal entities created by the Royal Government of Bhutan (RGOB), in order to part-take in commercial activities on behalf of the Government. SOEs include both enterprises that are wholly owned and those with minority state ownership.
SOE RGOB vs SOE DHI: In 2007, His Majesty the King of Bhutan issued a Royal Charter to establish Druk Holding and Investments (DHI) to hold and manage the existing and future investments of the RGOB for the long term benefit of the people of Bhutan. Currently, 20 SOEs form part of DHI’s portfolio, and 8 SOEs remain with the RGOB (under the ownership of relevant Ministries).The DHI SOEs are categorized, similar to Vietnam, based on DHI’s shareholding pattern. 100% shares – DHI Owned Companies (DOCs) More than 50% shares – DHI Controlled Companies (DCCs) Less than 50% share – DHI linked Companies (DLCs)

Sl
Company
Sector
State Share
DHI Share
1 Bhutan Agro Industries Limited Manufacturing 100 -
2 Bhutan Board Products Limited Manufacturing 58
3 Bhutan Development Bank Limited Financial Services
4 Bhutan Broadcasting Services Information/Media 100 -
5 Bhutan Power Corporation Limited Energy & Resources 100
6 Bhutan Ferro Alloys Limited Manufacturing 26
7 Bhutan Postal Corporation Limited Communication & Transportation
100 -
8 Bhutan Telecom Limited Communication & Transportation
- 100
9 Bank of Bhutan Limited Financial Services - 80
10 Bhutan National Bank Financial Services 14
11 Construction Development Corporation Limited Real Estate & Construction - 100
12 DHI Infra Limited Real Estate & Construction - 100
13 Druk Air Corporation Limited Communication & Transportation
- 100
14 Dungsam Cement Corporation Limited Manufacturing - 100
15 Dungsam Polymers Limited Manufacturing - 51
16 Druk Green Power Corporation Limited Energy & Resources - 100

Sl
Company
Sector
State Share
DHI Share
17 National Pension and Provident Fund Financial Services 100 -
18 State Trading Corporation of Bhutan Limited Trading - 51
19 Royal Insurance Corporation of Bhutan Limited Financial Services - 18
20 State Mining Corporation Limited
Energy & Resources - 100
21 Thimphu TechPark Limited Communication & Transportation
- 100
22 Wood Craft Center Limited Manufacturing - 100
23 Koufuku International Private Limited Manufacturing - 30
24 Kuensel Corporation Limited Information/Media 100 -
25 Natural Resources Development Corporation Limited Energy & Resources - 100
26 National Housing and Development Corporation Limited Real Estate & Construction
100 -
27 Food Corporation of Bhutan Trading 100 -
28 Penden Cement Authority Manufacturing - 40
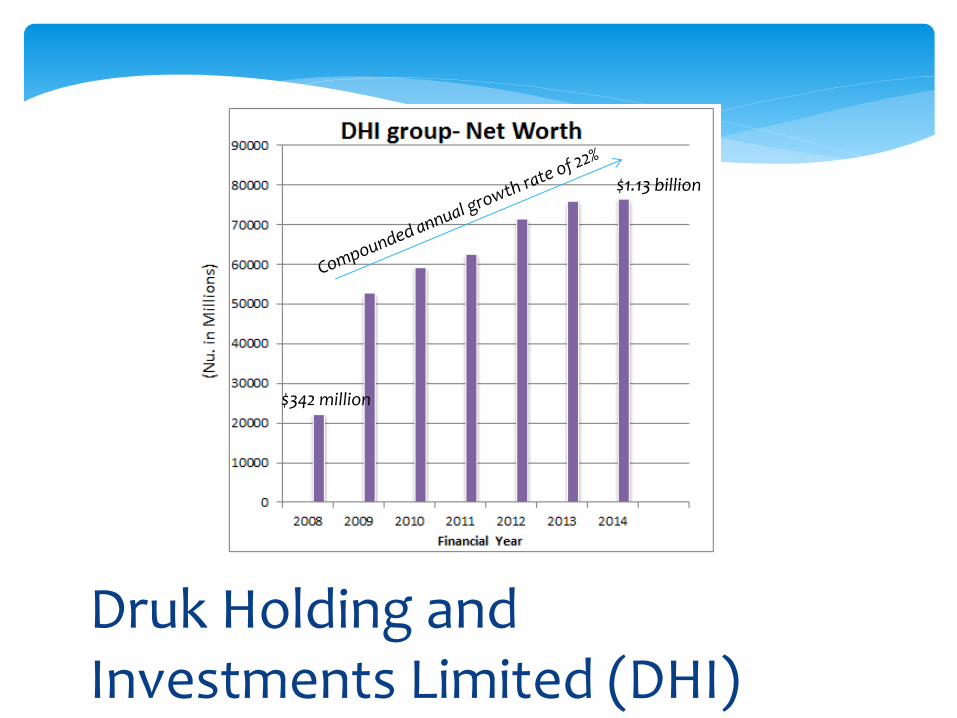
Druk Holding and Investments Limited (DHI)
$342 million
$1.13 billion

Corporate Performance Management Systems at DHI Companies: Lessons on
Introducing & Managing Change

Introducing Corporate Governance and Performance Management systems based on international norms since 2007
Corporate Governance (CG) Code – developed based on the OECD Corporate Governance Principles
Performance Management Systems (PMS) – DHI PMS Compact Guidelines for owned and controlled companies
Delinking SOE employee compensation from civil service pay through a performance based compensation model
Improving State Enterprise Efficiency by Creating Corporate Culture and Performance Enhancing Systems
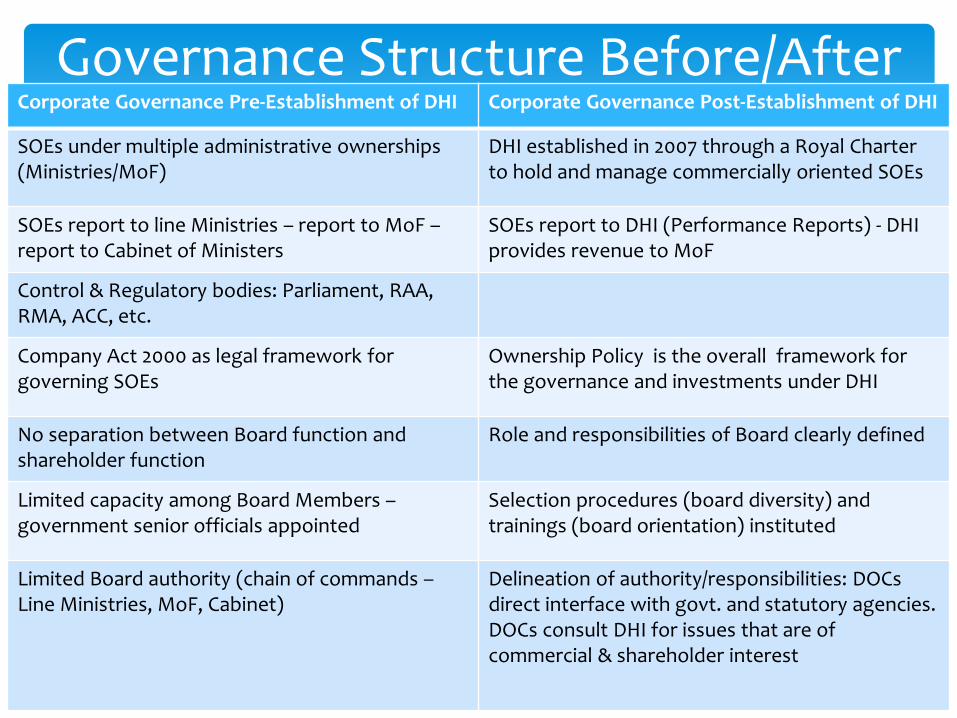
Corporate Governance Pre-Establishment of DHI Corporate Governance Post-Establishment of DHI
SOEs under multiple administrative ownerships (Ministries/MoF)
DHI established in 2007 through a Royal Charter to hold and manage commercially oriented SOEs
SOEs report to line Ministries – report to MoF – report to Cabinet of Ministers
SOEs report to DHI (Performance Reports) - DHI provides revenue to MoF
Control & Regulatory bodies: Parliament, RAA, RMA, ACC, etc.
Company Act 2000 as legal framework for governing SOEs
Ownership Policy is the overall framework for the governance and investments under DHI
No separation between Board function and shareholder function
Role and responsibilities of Board clearly defined
Limited capacity among Board Members – government senior officials appointed
Selection procedures (board diversity) and trainings (board orientation) instituted
Limited Board authority (chain of commands – Line Ministries, MoF, Cabinet)
Delineation of authority/responsibilities: DOCs direct interface with govt. and statutory agencies. DOCs consult DHI for issues that are of commercial & shareholder interest
Governance Structure Before/After
Ministry of Finance
Druk Holding & Investments Ltd
SOE SOE SOE SOE
RMA Capital Market
Authority
RSEB Listed Only
Company Registrar
Royal Audit Authority
Accounting & Auditing
Watchdog
Anticorruption Commission
Other Regulators
Strengthening the Ownership Function: Institutional Framework for
Ownership & Control

Improving Corporate Governance: Pursuing Good Practices beyond requirements of
Company Act Development of Corporate Governance (CG) Code & Ownership Policy (OP)
Among others the CG Code & OP provide guideline on: • Interface between companies,
shareholders and the government • Board composition, appointment,
responsibility, authority, fiduciary duties and liabilities and board evaluation
• CEO selection and appointment, roles and responsibilities and performance evaluation
To provide proper structure and increased capability for the implementation of standard corporate governance system aimed at enhancing corporate performance, additional initiatives undertaken: • Chairmen’s Forum • CEO Roundtable Meeting • CXO Forums
• Board Directors Onboarding Programs • Professional Directors Training Programs • Leadership Development Programs for
senior managers • Company Secretary training and manuals
Developing Guidelines: • Target Formulation & Evaluation Guideline • Investment Guideline • Dividend Guideline • Risk Management Guideline • Board Recruitment Guideline • Board Evaluation Guideline • CEO Recruitment Guideline • CEO Performance Evaluation Guideline • Common HR Guideline • Corporate Social Responsibility Guideline

DHI introduced a system of signing Annual Compacts with its Board and Companies:
Annual Compact: Corporate Level Performance Management System that covers target setting and monitoring and evaluating in performance areas of (i) financials (ii) customer service (iii) corporate governance (iv) policy directed targets, looking at Key Performance Indicators (KPIs)
Compact agreement process: Discussions at Company management level Company Board level discussions Discussions with DHI Negotiation between DHI Board and Company Board
Improving Performance Management Systems: Monitoring,
Evaluating, & Linking Performance to Incentives

60%
10%
15%
15%
FINANCIAL
• Revenue
• RoE
• PAT
• Controllable Expenses
CORPORATE GOVERNANCE
• Compliance
• Dealing with corruption
• Ensuring periodic audit
• HR, procurement,
finance…
CUSTOMER SERVICE
• Customer satisfaction
survey score
RGoB
• Specific targets from RGoB
Key Result Areas

Linking Performance to Incentives: Performance Based Variable Allowances (PBVA), CEO
Evaluations, Linkage to HR
Compact
Achievement
PBVA payout guideline based on
Corporate Level Performance
CEO Employees
≥ 95 25% of annual
basic pay
15% of annual
basic pay
75% - 95% Prorated PBVA
payout of 1.5% for
every point of
achievement
Prorated PBVA
payout of 0.75%
for every point
of achievement
≤ 75% No PBVA payout No PBVA
payout
Employee Level Performance Assessment: Performance Management Systems (PMS) & Performance Based Incentive Systems (PBIS)
• Corporate level targets cascaded down to departments, divisions, units, and individuals
• Individual metric: performance target agreed between supervisor and subordinate
• Individual performance ratings tired to annual bonus, meritorious and fast track promotions, etc.
* CEOs of the DHI companies receive their PBVA based on a total CEO’s performance rating point which constitutes 20% from a leadership performance rating carried out by the Board and 80% from the company’s compact achievement

Developing a Competitive & Sustainable Remuneration System: Performance Based Salary
Increment Model
DHI is currently in the process of introducing an Annual Salary Increment Model – the model suggests that 60% of inflation (moving average of three years) should be provided as automatic. However, the remaining 40% should be based on the ability to pay (API) which is essentially the financial performance of the company. API is decided based on three revenue indicators - Profit After Tax, Return on Equity, and Revenue per Employee and two cost indicators – Operational cost (OPEX: all cost excluding depreciation and interest payment) and OPEX per employee. The formula for API based salary increment will be calculated as:
Increment based on API = API*(I-.6I) I= Moving average inflation rate of the past three years

Developing a Competitive & Sustainable Remuneration System: Performance Based Salary
Increment Model
Performance Index for an individual employee will be calculated as:
PI = wt*CR+wt*DR*wt*IR
wt: weightage assigned to different levels of performance rating
CR: corporate level performance rating in terms of percentage
DR: department/unit level performance rating in terms of percentage (if department and unit level ratings are provided differently then the average of two should be considered)
IR: individual employee level performance rating of percentage.
Performance Based Annual Increment (PAI):
Performance Index
(PI) < 75%
>=75<85
%
>=85<90
%
>=90<95
% >=95%
Performance based
annual increment
(PAI) in % 0.00% 1% 1.5% 2% 2.5%

Lessons from Change Management To reflect on the processes of change management (introducing corporate governance best practices and performance management systems) that led to success, the following lessons are shared: - Learning from the well functioning companies themselves on the best practices and
sharing experiences with other companies in the informal forums such as CEO round tables meeting held every quarter has played an important role in introducing changes successfully.
- CEOs and the senior management team playing roles as champions of change management have been crucial in the successful identification of areas of change.
- Involvement of key members during the process of change identification and implementation proved useful.
- Realization of parent company to deal with change management as facilitator and allowing change areas conceptualized among leaders of companies through cross fertilization of ideas in informal discussion forums resulted in ownership of the idea.
- Leadership role in discussion forums in explaining desired change, involving people in the process and the art of arriving at consensus played a role in generating a “feel good factor” and confidence about the outcome of the proposed change.
- CEOs and CXOs (Department heads) in companies directly influence the uptake of new system by their people as they direct them on a day to day work, so any change that is not perceived important by these people is bound to bounce back as it is forcefully introduced.

Thank You & Tashi Delek!

Performance Assessment
of Chinese Central SOEs
By Mr. Liu Yuan
Bureau of General Affairs, SASAC
Nov. 17th, 2015

Outline
1.Brief Introduction of Chinese SOEs
2.General Framework of Performance Assessment
3.Development of Performance Assessment
4.The Results of Performance Assessment

Brief Introduction of Chinese SOEs
State-owned capital should serve the national development strategy.
We will invest more of state-owned capital in key industries and areas
that are vital to national security and are the lifeblood of the economy,
focusing on offering public services, developing important and
forward-looking strategic industries, protecting the ecological
environment, supporting scientific and technological progress, and
guaranteeing national security.
Up to the end of 2014, SOEs’ total assets is 102 trillion RMB (including
shareholders’ equity 35.6 trillion RMB), the number of staff is 27 million,
sales revenue is 48 trillion RMB, total profit is 2.5 trillion RMB, and tax
paid is 3.8 trillion RMB.

Up to the end of 2014, there are 112 central SOEs under SASAC’s
portfolio, with total assets 38.7 trillion RMB (including shareholders’
equity 14.3 trillion RMB), number of staff 12.8 million, sales revenue 25
trillion RMB, total profit 1.3 trillion RMB, and tax paid 1.96 trillion RMB.
Up to the end of 2014, there are 379 listed companies among all central
SOEs under SASAC’s portfolio, with total assets 21.3 trillion RMB
(accounting for 55.1% of all central SOEs), shareholders’ equity 8.2
trillion RMB (accounting for 57% of all central SOEs), sales revenue
15.5 trillion RMB (accounting for 61.8% of all central SOEs), and total
profit 1.03 trillion RMB (accounting for 76.3% of all central SOEs).
Brief Introduction of Chinese SOEs

General Framework
According to the requirement of management by objectives, SASAC
adopted performance assessment method as follows:
1. Annual assessment & tenure assessment
2. Result assessment & process evaluation
3. Performance outcomes & incentives
4. Linkage of annual assessment result with yearly merit pay, and tenure
assessment result with appointment & removal as well as long-term
incentives

Basic Procedure
1. Work allocation. According to the evaluation method ,we arrange
relevant evaluation work.
2. Signing documents of evaluation target. SOEs hand in suggestive
targets for annual and tenure-based report. SASAC reviews the
suggestive targets. Documents for annual or tenure-based
performance assessment are signed by SASAC chairman and major
executives of SOEs.
3.Dynamic Monitoring. SASAC make dynamic monitoring to the
implementation of the documents, while SOEs should hand in regular
report on the implementation of the documents.
4. Verify evaluation result. SOEs hand in analysis report of their
performance. SASAC reviews the report (including the financial
statistics), verifies evaluation result and presents feedbacks to
enterprises.

Performance Evaluation and Remuneration
Performance salary is connected with evaluation results:
E-level: zero performance salary
D-level: performance salary = 0-1 times of the base salary
C-level: performance salary = 1-1.5 times of the base salary
B-level: performance salary = 1.5-2 times of the base salary
A-level: performance salary = 2-3 times of the base salary
For enterprises in D and E-level, SASAC will change their executives.

Indicators
According to the principle of “simple but targeted” and “universal
and individual”, indicators for evaluation are divided into 2
categories.
1. Two Basic indicators
1) Two basic indicators for annual assessment: profit and value-
added
2) Two basic indicators for tenure assessment: ratio of value
preservation & increment and turnover of total assets
2. Two classification indicators
Classification indicators are different according to different
industry and management shorthand. e.g. cost ratio, power
generation of electricity enterprise

Target Value
How to decide the target value?
1. Vertical comparison: no less than the average value of last 3
years or the actual value of last year
2. Horizontal comparison: benchmarking within the same
industry

Annual Assessment
Total score = total profit score(30%)+ EVA score(40%)+
classification indicator A score(15%)+ classification indicator B
score(15%)
EVA = net operating profit after tax (NOPAT) – cost of capital =
NOPAT –capital after adjustment × the average rate of capital cost

Tenure Assessment
Total score=preservation & increment ratio of state-owned assets
value score (40%) + turnover score of total assets (20%) +
classification indicator A score (10%)+ classification indicator B
score (10%)+annual performance score (20%)

Development of Performance Assessment
Phase 1 (2004-2009): Focus on scale
1. We choose total profit and ROE (Return on equity) as annual
assessment indicators, which could mostly reflect investor’s interest &
requirement and which is our top concern.
2. We choose preservation & increment ratio of state-owned assets and
main business average growth rate in last 3 years as tenure
assessment indicators, to ensure the preservation and increment of
state-owned assets when enterprise grows. It is required that the
target value of SOEs is no less than the average value of last 3 years or
the actual value of last year.

Development of Performance Assessment
Phase 2 (2010-2012): Introduce EVA into assessment to realize value management
There are some problem with SOEs during their rapid development, such as fast expanding
capital coefficient, declining ROI (return on investment) and increasing operational risk,
due to the impulsive scale expansion and aggressive investment increment.
Therefore, SASAC introduce EVA into the performance assessment since the 3rd tenure.
Three core concepts are used to restrain SOEs’ investment behavior: 1. Capital has its own
cost. Executives must adopt full cost accounting in management in consideration of both
liability cost and equity cost. 2. Capital has “discipline”. Executives must be responsible to
shareholders, and cannot step into the field which they cannot control. Profitability is
priority for enterprises, however it is not the only pursuing.
Comparing with traditional financial indicators, as a comprehensive value indicator, EVA is
more advantageous in performance assessment and long-term value orientation.

Phase 3(2013-): To be stronger & better
1.Put quality of development in the first place.
2.Increase the share of EVA in annual assessment.
3.Total assets turnover displaces main business revenue growth rate
in tenure assessment.
4. Benchmarking with international market and world-leading
companies.
Development of Performance Assessment

New Modifications
1. Classified assessment based on different functions of state
economy: there will be some differences in both indicators and weight
among SOEs in fully competitive industry and those in important
industries and key sectors that have a vital bearing on national
security and are the lifeline of the national economy.
2.Improving target management: classify the target; different
assessment target related to different results; self-imposed stress is
encouraged.
3. Tenure incentives: Maximum 30% of the total annual pay according
to the tenure assessment results.
Development of Performance Assessment

The Results of Performance Assessment
1.Economic benefits is obviously improved. Since SASAC was
established ten years ago, central SOEs changed significantly.
2003-2012, total EVA of central SOEs increased from 2.1 billion RMB to
400 billion RMB, with annual growth rate 93.1%.Total profits increased
from 300.6 billion RMB to 1.3 trillion RMB, with annual growth rate
17.3%. Sales revenue increased from 4.5 trillion RMB to 22.5 trillion
RMB, with annual growth rate 19.6%. ROE (Return on equity) increased
from 6% to 8.3%. Total assets increased from 8.3 trillion RMB to 31.6
trillion RMB, with annual growth rate 16%.

2. Decision-making becomes more rational. EVA becomes one of the
core evaluation indicator. The executives must make balance between
profitability and liability control, optimize investment plan and cut
down those unprofitable and long-term investment. The annual growth
rate of capital coefficient in the 3rd tenure is 13%, which is 5.7% less
than the 2nd tenure.
The Results of Performance Assessment

3. Fine management is encouraged. Now SOEs attach great importance
to analyzing value chain, cutting operational cost and increasing
investment efficiency instead of being impulsive in scale expansion
previously. SOEs improve the efficiency of capital and the value-
creating ability through adjusting investment strategy, minimizing
capital coefficient and strengthening management to cost, accounts
receivable and stock.
The Results of Performance Assessment

4. Attach great importance to R&D (Research and development)
investment. R&D investment of central SOEs in 2012 reached 312.3
billion RMB, which is 1.5 times more than last tenure. Core
competitiveness of SOEs is relatively improved.
The Results of Performance Assessment

Performance Evaluation or Monitoring System for State Owned Enterprises
R K Mishra, Director
Institute of Public Enterprise, Hyderabad, India

SOEs in India: At a Glance
No of operating SOEs 290 as on 2013-2014
Listed SOEs 47 as on 2013-2014
Turnover 19,45,777 crore 6.79% (% growth over 11-12)
Income 19,31,149 crore 7.01% (% growth over 11-12)
Profits 1,43,559 crore (149) 14.00% (% growth over 11-
12)
Reserves & surplus 6,81,409 9.26%
Foreign exchange earnings 1,38,150 8.03%
Contribution to GDP 11.50%
NOTE: 1 US$ = Rs.60 1 Crore = US$ 166666

SOE: Sectoral Framework
As per the Companies Act 2013 of Government of India, any enterprise having a shareholding of 51% or more in the paid up capital, is termed as a public enterprise. The 51% shareholding may constitute the shareholdings from the central government, state governments or both taken together.
In all, out of 290 Central SOEs, 47 SOEs listed on Bombay Stock Exchange had government shareholdings exceeding 51%, while the rest 243 Central SOEs had 100% government shareholdings

Ownership model
“Dispersed ownership” model followed
There are large number of government ministries and other high-level public institutions exercise ownership rights over SOEs
There is a central coordinating agency in the form of Department of Public Enterprise at central level

Accountability
SOEs in India are accountable to multiple agencies including Parliament, administrative ministry, vigilance, CAG, Planning Commission, Finance Commission, media and others
Department of Public
Enterprise
Parliament
Central Vigilance
Commission
Comptroller and Auditor
General
Public & Media Control
Government
planning Commission
Finance Commission

SOE Evaluation System
SOEs in India follow an elaborate system of performance evaluation and is called the MoU (Memorandum of Understanding) system. This system is not backed by a legal framework like the GPRA Act of USA
MoU is a signed document highlighting the proposed targets set by SOEs to be achieved during the financial year. This document is signed by the Chief of the SOE as well as the head of its administrative ministry.
The MoU system derives its strength from the fact that way back in 1985, in a meeting of the Group of Ministers (GOM) it was decided to introduce the MoU system in CPSEs and it was implemented in1986. It was aimed at affording greater autonomy to public enterprises from government control.
Along with the increased autonomy for managers there was a corresponding increase in accountability as well where the government would continue to have control over the enterprises through ‘priori’ supervision by target setting at the beginning of every year through ‘performance evaluation’.
The system derives further strength from the fact that a High Power Committee chaired by the Cabinet Secretary and the a Group of Secretaries as its members which gives direction and guidance to the system of MoU and keeps its utility and relevance with changing times.

Evaluation process
The evaluation of SOEs is done through a rigorous process to make the targets more meaningful and challenging.
High Powered Committee (HPC): A High Powered Committee is the apex committee in the MoU system and is a Committee of Secretaries (COS). The HPC is charged with assessing the performance of the MoU signing CPSEs against the targets set in the MoU. Along with this, the HPC is also charged with assessing how far the administrative ministries / departments have succeeded in keeping their end of the commitments as promised in the MoU. The body is headed by Cabinet Secretary, GOI.
Task Force: The task force is charged with the target setting and assigning weightages to parameters along with evaluation of performance of the SOEs. The members of the task include ex- Civil servants, ex- Chief Executives of SOEs, Professionals and academicians from relevant disciplines. The task force has sub-groups called syndicates, each of which is charged with managing SOEs in a specific sector. The SOEs are categorized into 13 syndicates, each comprising of normally 5-6 members headed by a Convenor, SD expert, Finance / CA expert, CSR expert, R&D expert and HRM expert.

MoU Timelines
The process of the target setting and evaluation begins with the Department of Public Enterprises first, with the Release of the MoU guidelines in the month of October/ November; Draft MoUs to be prepared on the basis of the guidelines and submitted to the
administrative ministries; Examination of draft MoUs by the MoU division of the Department of Public
Enterprises and the subsequent circulation of the critiques to be handed over to the members of the task force.
Scheduling the MoU negotiation meetings that begin from January / February. Negotiation meetings to finalize the MoUs with the task force (January – March)
each year. Preparation and circulation of minutes. (vii) Draft MoU by CPSEs on basis of
minutes. Evaluation of MoU by the task force members as submitted by CPSEs and vetted by
DPE. All MoUs have to be signed before 31st March of every year

Evaluation Mechanism
Financial
performances
(Type Ⅰ)
Profits, gross margin, gross profit,
gross sales, net profit, Resource
mobilization, Loan sanctions,
recoveries, Cash generation from
Operations
(Type Ⅱ)
Productivity related,
PBDIT/Total Employment,
Net profit/Net Worth,
Added Value/Sales,
Working Capital/Turnover
Non-financial
Performances
(Type Ⅲ)
Project implementation, Project
cost(cost overrun), Strategic
Planning / Corporate, planning /
vision
(Type Ⅳ)
HRM, customer
satisfaction, corporate
social responsibility,
corporate governance,

Thank you

1
The 8th Asia SOE Network in Viet Nam (Room Document)
SOE Oversight
and
Performance Monitoring in
INDIA
Dr. Madhukar Gupta Joint Secretary
Department of Public Enterprises (DPE) Government of India

Department of Public Enterprises (DPE) Ministry of Heavy industry, Govt. of India
• DPE acts as a nodal agency for all Central Public Sector Enterprises (CPSEs) or SOEs and formulates policy for the functioning of PSEs
• It lays down policy guidelines on performance improvement and evaluation, autonomy and financial delegation and personnel management
• It collects, evaluates and maintains information on several areas in respect of PSEs
• CPSEs not covered within the preview of DPE are departmentally run public enterprises, banking institutions, insurance companies and State Level Public Enterprises
2

Memorandum of Understanding (MoU)
3
• MoU is a mutually negotiated agreement between the management of the Central Public Sector Enterprises (CPSEs) or SOEs and the Government of India/ Holding CPSEs
• MoU system involves target setting in Financial and Non Financial areas and performance assessment of achievement against these targets
• High Power Committee under the chairmanship of Cabinet Secretary, the senior most civil servant in the country, oversees the MoU signing and adherence process

Objectives of MoU
4
• Improve the performance of CPSEs by increasing autonomy and accountability of management
• Fixing of targets in accordance with the goals and objectives of CPSEs
• Enable performance evaluation through objective criteria
• Provides a mechanism of rewarding and incentivizing performance

Institutional Structure I: High Power Committee (HPC)
5
• High Power Committee (HPC): Government of India constituted a High Power Committee (HPC) under the Chairmanship of Cabinet Secretary to review the performance of MoU signing CPSEs
• Performance of SOE’s is assessed with reference to the commitments made in the MoU
• The Committee consists of the following members:
Cabinet Secretary Chairman
Finance Secretary Member
Secretary (Expenditure) Member
Secretary (Planning Commission) Member
Secretary (Statistics & Program Implementation) Member
Chairman (Public Enterprises Selection Board) Member
Chairman, Tariff Commission Member
Chief Economic Adviser, Ministry of Finance Member
Secretary (Performance Management Division) Member
Secretary, Department of Public Enterprises Member-Secretary

Institutional Structure Task Force/ Expert Group / MRG
• Task Force for MoU is a neutral and independent body of experts that assists the High Power Committee on MoU and Department of Public Enterprises in setting annual MoU targets of CPSEs and performance evaluation of MoUs
• 290 CPSEs are regrouped as per operation into 12 syndicates for MoU. MoU Syndicate comprises of 5 task force members, including one convener
• Two experts groups, one each for finance / accounts and other for non - financial matters are set up to provide advice to the Task Force which can be co-opted with the approval of Secretary (DPE) for MoU Meetings
• Task force is further assisted by team of Chartered Accountants / Cost Accountants forming Member Resource Group (MRG) in DPE

Increasing trends in MoU Signing CPSEs
4
72
100 104
113
196
215
0
50
100
150
200
250
1987-88 1991-92 1994-95 2001-02 2006-07 2012-13 2015-16
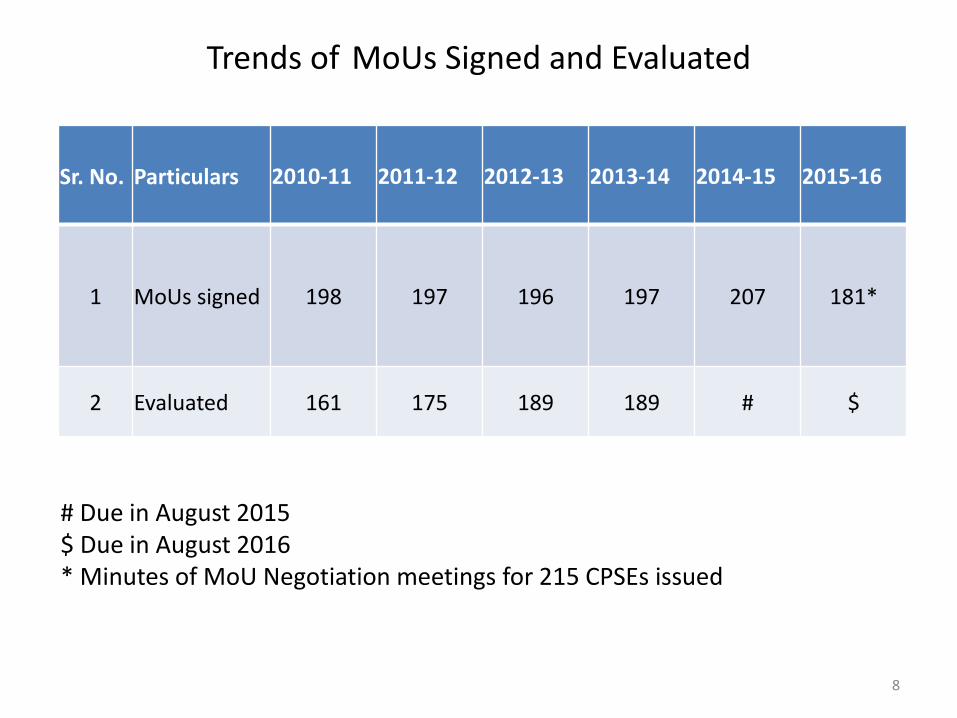
Trends of MoUs Signed and Evaluated
8
# Due in August 2015 $ Due in August 2016 * Minutes of MoU Negotiation meetings for 215 CPSEs issued
Sr. No. Particulars 2010-11 2011-12 2012-13 2013-14 2014-15 2015-16
1 MoUs signed 198 197 196 197 207 181*
2 Evaluated 161 175 189 189 # $

MoU Evaluation: Grading of MoU signing CPSEs
9
Grades 2007-08 2008-09 2009-10 2010-11 2011-12 2012-13 2013-14
Excellent 55 47 74 67 76 75 77
Very Good
34 34 30 44 39 39 40
Good 15 25 20 24 33 37 35
Fair 8 17 20 24 25 36 29
Poor 0 1 1 2 2 2 8
Total 112 124 145 161 175 189 189

Financial Parameters: Principles
The basic targets of relevant financial parameters should have been achieved on the basis of:
(i) projections based on last five years’ actuals
(ii) reference to sectoral as well as industrial growth
(iii) forecast of growth outlook for the ensuing year
(iv) benchmarking with peer Companies at national and global level
(v) targets fixed by Niti Aayog (earlier Planning Commission) /Ministry of Finance

Parameters – Financial
Sl. No Particulars Suggested Weightage
1 Growth/Size/Activity 18-24
2 Profitability 10-12
3 Costs and output efficiency 8-10
4 Liquidity/ Leverage 8-10
5 Efficiency of asset use 6-8
CPSEs may choose upto 6 financial ratios

Non-Financial Parameters: Principles
• Non-financial targets should be SMART (Specific, Measurable, Attainable, Results-oriented & Tangible).
• Targets for non-financial parameters should be independently verifiable by an external agency, wherever applicable.
• CPSEs should specify the documentary evidence they would rely upon as proof of performance as well as the source/agency of such documentary evidence in the MoU.
• Internal documents submitted by CPSEs for evaluation of parameters should be certified by the concerned CPSEs’ Board level officials.
• Automatic downgrading by one notch for lack of /inadequate documentation

Parameters – Non-Financial
Sl. No Particulars Suggested Weightage
1 CSR & Sustainability Up to 3
2 R&D Up to 2
3 Initiatives for growth 10-15
4 Project Management and Implementation 10-15
5 Productivity and Internal Process 7-10
6 Technology, Quality, innovative Practices 5-10
7 Human Resource Management Up to 8
8 Enterprise/Sector Specific Up to 5
CPSEs may choose upto 8 parameters from dynamic/ non-financial Parameters

New Initiatives • Standing Committee: As per direction of HPC, meeting of Standing
Committee for select CPSEs comprising of Joint Secretary, Advisor, Director-MoU of DPE, JS of the administrative Ministry, concerned Advisor of Niti Aayog ( earlier planning commission ) and Adviser/Director Ministry of Statistics & Programme Implementation (MoSPI) to review the draft MoU submitted by the CPSE
• Online MoU (RFMS): As per Result Framework Document (RFD ) target
to develop an online system for MoU to align RFD and MoU targets was developed in March 2014
• Benchmarking: Benchmarking studies involving (i) identification of
benchmarks in the Upstream Oil sector with reference to select Upstream Oil sector CPSEs and (ii) Identification of benchmarks of steel sector with reference to select steel sector CPSEs for fixing realistic target in MoU 2015-16 were conducted in consultation with Administrative Ministry
9/18/201 14

MoU Guidelines: Salient Features
1. Principles for Target setting: MoU targets should be realistic yet growth
oriented inspirational and consistent with the proposed Annual Plan, Budget and Corporate Plan of the CPSE and Results Framework Document (RFD) of the Ministry/Department. Targets should be the maximum achievable under the given and anticipated circumstances.
2. Physical Targets: In addition to the financial performance, quantifiable
physical targets which reflect productivity and efficiency of CPSEs are to be taken as parameters by CPSEs in MoU.
3. Fixation of Targets-Non Financial: There are no mandatory non-
financial parameters for 2014-15. The non-financial parameters are Corporate Social Responsibility (CSR) & Sustainability; Research & Development (R&D); Initiatives for Growth, Project Management & Implementation; Productivity and Internal Processes; Technology, Quality, Innovative Practices; Human Resource Management and Sector Specific Parameters/ Enterprise Specific Parameters.

MoU Guidelines: Salient Features 4. Group Targets: The performances of some CPSEs are inter – dependent
because their operations cut across more than one CPSE and/ or Ministries/Departments. In such circumstances, MoU targets of the concerned CPSEs are so fixed that they are jointly and severally responsible for their performance and for achievement of the targets
5. Research & Development (R&D): “Research& Development”, a
‘Non-financial parameter” may be included for CPSEs desirous of taking up R&D projects. It should be linked to improvements in operational efficiencies in all activities, including manufacturing, processing, product development, packaging, marketing, and even work processes, through innovation, adaption, and application of available and emerging technologies and techniques

MoU Guidelines: Salient Features
7. Commitment and assistance from Government: Performance of
Central Public Sector Enterprises (CPSEs) is assessed with reference to the commitments made and actual assistance given to CPSEs by Administrative Ministries/Departments. The commitments/assurances in the MoU document are to be incorporated appropriately in the Result Framework Documents (RFD) of the concerned administrative Ministry/Department
8. Negative Marking: There is provision for negative marking in cases of non-
compliance with guidelines of:
(i) Corporate Governance
(ii) DPE Guidelines
(iii) MSME Procurement guidelines
(iv) CSR provisions under companies Act 2013
(v) Online submission of PE Survey data
(vi) Online submission of MoSPI data

Implications of MoUs
18
• Performance Appraisal of Chairman and Managing Director, Functional Directors, Executive Directors and General Managers
• Determination of Performance Related Pay of Executives (40%-200%) of basic pay subject to profitability of the CPSE and MoU Rating
• Grant of Maharatna, Navratna and Miniratna status
• MoU Excellence Awards and Certificates
• Affects credibility , morale and self belief of CPSEs

MoU Excellence Awards & Certificates
A total number of 12 MoU Excellence Awards are given annually
i. One from each of the 10 Syndicate groups
ii. One from the listed CPSEs
iii. One from amongst the sick/loss making CPSE on way to turnaround
All other ‘Excellent’ performing CPSEs get MoU Excellence certificates

Features of Result Framework Management System (RFMS - MoU )
• User Friendly: It is a user friendly internet based system which allows
24X7 process of MoUs
• Green Initiative : It creates paper less environment of processing of
MoU activities
• RFMS linked with RFD: This system allows facility creating link among
RFD of Administrative Ministry, Ministry of Statistics and Programme Implementation, Niti Aayog ( earlier Planning Commission ) and other states on RFD in various phases
• Online Monitoring: Facilitating on line monitoring of performance by
CPSE and Administrative Ministry
9/18/2013 20

Introduction of revised Wage Policy
• Policy for the 7th round of Wage negotiations for unionised workmen w.e.f. 01.01.2012 issued in June 2013
• Based on the recommendations of the 2nd Pay Revision Committee (PRC) under the chairmanship of Justice M. J. Rao, pay scales were revised w.e.f. 01.01.2007 for Executives & Non Unionized Supervisors
21

Introduction of Performance Related Pay (PRP)in Central Public Sector Enterprises(CPSEs)
PRP/Variable pay concept has been introduced in CSPEs by Government of India during the 2007 pay revision w.e.f. 01.01.2007
For Board level and below Board level executives and non-unionized supervisors (NUS) based on the reports of 2nd Pay Revision Committee

PRP Provisions in 2007 Pay Revision
• PRP directly linked to profit of each CPSE as a separate entity
• PRP progressively increases with rise in hierarchy of executives
• Mandatory for CPSEs to sign MoU with parent
Ministry/Department/Holding Company
• Rating under MoU one of the determinants for PRP
• PRP is based on CPSE’s current year profit and incremental
profit (total PRP limited to 5% of PBT of a CPSE)
• ‘Bell Curve Approach’ to be followed (not more than 15%
executives in a CPSE to be graded as outstanding and 10% to be
graded below par (not eligible for PRP)
• Disbursement of PRP by a Remuneration Committee headed by
an Independent Director

PRP and Performance Based on Performance Management System
PMS Rating PRP
Excellent At 100% eligibility levels
Very Good 80%
Good 60%
Fair 40%
Poor 0%

Amount of PRP from current and Incremental Profit for the incumbent
• Basic Pay X MoU rating X PAR
• 60% pay will be from current years PBT
• 40% pay will be from incremental profit
• Depending on availability of funds, the PRP would be paid
proportionately

Maximum PRP for different Grades
Grade % of
Basic Pay
E0 to E3 40
E4 to E5 50
E6 to E7 60
E8 to E9 70
Director (C&D) 100
Director(A&B) & CMD(C&D) 150
CMD(A&B) 200

Performance Evaluation
and Monitoring System
for State-Owned
Enterprises in Indonesia
Dr. Antonius Alijoyo National Committee on Governance
Presented on Asia Network on Governance of SOE
Hanoi, Viet Nam, 7 November 2015

SOE Definition
• State-owned Enterprises (Badan Usaha Milik Negara
or "BUMN") are generally governed by Law No. 19 of
2003 on State-Owned Enterprises dated June 19,
2003 ("Law No. 19/2003").
• BUMN are companies which are wholly or partly, and
directly or indirectly, owned by or form part of the
Government of the Republic of Indonesia, divided to
two categories : – Public utility enterprise/Special Purpose Entity (Perusahaan Umum
or "Perum")
– Limited liability State-owned enterprise (Perusahaan Perseroan or
"Persero").

SOE Ownership Function
• Law No. 19 of 2003 on State-Owned Enterprises
dated June 19, 2003. :
– The Ministry of State-Owned Enterprises is appointed
and/or authorized to represent the government of Republic
of Indonesia as State Shareholder in Persero by taking
account the prevailing laws and regulations, as governed by
Law No. 19 of 2003 on State-Owned Enterprises dated
June 19, 2003.

Total Number of SOEs

Specific legislation about
managing SOE
Law No. 19/2003 :
• SOEs are managed by Board of Directors which is an
Organ of Company who authorized and fully responsible
for management of the Company for benefit of the
Company
• SOEs are also supervised by Board of Commissioners
which is an Organ of Company who in charge of
supervising the general and/or special in accordance with
Articles of Association as well as giving advice to Board of
Directors.

Performance evaluation or monitoring
system for state-owned enterprises
• KPKU-BUMN (Assessment Criteria for Performance
Excellence), a performance excellence measurement
criteria that developed by Ministry of SOEs.
• KPKU provides a framework and method for assessment
in order to understand the strength, the opportunities for
performance improvement, as well as to guide the
corporate planning and its implementation effectively.
• The KPKU for SOEs adopts and adapts the concept of
Malcolm Baldrige using the balanced scorecard
performance measurement.

Legal framework of SOE’s performance
evaluation
• Secretary’s letter the Ministry of State-Owned
Enterprises No.S-08/S.MBU/2013 dated
January 2013 regarding the Submission of
Guideline for Determination of Key Performance
Indicators (KPI)
• Assessment Criteria for Performance
Excellence (KPKU) BUMN.

Ministry of SOE’s Performance Evaluation and Monitoring System
• To assess the overall performance of SOES and to identify
things that need to be improved to achieve performance
excellence and provide benefits for stakeholders.
• The evaluation system consists of Interview and Examination of
Documents
• The evaluation indicators :
– Financial Performance :
• Financial Ratios, Net Profit, Growth, Risk Management, Share
Performance
– Non-financial Performance :
• Corporate Events, Corporate Social Responsibility Program, Corporate
Soundness Level, to ensure the punctual submission of reports to
regulators, public service obligation, Implementation of GCG, Awards
• Ministry of SOE’s annually publishes a report in the name of “Ikhtisar
Laporan Keuangan Perusahaan Negara (BUMN)/ The Summary of
SOEs Financial Report.

SOE’s Annual Report
• Guidelines : Financial Services Authority Regulation
(POJK) about Annual Report.
• Annual report content :
– Complete Financial Information such as asset, net profit,
financial ratio etc.
– Non Financial Information such as Boards Information,
GCG Implementation, etc.
• Every SOE engages Independent party to evaluate
the accuracy of annual report contents.

Performance Evaluation and
Reappointment or Dismissal of Executives
Article 3 Financial Services Authority Regulation (POJK) No.
33/POJK.04/2014 dated December 8, 2014 regarding the Board of
Directors and The Board of Commissioners of Issuers or Public Company,
stated that:
Paragraph 1:
Members of Board of Directors are appointed and dismissed by General Meeting
of Shareholders (GMS).
Paragraph 2:
Members of Board of Directors are appointed for the period of time and could be
reappointed.
Paragraph 3:
One Period of tenure of Board of Directors is not later than 5 (five) years or until
the closing of AGM in that period.
The process of Appointment and dismissal of executives is clearly stated in
the Minister of SOE’s Regulation No. PER-03/MBU/02/2015 dated on
Requirements and Guidelines of Appointments and Dismissals of Members
of Board of Directors of State-Owned Enterprises.

Performance Evaluation and Monetary
Compensation
• Performance results from the last fiscal year have impacts on
the settlement of annual remuneration of the next fiscal year for
CEOs or executives, as regulated in the Minister of State-
Owned Enterprises Regulation No. PER-04/MBU/2014 dated
March 10, 2014 on the Guidelines for the Remuneration of
Board of Directors and Board of Commissioners in State-
Owned Enterprises.
• Salary or Honorarium and other facilities received by Board of
Directors and Board of Commissioners, as regulated in the
Minister of State-Owned Enterprises Regulation No. PER-
04/MBU/2014 dated March 10, 2014 on the Guidelines for the
Remuneration of Board of Directors and Board of
Commissioners in State-Owned Enterprises.

SOE’s Performance Evaluation Process
• In conducting KPKU, The assessors visit the SOEs directly. They provide
guidelines to evaluate the performance of SOEs. The guidelines provide things
that will be asked to the management of SOEs. The assessment can be
conducted through interview and documents review.
• There are 7 (seven) indicators used to evaluate the performance of SOEs:
1. Leadership
2. Strategic Plans
3. Focus on Customers
4. Measurement, Analysis and Management’s knowledge
5. Focus on Labour
6. Focus on Process
7. Business Performance
• After the process of evaluation is finished, the assessor will soon make a
scoring and feedback report, including recommendation. That feedback report
provides the strength, weaknesses, opportunities and threats of the SOES.
• It is expected that through the assessment, the SOEs can improve their
performance in order to achieve performance excellence and provide benefits
too stakeholders.

Thank You
Email : [email protected]
National Committee on Governance Website : www.knkg-indonesia.com

Performance Evaluation of
SOEs in Korea
November 17th, 2015
Park, Hanjun, Ph.D
Korea Institute of Public Finance
The 8th Meeting of the Asia Network on Corporate Governance of State-owned Enterprises

Ⅰ Designating and Monitoring of SOEs
Ⅱ Performance Evaluation for SOEs Ⅲ Evaluation of Management Performance
Incentives and Penalties
Accomplishments and Limitations
Ⅳ
Ⅴ


◈ Established or funded by the government to provide public services
◈ A total of 316 institutions designated as SOEs by the Act on the Management of Public
Institutions (‘15.6)
◈ Grouped into 3 types, depending on the institution’s nature; financial status, employees, etc.
Public Corporations Quasi-governmental Institutions Non-Classified
Public institutions
Numbers 30 86 200
Conditions
Generates more than 50% revenue by itself
& 50 or more employees
Generates less than 50% revenue by itself
& 50 or more employees
Other than Public Companies and Quasi-governmental Institutions
Examples Korea Electric Power
Corporation, Korea Expressway Corporation
National Pension Service, Korea Transportation Safety
Authority
Government-funded research institutions,
National University Hospital
Designation and Classification of SOEs

Inefficiency Issues of SOEs
Lack of Control by the government
Want of Accountability Soft budget constraint Lack of motivation
Korea has conducted performance evaluation since 1984

Establish a responsible management system by minimizing government intervention
Solid government control Granted autonomy and
Subsequent performance evaluation
A fair and objective performance evaluation to establish autonomous and responsible management system each
year
the most influential policy
for monitoring public institutions
Goal of the Performance Evaluation System

• Cyclic assessment
• Based upon evaluation indicators
• Performance-based payments
• Successive business plans
Performance Evaluation


Transition of Performance Evaluation System
Performance evaluation on public corporations
Performance evaluation on public corporations
Performance evaluation on quasi-governmental
organizations
Performance evaluation on Public institutions
’84 ~ ’03 ’04 ~ ’07 ’08 ~ Current
Act on the Management of Public Institutions(2007)
Stage I Stage II Stage III
9
Act on the Management of Government-Affiliated Institutions (2004)

MoSF organizes an independent performance evaluating team consists of experts in public administration, business and various industries
A temporary team consists of approximately 160 experts
Most of them are research analysts, CPAs, or professors in the field of public administration, business mgmt and industries
Evaluation team is organized in February each year, the team executes the evaluation from March to June
Ministry of Strategy and Finance (MoSF)
Performance evaluation team
Who Will Do the Evaluating? Institutions responsible for the performance evaluation

Target of Performance Evaluation Procedures of the Performance Evaluation
Performance Evaluation Periods
Evaluating performance of year 2014
2013 2015 2014
Evaluation criteria, indices, evaluation manual published Operation
Conduct the evaluation of the 2014 performance
Evaluation Period : March 2014 ~ June 2014


Technique of the Performance Evaluation
Qualitative Assessment Quantitative Assessment
Detailed performance evaluation criteria and methods are stated in the evaluation manual
Evaluate the performance result out of 9 grades
Set the performance targets numerically
Determine the grade by comparing the quantitated performance targets and the actual performance
By applying a variety of statistical techniques to calculate the performance score Determine the performance grade by
the collective decision-making process
Conclude the final score and grade

Ratio Shifts between quantitative/qualitative assessment
The ratio of the quantitative to the qualitative keeps changing
Quantitative assessment enables an objective performance evaluation
Qualitative assessment is rather subjective but suitable for evaluating public goals
65 65 57.5 57.5 60
55 55 52.5 50 50 50 50 45
50 45 45 45 45
32 36
40 40 40 45
35
45 50
55 60 60
55
65 65
35 35 42.5 42.5 40
45 45 47.5 50 50 50 50 55
50 55 55 55 55
68 64
60 60 60 55
65
55 50
45 40 40
45
35 35
0%
10%
20%
30%
40%
50%
60%
70%
80%
90%
100%
Quantitative Qualitative

2013년 평가지표와 가중치 (공기업, 준정부기관) Evaluation Indices and Weights (2015 Public Corporations)
15
Criteria Evaluation Indices
Submitting Long-term Finan
cial Management Plan
Not Submitting Long-ter
m Financial Managemen
t Plan
Qual. Quant. Qual. Quant.
Business M
anagement
1. Business Strategy and Social Contribution
-Strategic Planning 2 2
-General Public Recognition 2 2
- Goverment 3.0 1 1.5
- Disclosure of Management Information 1 1.5
- Government-recommended Policy 5 5
2. Operation Efficiency 8 8
3. Management of Organization, HR, and Performance 2 3
4. Financial Budget Management Performance
-Budget Management 3 6
-Outcome of Self-directed Financial Restructuring 6
-Budgeting Performance
6
6
(Reduction in debt) -2
(Outcome of Long-term Financial Improvement Efforts) -2
-Management Cost 2 3
5. Management of Remuneration and Benefits
-Remuneration and Benefits 6 6
-Increase Rate of Total Labor Cost 3 3
-Labor Relations 3 3
Subtotal 22 28 20 30
Main Busine
ss Comprehensive Evaluation of business plan, operation, and output 13 37 15 35
Total 35 65 35 65

Evaluation Indices and Weights(2015 Quasi-Gov. Inst. (Entrusted Type))
Criteria Evaluation Indices
Submitting Long-term Fina
ncial Management Schedu
le
Not Submitting Long-term
Financial Management Sc
hedule
Qual. Quant. Qual. Quant.
Business Ma
nagement
1. Business Strategy and Social Contribution
-Strategic Planning 2 4
-General Public Recognition 2 2
- Goverment 3.0 1.5 1.5
- Disclosure of Management Information 1.5 1.5
- Government-recommended Policy 5 5
2. Operation Efficiency 6 6
3. Management of Organization, HR, and Performance 2 3
4. Financial Budget Management Performance
-Budget Management 3 4
-Outcome of Self-directed Financial Restructuring 6
-Budgeting Performance 6 4
(Reduction in debt) -2
(Outcome of Long-term Financial Improvement Efforts) -2
-Management Cost 3 6
5. Management of Remuneration and Benefits
-Remuneration and Benefits 6 6
-Increase Rate of Total Labor Cost 3 4
-Labor Relations 3 3
Subtotal 22 28 20 30
Main Busine
ss Comprehensive Evaluation of business plan, operation, and output 13 37 15 35
Total 35 65 35 65

Evaluation Indices and Weights (2015 Quasi-Gov. Inst. (Fund-managing Type))
Criteria Evaluation Indices
Submitting Long-term Fin
ancial Management Sche
dule
Not Submitting Long-term
Financial Management Sc
hedule
Qual. Quant. Qual. Quant.
Business
Managem
ent
1. Business Strategy and Social Contribution
-Strategic Planning 2 4
-General Public Recognition 2 2
- Goverment 3.0 1.5 1.5
- Disclosure of Management Information 1.5 1.5
- Government-recommended Policy 5 5
2. Operation Efficiency 4 5
3. Management of Organization, HR, and Performance 2 3
4. Financial Budget Management Performance
-Budget Management 3 4
-Outcome of Self-directed Financial Restructuring 6
- Reduction in debt 1
- Outcome of Long-term Financial Improvement Efforts 1
(Managment and Performance of Fund Operation) 5 5
- Management Cost 4 6
5. Management of Remuneration and Benefits
-Remuneration and Benefits 6 6
-Increase Rate of Total Labor Cost 3 4
-Labor Relations 3 3
Subtotal 22 28 20 30
Main Busi
ness Comprehensive Evaluation of Business Plan, Operations, and Output 13 37 15 35
Total 35 65 35 65


2012 2013
Grade Distributions
Grade is determined by converting scores into 100 scale
Divided into six grades; S (Superior), A, B, C, D, E (Inferior)
Performance Evaluation Results
0
20
40
60
80
100
120
Total S A B C D E
111
0
16
40 39
9 7
0
20
40
60
80
100
120
Total S A B C D E
117
0 2
39 46
19
11

How the evaluation results are used Use of Evaluation Results
Individual
Institutions CEO
Employees
Consulting
Incentive/
Dismissal
Incentives
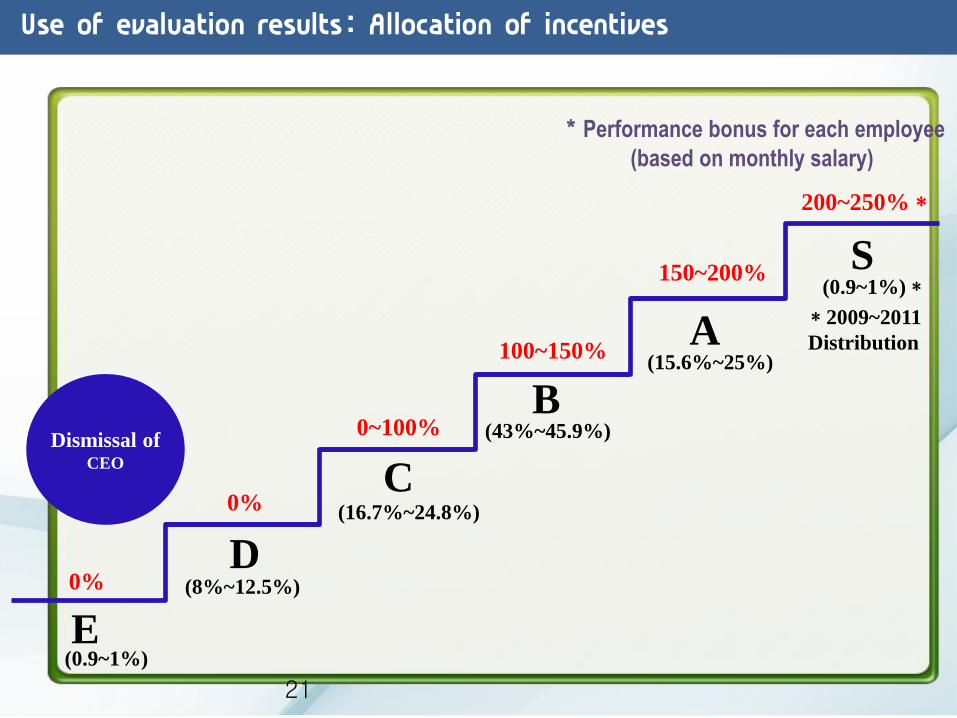
How the evaluation results are used Use of evaluation results: Allocation of incentives
Dismissal of CEO
A
B
C
D
E
0%
0%
0~100%
100~150%
150~200%
(0.9~1%)
(15.6%~25%)
*2009~2011
Distribution
(8%~12.5%)
(16.7%~24.8%)
(43%~45.9%)
200~250%*
S (0.9~1%)*
*Performance bonus for each employee
(based on monthly salary)
21


• Monitoring scheme - Proactive input administration - Reactive output evaluation
• Competition & Improvement
• Achievement-oriented culture
• Stabilized and structured Monitoring system
• Feedback and consultation based on the performance evaluation
result
Limitations Accomplishments of the Performance Evaluation

• Setting up the evaluation system by the laws and
regulations
• Attractive incentives & Penalties
• Rich understanding on the institutions
• Independence and neutrality • Target for a continuous improvement
• Feedback and collecting opinion
Limitations Factors of success

• 1-year basis: Short-term performance
• Institutions ’characteristics vary
• Determine the evaluation grades in comparison with the other public institutions
• Subjectivity in the assessment
• Complaints against the expertise of the evaluation team
• Costs
• Too much concerns on the result
Limitations Limitations & Considerations


Myanmar SOEs : Corporate
Governance
Implementation and
Implication
Khine Khine Nwe
Joint Secretary General, UMFCCI
4 November, 2015, Hanoi, Vietnam

Myanmar: Macroeconomic
Overview General Statistics
Population (2014) 51.4 million
Area 676,578 sq. km
Macroeconomic Indicators
GDP (US$) $56.8 Billion
Real GDP Growth (IMF estimate) 8.7%
GDP Per Capita (USD) 1113
Balance of Payment (2013-2014)
Exports (US$), fob $12.2 billion
Of which, Gas exports’ composition $4.2 billion
Imports (US$), cif $14.8 billion
Balance -$2.6 billion
Number of existing SOEs 44 (?)

SOEs : PRE - 2012 ERA
Nationalization : The Myanmar economy virtually
became one big state owned enterprise in the Ne Win
era beginning in 1962.
Military-led Government : The failure of this Myanmar’s
way to socialism came to an end in 1988 with a
declaration of its support for market-oriented economic
growth.
Privatization : A process of privatizing state enterprises
proceeded in waves over the next 23 years. Still, SOE
sector remained significant until end of military rule in
2011.

POST - 2012 ERA
Democratic Government : The elected President U Thein Sein
launched an ambitious program of peace building, democratic
institution building and economic reforms.
Myanmar SOE sector is underperforming in 2 major ways.
(1) Its financial returns are well below potential
(2) The quality of its goods and services is generally inferior to
those offered by private sector competitors.
Privatization and corporatization of SOEs was and still is one of
the government’s priorities, the strong intent attracted
international institutions’ interest which in following years,
becomes a strong supporter and enhancer in the SOEs’
corporatization process of the country, yet common policies or
procedures still need to define.

President’s 2nd wave speech
June 2012 : “We must trim down uneconomical and redundant
enterprises and cut expenses while shrinking the state-owned
business sector and encouraging privatization.”

FESR (2012) and NCDP (2015 ?)
FESR (2012) : Specific actions regarding corporatization of SOEs
along with the objective of keeping the government’s “fiscal
regime in order” were explicitly described and presented to
Development Partners at 1st MDCF in January 2013.
NCDP (2015?) : It is widely expected to include ambitious
measures for improving the performance of SOE sector and is
scheduled to be presented to the legislature for approval.

Strong supporting statement
of policy
On Ministry of Finance website, Budget Department page :
SOEs no longer have automatic access to the
budget to cover their deficits starting from FY 2012-13. Any deficit
financing requires cabinet approval and enterprises incurring
deficits are to be privatized or corporatized.
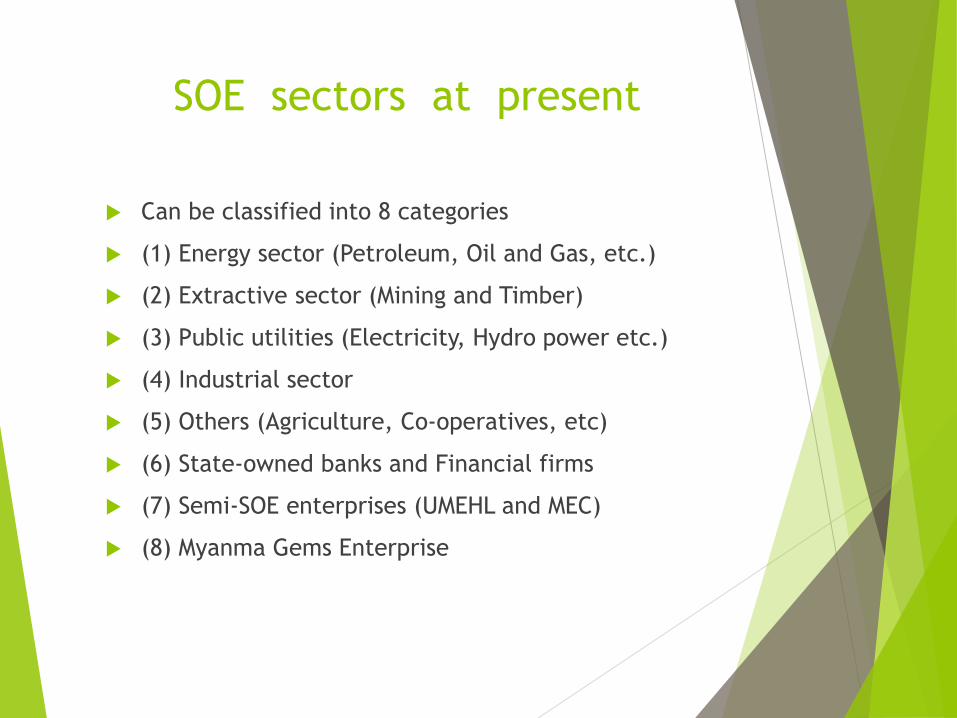
SOE sectors at present
Can be classified into 8 categories
(1) Energy sector (Petroleum, Oil and Gas, etc.)
(2) Extractive sector (Mining and Timber)
(3) Public utilities (Electricity, Hydro power etc.)
(4) Industrial sector
(5) Others (Agriculture, Co-operatives, etc)
(6) State-owned banks and Financial firms
(7) Semi-SOE enterprises (UMEHL and MEC)
(8) Myanma Gems Enterprise

Reforms on State-Owned enterprises Myanmar has been undertaking a long-term plan to privatize or
corporatize state-owned enterprises in various sectors since
early 1990s, but then, without much success.
One of several key priorities of the government for economic
reforms is the development of the private sector, and efforts to
continue to corporatize the remaining state-owned enterprises
and privatize them keep continuing.
Corporatization of State-owned Telecommunication
Company, MPT, is one role model in Myanmar which has
been broadly appreciated by locals and internationals, which
is now competing in the market with two other international
firms, Telenor and Ooredoo.
The Yangon City Electric Distribution Board is now under
planning to be corporatized.
Myanmar remains committed to private sector development,
and is also working to reforming legislative measures to
ensure that SOEs as well as other private sector businesses
would be able to compete effectively in most sectors,
except in areas of national strategic importance.

Capital Market & Financial
Reform & Development Since the elected government took office, in 2011, Myanmar
first reformed its currency exchange regime, moving from a
fixed rate to a managed-floating rate system. This is just
the beginning of a long process of financial reforms.
In addition, the financial reforms are also underway.
In October 2014, nine foreign banks were given license to
operate in Myanmar.
In addition, the local banks also undertook a series of
expansions in their own operations.
In 2013, Myanmar saw the wide-spread utilization of ATMs and the
arrival of Master Card and Visa Card.
The local banks have also expanded the number of branches opened
to serve the population better.
The Bank & Financial Institution Law is also expected to be
passed by parliament.

Capital Market & Financial
Reforms
Myanmar is also preparing to initiate operations for the
capital market by December 2015.
Relevant Rules and Regulations for the operation of the
capital markets are expected to be passed in the near
future.
With the onset of the financial markets, private sector
as well as the SOEs are keenly interested in
participating in the capital markets.

The importance of Good practices
with SOEs
Good practices with State Owned Enterprises lead big gains to
the country’s economy and improve the capacity of the sector
while ineffective practices can inhibit private sector
involvement, waste country’s budget, stimulate bribery and
seeking opportunity for one’s own sake

Corporatizing MPT:
Myanmar’s good performance experience
• Liberalization of Myanmar Telecommunications sector
under Ministry of Communications and Information
Technology since 2013
• In the process of transforming, MPT (State-owned
operator) has been corporatized, firstly into 100%
government owned company.
• To maintain its competitiveness and role, government
strived to transform MPT into a commercially oriented
company.
• Entering into a Joint Operating Agreement with a
Japanese consortium of KDDI and Sumitomo Corporation
since July 2014, whose set-up and operation is approved
by MIC.

Steps towards Corporatization
MPT needs assistance to become an autonomous
commercial telecommunications operator.
Government requested World Bank assistance to support MPT’s transition from a government department to a corporate entity that is able to operate successfully in a competitive market with quality.
MPT is registered as 100% State Owned Corporate Entity only for Administrative purpose.
But its telecommunication business is planning to be registered under the Companies Act as a state owned commercial entity.
World Bank is providing technical support for the corporatization process.
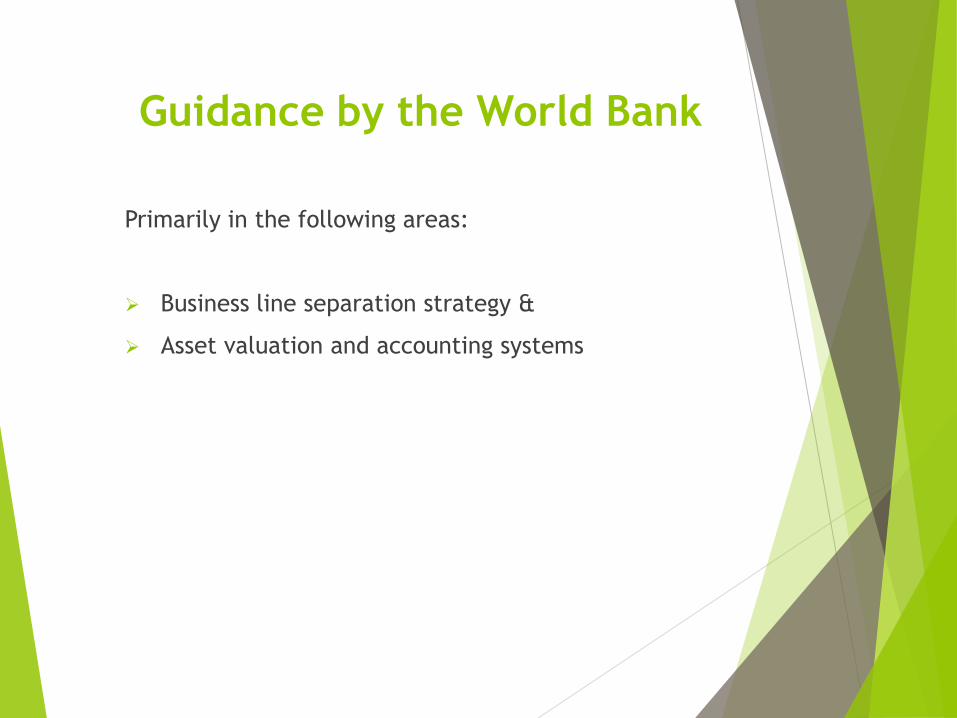
Guidance by the World Bank
Primarily in the following areas:
Business line separation strategy &
Asset valuation and accounting systems

Activities in MPT’s
corporatization process
A . Define and detail the strategic and business
objectives
B. Develop the chart of accounts and opening
balance sheet for the corporatized entity based
on internationally acceptable standards.
C. Support for Human Resource Management

A. Define and detail strategic and
business objectives
Clear vision and mission
Identify short, mid and long term specific, measurable,
reasonable and achievable commercial goals
Realistic milestones and timelines for achievement of
each goals
Designing high level strategic plan, business plan for
next 10 years
Outline service and performance standards for the
corporatized MPT
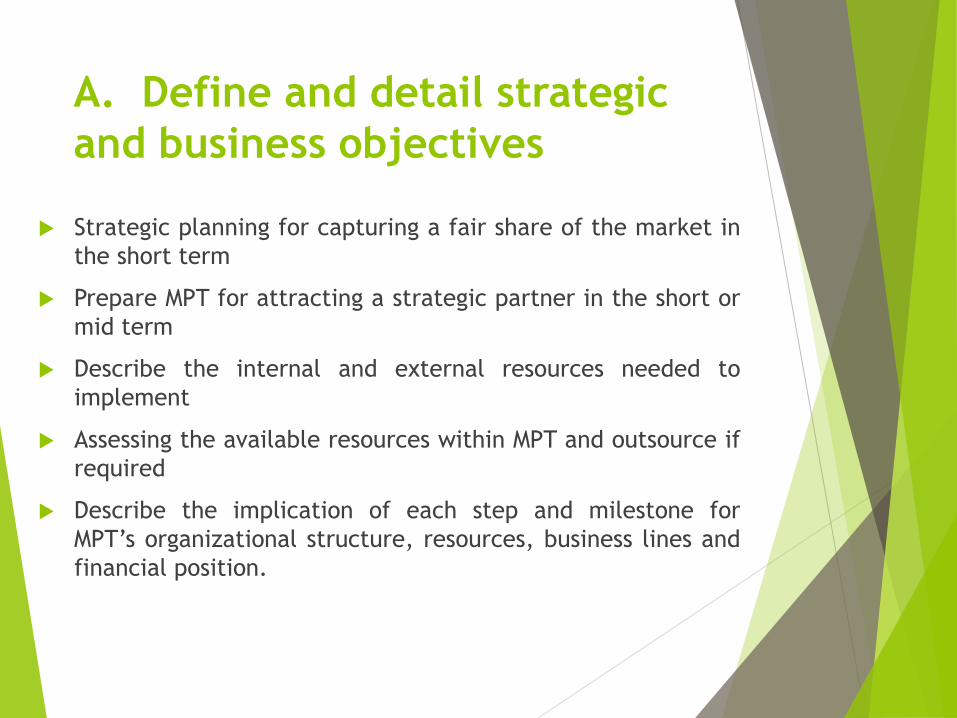
A. Define and detail strategic
and business objectives
Strategic planning for capturing a fair share of the market in
the short term
Prepare MPT for attracting a strategic partner in the short or
mid term
Describe the internal and external resources needed to
implement
Assessing the available resources within MPT and outsource if
required
Describe the implication of each step and milestone for
MPT’s organizational structure, resources, business lines and
financial position.

A. Define and detail strategic
and business objectives
Describe the human, budgetary and time resources
needed to implement each step and to achieve each
milestone
Design detailed project management plan etc…

B. Develop the chart of accounts and opening
balance sheet for the corporatized entity
based on internationally acceptable standards
Drafting Financial Guidelines
Prepare Chart of Accounts for MPT
Support MPT to transfer its financial systems into
internationally acceptable practice
Training finance staff across MPT on relevant accounting
standards etc…

C. Support for Human Resource
Management
Planning an organizational reform for
enforcing strong governance
Designing a staffing plan
Defining the nature, cost, length, and depth of the training for internal human resources
Designing the organization structure and Roles and responsibilities for stall
Drafting staff management guidelines
Drafting forms of employment contract etc…

Another Example of SOE Reform-
Myanma National Airways
While the previous example of MPT’s corporatization
illustrates key outcomes and achievements serving as a
guideline and framework for future SOE corporatization
and reforms, another example also exists:
Myanma National Airways also underwent corporatization.
While MNA undertook corporatization, the internal
structure and management remains without much
changes.
In this regard, much can still be undertaken to take key
insights gained from MPT’s corporatization process here.

Conclusion
As part of Myanmar’s economic reforms, Myanmar has
undertaken various reforms to the existing SOEs in order
to improve the country’s economy, as well as improve
the efficiency and effectiveness of government’s
functions and budget.
In this regard, various experiences and examples are
also generated in our path serving as guidelines and
insights for future direction.
With an aim for improving efficiency of operations,
and focusing on good corporate governance, much
efforts were undertaken and achieved.
As highlighted by our examples, there’s still much to
improve upon, but with key insights gained from our
experiences, we are committed to the continued
improvement of the overall economy, and to improve
the efficiency of our SOEs and to align them with the
existing market conditions and the needs of our
consumers.

Thank You Khine Khine Nwe
Joint Secretary General
UMFCCI

Session 4
Good Practices of Performance Management of SOEs of Asia
PSCs PERFORMANCE PAKISTAN
By: Abdullah Yusuf
Chairman Public Sector Committee (ICAP)
Member IPSAS Board (IFAC)

I. PSCs – Current Status
II. Questionnaire - Answers
III. Global Best Practices
PRESENTATION OUTLINE
1.1 Definition 1.2 History 1.3 Classification 1.4 Employees 1.4 Performance 1.6 Boards Composition
IV. Way Forward

PART-I CURRENT STATUS OF PSCs

1.1 Definition: Public Sector Company (PSC)
“Public Sector Company” means a company, whether public or private, which is directly or indirectly controlled, beneficially owned or not less than fifty percent of the voting securities or voting power of which are held by the Government or instrumentality or agency of the Government or a statutory body, or in respect of which the Government or any instrumentality or agency of the Government or a statutory body, has otherwise power to elect, nominate or appoint majority of its directors, and includes a public sector association not for profit, licensed under section 42 of the Ordinance.”
Public Sector Companies (Corporate Governance) Rules, 2013

Nationalization Policy 1970s
Signaling System
introduced
Experts Advisory Cell (EAC)
Privatization of Industrial PSCs
in 1990s
1947 1970 1980 1983 1990
12 PSCs
2002
EAC merged with Engineering
Development Board (EDB)
2000 2014
170 PSCs
257 PSCs
Line Ministries are responsible
for PSCs Monitoring
Source: Istaqbal Mehdi (1991) Privatization-A Device for Reforming Public Enterprises in Pakistan. The Pakistan Development Review, 30:4, pp 895-905.
1.2 Evolution of PSCs Governance in Pakistan

Public Sector Governance
PIFRA: One of the milestone achieved in Public Sector is PIFRA (Project to Improve Financial Reporting and Auditing) aimed at improving the governance in fiscal management sphere to achieve the vision of strengthened Integrated Financial Management. The project is included in Medium Term Development Framework (MTDF) 2005-10 Four Components of PIFRA are: - Financial Accounting and Budgeting System (FABS) - Capacity Building of Auditor General’s Office - Capacity Building of Controller General of Accounts’ Office - Project Management Output: • Consolidated statements of all Government Departments both quarterly and
annually
Project to Improve Financial Reporting and Auditing (PIFRA)

122
Commercial PSCs
48
Non-Commercial PSCs 170
PS
Cs
(17
0)
Commercial
(122)
Under Companies Ordinance, 1984
(116)
Under Special Enactment
(6)
Non-Commercial
(48)
Under Section 42 of Companies Ordinance, 1984
(47)
Under Special Enactment
(01)
1.3 PSCs - CLASSIFICATION

Incorporation Structure based Classification
163 Entities under
Companies Ordinance, 1984
Listed Public Limited Companies
8
Unlisted Public Limited Companies
51
Private Limited Companies
59
Section-42 Companies (Not-for-Profit)
45
7 Entities under
Special Enactment
Listed Public Limited Companies
3
Unlisted Public Limited Companies
3
Non-Commercial PSC
1
1.3 PSCs - CLASSIFICATION

ENERGY Hydrocarbons Power
12 I8
FINANCIAL 24
INDUSTRIAL & ENGINEERING 18
TRADING 3
PROMOTIONAL & ADVOCACY 51
SERVICES 17
TRANSPORTATION 27
Sectoral Classification
1.3 PSCs - CLASSIFICATION
Total PSCs: 170

M/o Petroleum & Natural Resources
15
M/o Water & Power
24
M/o Commerce and Textile Industry
16
M/o Industries and Production
35
M/o Finance, Revenue, Economic Affairs, Statistics and Privatization
21
M/o Ports & Shipping
20
M/o Railways
3
M/o Information Technology and
Telecommunication
5
M/o National Food Security and Research
3
Cabinet Secretariat
9
M/o Information, Broadcasting and National Heritage
3
M/o Housing and Works
3
M/o Science & Technology
1
M/o Overseas Pakistanis and
Human Resource Development
2
M/o Communication
1
M/o Inter Provincial Coordination
1
M/o Defence Production
1
Ministry based Classification
1.3 PSCs - CLASSIFICATION
M/o Inter Provincial Coordination
7

218,527
Source: Responses from Line Ministries and PSCs
1.4 PSCs – Employees Distribution
Hydrocarbons (14%)
Power (45%) Financial (14%)
Industrial & Engineering
(9%)
Trading (7%) Services (8%)
Promotional & Advocacy (1%)
Transportation (1%)
Sector-wise Distribution

FY13 Rs. 5,631 bn 25.0% of GDP
FY13 Rs. 3,947 bn 17.6% of GDP
FY13 Rs. 153 bn 0.7% of GDP
FY14
Rs.6,510 bn 25.6% of GDP
FY14
Rs. 4,288 bn 16.9% of GDP
FY14
Rs. 216 bn 0.9% of GDP
Total Assets Net Revenue Net Profit*
FY13 Rs. 60.6 bn
FY14
Rs. 52.9bn
Dividend to GoP
FINANCIAL HIGHLIGHTS (PSCs) – FY13 & FY14
1.5 PSCs PERFORMANCE
*It shows aggregate net Profit/Loss of PSCs Portfolio, as reported in their Financial Statements.

Grants Loss of Loss making PSCs
Subsidies Profit of
Profitable PSCs Net Position
*Subsidies released during the year. However, the reported subsidies (in DISCOs) amounted to an estimate of Rs. 340 bn and Rs. 258 bn in FY13 and FY14 respectively. Therefore, the difference in the profitability of PSCs portfolio is mainly because of the reported and actually released subsidies during the two years.
Net Position of Public Sector
1.5 PSCs PERFORMANCE
2013 2014 (Rs. bn)
No. Amount No. Amount
Profit generating PSCs 77 218 88 268
Loss making PSCs 62 (426) 49 (353)
Subsidies* 271 269
Grants 2
NET POSITION 65 184

Grants Guarantees Subsidies Loans GoP Support
Source: Corporate Finance Wing; Debt Wing; Economic Affairs Division (EAD)
GoP Support to PSCs
GoP Support during FY14
Rs. 373 bn 1.9% of GDP
24
80
269
0 0
50
100
150
200
250
300
Loans Guarantees Subsidies Grants
1.5 PSCs PERFORMANCE

A. Board Members B. Chairman
Gender Distribution (FY14)
Source: Responses from Line Ministries and PSCs
Commercial
Male (96%)
Female (4%)
Non-Commercial
Male (91%)
Female (9%)
Non-Commercial
Male (79%)Female (21%)
Commercial
Male (97%)Female (3%)
1.6 PSCs – BoDs Composition

PART-II ANSWERS TO
QUESTIONNAIRES

Part I: General Framework of the SOE Sector
Sr. No. QUESTIONS ANSWERS
1.1 Define SOEs As given by Public Sector Companies (Corporate Governance) Rules, 2013
1.2 SOEs Classification • Legal Form • Companies Ordinance, 1984 • Special Enactment
• Commerciality • Commercial • Non-Commercial
1.3 SOEs Ownership One Designated Government Ministry exercises the ownership function as well as coordinating power Other entities involved are: - Regulatory Bodies - Securities & Exchange Commission of Pakistan (SECP)
1.4 Specific Legislation for SOEs Management
- Companies Ordinance, 1984 - Corporate Governance Rules, 2013

Part II: General Framework of the Performance
Evaluation System of SOEs
Sr. No. QUESTIONS ANSWERS
2.1 Performance Monitoring & Evaluation system for SOEs
Currently, there is no proper monitoring and Evaluation System for PSCs

Part III: Various Aspects in practicing the Evaluation System of SOEs
Sr. No. QUESTIONS ANSWERS
3.1 Legal Framework for Performance Monitoring & Evaluation system for SOEs
Currently, there is no proper monitoring and Evaluation System for PSCs
3.2 Authorized agency to manage the Performance Monitoring & Evaluation system
3.3 Is evaluation consist of more than one evaluation
3.4 Evaluation Period
3.5 Evaluation is based on Evaluation Indicators
3.6 Publishing of Annual report with consolidated performance Information
Part III: Various Aspects in practicing the
Evaluation System of SOEs
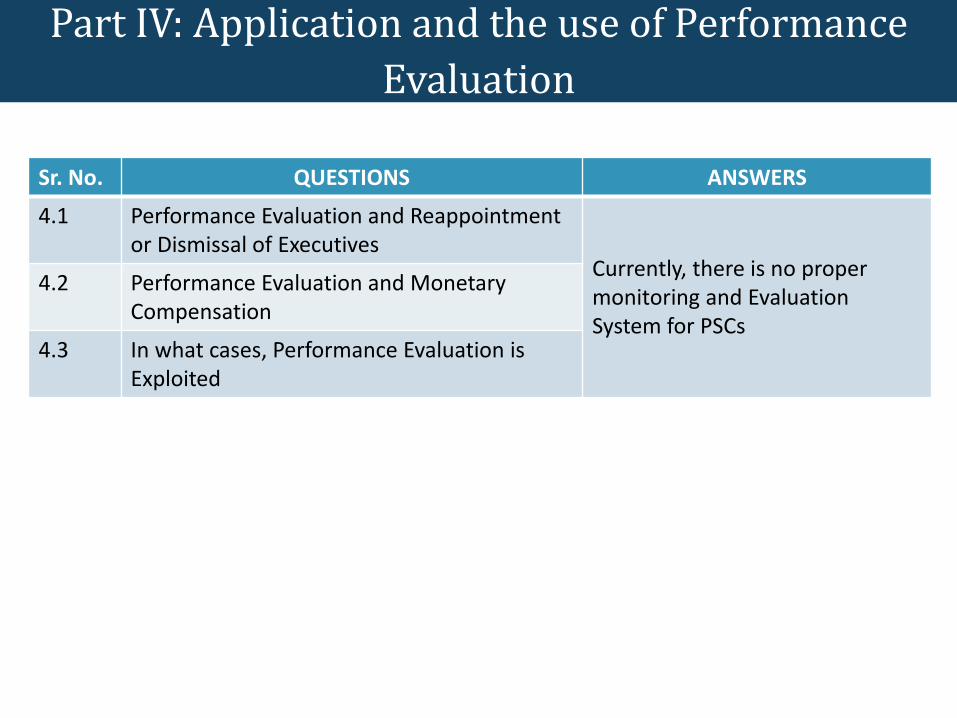
Part IV: Application and the use of Performance
Evaluation
Sr. No. QUESTIONS ANSWERS
4.1 Performance Evaluation and Reappointment or Dismissal of Executives
Currently, there is no proper monitoring and Evaluation System for PSCs
4.2 Performance Evaluation and Monetary Compensation
4.3 In what cases, Performance Evaluation is Exploited

Part V: Absence of Performance Evaluation System
Sr. No. QUESTIONS ANSWERS
5.1 Designated Entity evaluate or monitor aspects of SOEs performance
SECP is responsible - to ensure information disclosures in compliance with
international reporting standards. - To issue guidelines and rules to improve Corporate Governance
practices in SOEs for the implementation of Corporate Governance Rules, 2013.
5.2 In case of delegation of ownership rights, how entities are monitored
In case of Subsidiaries, Holding Companies prepare and submit their Consolidated and unconsolidated information both quarterly and annually.
5.3 Monitoring system varies for Commercial and Non-Commercial SOEs
Yes, it varies. Since their purpose of operations are different.
5.4 How often, State entities monitor or assess performance
It is obligatory for SOEs to prepare their Financial Statements on quarterly and annual basis and submit these to SECP. However, Line ministries can monitor and assess their performance at any time.
5.5 Supplementary information about the procedures actually in place
No proper procedures are actually in place. However, There are several other layers for reporting and monitoring: - Ministry of Finance - SECP - Sectoral Regulatory bodies

PART-III Global Best Practices

International Practices: Focus on CG, clarity of roles & authorities and autonomy
• Independent central bodies to oversee and supervise affairs of SOEs in the forms of holding companies (Singapore’s Tamasak Holding); central shareholding (Malaysia’s Khazana model), dedicated departments (India’s Department of Public Enterprises); and central monitoring authorities (New Zeeland’s Crown Monitoring Authority)
• Performance contracting between the government and SOE in India.
• MoU system India and • Signaling System Pakistan (1980-2003) • Sound legal and regulatory frameworks for corporate
governance. - Finland’s Management of State Capital Act 2007,
- Hungary’s State Asset Law 2007,
- New Zeeland’s State-owned Enterprises Act 1986 and
- Philippine’s Government-owned and Controlled Corporation Act 2010

SOEs segregated into • Crown Entities (non-commercial) governed under Crown Entities
Act 2004 • State Owned Enterprises (commercial) governed under New
Zealand State Owned Enterprises Act 1986
Acts require entities to prepare a Statement of Intent stating • strategic objectives over a 4-year period • scope of operations • performance targets
to be presented to the concerned Minister and revised at least once every 3 years.
Each SOE has two shareholding Ministers - one is the Minister of Finance and the relevant portfolio Minister
BoDs of an SOE are accountable to the shareholding Ministers for the performance of SOE
1. Role of Treasury – New Zealand

Established in 1986
Goal is improving performance through autonomy based accountability
Beginning in 2007, the Department of Public Enterprises (DPE) required all Central Public Sector Enterprises to have a MOU
The contents of each MOU include: • a mission statement; • the objectives of the enterprise; • areas where power has been delegated to the enterprise; • performance targets; and • commitments from the government to the enterprise.
A balanced-scorecard approach is used for MoU Evaluation, with 50 percent of the weight given to financial targets and 50 percent to nonfinancial targets.
Performance is measured on a five-point scale, ranging from excellent (1) to poor (5) for each target area
Performance incentives include • monetary payments • excellence awards for the best-performing enterprises • and excellence certificates by the Prime Minister
2. MoU System - India

Investment Company (Ministry of Finance, sole shareholder) holding a portfolio of Public Sector Companies
Operates under Singapore Companies Act It operates like any other commercial entity, withy
ultimate objective to maximize shareholder return Pays taxes to Tax authorities Distribute dividends Own Board of Directors and a professional management team
Neither the President of Singapore nor the shareholder, the Singapore Minister for Finance, is involved in their business decisions
Business decisions are centered on following themes: Transforming Economies; Growing Middle Income Populations; Deepening Comparative Advantages; Emerging Champions
3. Tamasek – Singapore

Investment Fund, owned by the Finance Minister (Government) with an investment portfolio of 50 major public companies
Incorporated in 1993 as a public limited company under the Companies Act, 1965
Mandate is shareholder value creation, efficiency gains and enhance corporate governance in SOEs, commonly known as Government-Linked Companies, or GLCs
Khazanah ensure that adequate key systems and controls are in place and with that, influence the evolvement of the industry structures by optimizing the competitive and regulatory landscape
4. Khazanah– Malaysia

1. RESTRUCTURING
Corporate & Financial Governance
2. CORPORATIZATION
Legislative Amendments
Effective application of Companies Ordinance 1984, CG Rules 2013, and listing regulations (where applicable)
3. DISINVESTMENT
Privatization through Strategic Partnership
Direct sale of assets/ entities
Public offerings on domestic and international capital markets
Cabinet Committee on Privatization (CCoP) approved a list of 39 entities for Privatization in the next two years
10
Way Forward: Pillars for Strengthening PSCs

Restructuring of Boards
Induction of CEOs and Management
Development of operational restructuring /
turn around plans by respective Boards & CEOs/Mgt
Implementation of turn around plans
Periodic monitoring and review of implementation
Approval by Government
29
1. Key Steps in Restructuring

I. Board Composition and Dynamics
• Have 40% independent directors within 2 years of the notification of the Rules and a majority subsequently.
• Recommend three individuals to the GoP for appointment as chief executive.
• Appoint the chief executive after receiving concurrence of the government in line with the provisions of the Ordinance.
II. Formation of Special Committees of the BoD
• Human resources, nomination procurement, risk management and audit committees respectively.
III. Separation of the Chair from the CEO
Salient Features of the Rules
30
2. Corporate Governance Rules, 2013

IV. Chief Financial Officer, Company Secretary and Chief Internal Auditor
• Every PSC shall appoint a CFO, company secretary and chief internal auditor, as per prescribed criteria.
V. Formulation and compliance with a ‘Code of Conduct’
BoD to prepare & implement a code for its directors and employees, based on following principles:
• Probity and propriety;
• Objectivity, integrity and honesty;
• Relationship with the stakeholders.
VI. Capacity building of board of directors and PSC transparency:
• Undergo trainings and obtain certifications in appropriate fields by local or foreign institutions.
• External Audit.
• Ensure that its annual accounts are audited by an independent external auditor in line with requirements of Companies Ordinance 1984. 31
Salient Features of the Rules

• Improve corporate governance including transparency and disclosures by SOEs
• Advocacy and communication for benefits of private sector capital mobilization through various modes
• Improve quality of regulatory framework
• Strengthen contract enforcement for commercial disputes.
• Separate courts need to established for commercial disputes
• Separation of policy, regulations and operations in selected sectors including aviation, shipping and rail sector.
• Deepen and strengthen capital markets
3. Pre-Conditions for attracting Private Investment

THANK YOU

Performance Governance of State-Owned Enterprises in the Philippines
Presentation to the OECD The Asia Network on Governance of SOEs Ha Noi, Vietnam 17 November 2015 By CHAIRMAN CESAR L. VILLANUEVA Governance Commission for GOCCs

Overview • State-Owned Enterprises (known as “GOCCs” in the Philippines) are
created by law (special charter) or under the Corporation Code
• GOCCs are created to address market failures (i.e. natural monopolies, underserved industries/sectors, social security)
1965 : 37 GOCCs
1981 : 212 GOCCs
1984 : 303 GOCCs
1988 : Reform Program
1992 : 166 GOCCs
2011 : 157 GOCCs
2015 : 102 GOCCs
Source: 2008 Study by the Asian Development Bank, GCG
Overview of the GOCC Sector 2014
Assets of the GOCC Sector In USD Billion
138.11
Revenues of the GOCC Sector In USD Billion
20.65
Revenues as % of GDP 7.59%
Personnel (est.) 80,000
2

Classification of GOCCs
SECTOR In USD Million
Assets Liabilities Revenues Program
Subsidies
Net
Income*
Financial Institutions and
Social Security 84,005 38,777 13,568 938 5,152
Trade, Area Dev’t, Tourism 6,700 1,966 1,232 613 121
Education and Culture 370 40 24 1 (1)
Gaming 1,175 659 1,679 - 149
Energy and Materials 32,604 23,314 2,027 313 167
Agriculture 1,117 3,971 1,053 140 (8)
Utilities and Communications 12,146 6,577 1,068 34 283
TOTAL 138,117 75,304 20,651 2,039 5,863
3

Ownership Framework The State as Owner is represented –
• Primarily by the President of the Philippines
• By the Governance Commission in the specific instances mandated by Republic Act No. 10149:
1. Shortlisting of Candidates for Appointment to the Boards of Directors based on the Fit and Proper Rule
2. Performance Monitoring and Evaluation
3. Setting Standards for Compensation, Incentives and Benefits
4. Rationalizing the Number and Functions of GOCCs pursuant to the Ownership and Operations Manual for GOCCs.
• By the Boards of Directors, who are primarily and directly accountable for corporate governance and performance
4

Hybrid Ownership Model
GCG
GOCC Boards
Management Employees
General Public
President of the Philippines
Departments / Supervising
Agencies
Policy and Program Coordination
Primary Representative of the State as Owner
Republic Act No. 10149 created the GCG as a “central advisory, monitoring, and oversight body with authority to formulate, implement and coordinate policies”
5

Performance Evaluation System for GOCCs
1. Corporate/Organizational: Performance Evaluation System (PES)
Based on Performance Agreements negotiated annually between the GCG and each GOCC Board
Modified Balanced Scorecard format consisting of 8 to 25 measures/performance indicators weights
Complemented by Good Governance Conditions (e.g. Manual of Corporate Governance, Disclosure Requirements)
2. Board Member Level: Performance Evaluation of Directors (PED)
Appointed by the President for one (1) year terms, subject to reappointment based on a performance rating of at least “above average”
6

Corporate Level: Performance Negotiations
• Submission by GOCC based on prescribed templates
• Technical Panels: Data Gathering; Alignment; Preparation for the Negotiation
• Principals: High-Level Negotiation with the Boards of Directors of each GOCC
Clear Mission Long-Term
Vision Strategy Map
Balanced
Scorecard
Strategic
Initiatives
Performance
Agreement
1st Quarter 2nd Quarter 3rd Quarter 4th Quarter
• Performance Audit of Previous Year • National Government Budget
Planning for Next Year
• Performance Negotiations: Setting Targets for the Succeeding Year
• Renegotiations
7

Balanced Scorecards for GOCCs
What is the strategic impact of the GOCC in the context of inclusive growth and economic development? What are the measurable breakthrough results in the next 5-10 years?
In what processes do we need to excel to provide excellent service delivery to our stakeholders / customers? e.g. Turn-Around Time, Automation
How do we effectively equip our people to execute the processes that are key to the strategy? e.g. Improvement of human capital based on Competency Framework
How do we ensure the company’s financial viability? What is the outcome of responsible financial stewardship? e.g. EBITDA
Who are our key customers/stakeholders? What critical services do we need to deliver? e.g. Customer Satisfaction Survey Rating
Introduced by GCG
8

DEFINING Strategic Performance
• The PES has enhanced focus of GOCCs in looking past the constraints of existing resources and planning for long-term breakthrough results
• Strengthened GOCCs awareness of their respective areas of influence
9

INDIVIDUAL LEVEL
Evaluating Directors
[CATEGORY NAME]
[CATEGORY NAME] (DPR)
[CATEGORY NAME]
PED COMPONENTS DPR Overview
Categories where Directors are Rated
DPR Breakdown
Knowledge and Personal Development
Preparedness and Participation
Teamwork and Communication
Conduct/Behavior
Chairman’s Appraisal (12.5%)
Peer Appraisal (12.5%)
Self-Appraisal (5%)
60% 30%
10%
An individual board member must receive an overall rating of at least 85% to be eligible for: Inclusion in the shortlist of nominees for the succeeding term
Performance-Based Incentives (% of per diems received for the year)
10

INTITUTING
Performance-Based Pay • A GOCC must achieve a weighted-score of 90% in its
Balanced Scorecard to be eligible to grant Performance-Based Bonuses (PBB) to its Personnel
• Reported scores are validated by GCG prior to authorizing a GOCC to grant the PBB
Performance Bonuses for Personnel Forced Ranking by Personnel Groups:
Distribution based on Percentile Multiple of
Monthly Salary
Top: Maximum 10% Next: Maximum 25% Remaining: Minimum 65% Unsatisfactory rating
2.5 1.5 1.0
None
Senior Management Middle Management Professional & Supervisory Clerical/General Staff
11

INSITUTIONALIZING Strategic Performance Management
Innovation Cycle
• Performance
Analysis • Impact Assessment
and Data Analytics
Clear
Accountability
• Abolition of underperforming GOCCs
• Termination for unsatisfactory performance
Effective
Incentive System
• Financial • Non-Financial
Strategic
Engagement &
Monitoring
• Leadership Commitment: Negotiations with the Board of Directors
• Online reporting
Transparency & Integrity: Good Governance Conditions
12

Reform Results
169.32 120.27
122.89
162.37
323.92
206.90
153.38
311.79
271.37
648.43
561.53
426.98
561.83
14.09 25.20 26.48 47.83
2002 2003 2004 2005 2006 2007 2008 2009 2010 2011 2012 2013 2014
Dividends
OperatingSubsidy
*Social Security Institutions cannot remit dividends
*US$ 51 Million: Total PBB and PBI paid for 2014 across 55 GOCCs as of 29 September 2015
• 85 GOCCs with Performance Agreements (from 80 in 2012)
• 71 GOCCs with Manuals of Corporate Governance and No Gift Policies
• 33 GOCCs with ISO 9001:2008 Quality Management Systems
Subsidies (Operations), Dividends (In US$ Million)
2011 2012 2013 2014
No. of GOCCs 35 39 47 46
Compliance Rate 31% 52% 70% 71%
13

Moving Forward
Enhancing Transparency of Performance and Operational Reports for Public Consumption • Integrated Corporate Reporting System (ICRS) in 2016
• Corporate Governance Scorecard for GOCCs
• Mainstreaming Sustainable Development Reporting in collaboration with the Global Reporting Initiative (GRI)
Continuous Sectoral Evaluation and Restructuring
14

Transforming GOCCs
By 2020, the GCG shall have transformed the GOCC Sector
into a significant tool of the State in the attainment of
inclusive economic growth and development.
2012 2014 2016 2020
Rationalizing the number of
GOCCs in line with the State
Ownership Policy
158 100 94 85
GOCCs Achieving Stakeholder
Satisfaction based on Third Party
Surveys
Not required.
Few GOCCs
measured
stakeholder
satisfaction
56% of GOCCs
adopting Third
Party Surveys
90% of GOCCs
adopting Third
Party Surveys
90% of GOCCs
reporting
Satisfactory
Ratings
Total Comprehensive Income In US$Million *Net of subsidies and unrealized gains/losses
3,404.9 6,121.9
To be
determined
after roll out of
ICRS in 2016
To be
determined
after roll out of
ICRS in 2016
VISION
15

E N D

The 8th Meeting of the Asia Network on Corporate Governance of State-owned
Enterprises
Session 4 Good Practices of
Performance Management in Asia
16th – 17th November 2015
Hanoi, Vietnam
John K M Lim Chairman, Boustead Projects Ltd and
Immediate Past Chairman, Singapore Institute of Directors

2
Good Practices of Performance Management in Asia
• Singapore does not have special regulations for SOEs whose activities are commercial in nature
• All commercial SOEs are corporatised and many are listed
• Performance management and performance evaluation are key areas of focus for both shareholder, board and management.

3
Good Practices of Performance Management in Asia
• Temasek Holdings Pte Ltd
– Main holding company for the Singapore’s Investments in various sectors of the economy
– Formed in 1974 under its Companies Act
– Wholly owned by Minister of Finance
– Manages all assets on commercial principles

4
Performance Measure
• Wealth added in $ terms based on returns against risk adjusted hurdles
• Investments in riskier sectors and markets have higher hurdles
• Wealth added bonus pool

5
Remuneration Philosophy
• Emphasizes long term over short term
• Aligns employee and shareholder interest
• Puts organization above individual

6
Delivering Sustainable Returns over the Long Term

7
Net Portfolio Value – Temasek Holdings

8
Group Net Profit – Temasek Holdings

9
Total Shareholder Returns – Temasek Holdings

10
Geography – Temasek Holdings

11
Sector – Temasek Holdings

12
Market Capitalization or Shareholder Equity – Temasek Holdings
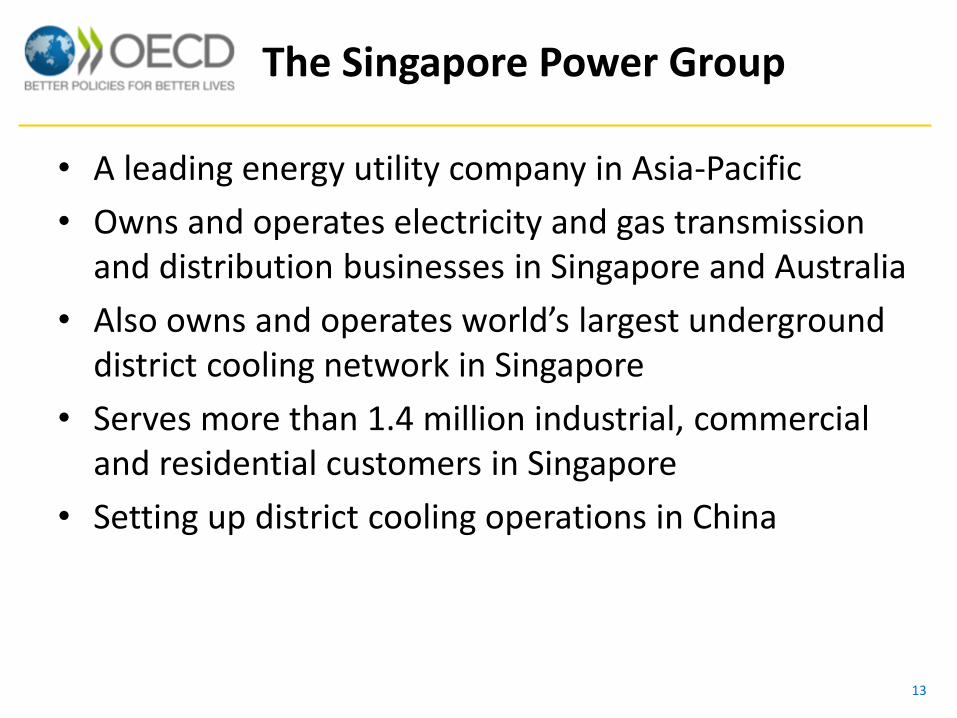
13
The Singapore Power Group
• A leading energy utility company in Asia-Pacific
• Owns and operates electricity and gas transmission and distribution businesses in Singapore and Australia
• Also owns and operates world’s largest underground district cooling network in Singapore
• Serves more than 1.4 million industrial, commercial and residential customers in Singapore
• Setting up district cooling operations in China
14
The Singapore Power Group – Our Mission
We provide reliable and efficient energy utility services to enhance the economy and the quality of life.

15
The Singapore Power Group – Our Values
• COMMITMENT • We commit to creating value for our customers, our people and our
shareholders
• We uphold the highest standards of service and performance
• INTEGRITY • We act with honesty
• We practice the higher ethical standards
• PASSION • We take pride and ownership in what we do
• TEAMWORK • We support, respect and trust each other
• We continually learn, and share ideas and knowledge

16
Financial Highlights

17
Financial Highlights

18
Financial Highlights

19
Performance Measurement
• Commercial
• Operations
• People
• Stakeholders

20
Operations – Some Performance Targets
• Systems Average Interruption Duration Index (S.A.I.D.I.)
– less than 1 minute per annum
• Safety
– Lost Time In Frequency Rate (L.T.I.F.R.)
– Less than 0.8 man hours per annum

21
Financial Goals
• ROIC (Return on Invested Capital) must exceed WACC (Weighted Average Cost of Capital) by at least 1%
• Gearing not to exceed 30%
• Credit rating not to be lower than a minus
• NPAT in excess of S$900 million

22
Stakeholders
Regulator is a key stakeholder.
SingPower must:
• Demonstrate industry thought leadership
• Be seen as a trusted partner
• Have positive public exposure

23
Stakeholders
Union / Employees
• Collaborative partner
• People developer
Consumers
• Tariff increase for transmission, distribution and billing lower than inflation
CSR
• Green initiatives
• Less energy usage

24
Remuneration
• Short and medium term incentives
• Split of fixed and variable Remuneration for: Senior management 40 : 60 Other ranks 80 : 20

25
Performance Tied Bonus
• Evaluation rating based on 5 point rating Below target by 10% = Rating of 1 Above target by 10% = Rating of 5 Meet target = Rating of 2.5
• Economic Value Added (EVA) for senior management only
• Creation of EVA bonus pool
• Long term incentive plan currently being considered

26
Remuneration Benchmarking
• Comparison with companies with revenue between 1.5 to 2.5 times

27
Performance Evaluation and Talent Management
• Half yearly and annual evaluation
• Development of pipeline and management succession
• Mentoring system
• Coaching
• Crucial conversations

28
Performance Enablers
• Effective boards
• Clear goals and values
• Performance tied remuneration system
• Human Resource focus

Performance Evaluation for SOEs in Vietnam
PhD. Huong Nguyen National Institute for Development Studies
A presentation for the ASIA SOE Network
Hanoi, November 16-17, 2015

Table of Contents
• State-Owned Enterprise Reform in Vietnam
• Performance Evaluation for SOEs in Vietnam
• Key challenges

SOE Reform in Vietnam
• SOE reform is a component of the Doi Moi (Renovation) Plan started in 1986
• Vietnam’s approach in SOE reform:
Sharp cuts in SOE numbers: 12,084 (1989) -> 6,000 (1992) -> 3, 135 (2013)
Changes in SOE business practice: 1992-now
Efforts to establish “national champions”
Since 1994: Decision 90 & 91/TTg: 100 State General Corporations (SGC) (2013)
Since 2005: Biggest SGCs were transformed into giant State Economic groups (SEG): 13 SEGs (2011) -> 8 SEGs (2013)

SOE Reform (Con’t)
• Innovation was attempted during the economic transformation
1995-2003 : Act on State Owned Enterprises
1999-2005 : Act on Enterprises
2003-2010 : revised Act on SOEs
2005- : Common Act on Enterprises
(containing all kinds of enterprises)
• However, the state sector, in which SOEs is the major component, has always taken for granted the dominant role in the economy

Performance of SOEs
As of end-2013:
• 3,135 SOEs in which the government owns 51 percent more of the charter capital 32.2% GDP
16.3 % industrial output
33.3% domestic budget revenue (non oil)
• 796 SOE with 100% of State ownership: Total assets: 2,8 trillion VND ($127 billion) or 74% GDP
Total debts: 1,5 trillion VND ($67 billion) or 39% GDP)
By law, since 2014 only companies with 100% of state ownership can be defined as SOEs

Performance of SOEs
Number of SOEs by category in 2013
Contribution to SOE Revenue by category
in 2013 (%)
58 31
3 8
State Economic Groups
State General Corporations
State Holding LLCs
State Independent LLC
8 100 25
663
Source: MOF (2014)

Performance of SOEs
Contribution to SOE profit by category in 2013 Financial Performance of SEG & SGC
Source: MOF (2014)
0
5
10
15
20
25
30
2011 2012 2013
%
Growthrate ofRevenue
Growthrate ofProfit
ROE76%
17%
2% 5% State EconomicGroups
State GeneralCorporations
State HoldingLLCs
StateIndependentLLC

Performance of SOEs
RESOURCE UTILIZATION & RELATIVE CONTRIBUTION TO THE ECONOMY OF THREE SECTORS 2001-2010
SOEs Domestic Non-state FDI
2001-05 2006-10 2001-05 2006-10 2001-05 2006-10
RESOURCE UTILIZATION (%)
Investment 56.6 44.7 26.4 27.5 17.0 27.8
Credit 36.6 30.9
CONTRIBUTION (%)
GDP 30.0 27.8 46.7 46.1 14.6 17.9
Budget Revenue (non-oil)
19.6 17.6 6.7 10.3 6.6 10.5
Employment 43.5 23.1 40.1 54.8 16.3 22
New job creation -4.1 -13.1 74.1 84.8 30.0 28.3
Industrial Output 28.9 25.5 28.3 34.3 42.7 40.1
Source: Vu Thanh Tu Anh (2014)

Performance Evaluation for SOEs in Vietnam
Legal Basis:
• Pre-2013: SOE performance evaluation is mainly regulated by a
decision of the Prime Minister
(Decision No. 224/2006/QD-TTg dated 10/6/2006 )
Prime Minister has the overall responsibility of the supervision and evaluation of the operational efficiency of SOEs
Each line ministry is responsible for formulation and execution its own concrete regulations in adopting Performance Evaluation System
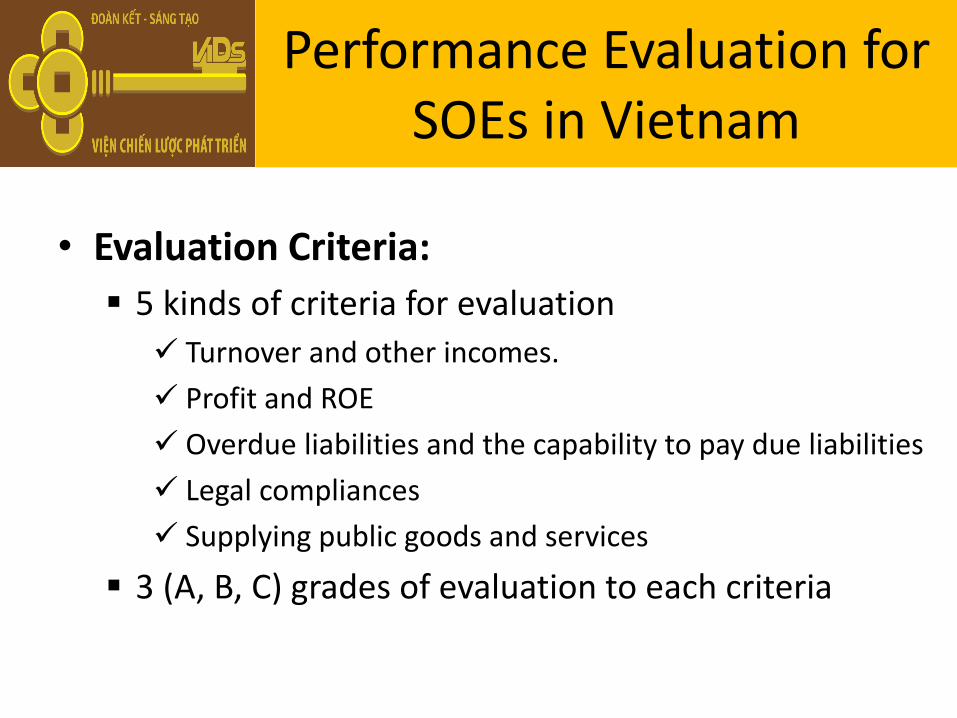
Performance Evaluation for SOEs in Vietnam
• Evaluation Criteria:
5 kinds of criteria for evaluation
Turnover and other incomes.
Profit and ROE
Overdue liabilities and the capability to pay due liabilities
Legal compliances
Supplying public goods and services
3 (A, B, C) grades of evaluation to each criteria

Performance Evaluation for SOEs in Vietnam
• Evaluation Criteria:
5 kinds of criteria for evaluation
Turnover and other incomes.
Profit and ROE
Overdue liabilities and the capability to pay due liabilities
Legal compliances
Supplying public goods and services
All criteria are compared with that of the previous year
3 (A, B, C) grades of evaluation to each criteria
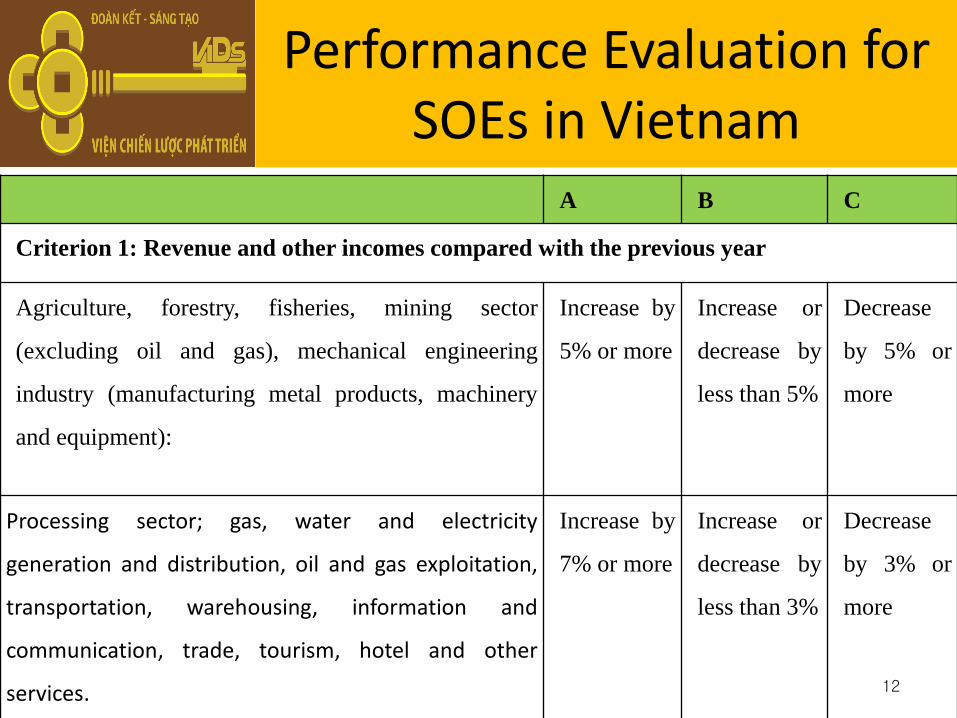
12
A B C
Criterion 1: Revenue and other incomes compared with the previous year
Agriculture, forestry, fisheries, mining sector
(excluding oil and gas), mechanical engineering
industry (manufacturing metal products, machinery
and equipment):
Increase by
5% or more
Increase or
decrease by
less than 5%
Decrease
by 5% or
more
Processing sector; gas, water and electricity
generation and distribution, oil and gas exploitation,
transportation, warehousing, information and
communication, trade, tourism, hotel and other
services.
Increase by
7% or more
Increase or
decrease by
less than 3%
Decrease
by 3% or
more
Performance Evaluation for SOEs in Vietnam

13
A B C
Criterion 2: Profit and ROE
For SOEs except
enterprises operating at
planned losses
Profit > 0 and
ROE higher than
that of the
previous year
Profit > 0 and ROE
equal or less than
that of the
previous year
Profit < 0
For enterprises
operating at planned
losses
Loss less than
planned
Loss = planned Loss higher
than
planned
Performance Evaluation for SOEs in Vietnam

14
No. Criterion Class A Class B Class C
3 Overdue liabilities and capability to pay due liabilities
No overdue liabilities and a coefficient of the capability to pay due liabilities exceeding 1
No overdue liabilities and a coefficient of the capability to pay due liabilities of between 0.5 and 1
No overdue liabilities and a coefficient of the capability to pay due liabilities of under 0.5
4 Observance of current law provisions
No violations of current law provisions
Committing violations of current law provisions as already concluded by competent agencies but not seriously enough to be administratively sanctioned
Be sanctioned for administrative violations, or committed law violation
Performance Evaluation for SOEs in Vietnam

15
No. Criterion Class A Class B Class C
5 Supply of public goods and services
Topping the set outputs of products or volumes of services of prescribed quality standards
Achieving the set outputs of products or volumes of services of prescribed quality standards
Under achieving the set outputs of products or volumes of services or the products or services of substandard quality
Performance Evaluation for SOEs in Vietnam

Performance Evaluation for SOEs in Vietnam
• Evaluation Process:
SOE submits self-evaluation to
supervising entity (parent company, line ministry, provincial
government) for verification
Supervising entity completes performance evaluation reports and send to the Ministry of Finance (MOF) before June 30th of the next
year
The MOF synthesizes reports to develop the
overall report on performance and
classification of SOEs

Performance Evaluation for SOEs in Vietnam
• On the basis of the classification results, SOEs are ranked class A, B or C
Type of SOEs Class-A enterprises Class-B enterprises
Class-C enterprises
Commercial SOEs Having none of their criteria being of class C, of which criterion 2 and criterion 4 being of class A
The rest which are ranked neither class A nor class C
Criterion 2 being of class C or the other three criteria being of class C
Policy SOEs Having none of the criteria being of class C and criterion 5 being of class A
the rest which are ranked neither class A nor class C
Having criterion 5 being of class C or criterion 5 being of class B while criteria 3 and 4 being of class C
State holding companies (SEG, SGC included)
class-A member enterprises and subsidiaries accounting for over 50% of the aggregate turnovers of the corporations and the whole corporation is making profits
the remaining corporations
class-C member enterprises and subsidiaries accounting for over 50% of the aggregate turnovers of the corporations

Performance Evaluation for SOEs in Vietnam
• Linkage between Performance and Remuneration of Board of Managers
Criterion
Complete the Mission excellently
Complete the mission
Incomplete the mission
(i) Set aside reward fund for management and executive boards
Allowed Allowed Not Allowed
(ii) Maximum ratio of profit over self- mobilized capital mobilized can be set aside for reward fund
5% 2.5% Not allowed

Performance Evaluation for SOEs in Vietnam
Criterion Complete the mission excellently
Complete the mission
Incomplete the mission
iii. The maximum amount of profit set aside for reward fund
Not allowed
- SOE with BOM Not exceed 500 million VND (or 23,809 USD)
Not exceed 250 million VND (or 11,900 USD)
Not allowed
- SOE without BOM Not exceed 200 million VND (or 9,550 USD)
Not exceed 100 million VND (or 4,760 USD)
Not allowed
iv. The performance result for two consecutive years
Received the title of “a good manager” by authorized agencies and is considered for salary increase
Replace or dismiss chairman of BOM, CEO or director (if SOE without BOM);

Key challenges
• An evolving legal framework with frequent changes to laws and regulations regarding the evaluation and supervision of SOE performance
From 2013-now: Decree 61/2013/NĐ-CP: effective date Aug 15, 2013 – expired Dec 1, 2015:
Same evaluation method & techniques to that adopted pre-2013 Law on Investment of State Capital in Enterprises dated Nov 26, 2014 Decree 87/2015/NĐ-CP to replace Decree 61/2013/NĐ-CP: effective date
Dec 1, 2015
• No independent evaluating committee involves in the whole process • Criteria focus mainly on financial performance
Too simple, no linkage to
- leadership of CEO, - organization management, - ethical management - satisfaction of customer