Embed Size (px)
Citation preview

The 89th TRB Annual Meeting, January 12, 2010, Washington DC, USA

1. Introduc+on and Literature Review 2. Probabilis+c Descrip+on of Flow Breakdown
• Flow Breakdown Detec+on Criteria • Study Sites and Data Collec+on
3. Probability of Breakdown Occurrence
4. Breakdown Dura+on Analysis 5. PRE-‐ and POST-‐Breakdown Flow Rate 6. Conclusions
2

Traffic breakdown and its stochas+c nature › Largely recognized as a stochas+c event, amenable to analysis using probabilis+c and sta+s+cal approaches.
Weather effects on traffic flow › Most traffic models and analyses are based on clear weather condi+ons. › Adverse Weather : one of the most common external changes that affect traffic stream behavior, occurrence and characteris+cs of flow breakdown.
Understanding and quan+fying the weather effect › Es+mate the capacity and reliability of traffic facili+es › Develop mi+ga+on strategies for flow breakdown
3
I

Findings in literature › Free-‐flow speed reduc+on under rain was reported in Rakha et al. (2008), Lamm et al.(1990), Ibrahim et al.(1994) and Highway Capacity Manual (2000).
4
The reduc+on varies in the range of 1.7 to 3.6% in light rain, and 4.4 to 9.0% in heavy rain. › Brilon et al. (2005) reported a reduc+on (around 11%) in breakdown capacity between dry and wet road surfaces.
Image source : www.freefoto.com
I

5
II
Two primary criteria › min. speed difference AND min. +me dura+on (10 mph) (15min)
Vf : prevailing free mean speed Vth : Threshold speed (Vf -‐10mph)
I
6
qp (pre-‐breakdown flow rate) : The flow rate observed immediately before the onset of traffic breakdown.
qb (post-‐breakdown flow rate) : The average flow rate observed during breakdown.
qb
II I

Detector Loca+ons
Traffic Data › Performance Measurement System (PeMS), California › 5 min, Workdays (5AM-‐10PM), 100% observed data › Rainy season (November-‐April), 2000-‐2009
Weather Data › Automated Surface Observing System (ASOS) at airports › 5 min, -‐RA(≤0.1 in/hr), RA(0.11-‐0.3 in/hr), +RA(>0.3 in/hr)
7
Route Abs. Post Mile Lanes Location # of Breakdowns Section 1 I280-N 45.14 4 South San Francisco 425 Section 2 I880-S 41.54 5 Oakland 386 Section 3 SR101-N 487.65 3 Santa Rosa 378 Section 4 SR101-S 420.21 4 Burlingame 537 Section 5 SR101-N 413.81 4 San Mateo 627
II I

8

qp (pre-‐breakdown flow rate) is viewed as a random variable with distribu+on func+on .
:Pr(qp≤q), the probability that traffic breaks down at flow rates less than or equal to q (in the next +me interval, for a given +me discre+za+on)
: the probability of flow rate sustaining at q, indica+ng the travel reliability at flow rate q
(i.e., survival func+on)
9
II I III

Survival Analysis to obtain the pre-‐breakdown flow rate distribu+on
Nonparametric method › Kaplan-‐Meier Product-‐limit (PL) method
Parametric method › Weibull, Gaussian and Logis+c distribu+ons › Maximum Likelihood Es+ma+on (MLE) method
10
where n : number of observa+ons δi : 1, if uncensored(breakdown observed); 0, otherwise f(·∙) : probability density func+on F(·∙) : cumula+ve distribu+on func+on
II I III

11
Maximum flow rate in observations (No-Rain)
Maximum flow rate in observations (Rain)
Sec. Best Fitting
Model Mean,
µnr Mean,
µra µnr - µra
(as % of µnr)
1 Logistic 2175.7 2124.2 51.5 (2.4%)
2 Gaussian 1523.9 1438.2 85.7 (5.6%)
3 Gaussian 1674.6 1577.2 97.4 (5.8%)
4 Weibull 2024.3 1937.7 86.6 (4.3%)
5 Gaussian 2110.1 2015.7 94.4 (4.5%)
Comparison of Mean Values of qp

The distribu+on providing the best fit to the data differs over study sec+ons and weather condi+ons.
The Gaussian distribu+on provides the best fit in six cases (three rain models and three no-‐rain models) out of ten.
For all sec+ons, the probability of breakdown at a given flow is higher under rain than the under no-‐rain.
The effect of rain is shown to be sta+s+cally significant by performing likelihood ra+o tests.
12
II I III

13

Hazard-‐based dura+on model › hazard func+on :
the condi+onal probability that an event will occur in a +me interval t given that the event has not occurred up to +me t.
the probability that breakdown will end at a dura+on t given that breakdown has con+nued up to a dura+on length t.
Event = End of breakdown
14
II I III IV

Cox propor+onal hazards Model ›
›
This ra+o captures the risk of the terminal event (i.e., end of breakdown) with respect to a par+cular independent variable
exp(β) < 1 decrease hazard lengthen dura+on 15
h(t) : hazard func+on at +me t h0(t) : baseline hazard, assuming all independent variables are zero x : independent variable β : coefficient
II I III IV

Variable Variable Description
Duration Time period between occurrence and recovery of breakdown [dependent variable]
qp Pre-breakdown flow rate [continuous variable]
qb Post-breakdown flow rate (average flow rate during breakdown) [continuous variable]
vp Pre-breakdown speed(speed at pre-breakdown flow rate) [continuous variable]
vb Post-breakdown speed (average speed during breakdown) [continuous variable]
Pre-rain 1 if it rains prior to breakdown, 0 otherwise. [dummy variable]
Post-rain 1 if it rains during breakdown, 0 otherwise. [dummy variable]
16
Variable Descrip+ons
II I III IV

Variable Section β S.E. z-statistic df p-value exp(β) 95.0% CI for exp(β)
Lower Upper
vb
1 0.144 0.014 10.054 1 0.000 1.155 1.123 1.187 2 0.107 0.010 10.268 1 0.000 1.113 1.090 1.136 3 0.086 0.011 7.635 1 0.000 1.090 1.066 1.114 4 0.243 0.023 10.445 1 0.000 1.275 1.218 1.334 5 0.053 0.006 8.682 1 0.000 1.055 1.042 1.067
Pre-rain
1 -0.004 0.240 -0.018 1 0.985 0.996 0.622 1.593 2 0.136 0.239 0.569 1 0.569 1.145 0.718 1.828 3 0.413 0.278 1.482 1 0.138 1.511 0.875 2.608 4 0.134 0.319 0.421 1 0.674 1.144 0.612 2.137 5 -0.057 0.180 -0.317 1 0.751 0.944 0.664 1.344
Post-rain
1 -0.990 0.241 -4.100 1 0.000 0.372 0.232 0.597 2 -0.637 0.212 -3.000 1 0.003 0.529 0.349 0.802 3 -0.804 0.275 -2.922 1 0.003 0.448 0.261 0.768 4 -1.080 0.273 -3.962 1 0.000 0.339 0.199 0.579 5 -0.854 0.175 -4.887 1 0.000 0.426 0.302 0.600
17
Parameters of Cox propor+onal hazard model
exp(β) <1 (47.1 to 66.1 % reduc+on in hazard func+on w.r.t. the baseline hazard)
II I III IV

18
Observa+ons of breakdown dura+on under different weather condi+ons (data from Sec+on 1 located in South San Francisco on Thursdays in January, 2008)
(a) No-‐rain (top), (b) Pre-‐rain =1 (middle) (c) Post-‐rain =1 (bopom)
II I III IV

A Cox propor+onal hazard model is used to study the factors that affect the dura+on of breakdown episodes. › Rain during the breakdown episode increases breakdown dura+on significantly. › Rain before breakdown does not significantly affect breakdown dura+on for the loca+ons tested. › The increase in breakdown dura+on of actual observa+ons due to rain ranges from 34.8 to 43.8%. › The lower the average speed during breakdown, the longer the breakdown episode.
19
II I III IV

20
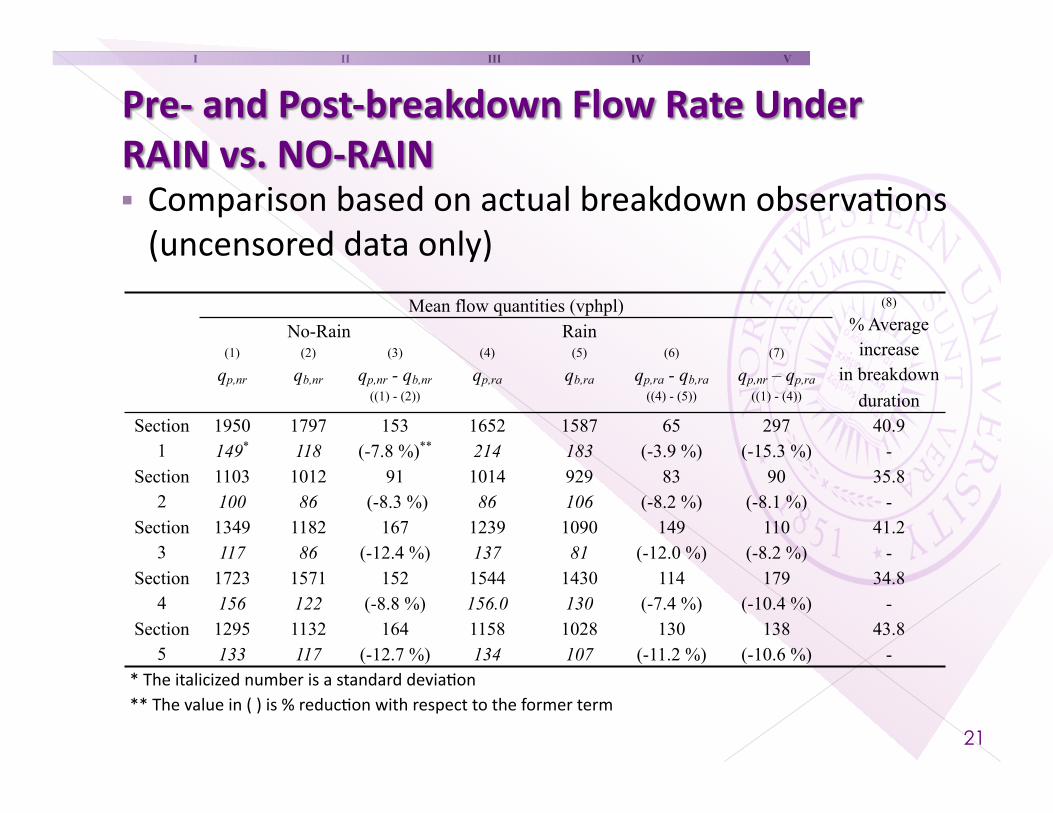
Comparison based on actual breakdown observa+ons (uncensored data only)
21
Mean flow quantities (vphpl) (8) % Average
increase in breakdown
duration
No-Rain Rain (1)
qp,nr (2)
qb,nr (3)
qp,nr - qb,nr ((1) - (2))
(4) qp,ra
(5) qb,ra
(6) qp,ra - qb,ra
((4) - (5))
(7) qp,nr – qp,ra
((1) - (4))
Section1
1950 1797 153 1652 1587 65 297 40.9 149* 118 (-7.8 %)** 214 183 (-3.9 %) (-15.3 %) -
Section2
1103 1012 91 1014 929 83 90 35.8 100 86 (-8.3 %) 86 106 (-8.2 %) (-8.1 %) -
Section3
1349 1182 167 1239 1090 149 110 41.2 117 86 (-12.4 %) 137 81 (-12.0 %) (-8.2 %) -
Section4
1723 1571 152 1544 1430 114 179 34.8 156 122 (-8.8 %) 156.0 130 (-7.4 %) (-10.4 %) -
Section5
1295 1132 164 1158 1028 130 138 43.8 133 117 (-12.7 %) 134 107 (-11.2 %) (-10.6 %) -
* The italicized number is a standard devia+on ** The value in ( ) is % reduc+on with respect to the former term
II I III IV V

The average values of service flow rates before and arer (during) breakdown were compared between rain and no-‐rain for each sec+on. › Mean flow drop before and arer breakdown with respect to pre-‐breakdown flow rate ranges from 7.8 to 12.7% under no-‐rain, and from 3.9 to 12.0% under rain. › The pre-‐breakdown flow rate under rain is lower than under no-‐rain for all sec+ons; the mean reduc+on for actual breakdown instances is found to be 8.1 to 15.3%.
22
II I III IV V

Contribu+ons of this study › This is among the few studies that focus on weather effects specifically on flow breakdown, and possibly the first to do so using data from the U.S. › It is also the first to conduct formal sta+s+cal tests of significance of these effects, and to study breakdown dura+on using hazard-‐based techniques.
Further research sugges+ons › Consider different types and levels of weather condi+ons (e.g., snow, fog, heavy rain) and other factors (e.g., visibility) for a more complete understanding of the interac+on between weather and flow breakdown phenomena. › Addi+onal observa+ons at different loca+ons are also required. 23
II I III IV V VI

24