Embed Size (px)
Citation preview
Nat. Hazards Earth Syst. Sci., 12, 1277–1294, 2012www.nat-hazards-earth-syst-sci.net/12/1277/2012/doi:10.5194/nhess-12-1277-2012© Author(s) 2012. CC Attribution 3.0 License.
Natural Hazardsand Earth
System Sciences
The 6 August 2010 Mount Meager rock slide-debris flow,Coast Mountains, British Columbia: characteristics, dynamics, andimplications for hazard and risk assessment
R. H. Guthrie1, P. Friele2, K. Allstadt 3, N. Roberts4, S. G. Evans5, K. B. Delaney5, D. Roche6, J. J. Clague4, andM. Jakob7
1MDH Engineered Solutions, SNC-Lavalin Group, Calgary, AB, Canada2Cordilleran Geoscience, Squamish, BC, Canada3Earth and Space Sciences, University of Washington, Seattle, WA, USA4Centre for Natural Hazard Research, Simon Fraser University, Burnaby, BC, Canada5Landslide Research Programme, University of Waterloo, Waterloo, ON, Canada6Kerr Wood Leidal Associates Limited, Burnaby, BC, Canada7BGC Engineering Inc., Vancouver, BC, Canada
Correspondence to:R. H. Guthrie ([email protected])
Received: 14 October 2011 – Revised: 7 February 2012 – Accepted: 3 March 2012 – Published: 4 May 2012
Abstract. A large rock avalanche occurred at 03:27:30 PDT,6 August 2010, in the Mount Meager Volcanic Complexsouthwest British Columbia. The landslide initiated as a rockslide in Pleistocene rhyodacitic volcanic rock with the col-lapse of the secondary peak of Mount Meager. The detachedrock mass impacted the volcano’s weathered and saturatedflanks, creating a visible seismic signature on nearby seis-mographs. Undrained loading of the sloping flank caused theimmediate and extremely rapid evacuation of the entire flankwith a strong horizontal force, as the rock slide transformedinto a debris flow. The disintegrating mass travelled downCapricorn Creek at an average velocity of 64 m s−1, exhibit-ing dramatic super-elevation in bends to the intersection ofMeager Creek, 7.8 km from the source. At Meager Creek thedebris impacted the south side of Meager valley, causing arunup of 270 m above the valley floor and the deflection ofthe landslide debris both upstream (for 3.7 km) and down-stream into the Lillooet River valley (for 4.9 km), where itblocked the Lillooet River river for a couple of hours, ap-proximately 10 km from the landslide source. Depositionat the Capricorn–Meager confluence also dammed MeagerCreek for about 19 h creating a lake 1.5 km long. The over-topping of the dam and the predicted outburst flood was thebasis for a night time evacuation of 1500 residents in the townof Pemberton, 65 km downstream. High-resolution GeoEyesatellite imagery obtained on 16 October 2010 was usedto create a post-event digital elevation model. Comparing
pre- and post-event topography we estimate the volume ofthe initial displaced mass from the flank of Mount Mea-ger to be 48.5× 10⁶ m3, the height of the path (H ) to be2183 m and the total length of the path (L) to be 12.7 km.This yieldsH/L = 0.172 and a fahrboschung (travel angle)of 9.75◦. The movement was recorded on seismographs inBritish Columbia and Washington State with the initial im-pact, the debris flow travelling through bends in CapricornCreek, and the impact with Meager Creek are all evidenton a number of seismograms. The landslide had a seismictrace equivalent to aM = 2.6 earthquake. Velocities and dy-namics of the movement were simulated using DAN-W. The2010 event is the third major landslide in the Capricorn Creekwatershed since 1998 and the fifth large-scale mass flow inthe Meager Creek watershed since 1930. No lives were lostin the event, but despite its relatively remote location directcosts of the 2010 landslide are estimated to be in the order of$10 M CAD.
1 Introduction
At 03:27 local time (PDT), on 6 August 2010, a48.5× 106 m3 landslide was initiated on Mount Meager, at50.623◦ N/123.501◦ W in the Coast Mountains of BritishColumbia (Fig. 1). The landslide originated with the col-lapse of the southern peak of Mount Meager (2554 m a.s.l.)
Published by Copernicus Publications on behalf of the European Geosciences Union.
1278 R. H. Guthrie et al.: The 6 August 2010 Mount Meager rock slide-debris flow
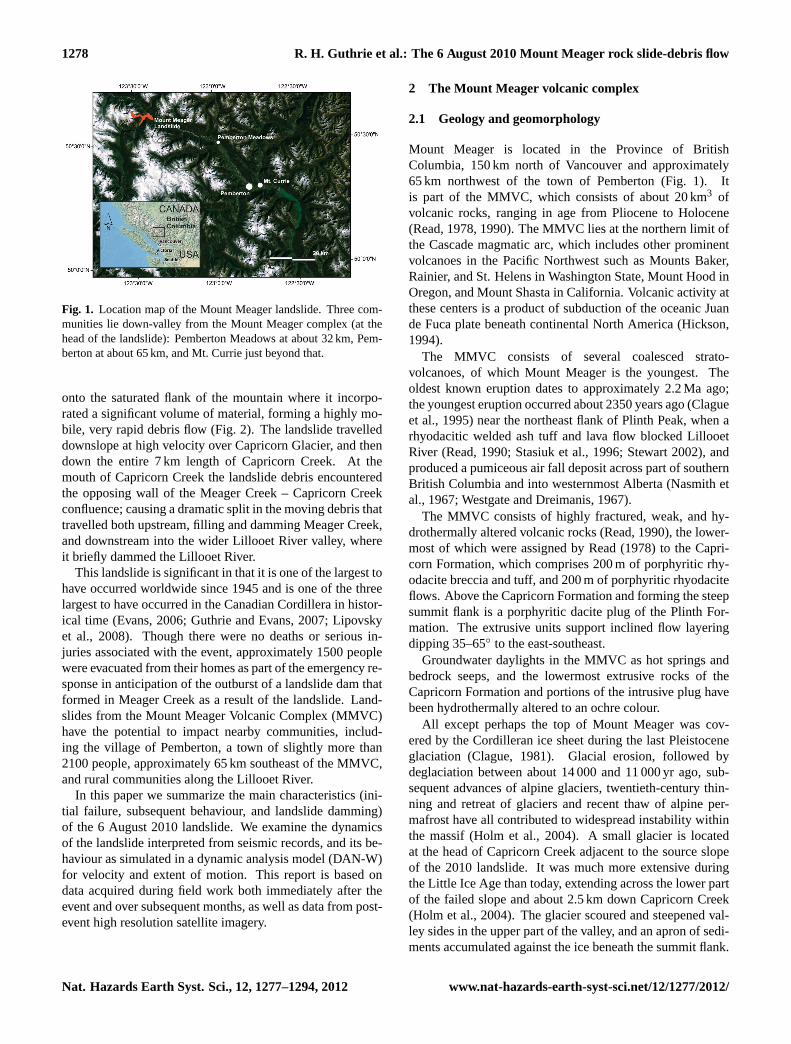
Fig. 1. Location map of the Mount Meager landslide. Three com-munities lie down-valley from the Mount Meager complex (at thehead of the landslide): Pemberton Meadows at about 32 km, Pem-berton at about 65 km, and Mt. Currie just beyond that.
onto the saturated flank of the mountain where it incorpo-rated a significant volume of material, forming a highly mo-bile, very rapid debris flow (Fig. 2). The landslide travelleddownslope at high velocity over Capricorn Glacier, and thendown the entire 7 km length of Capricorn Creek. At themouth of Capricorn Creek the landslide debris encounteredthe opposing wall of the Meager Creek – Capricorn Creekconfluence; causing a dramatic split in the moving debris thattravelled both upstream, filling and damming Meager Creek,and downstream into the wider Lillooet River valley, whereit briefly dammed the Lillooet River.
This landslide is significant in that it is one of the largest tohave occurred worldwide since 1945 and is one of the threelargest to have occurred in the Canadian Cordillera in histor-ical time (Evans, 2006; Guthrie and Evans, 2007; Lipovskyet al., 2008). Though there were no deaths or serious in-juries associated with the event, approximately 1500 peoplewere evacuated from their homes as part of the emergency re-sponse in anticipation of the outburst of a landslide dam thatformed in Meager Creek as a result of the landslide. Land-slides from the Mount Meager Volcanic Complex (MMVC)have the potential to impact nearby communities, includ-ing the village of Pemberton, a town of slightly more than2100 people, approximately 65 km southeast of the MMVC,and rural communities along the Lillooet River.
In this paper we summarize the main characteristics (ini-tial failure, subsequent behaviour, and landslide damming)of the 6 August 2010 landslide. We examine the dynamicsof the landslide interpreted from seismic records, and its be-haviour as simulated in a dynamic analysis model (DAN-W)for velocity and extent of motion. This report is based ondata acquired during field work both immediately after theevent and over subsequent months, as well as data from post-event high resolution satellite imagery.
2 The Mount Meager volcanic complex
2.1 Geology and geomorphology
Mount Meager is located in the Province of BritishColumbia, 150 km north of Vancouver and approximately65 km northwest of the town of Pemberton (Fig. 1). Itis part of the MMVC, which consists of about 20 km3 ofvolcanic rocks, ranging in age from Pliocene to Holocene(Read, 1978, 1990). The MMVC lies at the northern limit ofthe Cascade magmatic arc, which includes other prominentvolcanoes in the Pacific Northwest such as Mounts Baker,Rainier, and St. Helens in Washington State, Mount Hood inOregon, and Mount Shasta in California. Volcanic activity atthese centers is a product of subduction of the oceanic Juande Fuca plate beneath continental North America (Hickson,1994).
The MMVC consists of several coalesced strato-volcanoes, of which Mount Meager is the youngest. Theoldest known eruption dates to approximately 2.2 Ma ago;the youngest eruption occurred about 2350 years ago (Clagueet al., 1995) near the northeast flank of Plinth Peak, when arhyodacitic welded ash tuff and lava flow blocked LillooetRiver (Read, 1990; Stasiuk et al., 1996; Stewart 2002), andproduced a pumiceous air fall deposit across part of southernBritish Columbia and into westernmost Alberta (Nasmith etal., 1967; Westgate and Dreimanis, 1967).
The MMVC consists of highly fractured, weak, and hy-drothermally altered volcanic rocks (Read, 1990), the lower-most of which were assigned by Read (1978) to the Capri-corn Formation, which comprises 200 m of porphyritic rhy-odacite breccia and tuff, and 200 m of porphyritic rhyodaciteflows. Above the Capricorn Formation and forming the steepsummit flank is a porphyritic dacite plug of the Plinth For-mation. The extrusive units support inclined flow layeringdipping 35–65◦ to the east-southeast.
Groundwater daylights in the MMVC as hot springs andbedrock seeps, and the lowermost extrusive rocks of theCapricorn Formation and portions of the intrusive plug havebeen hydrothermally altered to an ochre colour.
All except perhaps the top of Mount Meager was cov-ered by the Cordilleran ice sheet during the last Pleistoceneglaciation (Clague, 1981). Glacial erosion, followed bydeglaciation between about 14 000 and 11 000 yr ago, sub-sequent advances of alpine glaciers, twentieth-century thin-ning and retreat of glaciers and recent thaw of alpine per-mafrost have all contributed to widespread instability withinthe massif (Holm et al., 2004). A small glacier is locatedat the head of Capricorn Creek adjacent to the source slopeof the 2010 landslide. It was much more extensive duringthe Little Ice Age than today, extending across the lower partof the failed slope and about 2.5 km down Capricorn Creek(Holm et al., 2004). The glacier scoured and steepened val-ley sides in the upper part of the valley, and an apron of sedi-ments accumulated against the ice beneath the summit flank.
Nat. Hazards Earth Syst. Sci., 12, 1277–1294, 2012 www.nat-hazards-earth-syst-sci.net/12/1277/2012/
R. H. Guthrie et al.: The 6 August 2010 Mount Meager rock slide-debris flow 1279
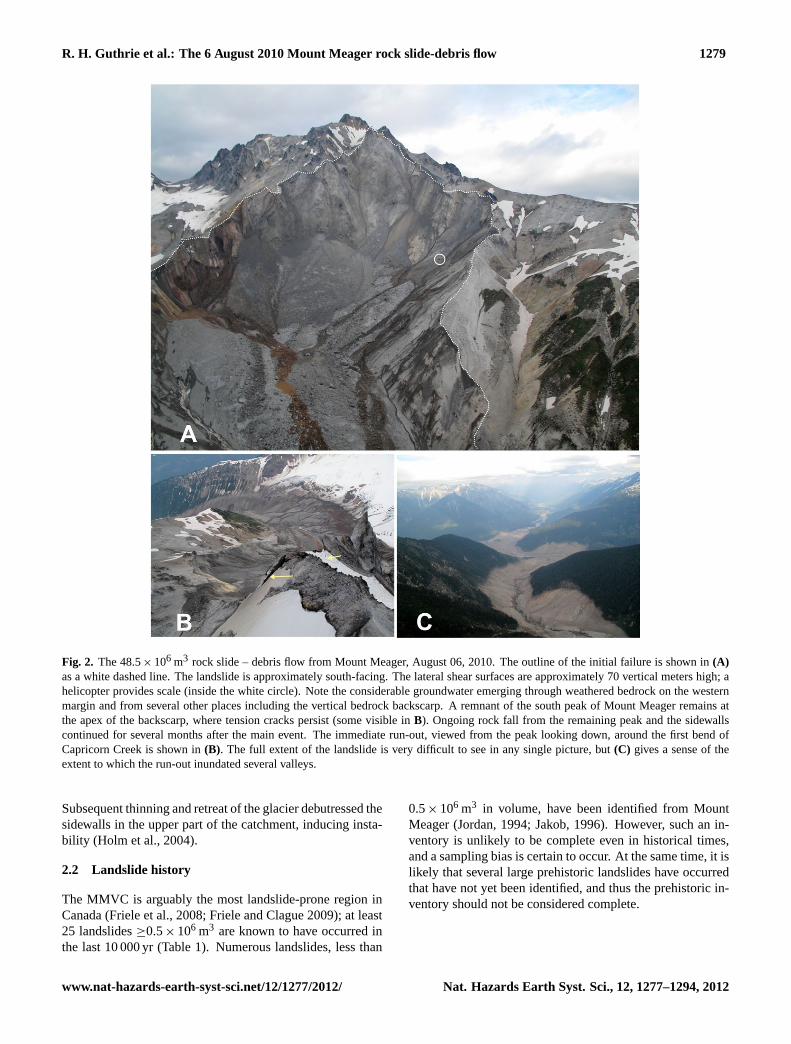
Fig. 2. The 48.5× 10⁶ m3 rock slide – debris flow from Mount Meager, August 06, 2010. The outline of the initial failure is shown in(A)as a white dashed line. The landslide is approximately south-facing. The lateral shear surfaces are approximately 70 vertical meters high; ahelicopter provides scale (inside the white circle). Note the considerable groundwater emerging through weathered bedrock on the westernmargin and from several other places including the vertical bedrock backscarp. A remnant of the south peak of Mount Meager remains atthe apex of the backscarp, where tension cracks persist (some visible inB). Ongoing rock fall from the remaining peak and the sidewallscontinued for several months after the main event. The immediate run-out, viewed from the peak looking down, around the first bend ofCapricorn Creek is shown in(B). The full extent of the landslide is very difficult to see in any single picture, but(C) gives a sense of theextent to which the run-out inundated several valleys.
Subsequent thinning and retreat of the glacier debutressed thesidewalls in the upper part of the catchment, inducing insta-bility (Holm et al., 2004).
2.2 Landslide history
The MMVC is arguably the most landslide-prone region inCanada (Friele et al., 2008; Friele and Clague 2009); at least25 landslides≥0.5× 10⁶ m3 are known to have occurred inthe last 10 000 yr (Table 1). Numerous landslides, less than
0.5× 10⁶ m3 in volume, have been identified from MountMeager (Jordan, 1994; Jakob, 1996). However, such an in-ventory is unlikely to be complete even in historical times,and a sampling bias is certain to occur. At the same time, it islikely that several large prehistoric landslides have occurredthat have not yet been identified, and thus the prehistoric in-ventory should not be considered complete.
www.nat-hazards-earth-syst-sci.net/12/1277/2012/ Nat. Hazards Earth Syst. Sci., 12, 1277–1294, 2012
1280 R. H. Guthrie et al.: The 6 August 2010 Mount Meager rock slide-debris flow
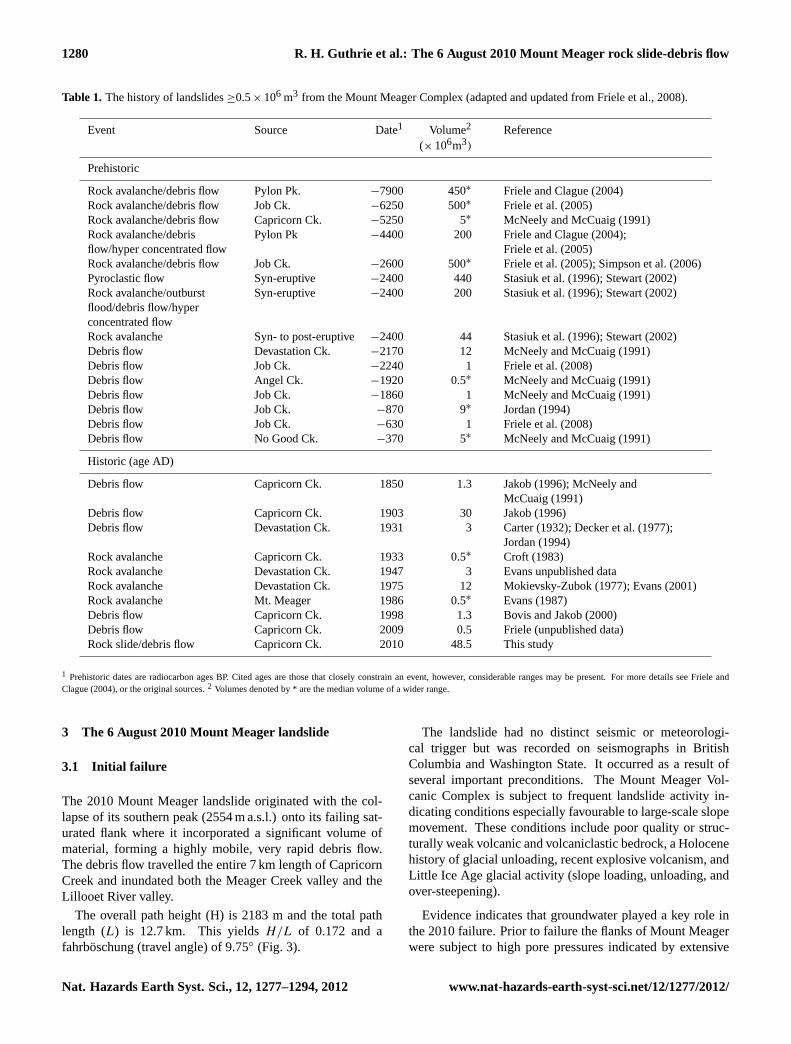
Table 1. The history of landslides≥0.5× 10⁶ m3 from the Mount Meager Complex (adapted and updated from Friele et al., 2008).
Event Source Date1 Volume2 Reference(× 106m3)
Prehistoric
Rock avalanche/debris flow Pylon Pk. −7900 450∗ Friele and Clague (2004)Rock avalanche/debris flow Job Ck. −6250 500∗ Friele et al. (2005)Rock avalanche/debris flow Capricorn Ck. −5250 5∗ McNeely and McCuaig (1991)Rock avalanche/debrisflow/hyper concentrated flow
Pylon Pk −4400 200 Friele and Clague (2004);Friele et al. (2005)
Rock avalanche/debris flow Job Ck. −2600 500∗ Friele et al. (2005); Simpson et al. (2006)Pyroclastic flow Syn-eruptive −2400 440 Stasiuk et al. (1996); Stewart (2002)Rock avalanche/outburstflood/debris flow/hyperconcentrated flow
Syn-eruptive −2400 200 Stasiuk et al. (1996); Stewart (2002)
Rock avalanche Syn- to post-eruptive−2400 44 Stasiuk et al. (1996); Stewart (2002)Debris flow Devastation Ck. −2170 12 McNeely and McCuaig (1991)Debris flow Job Ck. −2240 1 Friele et al. (2008)Debris flow Angel Ck. −1920 0.5∗ McNeely and McCuaig (1991)Debris flow Job Ck. −1860 1 McNeely and McCuaig (1991)Debris flow Job Ck. −870 9∗ Jordan (1994)Debris flow Job Ck. −630 1 Friele et al. (2008)Debris flow No Good Ck. −370 5∗ McNeely and McCuaig (1991)
Historic (age AD)
Debris flow Capricorn Ck. 1850 1.3 Jakob (1996); McNeely andMcCuaig (1991)
Debris flow Capricorn Ck. 1903 30 Jakob (1996)Debris flow Devastation Ck. 1931 3 Carter (1932); Decker et al. (1977);
Jordan (1994)Rock avalanche Capricorn Ck. 1933 0.5∗ Croft (1983)Rock avalanche Devastation Ck. 1947 3 Evans unpublished dataRock avalanche Devastation Ck. 1975 12 Mokievsky-Zubok (1977); Evans (2001)Rock avalanche Mt. Meager 1986 0.5∗ Evans (1987)Debris flow Capricorn Ck. 1998 1.3 Bovis and Jakob (2000)Debris flow Capricorn Ck. 2009 0.5 Friele (unpublished data)Rock slide/debris flow Capricorn Ck. 2010 48.5 This study
1 Prehistoric dates are radiocarbon ages BP. Cited ages are those that closely constrain an event, however, considerable ranges may be present. For more details see Friele andClague (2004), or the original sources.2 Volumes denoted by * are the median volume of a wider range.
3 The 6 August 2010 Mount Meager landslide
3.1 Initial failure
The 2010 Mount Meager landslide originated with the col-lapse of its southern peak (2554 m a.s.l.) onto its failing sat-urated flank where it incorporated a significant volume ofmaterial, forming a highly mobile, very rapid debris flow.The debris flow travelled the entire 7 km length of CapricornCreek and inundated both the Meager Creek valley and theLillooet River valley.
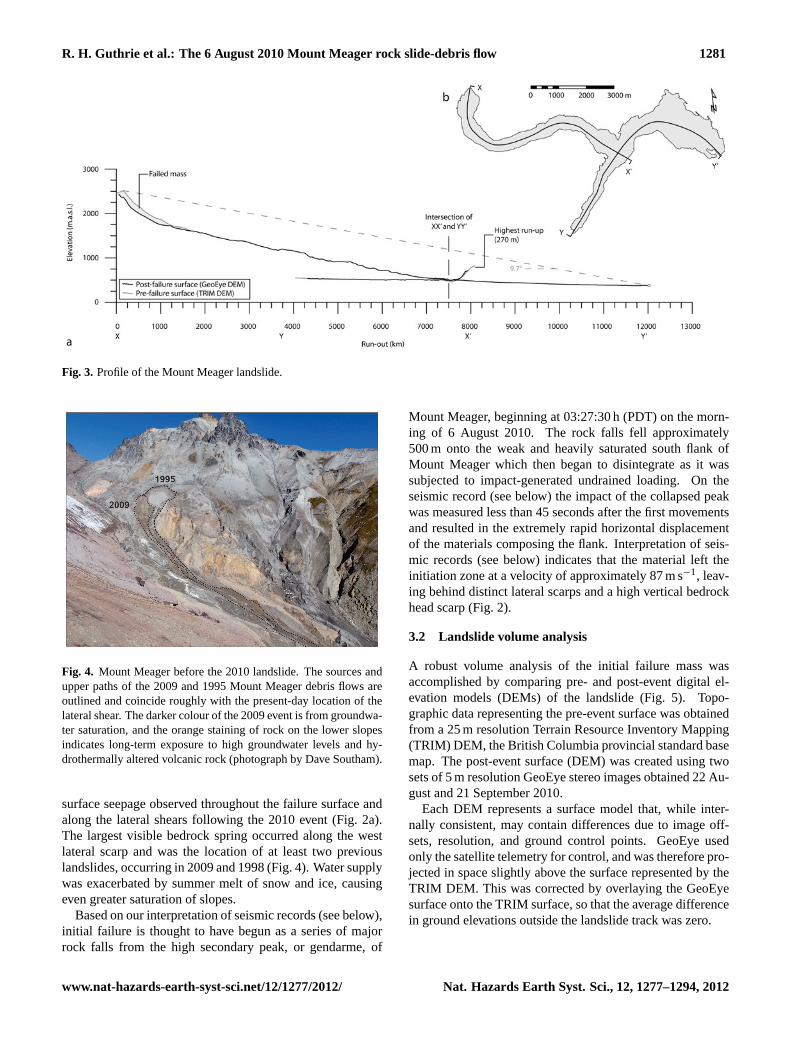
The overall path height (H) is 2183 m and the total pathlength (L) is 12.7 km. This yieldsH/L of 0.172 and afahrboschung (travel angle) of 9.75◦ (Fig. 3).
The landslide had no distinct seismic or meteorologi-cal trigger but was recorded on seismographs in BritishColumbia and Washington State. It occurred as a result ofseveral important preconditions. The Mount Meager Vol-canic Complex is subject to frequent landslide activity in-dicating conditions especially favourable to large-scale slopemovement. These conditions include poor quality or struc-turally weak volcanic and volcaniclastic bedrock, a Holocenehistory of glacial unloading, recent explosive volcanism, andLittle Ice Age glacial activity (slope loading, unloading, andover-steepening).
Evidence indicates that groundwater played a key role inthe 2010 failure. Prior to failure the flanks of Mount Meagerwere subject to high pore pressures indicated by extensive
Nat. Hazards Earth Syst. Sci., 12, 1277–1294, 2012 www.nat-hazards-earth-syst-sci.net/12/1277/2012/
R. H. Guthrie et al.: The 6 August 2010 Mount Meager rock slide-debris flow 1281
Fig. 3. Profile of the Mount Meager landslide.
Fig. 4. Mount Meager before the 2010 landslide. The sources andupper paths of the 2009 and 1995 Mount Meager debris flows areoutlined and coincide roughly with the present-day location of thelateral shear. The darker colour of the 2009 event is from groundwa-ter saturation, and the orange staining of rock on the lower slopesindicates long-term exposure to high groundwater levels and hy-drothermally altered volcanic rock (photograph by Dave Southam).
surface seepage observed throughout the failure surface andalong the lateral shears following the 2010 event (Fig. 2a).The largest visible bedrock spring occurred along the westlateral scarp and was the location of at least two previouslandslides, occurring in 2009 and 1998 (Fig. 4). Water supplywas exacerbated by summer melt of snow and ice, causingeven greater saturation of slopes.
Based on our interpretation of seismic records (see below),initial failure is thought to have begun as a series of majorrock falls from the high secondary peak, or gendarme, of
Mount Meager, beginning at 03:27:30 h (PDT) on the morn-ing of 6 August 2010. The rock falls fell approximately500 m onto the weak and heavily saturated south flank ofMount Meager which then began to disintegrate as it wassubjected to impact-generated undrained loading. On theseismic record (see below) the impact of the collapsed peakwas measured less than 45 seconds after the first movementsand resulted in the extremely rapid horizontal displacementof the materials composing the flank. Interpretation of seis-mic records (see below) indicates that the material left theinitiation zone at a velocity of approximately 87 m s−1, leav-ing behind distinct lateral scarps and a high vertical bedrockhead scarp (Fig. 2).
3.2 Landslide volume analysis
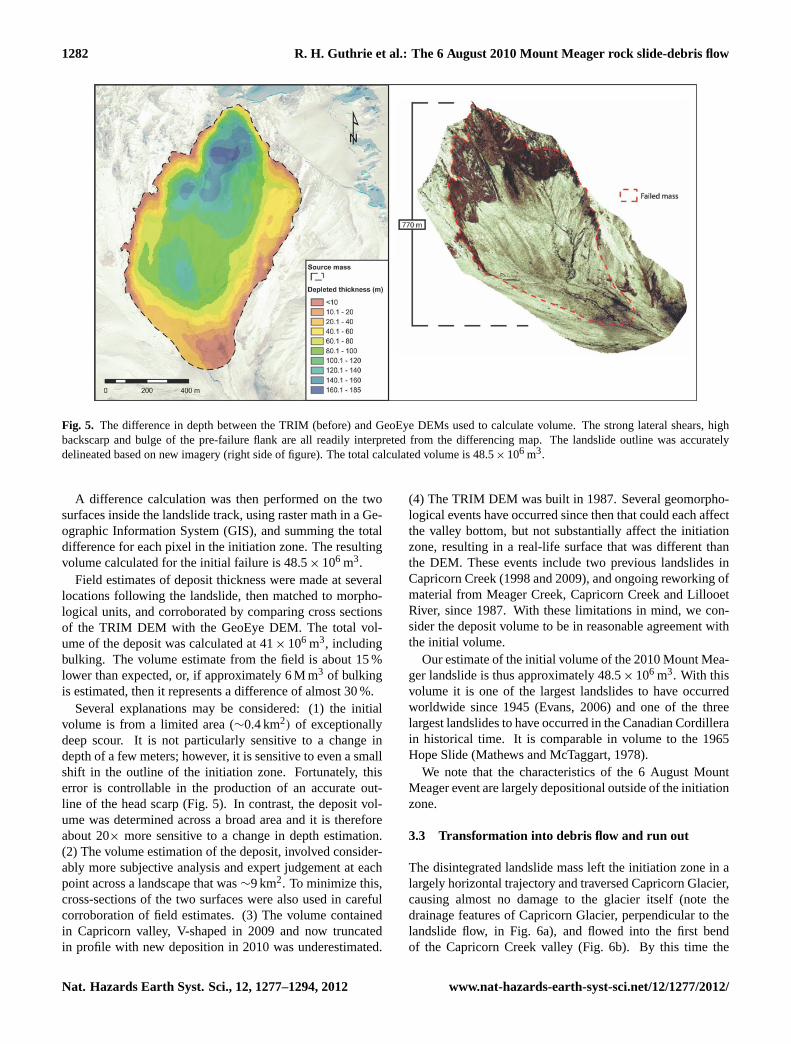
A robust volume analysis of the initial failure mass wasaccomplished by comparing pre- and post-event digital el-evation models (DEMs) of the landslide (Fig. 5). Topo-graphic data representing the pre-event surface was obtainedfrom a 25 m resolution Terrain Resource Inventory Mapping(TRIM) DEM, the British Columbia provincial standard basemap. The post-event surface (DEM) was created using twosets of 5 m resolution GeoEye stereo images obtained 22 Au-gust and 21 September 2010.
Each DEM represents a surface model that, while inter-nally consistent, may contain differences due to image off-sets, resolution, and ground control points. GeoEye usedonly the satellite telemetry for control, and was therefore pro-jected in space slightly above the surface represented by theTRIM DEM. This was corrected by overlaying the GeoEyesurface onto the TRIM surface, so that the average differencein ground elevations outside the landslide track was zero.
www.nat-hazards-earth-syst-sci.net/12/1277/2012/ Nat. Hazards Earth Syst. Sci., 12, 1277–1294, 2012
1282 R. H. Guthrie et al.: The 6 August 2010 Mount Meager rock slide-debris flow
Fig. 5. The difference in depth between the TRIM (before) and GeoEye DEMs used to calculate volume. The strong lateral shears, highbackscarp and bulge of the pre-failure flank are all readily interpreted from the differencing map. The landslide outline was accuratelydelineated based on new imagery (right side of figure). The total calculated volume is 48.5× 10⁶ m3.
A difference calculation was then performed on the twosurfaces inside the landslide track, using raster math in a Ge-ographic Information System (GIS), and summing the totaldifference for each pixel in the initiation zone. The resultingvolume calculated for the initial failure is 48.5× 10⁶ m3.
Field estimates of deposit thickness were made at severallocations following the landslide, then matched to morpho-logical units, and corroborated by comparing cross sectionsof the TRIM DEM with the GeoEye DEM. The total vol-ume of the deposit was calculated at 41× 106 m3, includingbulking. The volume estimate from the field is about 15 %lower than expected, or, if approximately 6 M m3 of bulkingis estimated, then it represents a difference of almost 30 %.
Several explanations may be considered: (1) the initialvolume is from a limited area (∼0.4 km2) of exceptionallydeep scour. It is not particularly sensitive to a change indepth of a few meters; however, it is sensitive to even a smallshift in the outline of the initiation zone. Fortunately, thiserror is controllable in the production of an accurate out-line of the head scarp (Fig. 5). In contrast, the deposit vol-ume was determined across a broad area and it is thereforeabout 20× more sensitive to a change in depth estimation.(2) The volume estimation of the deposit, involved consider-ably more subjective analysis and expert judgement at eachpoint across a landscape that was∼9 km2. To minimize this,cross-sections of the two surfaces were also used in carefulcorroboration of field estimates. (3) The volume containedin Capricorn valley, V-shaped in 2009 and now truncatedin profile with new deposition in 2010 was underestimated.
(4) The TRIM DEM was built in 1987. Several geomorpho-logical events have occurred since then that could each affectthe valley bottom, but not substantially affect the initiationzone, resulting in a real-life surface that was different thanthe DEM. These events include two previous landslides inCapricorn Creek (1998 and 2009), and ongoing reworking ofmaterial from Meager Creek, Capricorn Creek and LillooetRiver, since 1987. With these limitations in mind, we con-sider the deposit volume to be in reasonable agreement withthe initial volume.
Our estimate of the initial volume of the 2010 Mount Mea-ger landslide is thus approximately 48.5× 10⁶ m3. With thisvolume it is one of the largest landslides to have occurredworldwide since 1945 (Evans, 2006) and one of the threelargest landslides to have occurred in the Canadian Cordillerain historical time. It is comparable in volume to the 1965Hope Slide (Mathews and McTaggart, 1978).
We note that the characteristics of the 6 August MountMeager event are largely depositional outside of the initiationzone.
3.3 Transformation into debris flow and run out
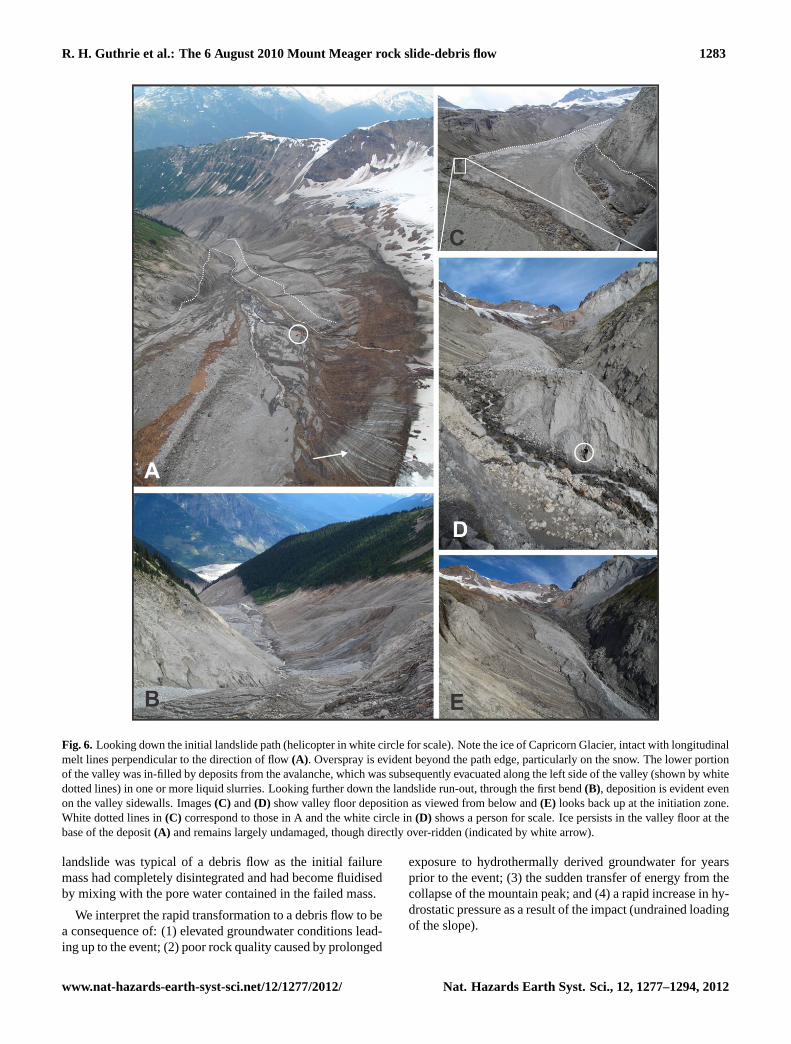
The disintegrated landslide mass left the initiation zone in alargely horizontal trajectory and traversed Capricorn Glacier,causing almost no damage to the glacier itself (note thedrainage features of Capricorn Glacier, perpendicular to thelandslide flow, in Fig. 6a), and flowed into the first bendof the Capricorn Creek valley (Fig. 6b). By this time the
Nat. Hazards Earth Syst. Sci., 12, 1277–1294, 2012 www.nat-hazards-earth-syst-sci.net/12/1277/2012/
R. H. Guthrie et al.: The 6 August 2010 Mount Meager rock slide-debris flow 1283
Fig. 6. Looking down the initial landslide path (helicopter in white circle for scale). Note the ice of Capricorn Glacier, intact with longitudinalmelt lines perpendicular to the direction of flow(A). Overspray is evident beyond the path edge, particularly on the snow. The lower portionof the valley was in-filled by deposits from the avalanche, which was subsequently evacuated along the left side of the valley (shown by whitedotted lines) in one or more liquid slurries. Looking further down the landslide run-out, through the first bend(B), deposition is evident evenon the valley sidewalls. Images(C) and(D) show valley floor deposition as viewed from below and(E) looks back up at the initiation zone.White dotted lines in(C) correspond to those in A and the white circle in(D) shows a person for scale. Ice persists in the valley floor at thebase of the deposit(A) and remains largely undamaged, though directly over-ridden (indicated by white arrow).
landslide was typical of a debris flow as the initial failuremass had completely disintegrated and had become fluidisedby mixing with the pore water contained in the failed mass.
We interpret the rapid transformation to a debris flow to bea consequence of: (1) elevated groundwater conditions lead-ing up to the event; (2) poor rock quality caused by prolonged
exposure to hydrothermally derived groundwater for yearsprior to the event; (3) the sudden transfer of energy from thecollapse of the mountain peak; and (4) a rapid increase in hy-drostatic pressure as a result of the impact (undrained loadingof the slope).
www.nat-hazards-earth-syst-sci.net/12/1277/2012/ Nat. Hazards Earth Syst. Sci., 12, 1277–1294, 2012
1284 R. H. Guthrie et al.: The 6 August 2010 Mount Meager rock slide-debris flow
3.4 Analysis and interpretation of seismic signature
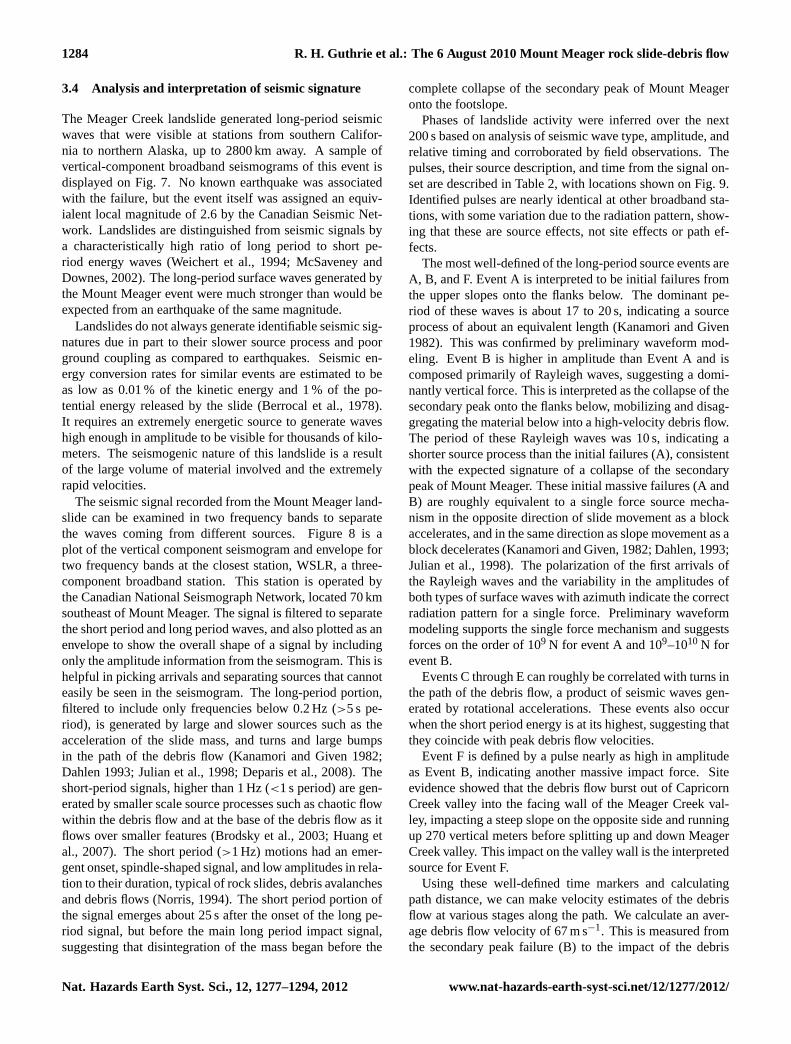
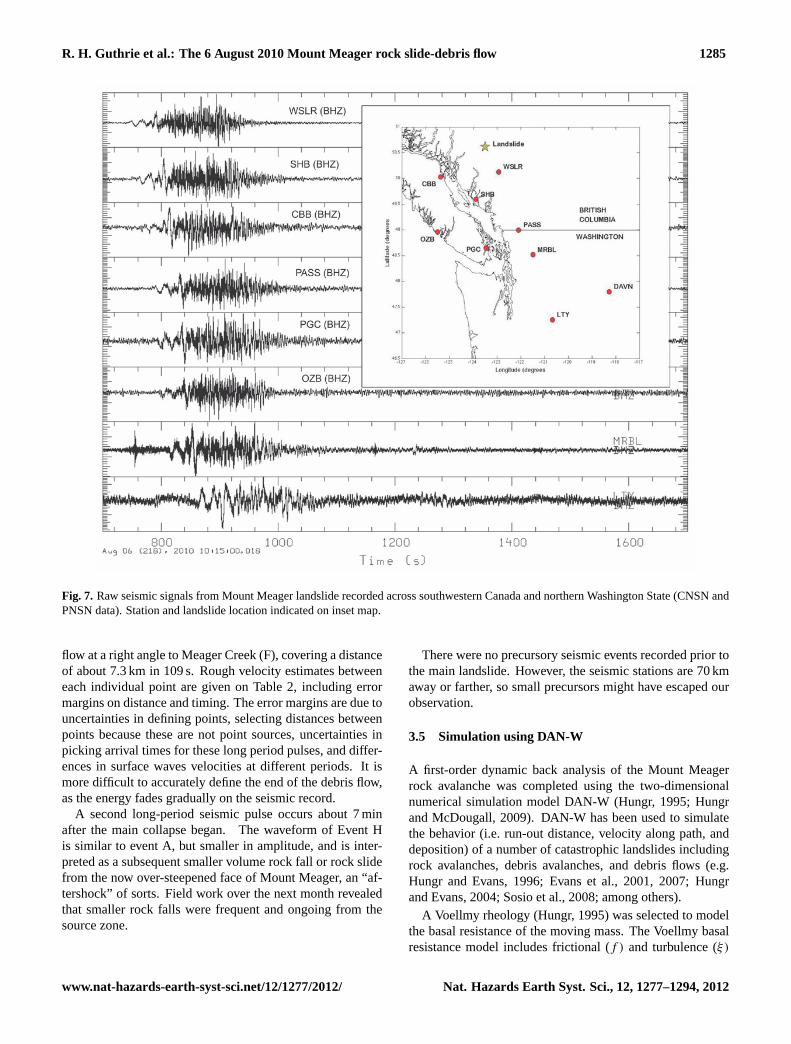
The Meager Creek landslide generated long-period seismicwaves that were visible at stations from southern Califor-nia to northern Alaska, up to 2800 km away. A sample ofvertical-component broadband seismograms of this event isdisplayed on Fig. 7. No known earthquake was associatedwith the failure, but the event itself was assigned an equiv-ialent local magnitude of 2.6 by the Canadian Seismic Net-work. Landslides are distinguished from seismic signals bya characteristically high ratio of long period to short pe-riod energy waves (Weichert et al., 1994; McSaveney andDownes, 2002). The long-period surface waves generated bythe Mount Meager event were much stronger than would beexpected from an earthquake of the same magnitude.
Landslides do not always generate identifiable seismic sig-natures due in part to their slower source process and poorground coupling as compared to earthquakes. Seismic en-ergy conversion rates for similar events are estimated to beas low as 0.01 % of the kinetic energy and 1 % of the po-tential energy released by the slide (Berrocal et al., 1978).It requires an extremely energetic source to generate waveshigh enough in amplitude to be visible for thousands of kilo-meters. The seismogenic nature of this landslide is a resultof the large volume of material involved and the extremelyrapid velocities.
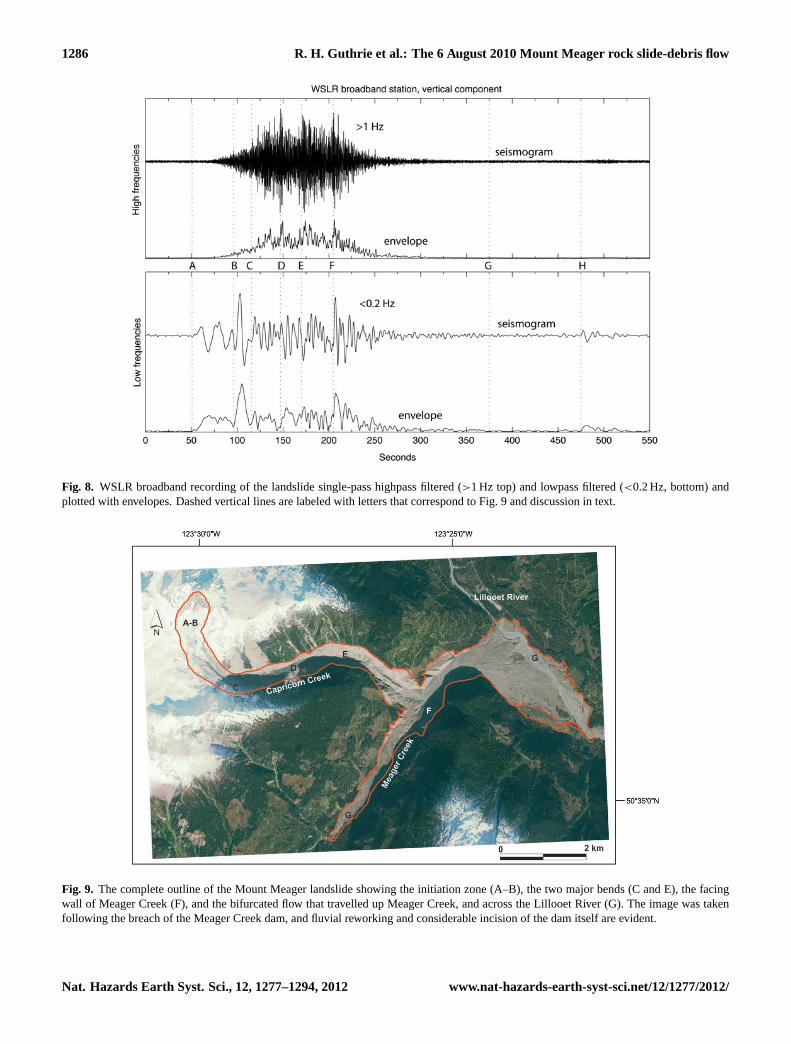
The seismic signal recorded from the Mount Meager land-slide can be examined in two frequency bands to separatethe waves coming from different sources. Figure 8 is aplot of the vertical component seismogram and envelope fortwo frequency bands at the closest station, WSLR, a three-component broadband station. This station is operated bythe Canadian National Seismograph Network, located 70 kmsoutheast of Mount Meager. The signal is filtered to separatethe short period and long period waves, and also plotted as anenvelope to show the overall shape of a signal by includingonly the amplitude information from the seismogram. This ishelpful in picking arrivals and separating sources that cannoteasily be seen in the seismogram. The long-period portion,filtered to include only frequencies below 0.2 Hz (>5 s pe-riod), is generated by large and slower sources such as theacceleration of the slide mass, and turns and large bumpsin the path of the debris flow (Kanamori and Given 1982;Dahlen 1993; Julian et al., 1998; Deparis et al., 2008). Theshort-period signals, higher than 1 Hz (<1 s period) are gen-erated by smaller scale source processes such as chaotic flowwithin the debris flow and at the base of the debris flow as itflows over smaller features (Brodsky et al., 2003; Huang etal., 2007). The short period (>1 Hz) motions had an emer-gent onset, spindle-shaped signal, and low amplitudes in rela-tion to their duration, typical of rock slides, debris avalanchesand debris flows (Norris, 1994). The short period portion ofthe signal emerges about 25 s after the onset of the long pe-riod signal, but before the main long period impact signal,suggesting that disintegration of the mass began before the
complete collapse of the secondary peak of Mount Meageronto the footslope.
Phases of landslide activity were inferred over the next200 s based on analysis of seismic wave type, amplitude, andrelative timing and corroborated by field observations. Thepulses, their source description, and time from the signal on-set are described in Table 2, with locations shown on Fig. 9.Identified pulses are nearly identical at other broadband sta-tions, with some variation due to the radiation pattern, show-ing that these are source effects, not site effects or path ef-fects.
The most well-defined of the long-period source events areA, B, and F. Event A is interpreted to be initial failures fromthe upper slopes onto the flanks below. The dominant pe-riod of these waves is about 17 to 20 s, indicating a sourceprocess of about an equivalent length (Kanamori and Given1982). This was confirmed by preliminary waveform mod-eling. Event B is higher in amplitude than Event A and iscomposed primarily of Rayleigh waves, suggesting a domi-nantly vertical force. This is interpreted as the collapse of thesecondary peak onto the flanks below, mobilizing and disag-gregating the material below into a high-velocity debris flow.The period of these Rayleigh waves was 10 s, indicating ashorter source process than the initial failures (A), consistentwith the expected signature of a collapse of the secondarypeak of Mount Meager. These initial massive failures (A andB) are roughly equivalent to a single force source mecha-nism in the opposite direction of slide movement as a blockaccelerates, and in the same direction as slope movement as ablock decelerates (Kanamori and Given, 1982; Dahlen, 1993;Julian et al., 1998). The polarization of the first arrivals ofthe Rayleigh waves and the variability in the amplitudes ofboth types of surface waves with azimuth indicate the correctradiation pattern for a single force. Preliminary waveformmodeling supports the single force mechanism and suggestsforces on the order of 109 N for event A and 109–1010 N forevent B.
Events C through E can roughly be correlated with turns inthe path of the debris flow, a product of seismic waves gen-erated by rotational accelerations. These events also occurwhen the short period energy is at its highest, suggesting thatthey coincide with peak debris flow velocities.
Event F is defined by a pulse nearly as high in amplitudeas Event B, indicating another massive impact force. Siteevidence showed that the debris flow burst out of CapricornCreek valley into the facing wall of the Meager Creek val-ley, impacting a steep slope on the opposite side and runningup 270 vertical meters before splitting up and down MeagerCreek valley. This impact on the valley wall is the interpretedsource for Event F.
Using these well-defined time markers and calculatingpath distance, we can make velocity estimates of the debrisflow at various stages along the path. We calculate an aver-age debris flow velocity of 67 m s−1. This is measured fromthe secondary peak failure (B) to the impact of the debris
Nat. Hazards Earth Syst. Sci., 12, 1277–1294, 2012 www.nat-hazards-earth-syst-sci.net/12/1277/2012/
R. H. Guthrie et al.: The 6 August 2010 Mount Meager rock slide-debris flow 1285
Fig. 7. Raw seismic signals from Mount Meager landslide recorded across southwestern Canada and northern Washington State (CNSN andPNSN data). Station and landslide location indicated on inset map.
flow at a right angle to Meager Creek (F), covering a distanceof about 7.3 km in 109 s. Rough velocity estimates betweeneach individual point are given on Table 2, including errormargins on distance and timing. The error margins are due touncertainties in defining points, selecting distances betweenpoints because these are not point sources, uncertainties inpicking arrival times for these long period pulses, and differ-ences in surface waves velocities at different periods. It ismore difficult to accurately define the end of the debris flow,as the energy fades gradually on the seismic record.
A second long-period seismic pulse occurs about 7 minafter the main collapse began. The waveform of Event His similar to event A, but smaller in amplitude, and is inter-preted as a subsequent smaller volume rock fall or rock slidefrom the now over-steepened face of Mount Meager, an “af-tershock” of sorts. Field work over the next month revealedthat smaller rock falls were frequent and ongoing from thesource zone.
There were no precursory seismic events recorded prior tothe main landslide. However, the seismic stations are 70 kmaway or farther, so small precursors might have escaped ourobservation.
3.5 Simulation using DAN-W
A first-order dynamic back analysis of the Mount Meagerrock avalanche was completed using the two-dimensionalnumerical simulation model DAN-W (Hungr, 1995; Hungrand McDougall, 2009). DAN-W has been used to simulatethe behavior (i.e. run-out distance, velocity along path, anddeposition) of a number of catastrophic landslides includingrock avalanches, debris avalanches, and debris flows (e.g.Hungr and Evans, 1996; Evans et al., 2001, 2007; Hungrand Evans, 2004; Sosio et al., 2008; among others).
A Voellmy rheology (Hungr, 1995) was selected to modelthe basal resistance of the moving mass. The Voellmy basalresistance model includes frictional (f ) and turbulence (ξ)
www.nat-hazards-earth-syst-sci.net/12/1277/2012/ Nat. Hazards Earth Syst. Sci., 12, 1277–1294, 2012
1286 R. H. Guthrie et al.: The 6 August 2010 Mount Meager rock slide-debris flow
Fig. 8. WSLR broadband recording of the landslide single-pass highpass filtered (>1 Hz top) and lowpass filtered (<0.2 Hz, bottom) andplotted with envelopes. Dashed vertical lines are labeled with letters that correspond to Fig. 9 and discussion in text.
Fig. 9. The complete outline of the Mount Meager landslide showing the initiation zone (A–B), the two major bends (C and E), the facingwall of Meager Creek (F), and the bifurcated flow that travelled up Meager Creek, and across the Lillooet River (G). The image was takenfollowing the breach of the Meager Creek dam, and fluvial reworking and considerable incision of the dam itself are evident.
Nat. Hazards Earth Syst. Sci., 12, 1277–1294, 2012 www.nat-hazards-earth-syst-sci.net/12/1277/2012/
R. H. Guthrie et al.: The 6 August 2010 Mount Meager rock slide-debris flow 1287
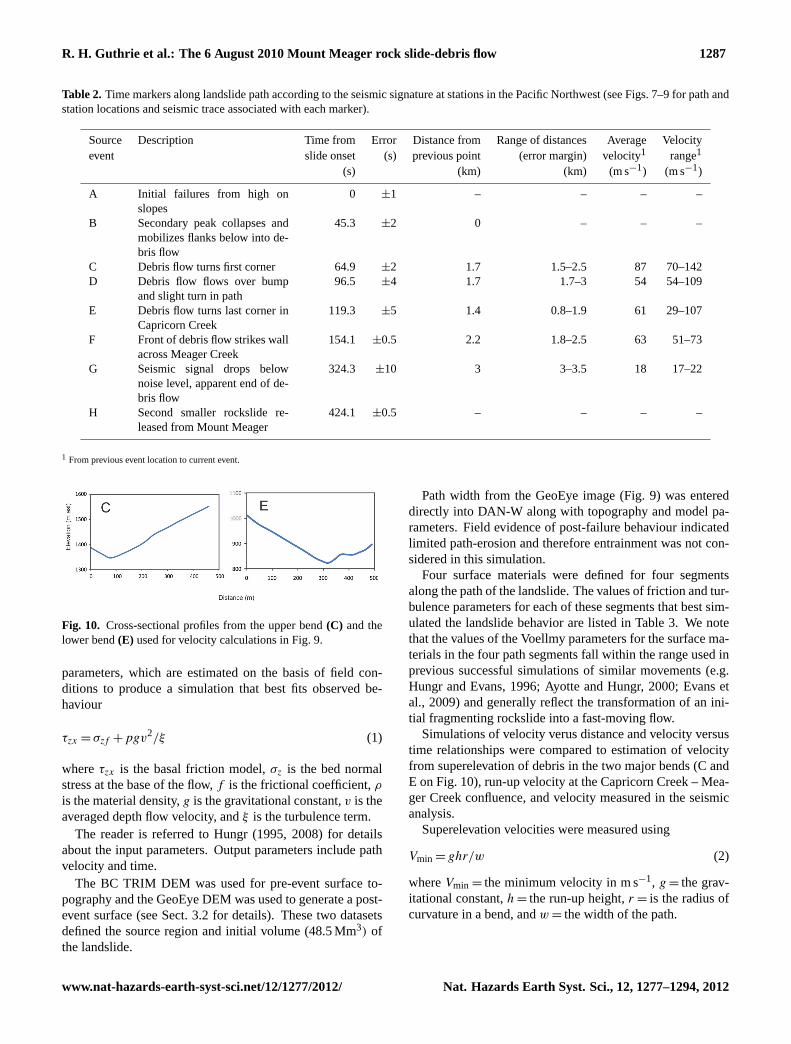
Table 2. Time markers along landslide path according to the seismic signature at stations in the Pacific Northwest (see Figs. 7–9 for path andstation locations and seismic trace associated with each marker).
Source Description Time from Error Distance from Range of distances Average Velocityevent slide onset (s) previous point (error margin) velocity1 range1
(s) (km) (km) (m s−1) (m s−1)
A Initial failures from high onslopes
0 ±1 – – – –
B Secondary peak collapses andmobilizes flanks below into de-bris flow
45.3 ±2 0 – – –
C Debris flow turns first corner 64.9 ±2 1.7 1.5–2.5 87 70–142D Debris flow flows over bump
and slight turn in path96.5 ±4 1.7 1.7–3 54 54–109
E Debris flow turns last corner inCapricorn Creek
119.3 ±5 1.4 0.8–1.9 61 29–107
F Front of debris flow strikes wallacross Meager Creek
154.1 ±0.5 2.2 1.8–2.5 63 51–73
G Seismic signal drops belownoise level, apparent end of de-bris flow
324.3 ±10 3 3–3.5 18 17–22
H Second smaller rockslide re-leased from Mount Meager
424.1 ±0.5 – – – –
1 From previous event location to current event.
Fig. 10. Cross-sectional profiles from the upper bend(C) and thelower bend(E) used for velocity calculations in Fig. 9.
parameters, which are estimated on the basis of field con-ditions to produce a simulation that best fits observed be-haviour
τzx = σzf +pgv2/ξ (1)
whereτzx is the basal friction model,σz is the bed normalstress at the base of the flow,f is the frictional coefficient,ρis the material density,g is the gravitational constant,v is theaveraged depth flow velocity, andξ is the turbulence term.
The reader is referred to Hungr (1995, 2008) for detailsabout the input parameters. Output parameters include pathvelocity and time.
The BC TRIM DEM was used for pre-event surface to-pography and the GeoEye DEM was used to generate a post-event surface (see Sect. 3.2 for details). These two datasetsdefined the source region and initial volume (48.5 Mm3) ofthe landslide.
Path width from the GeoEye image (Fig. 9) was entereddirectly into DAN-W along with topography and model pa-rameters. Field evidence of post-failure behaviour indicatedlimited path-erosion and therefore entrainment was not con-sidered in this simulation.
Four surface materials were defined for four segmentsalong the path of the landslide. The values of friction and tur-bulence parameters for each of these segments that best sim-ulated the landslide behavior are listed in Table 3. We notethat the values of the Voellmy parameters for the surface ma-terials in the four path segments fall within the range used inprevious successful simulations of similar movements (e.g.Hungr and Evans, 1996; Ayotte and Hungr, 2000; Evans etal., 2009) and generally reflect the transformation of an ini-tial fragmenting rockslide into a fast-moving flow.
Simulations of velocity verus distance and velocity versustime relationships were compared to estimation of velocityfrom superelevation of debris in the two major bends (C andE on Fig. 10), run-up velocity at the Capricorn Creek – Mea-ger Creek confluence, and velocity measured in the seismicanalysis.
Superelevation velocities were measured using
Vmin = ghr/w (2)
whereVmin = the minimum velocity in m s−1, g = the grav-itational constant,h = the run-up height,r = is the radius ofcurvature in a bend, andw = the width of the path.
www.nat-hazards-earth-syst-sci.net/12/1277/2012/ Nat. Hazards Earth Syst. Sci., 12, 1277–1294, 2012
1288 R. H. Guthrie et al.: The 6 August 2010 Mount Meager rock slide-debris flow
Table 3. Friction and turbulence parameters along path segmentsused in DAN-W.
Segment Path distance (m) Friction Turbulance
Start End (f ) (ξ )
1 0 1407 0.06 7502 1408 6452 0.1 9003 6453 7793 0.02 12504 7792 12 453 0.02 550
Run-up velocity was also measured at the Capricorn Creek– Meager Creek confluence using
Vmin = (2gh)0.5 (3)
whereVmin = the minimum velocity in m s−1, g = the gravi-tational constant, andh = the run-up height.
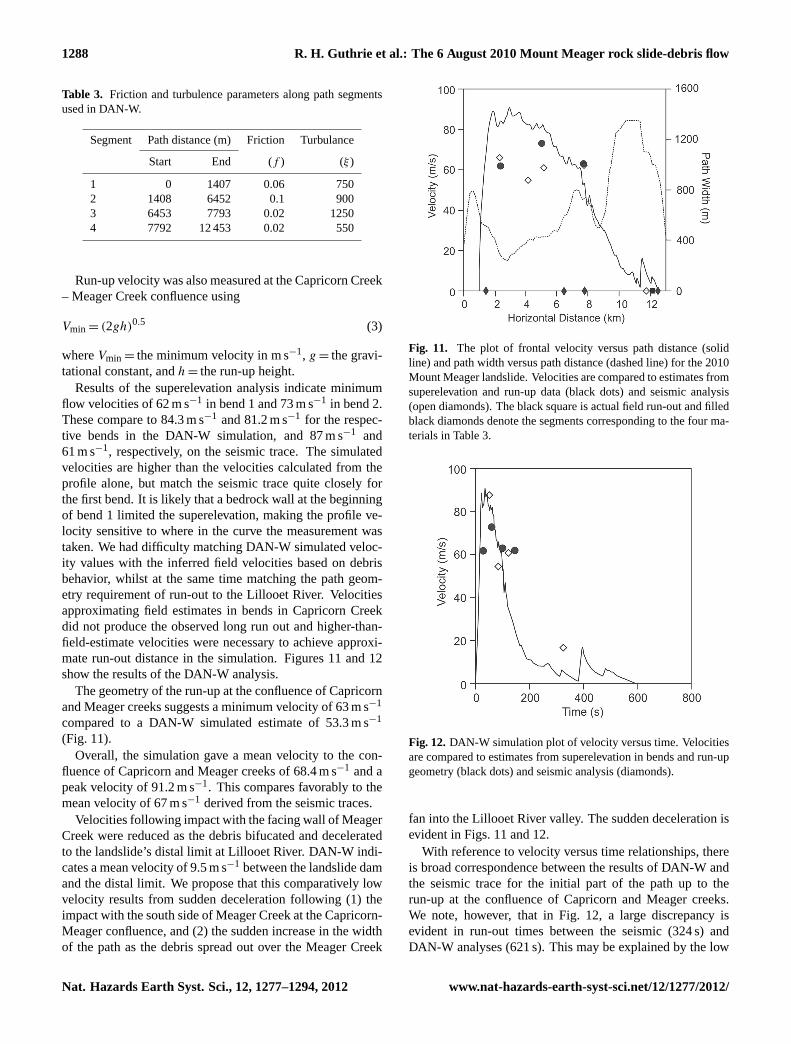
Results of the superelevation analysis indicate minimumflow velocities of 62 m s−1 in bend 1 and 73 m s−1 in bend 2.These compare to 84.3 m s−1 and 81.2 m s−1 for the respec-tive bends in the DAN-W simulation, and 87 m s−1 and61 m s−1, respectively, on the seismic trace. The simulatedvelocities are higher than the velocities calculated from theprofile alone, but match the seismic trace quite closely forthe first bend. It is likely that a bedrock wall at the beginningof bend 1 limited the superelevation, making the profile ve-locity sensitive to where in the curve the measurement wastaken. We had difficulty matching DAN-W simulated veloc-ity values with the inferred field velocities based on debrisbehavior, whilst at the same time matching the path geom-etry requirement of run-out to the Lillooet River. Velocitiesapproximating field estimates in bends in Capricorn Creekdid not produce the observed long run out and higher-than-field-estimate velocities were necessary to achieve approxi-mate run-out distance in the simulation. Figures 11 and 12show the results of the DAN-W analysis.
The geometry of the run-up at the confluence of Capricornand Meager creeks suggests a minimum velocity of 63 m s−1
compared to a DAN-W simulated estimate of 53.3 m s−1
(Fig. 11).Overall, the simulation gave a mean velocity to the con-
fluence of Capricorn and Meager creeks of 68.4 m s−1 and apeak velocity of 91.2 m s−1. This compares favorably to themean velocity of 67 m s−1 derived from the seismic traces.
Velocities following impact with the facing wall of MeagerCreek were reduced as the debris bifucated and deceleratedto the landslide’s distal limit at Lillooet River. DAN-W indi-cates a mean velocity of 9.5 m s−1 between the landslide damand the distal limit. We propose that this comparatively lowvelocity results from sudden deceleration following (1) theimpact with the south side of Meager Creek at the Capricorn-Meager confluence, and (2) the sudden increase in the widthof the path as the debris spread out over the Meager Creek
Fig. 11. The plot of frontal velocity versus path distance (solidline) and path width versus path distance (dashed line) for the 2010Mount Meager landslide. Velocities are compared to estimates fromsuperelevation and run-up data (black dots) and seismic analysis(open diamonds). The black square is actual field run-out and filledblack diamonds denote the segments corresponding to the four ma-terials in Table 3.
Fig. 12.DAN-W simulation plot of velocity versus time. Velocitiesare compared to estimates from superelevation in bends and run-upgeometry (black dots) and seismic analysis (diamonds).
fan into the Lillooet River valley. The sudden deceleration isevident in Figs. 11 and 12.
With reference to velocity versus time relationships, thereis broad correspondence between the results of DAN-W andthe seismic trace for the initial part of the path up to therun-up at the confluence of Capricorn and Meager creeks.We note, however, that in Fig. 12, a large discrepancy isevident in run-out times between the seismic (324 s) andDAN-W analyses (621 s). This may be explained by the low
Nat. Hazards Earth Syst. Sci., 12, 1277–1294, 2012 www.nat-hazards-earth-syst-sci.net/12/1277/2012/
R. H. Guthrie et al.: The 6 August 2010 Mount Meager rock slide-debris flow 1289
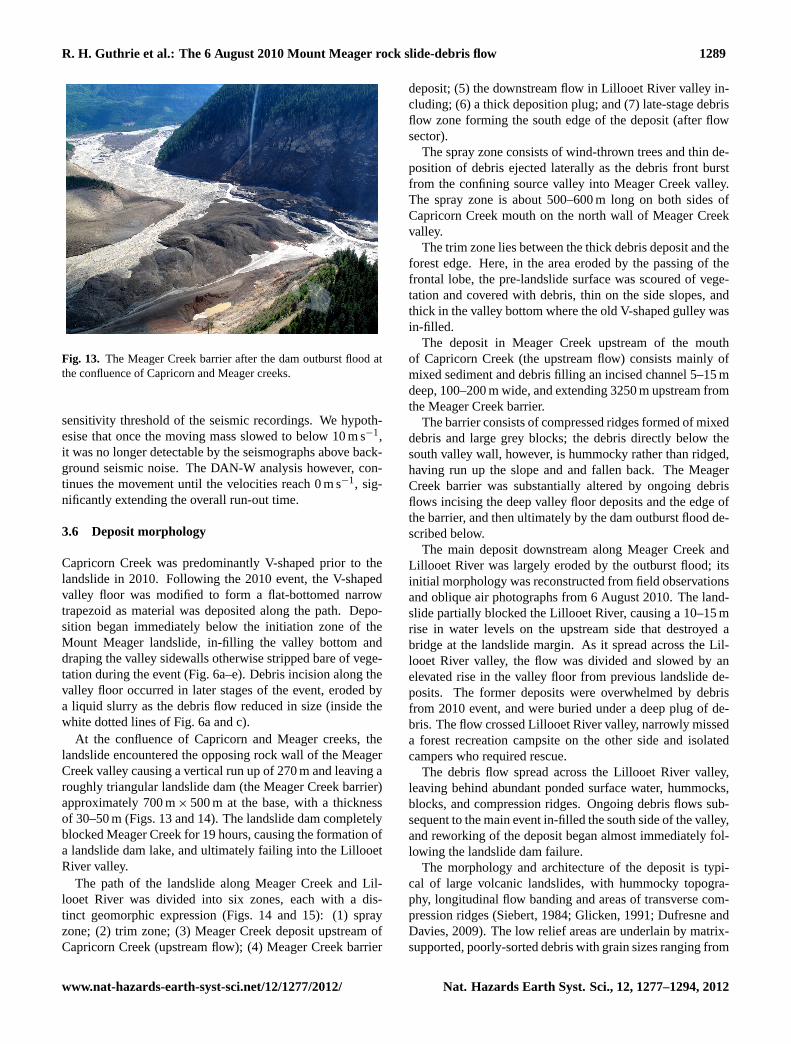
Fig. 13. The Meager Creek barrier after the dam outburst flood atthe confluence of Capricorn and Meager creeks.
sensitivity threshold of the seismic recordings. We hypoth-esise that once the moving mass slowed to below 10 m s−1,it was no longer detectable by the seismographs above back-ground seismic noise. The DAN-W analysis however, con-tinues the movement until the velocities reach 0 m s−1, sig-nificantly extending the overall run-out time.
3.6 Deposit morphology
Capricorn Creek was predominantly V-shaped prior to thelandslide in 2010. Following the 2010 event, the V-shapedvalley floor was modified to form a flat-bottomed narrowtrapezoid as material was deposited along the path. Depo-sition began immediately below the initiation zone of theMount Meager landslide, in-filling the valley bottom anddraping the valley sidewalls otherwise stripped bare of vege-tation during the event (Fig. 6a–e). Debris incision along thevalley floor occurred in later stages of the event, eroded bya liquid slurry as the debris flow reduced in size (inside thewhite dotted lines of Fig. 6a and c).
At the confluence of Capricorn and Meager creeks, thelandslide encountered the opposing rock wall of the MeagerCreek valley causing a vertical run up of 270 m and leaving aroughly triangular landslide dam (the Meager Creek barrier)approximately 700 m× 500 m at the base, with a thicknessof 30–50 m (Figs. 13 and 14). The landslide dam completelyblocked Meager Creek for 19 hours, causing the formation ofa landslide dam lake, and ultimately failing into the LillooetRiver valley.
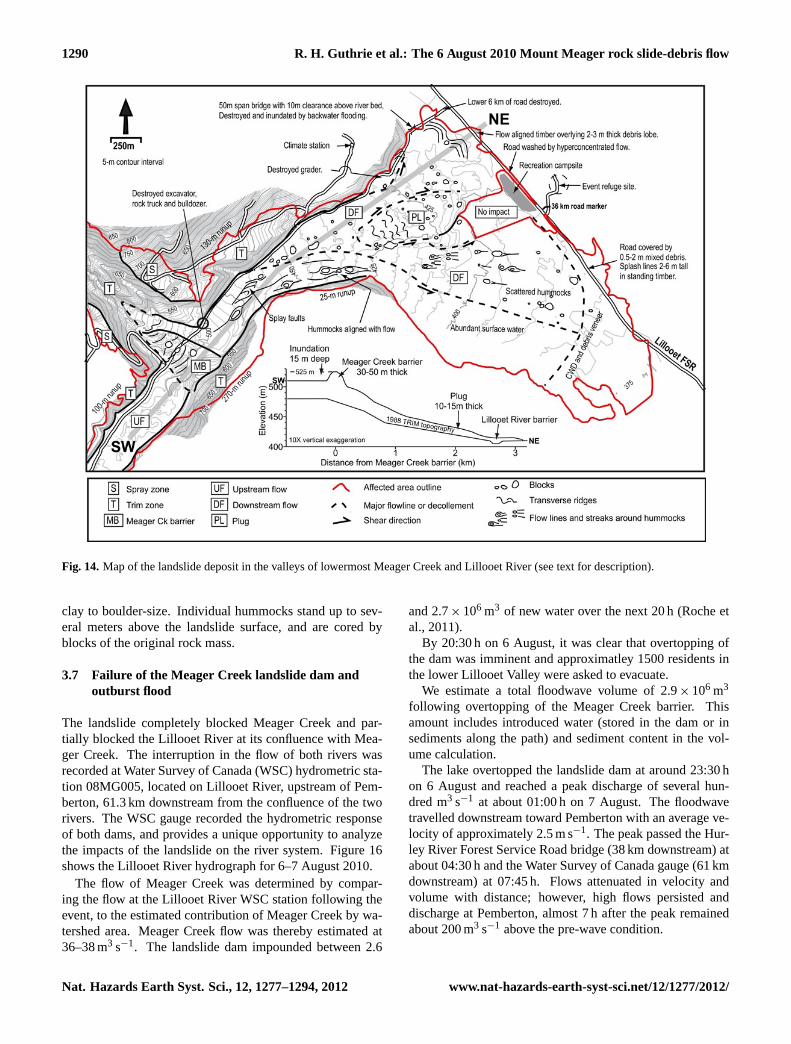
The path of the landslide along Meager Creek and Lil-looet River was divided into six zones, each with a dis-tinct geomorphic expression (Figs. 14 and 15): (1) sprayzone; (2) trim zone; (3) Meager Creek deposit upstream ofCapricorn Creek (upstream flow); (4) Meager Creek barrier
deposit; (5) the downstream flow in Lillooet River valley in-cluding; (6) a thick deposition plug; and (7) late-stage debrisflow zone forming the south edge of the deposit (after flowsector).
The spray zone consists of wind-thrown trees and thin de-position of debris ejected laterally as the debris front burstfrom the confining source valley into Meager Creek valley.The spray zone is about 500–600 m long on both sides ofCapricorn Creek mouth on the north wall of Meager Creekvalley.
The trim zone lies between the thick debris deposit and theforest edge. Here, in the area eroded by the passing of thefrontal lobe, the pre-landslide surface was scoured of vege-tation and covered with debris, thin on the side slopes, andthick in the valley bottom where the old V-shaped gulley wasin-filled.
The deposit in Meager Creek upstream of the mouthof Capricorn Creek (the upstream flow) consists mainly ofmixed sediment and debris filling an incised channel 5–15 mdeep, 100–200 m wide, and extending 3250 m upstream fromthe Meager Creek barrier.
The barrier consists of compressed ridges formed of mixeddebris and large grey blocks; the debris directly below thesouth valley wall, however, is hummocky rather than ridged,having run up the slope and and fallen back. The MeagerCreek barrier was substantially altered by ongoing debrisflows incising the deep valley floor deposits and the edge ofthe barrier, and then ultimately by the dam outburst flood de-scribed below.
The main deposit downstream along Meager Creek andLillooet River was largely eroded by the outburst flood; itsinitial morphology was reconstructed from field observationsand oblique air photographs from 6 August 2010. The land-slide partially blocked the Lillooet River, causing a 10–15 mrise in water levels on the upstream side that destroyed abridge at the landslide margin. As it spread across the Lil-looet River valley, the flow was divided and slowed by anelevated rise in the valley floor from previous landslide de-posits. The former deposits were overwhelmed by debrisfrom 2010 event, and were buried under a deep plug of de-bris. The flow crossed Lillooet River valley, narrowly misseda forest recreation campsite on the other side and isolatedcampers who required rescue.
The debris flow spread across the Lillooet River valley,leaving behind abundant ponded surface water, hummocks,blocks, and compression ridges. Ongoing debris flows sub-sequent to the main event in-filled the south side of the valley,and reworking of the deposit began almost immediately fol-lowing the landslide dam failure.
The morphology and architecture of the deposit is typi-cal of large volcanic landslides, with hummocky topogra-phy, longitudinal flow banding and areas of transverse com-pression ridges (Siebert, 1984; Glicken, 1991; Dufresne andDavies, 2009). The low relief areas are underlain by matrix-supported, poorly-sorted debris with grain sizes ranging from
www.nat-hazards-earth-syst-sci.net/12/1277/2012/ Nat. Hazards Earth Syst. Sci., 12, 1277–1294, 2012
1290 R. H. Guthrie et al.: The 6 August 2010 Mount Meager rock slide-debris flow
Fig. 14. Map of the landslide deposit in the valleys of lowermost Meager Creek and Lillooet River (see text for description).
clay to boulder-size. Individual hummocks stand up to sev-eral meters above the landslide surface, and are cored byblocks of the original rock mass.
3.7 Failure of the Meager Creek landslide dam andoutburst flood
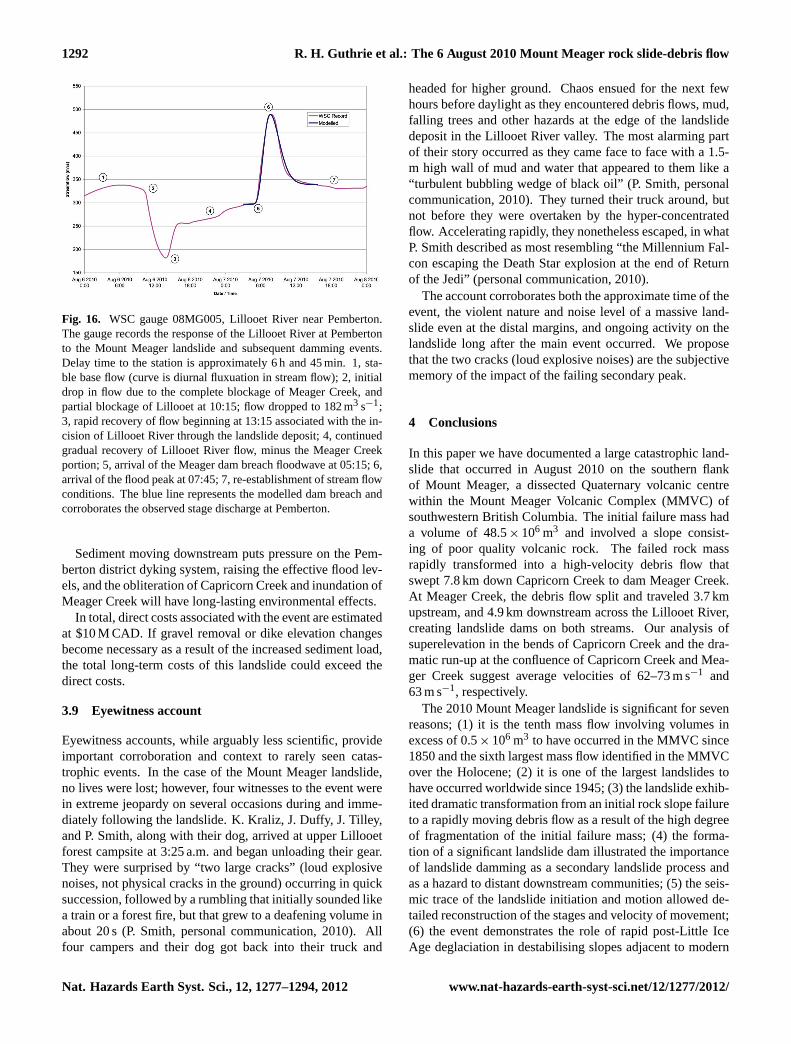
The landslide completely blocked Meager Creek and par-tially blocked the Lillooet River at its confluence with Mea-ger Creek. The interruption in the flow of both rivers wasrecorded at Water Survey of Canada (WSC) hydrometric sta-tion 08MG005, located on Lillooet River, upstream of Pem-berton, 61.3 km downstream from the confluence of the tworivers. The WSC gauge recorded the hydrometric responseof both dams, and provides a unique opportunity to analyzethe impacts of the landslide on the river system. Figure 16shows the Lillooet River hydrograph for 6–7 August 2010.
The flow of Meager Creek was determined by compar-ing the flow at the Lillooet River WSC station following theevent, to the estimated contribution of Meager Creek by wa-tershed area. Meager Creek flow was thereby estimated at36–38 m3 s−1. The landslide dam impounded between 2.6
and 2.7× 10⁶ m3 of new water over the next 20 h (Roche etal., 2011).
By 20:30 h on 6 August, it was clear that overtopping ofthe dam was imminent and approximatley 1500 residents inthe lower Lillooet Valley were asked to evacuate.
We estimate a total floodwave volume of 2.9× 10⁶ m3
following overtopping of the Meager Creek barrier. Thisamount includes introduced water (stored in the dam or insediments along the path) and sediment content in the vol-ume calculation.
The lake overtopped the landslide dam at around 23:30 hon 6 August and reached a peak discharge of several hun-dred m3 s−1 at about 01:00 h on 7 August. The floodwavetravelled downstream toward Pemberton with an average ve-locity of approximately 2.5 m s−1. The peak passed the Hur-ley River Forest Service Road bridge (38 km downstream) atabout 04:30 h and the Water Survey of Canada gauge (61 kmdownstream) at 07:45 h. Flows attenuated in velocity andvolume with distance; however, high flows persisted anddischarge at Pemberton, almost 7 h after the peak remainedabout 200 m3 s−1 above the pre-wave condition.
Nat. Hazards Earth Syst. Sci., 12, 1277–1294, 2012 www.nat-hazards-earth-syst-sci.net/12/1277/2012/
R. H. Guthrie et al.: The 6 August 2010 Mount Meager rock slide-debris flow 1291
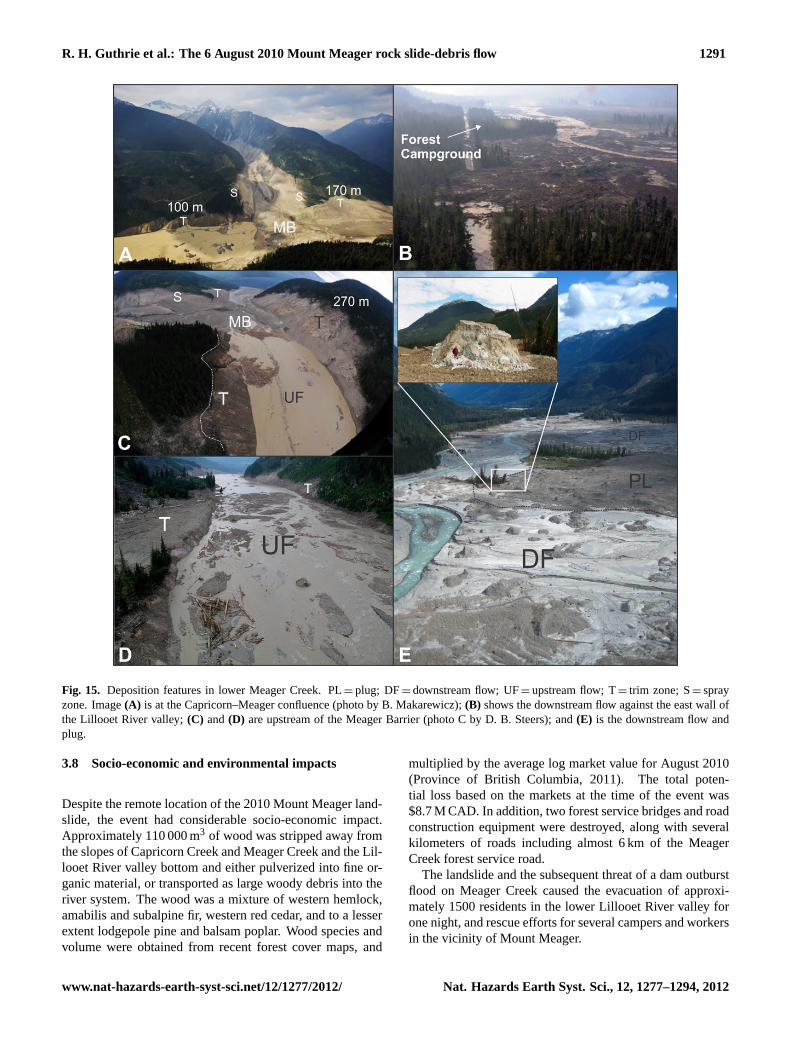
Fig. 15. Deposition features in lower Meager Creek. PL= plug; DF= downstream flow; UF= upstream flow; T= trim zone; S= sprayzone. Image(A) is at the Capricorn–Meager confluence (photo by B. Makarewicz);(B) shows the downstream flow against the east wall ofthe Lillooet River valley;(C) and(D) are upstream of the Meager Barrier (photo C by D. B. Steers); and(E) is the downstream flow andplug.
3.8 Socio-economic and environmental impacts
Despite the remote location of the 2010 Mount Meager land-slide, the event had considerable socio-economic impact.Approximately 110 000 m3 of wood was stripped away fromthe slopes of Capricorn Creek and Meager Creek and the Lil-looet River valley bottom and either pulverized into fine or-ganic material, or transported as large woody debris into theriver system. The wood was a mixture of western hemlock,amabilis and subalpine fir, western red cedar, and to a lesserextent lodgepole pine and balsam poplar. Wood species andvolume were obtained from recent forest cover maps, and
multiplied by the average log market value for August 2010(Province of British Columbia, 2011). The total poten-tial loss based on the markets at the time of the event was$8.7 M CAD. In addition, two forest service bridges and roadconstruction equipment were destroyed, along with severalkilometers of roads including almost 6 km of the MeagerCreek forest service road.
The landslide and the subsequent threat of a dam outburstflood on Meager Creek caused the evacuation of approxi-mately 1500 residents in the lower Lillooet River valley forone night, and rescue efforts for several campers and workersin the vicinity of Mount Meager.
www.nat-hazards-earth-syst-sci.net/12/1277/2012/ Nat. Hazards Earth Syst. Sci., 12, 1277–1294, 2012
1292 R. H. Guthrie et al.: The 6 August 2010 Mount Meager rock slide-debris flow
Fig. 16. WSC gauge 08MG005, Lillooet River near Pemberton.The gauge records the response of the Lillooet River at Pembertonto the Mount Meager landslide and subsequent damming events.Delay time to the station is approximately 6 h and 45 min. 1, sta-ble base flow (curve is diurnal fluxuation in stream flow); 2, initialdrop in flow due to the complete blockage of Meager Creek, andpartial blockage of Lillooet at 10:15; flow dropped to 182 m3 s−1;3, rapid recovery of flow beginning at 13:15 associated with the in-cision of Lillooet River through the landslide deposit; 4, continuedgradual recovery of Lillooet River flow, minus the Meager Creekportion; 5, arrival of the Meager dam breach floodwave at 05:15; 6,arrival of the flood peak at 07:45; 7, re-establishment of stream flowconditions. The blue line represents the modelled dam breach andcorroborates the observed stage discharge at Pemberton.
Sediment moving downstream puts pressure on the Pem-berton district dyking system, raising the effective flood lev-els, and the obliteration of Capricorn Creek and inundation ofMeager Creek will have long-lasting environmental effects.
In total, direct costs associated with the event are estimatedat $10 M CAD. If gravel removal or dike elevation changesbecome necessary as a result of the increased sediment load,the total long-term costs of this landslide could exceed thedirect costs.
3.9 Eyewitness account
Eyewitness accounts, while arguably less scientific, provideimportant corroboration and context to rarely seen catas-trophic events. In the case of the Mount Meager landslide,no lives were lost; however, four witnesses to the event werein extreme jeopardy on several occasions during and imme-diately following the landslide. K. Kraliz, J. Duffy, J. Tilley,and P. Smith, along with their dog, arrived at upper Lillooetforest campsite at 3:25 a.m. and began unloading their gear.They were surprised by “two large cracks” (loud explosivenoises, not physical cracks in the ground) occurring in quicksuccession, followed by a rumbling that initially sounded likea train or a forest fire, but that grew to a deafening volume inabout 20 s (P. Smith, personal communication, 2010). Allfour campers and their dog got back into their truck and
headed for higher ground. Chaos ensued for the next fewhours before daylight as they encountered debris flows, mud,falling trees and other hazards at the edge of the landslidedeposit in the Lillooet River valley. The most alarming partof their story occurred as they came face to face with a 1.5-m high wall of mud and water that appeared to them like a“turbulent bubbling wedge of black oil” (P. Smith, personalcommunication, 2010). They turned their truck around, butnot before they were overtaken by the hyper-concentratedflow. Accelerating rapidly, they nonetheless escaped, in whatP. Smith described as most resembling “the Millennium Fal-con escaping the Death Star explosion at the end of Returnof the Jedi” (personal communication, 2010).
The account corroborates both the approximate time of theevent, the violent nature and noise level of a massive land-slide even at the distal margins, and ongoing activity on thelandslide long after the main event occurred. We proposethat the two cracks (loud explosive noises) are the subjectivememory of the impact of the failing secondary peak.
4 Conclusions
In this paper we have documented a large catastrophic land-slide that occurred in August 2010 on the southern flankof Mount Meager, a dissected Quaternary volcanic centrewithin the Mount Meager Volcanic Complex (MMVC) ofsouthwestern British Columbia. The initial failure mass hada volume of 48.5× 10⁶ m3 and involved a slope consist-ing of poor quality volcanic rock. The failed rock massrapidly transformed into a high-velocity debris flow thatswept 7.8 km down Capricorn Creek to dam Meager Creek.At Meager Creek, the debris flow split and traveled 3.7 kmupstream, and 4.9 km downstream across the Lillooet River,creating landslide dams on both streams. Our analysis ofsuperelevation in the bends of Capricorn Creek and the dra-matic run-up at the confluence of Capricorn Creek and Mea-ger Creek suggest average velocities of 62–73 m s−1 and63 m s−1, respectively.
The 2010 Mount Meager landslide is significant for sevenreasons; (1) it is the tenth mass flow involving volumes inexcess of 0.5× 10⁶ m3 to have occurred in the MMVC since1850 and the sixth largest mass flow identified in the MMVCover the Holocene; (2) it is one of the largest landslides tohave occurred worldwide since 1945; (3) the landslide exhib-ited dramatic transformation from an initial rock slope failureto a rapidly moving debris flow as a result of the high degreeof fragmentation of the initial failure mass; (4) the forma-tion of a significant landslide dam illustrated the importanceof landslide damming as a secondary landslide process andas a hazard to distant downstream communities; (5) the seis-mic trace of the landslide initiation and motion allowed de-tailed reconstruction of the stages and velocity of movement;(6) the event demonstrates the role of rapid post-Little IceAge deglaciation in destabilising slopes adjacent to modern
Nat. Hazards Earth Syst. Sci., 12, 1277–1294, 2012 www.nat-hazards-earth-syst-sci.net/12/1277/2012/
R. H. Guthrie et al.: The 6 August 2010 Mount Meager rock slide-debris flow 1293
glaciers; and (7) it represents a unique opportunity to con-sider hazard and risk from catastrophic failures to mountaincommunities.
The event illustrates the extreme landslide hazard ofglacier-clad dissected Quaternary volcanic centres, which re-sults from the existence of steep slopes in poor quality rock(reflecting such factors as hydrothermal alteration and het-erogeneity of volcanic products). In this geological envi-ronment, landslides are a major process of denudation and,through transformation into debris flows, deliver large vol-umes of debris to river systems.
Acknowledgements.The authors gratefully acknowledge logisticalsupport provided by the province of British Columbia, the Centrefor Natural Hazard Research at the Simon Fraser University, andthe Landslide Research Programme at the University of Waterloo.
Edited by: D. KeeferReviewed by: E. Harp and another anonymous referee
References
Ayotte, D. and Hungr, O.: Calibration of a runout prediction modelfor debris flows and avalanches, in: Proceedings of the 2nd Inter-national Conference on Debris Flows, Taipei, edited by: Wiec-zorek, G. F. and Naeser, N. D., Balkema, Rotterdam, 505–514,2000.
Berrocal, J., Espinosa, A. F., and Galdos, J.: Seismological andgeological aspects of the Mantaro landslide in Peru, Nature, 275,532–536, 1978.
Bovis, M. J. and Jakob, M.: The July 29, 1998, debris flow and land-slide dam at Capricorn Creek, Mount Meager Volcanic Complex,southern Coast Mountains, British Columbia, Can. J. Earth Sci.,37, 1321–1334, 2000.
Brodsky, E. E, Gordeev, E., and Kanamori, H.: Landslide basalfriction as measured by seismic waves, Geophys. Res. Lett., 30,2236 I-1–2236 I-5, 2003.
Carter, N. M.: Exploration in the Lillooet River watershed, Can.Alpine J., 21, 8–18, 1932.
Clague, J. J.: Late Quaternary Geology and Geochronologyof British Columbia Part 2: Summary and Discussion ofRadiocarbon-dated Quaternary History, Geol. Surv. Can. Pap.,80–35, 41 pp., 1981.
Clague, J. J., Evans, S. G., Rampton, V. N., and Woodsworth, G. J.:Improved age estimates for the White River and Bridge Rivertephras, western Canada, Can. J. Earth Sci., 32, 1172–1179,1995.
Croft, S. A. S.: Stability Assessment of the Capricorn Creek Valley,British Columbia, B.Sc. thesis, University of British Columbia,Vancouver, BC, 1983.
Dahlen, F. H.: Single-force representation of shallow landslidesources, Bull. Seismol. Soc. Am., 83, 130–143, 1993.
Decker, F., Fougberg, M., and Ronayne, M.: Pemberton: The His-tory of a Settlement, Hemlock Printing Ltd., Burnaby, BC, 1977.
Deparis, J., Jongmans, D., Cotton, F., Baillet, L., Thouvenot, F., andHantz, D.: Analysis of rock-fall and rock-fall avalanche seismo-grams in the French Alps, Bull. Seismol. Soc. Am., 98, 1781–1796, 2008.
Dufresne, A. and Davies, T. R.: Longitudinal ridges in mass move-ment deposits, Geomorphology, 105, 171–181, 2009.
Evans, S. G.: A rock avalanche from the peak of Mount Meager,British Columbia, Geol. Surv. Can. Pap. 87-1A, 929–934, 1987.
Evans, S. G.: Landslides, in: A synthesis of Geological Hazards inCanada, Geol. Surv. Can. Bull., 548, 43–80, 2001.
Evans, S. G.: Single event landslides resulting from massive rockslope failure: Characterising their frequency and impact on soci-ety, in: Landslides from Massive Rock Slope Failure, edited by:Evans, S. G., Scarascia-Mugnozza, G., Strom, A. L., and Her-manns, R. L., NATO Sci. Ser. IV, Earth Environ. Sci., Springer,Dordrecht, 49, 53–73, 2006.
Evans, S. G., Hungr, O., and Clague, J. J.: Dynamics of the 1984rock avalanche and associated debris flow on Mount Cayley,British Columbia, Canada; Implications for landslide hazard as-sessment on dissected volcanoes, Eng. Geol., 61, 29–51, 2001.
Evans, S. G., Guthrie, R. H., Roberts, N. J., and Bishop, N.F.: The disastrous 17 February 2006 rockslide-debris avalancheon Leyte Island, Philippines: a catastrophic landslide in tropi-cal mountain terrain, Nat. Hazards Earth Syst. Sci., 7, 89–101,doi:10.5194/nhess-7-89-2007, 2007.
Evans, S. G., Roberts, N. J., Ischuck, A., Delaney, K. B., Morozova,G. S., and Tutubalina, O.: Landslides triggered by the 1949 Khaitearthquake, Tajikistan, and associated loss of life, Eng. Geol.,109, 195–212, 2009.
Friele, P. and Clague, J. J.: Large Holocene landsldies from Py-lon Peak, southwestern British Columbia, Can. J. Earth Sci., 41,165–182, 2004.
Friele, P. and Clague, J.J.: Paraglacial geomorphology of Qua-ternary volcanic landscapes in the southern Coast Mountains,British Columbia, in: Periglacial and Paraglacial Processes andEnvironments, edited by: Knight, J. and Harrison, S., Geol. Soc.Spec. Publ. London, 320, 219–233, 2009.
Friele, P., Clague, J. J., Simpson, K., and Stasiuk, M.: Impact ofa Quaternary volcano on Holocene sedimentation in the LillooetRiver valley, British Columbia, Sediment. Geol., 176, 305–322,2005.
Friele, P., Jakob, M., and Clague, J. J.: Hazard and risk fromlarge landslides from Mount Meager volcano, British Columbia,Canada, Georisk, 2, 48–64, 2008.
Glicken, H.: Sedimentary architecture of large volcanic-debrisavalanches, in: Sedimentation in volcanic settings, edited by:Smith, G. A. and Fisher, R. V., SEPM, Tulsa, Special Publica-tion, 45, 99–106, 1991.
Guthrie, R. H. and Evans, S. G.: Work, persistence and formativeevents: The geomorphic impact of landslides, Geomorphology,88, 266–275, 2007.
Hickson, C. J.: Character of volcanism, volcanic hazards, and risk,northern end of the Cascade magmatic arc, British Colubmia andWashington State, in: Geology and Geological Hazards of theVancouver Region, Southwestern British Columbia, edited by:Monger, J. W. H., Geol. Surv. Can. Bull., 481, 231–250, 1994.
Holm, K., Bovis, M., and Jakob, M.: The landslide response ofalpine basins to post-Little Ice Age glacial thinning and retreat insouthwestern British Columbia, Geomorphology, 57, 201–216,2004.
Huang, C.-J., Yin, H.-Y, Chen, C.-Y., Yeh, C.-H., and Wang, C.-L.:Ground vibrations produced by rock motions and debris flows, J.Geophys. Res., 112, F02014,doi:10.1029/2005JF000437, 2007.
www.nat-hazards-earth-syst-sci.net/12/1277/2012/ Nat. Hazards Earth Syst. Sci., 12, 1277–1294, 2012
1294 R. H. Guthrie et al.: The 6 August 2010 Mount Meager rock slide-debris flow
Hungr, O.: A model for the runout analysis of rapid flow slides, de-bris flows, and avalanches, Can. Geotech. J., 32, 610–623, 1995.
Hungr, O.: Simplified models of spreading flow of dry granularmaterial, Can. Geotech. J., 45, 1156–1168, 2008.
Hungr, O. and Evans, S. G.: Rock avalanche runout prediction usinga dynamic model, in: Proceedings of the 7th International Sym-posium on Landslides, Trondheim, Norway, 1, 233–238, 1996.
Hungr, O. and Evans, S. G.: Entrainment of debris in rockavalanches: An analysis of a long run-out mechanism, Geol. Soc.Am. Bull., 116, 1240–1252, 2004.
Hungr, O. and McDougall, S.: Two numerical models for landslidedynamic analysis, Comp. Geosci., 35, 978–992, 2009.
Jakob, M.: Morphometric and Geotechnical Controls on De-bris Flow Frequency and Magnitude in Southwestern BritishColumbia. Ph.D. thesis, University of British Columbia, Vancou-ver, BC, 1996.
Jordan, P.: Debris Flows in the Southern Coast Mountains, BritishColumbia: Dynamic behaviour and physical properties, Ph.D.thesis, University of British Columbia, Vancouver, BC, 1994.
Julian, B. R., Miller, A. D., and Foulger, G. R.: Non-double-coupleEearthquakes, 1. Theory, Rev. Geophys., 36, 525–549, 1998.
Kanamori, H. and Given, J. W.: Analysis of long-period seismicwaves excited by the May 18, 1980 eruption of Mount St. He-lens – A terrestrial monopole?, J. Geophys. Res., 87, 5422–5432,1982.
Lipovsky, P. S., Evans, S. G., Clague, J. J., Hopkinson, C., Couture,R., Bobrowsky, P., Ekstrom, G., Demuth, M. N., Delaney, K. B.,Roberts, N. J., Clarke, G., and Schaeffer, A.: The July 2007 rockand ice avalanches at Mount Steele, St. Elias Mountains, Yukon,Canada, Landslides, 5, 445–455,doi:10.1007/s10346-008-0133-4, 2008.
Mathews, W. H. and McTaggart, K. C.: Hope rockslides, BritishColumbia Canada, in: Rockslides and Avalanches, Natural Phe-nomona, edited by: Voight, B., Elsevier, New York, 259–275,1978.
McNeely, R. and McCuaig, S.: Geological Survey of Canada Ra-diocarbon Dates XXIX, Geol. Surv. Can. Pap. 89–9, 1991.
McSaveney, M. J. and Downes, G.: Application of landslide seis-mology to some New Zealand rock avalanches, in: Landslides,edited by: Rybar, J., Stemberk, J., and Wagner, P., Balkema,Lisse, 649–654, 2002.
Mokievsky-Zubok, O.: Glacier caused slide near Pylon Peak,British Columbia, Can. J. Earth Sci., 15, 1039–1052, 1977.
Nasmith, H., Mathews, W. H., and Rouse, G. E.: Bridge River ashand some other Recent ash beds in British Columbia, Can. J.Earth Sci., 4, 163–170, 1967.
Norris, R. D.: Seismicity of rockfalls and avalanches at three Cas-cade Range volcanoes: Implications for seismic detection of haz-ardous mass movements, Bull. Seismol. Soc. Am., 84, 1925–1939, 1994.
Province of British Columbia: Coast selling price system, averagelog prices for the 1 month period ending 2010-08-31, Province ofBritish Columbia, Ministry of Forests, Mines and Lands onlineresource, available at:http://www.for.gov.bc.ca/hva/logreportscoast.htm, last access: 4 March 2011.
Read, P. B.: Geology, Meager Creek Geothermal Area, BritishColumbia, Geol. Surv. Can. Open File 603, 1978.
Read, P. B.: Mount Meager complex, Garibaldi Belt, southwesternBritish Columbia, Geosci. Can., 17, 167–170, 1990.
Roche, A. D., Guthrie, R. H., Roberts, N. J., Ellis, E., and Friele,P.: Once more into the breach: A forensic analysis of the Au-gust 2010 landslide dam outburst flood at Meager Creek, BritishColumbia, in: Proceedings of the 5th Canadian Conference onGeotechnique and Natural Hazards, Canadian Geotechnical So-ciety, May 15–17, 2011, Kelowna, BC, 10 pp., 2011.
Siebert, L.: Large volcanic debris avalanches: Characteristics ofsource areas, deposits and associated eruptions, J. Volc. Geo.Res., 22, 163–197, 1984.
Simpson, K. A., Stasiuk, M., Shimamura, K., Clague, J. J., andFriele, P. A.: Evidence for catastrophic volcanic debris flows inPemberton Valley, British Columbia, Can. J. Earth Sci., 43, 679–689, 2006.
Sosio, R., Crosta, G. B., and Hungr, O.: Complete dynamic model-ing calibration for the Thurwieser rock avalanche (Italian CentralAlps), Eng. Geol., 100, 11–26, 2008.
Stasiuk, M. V., Russell, J. K., and Hickson, C. J.: Distribution,nature, and origins of the 2400 BP eruption products of MountMeager, British Columbia, Linkages between magma chemistryand eruption behaviour, Geol. Surv. Can. Bull., 486, 1–27 1996.
Stewart, M.: Dacite Block and Ash Avalanche Hazards in Moun-tainous Terrain: 2360 yr BP Eruption of Mount Meager, BritishColumbia, M.Sc. thesis, University of British Columbia, 2002.
Weichert, D., Horner, R. B., and Evans, S. G.: Seismic signatures oflandslides: The 1990 Brenda Mine collapse and the 1965 Hoperockslides, Bull. Seismol. Soc. Am., 84, 1523–1532, 1994.
Westgate, J. A. and Dreimanis, A.: Volcanic ash layers of Recentage at Banff National Park, Alberta, Canada, Can. J. Earth Sci.,4, 155–161, 1967.
Nat. Hazards Earth Syst. Sci., 12, 1277–1294, 2012 www.nat-hazards-earth-syst-sci.net/12/1277/2012/