Embed Size (px)
Citation preview

2
Intro
Executive Summary
Buying Committees
Information Sources Used to Make Buying Decisions
Reviews
Product Demos
Analysts
The Buyer’s Journey
Leads
Conclusion
Study Demographics
About TrustRadius
3
5
6
13
18
36
42
47
54
60
61
64
TABLE OF CONTENTS

3
Why we do this annual studyOur goal with the B2B Buying Disconnect study is to take a pulse on our industry.
How are companies buying and selling software and hardware products?
Where do buyers and sellers jive?
Where are they out of sync?
And how do these factors affect the way we relate to the companies that provide us with the technology we use at work?
What about the way we relate to coworkers around the use of technology? Or our peers at other organizations, who’re struggling or succeeding with software and hardware products right alongside us?
This matters to us at TrustRadius, because our mission is to help buyers make great decisions, while helping vendors get and keep great customers. We aim to learn as much as we can about that relationship. It helps us be better advisors to the vendors we work with, and helps us make the right decisions for our own users too. We conduct this study every year to provide a strategic outlook for the coming year.
If you’re interested in looking at how the industry has changed over time, and some of the trends and special topics from years past, check out these previous B2B Buying Disconnect Reports published by TrustRadius:
2019 B2B Buying Disconnect Report
2018 B2B Buying Disconnect Report
What’s in the reportThe 4th annual report covers modern technology buyers, their journey, including how they get in touch with vendors, and the sources of information they consult along the way. It looks closely at some of the key resources buyers and vendors rely on—analysts, product demos (as well as the vendor reps who guide them), and user reviews. It also provides buyers and vendors with advice on responding to trends, tips for how to apply all of this information, and best practices based on what we’ve seen work with our clients, our partners, and in our own organization.
MethodologyThis year, we had 1,036 professionals who helped buy new software or hardware for their organization in the last year (technology buyers) and 449 professionals who work in marketing or sales at companies that provide software or hardware to other businesses (technology vendors) take aligning surveys. That makes for a total of nearly 1.5K respondents (1,485 to be precise)! Responses to the online survey were sourced from TrustRadius’ global network of contacts. Responses were collected in October 2019. All respondents were offered a nominal incentive ($15 gift card) as a thank you for their time. You can find respondent demographic details here. For a full list of questions and answer choices, email us at [email protected].
INTRO

4
Who we areTrustRadius is the customer voice and insights platform that helps tech buyers make great decisions, and helps technology vendors acquire and retain great customers.
Technology buying has high stakes—your company’s success is on the line. In a world where buyers don’t trust marketing and vendors struggle to reach the right audience and tell their unique story, both buyers and vendors are searching for insights they can rely on.
Unlike marketing, we tell it like it is, without spin. Unlike analysts who have never used the product they’re reviewing, we represent the voice of users like you. TrustRadius delivers trusted, professional-quality insights that drive action.
We’ve collected hundreds of thousands of user reviews and ratings of business hardware and software products. Our reviews are professional quality, averaging over 400 words. 96% of the Fortune 100 has written one or more reviews on TrustRadius.com, and we make sure that every review is from a real user.
Over 60% of TrustRadius traffic comes from companies with 1,000 employees or more. The biggest companies rely on us. IBM, Cisco, Adobe, SAP, and more find us a vital partner.
Headquartered in Austin, TX, TrustRadius was founded by successful entrepreneurs and is backed by the Mayfield Fund, LiveOak Venture Partners, and Next Coast Ventures.
5
Here are some of the most interesting things we learned, that business leaders should be aware of as they make decisions for 2020:
1. The average buyer consults 5.1 different sources of information to make a purchase decision.2. Nearly half of buyers who were involved in purchase decisions (49%) do not engage directly with the vendor’s representatives themselves.3. More than half of all buyers (52%) use reviews.4. The most important factor when evaluating a business technology product on a review site is the review content (qualitative feedback). 39% of buyers say this is the key for their evaluations. Only 16% of buyers say the product’s overall score is the most important factor, a 27% drop from buyers who were focused on scores in 2017.
5. 77% of buyers say it is very important to understand the cons before making a purchase. But only 33% of vendors say they think it is very important to buyers to understand the cons before buying. This gap is increasing year over year. Feedback on challenges and limitations is another important piece of information buyers find in reviews.
6. Vendors are now more likely to use reviews with prospects than not. 58% of vendors deploy user reviews as a tactic to educate and engage prospects. This is a 35% increase from last year.
7. 79% of vendors who use reviews as a tactic to educate and engage prospects work with a review site in a paid capacity. 81% of those vendors invest in partnerships with more than one review site.
8. Vendors use reviews in different ways, and some strategies are more effective than others. Sales collateral, social proof on websites, and reference generation are three use cases correlated with strong results. More than 4 out of 5 of buyers are willing to write a review or become a reference for the product they bought.
9. Product demos are highly influential in buyers’ selection decisions. The aspect of product demos that correlates most with influence is also the least-utilized by vendors: letting buyers “drive” (interact with the product) themselves during a demo. This represents an opportunity for vendors to differentiate their demo experience and have more influence over purchase decisions.
10. Buyers are spending much of their process doing anonymous research, focusing on information they can get independent of vendors, without filling out a lead form. There are new opportunities for vendors to glean buyer intent data, and retarget buyers who consume ungated content on third-party sites.
11. 3 out of 5 buyers are now millennials. They consult more resources on average than older generations. Millennials are more likely to rely on reviews compared to older buyers, and are less likely to rely on analysts, the vendor’s website, or vendor reps.
Read on to learn more about buying committees, reviews, product demos, vendor representatives, analysts, the buyer’s journey, and lead generation practices.
EXECUTIVE SUMMARY

6
BUYING COMMITTEES
Technology purchase projects are collaborative.Almost all buyers surveyed (95%) said they worked with a group of stakeholders to bring a new product into their org. Vendors recognize this, and aim to connect with multiple stakeholders at an account. 97% of vendors said they reach out to more than one buyer in a typical deal.
Still, vendors aren’t reaching all of the buyers involved in the decision. Nearly half of buyers who were involved (49%) said they did not engage directly with the vendor’s representatives themselves. While vendors reach out to a lot of people at each prospective account, not all of them answer the phone or even open vendor emails. It may not be the right time—or they may not be the right people, who are actually influencing the purchase.
1
6%
2-3 4-5 6-7 8-10 11-15 16-20 More than 20
Not sure
Number of individuals involved in buying committee
40%
30%
20%
10%
0%
50%
36%
25%
11%8% 7%
3%5%
1%
1
3%
2-3 4-5 6-7 8-10 11-15 16-20 More than 20
Not sure
Number of buyers vendors engage per account
40%
30%
20%
10%
0%
50%
24%
29%
14%
9%
1% 2%4%
10%

7
There are more millennials making purchase decisions than vendors may realize.3 out of 5 buyers are now millennials (aged 23-38). This is consistent with last year’s findings. Millennials are here to stay on buying committees. They’re key stakeholders for technology purchase decisions, and their influence and decision-making power will only grow.
Millennial buyers behave differently than older buyers in some ways. They have different preferences and expectations. For example:
• Millennials consult more resources than older buyers.
• Millennials use reviews, product demos, and free trials more than older buyers.
• Millennial buyers use vendor/product websites, vendor reps, and analyst rankings & reports less than older buyers.
Nearly half of buyers on the committee for a software or hardware purchase decision never spoke to a sales rep.
Engaged directly with one of the vendor’s representatives
Did not engage with vendor’s representatives
59% of professionals who help purchase business software
and hardware are millennials.
59%
49% 51%
Millennial buyers drive the trend towards consulting diverse sources of information about business software and hardware products.
Millennial Buyers
Gen X Buyers
Baby Boomers
4.0 4.5 5.0 5.5 6.0
4.75
4.99
5.13
Average number of resources used

8
Advice for vendors59% of technology buyers are millennials. They’re more likely to conduct in-depth research and make decisions without your help, using resources like reviews and free trials at rates 20% and 53% higher than older buyers. Millennials are critical to the purchase process—are you meeting their needs?
Millennials are in full force in the marketplace, but take note: Gen Z is coming. And they’re even less likely to get on the phone with you. Get ready!
Committees make decisions in different ways. The four most common buying committee dynamics are:
• Single decision maker: One person made the decision, others contributed information (26%)
• Consensus decision: Committee members contributed to the decision equally/made decisions together (24%)
• Collaborative recommendation: The committee worked together to create a recommendation, which was presented to leadership for approval (22%)
• Divide and conquer: Everyone had different roles—some were responsible for research, others for trials and evaluation, and others for making a decision (17%).
But these aren’t the only ways committees function.
• 9% of buyers (around 1 in 10) have a manager-led strategy for product selection: the person who will be using/managing the product presented a recommendation to the group for approval.
• 1% of buyers have a bracket-style decision process: each member of the buying group independently considered the options, and then sequentially eliminated products that wouldn’t work for their requirements.
Millennial buyers focus on reviews and the product itself more, and rely on vendors and analysts less.
40%
30%
20%
10%
0%
50%
60%
70%
Used User Reviews
Used Product Demos
Used Free Trial/Account
Used Vendor/Product Website
Used VendorRepresentative
Used AnalystsRankings & Reports
Millennial Buyers
Older Buyers
22%
27%
49%
45%
60%
53%
32%
49%
58%
62%
46%
55%

9
Did you know?Enterprises with 5,000 or more employees are the least likely to operate with a single decision maker dynamic. Buyers at companies with 5,000+ employees are 46% less likely to use the single decision maker model than buyers at companies with less than 5,000 employees. Larger companies like this are more likely to have a divide and conquer dynamic, establishing specialized roles within the committee for the sake of efficiency.
A manager-led strategy for product selection is most likely to be found at mid-sized companies.11% of buyers at mid-sized companies identified this as their committee dynamic. Mid-sized companies (51-1,000 employees) are 38% more likely than small businesses or enterprises to use a manager-led strategy.
On a committee of 2-3 people, the dynamic in over 2 in 3 decisions are made by consensus decision (34%) or single decision maker (34%).
On a committee of 4-5 people, the collaborative recommendation dynamic jumps to the top (28%).A single decision-maker (24%) or consensus decision (23%) dynamic is also fairly likely.
Consensus decisions and manager-led strategies correlate with higher satisfaction with the purchase. Committees that made consensus decisions or used a manager-led strategy reported being more satisfied with the products they bought, on average, than committees that had a single decision-maker, collaborative recommendation, divide and conquer, or bracket-style dynamic. Consensus decisions had the highest average satisfaction rating with the product they bought (8.61 out of 10). Manager-led purchases were close behind, with an average satisfaction rating of 8.48 out of 10. Note: Averages between 8 and 9 are extremely common for likelihood to recommend ratings—most distributions fall in this range, regardless of category—so these differences are significant.
Single DecisionMaker
Consensus Decisions
Collaborative Recommendation
Divide and Conquer
Manager-Led Bracket-Style
How power is distributed in buying committees
1%
9%17%
22%24%
26%
0%
10%
20%
30%
40%

10
The worst decisions were made by a single decision-maker, collaborative recommendation, or divide and conquer strategy. These were the only three committee types that had strong detractors, buyers who felt they’d made a huge mistake with the product they bought.
Divide & Conquer
Bracket-Style
Collaborative Recommendation
Single Decision-
Maker
Manager-Led
Consensus Decision
Buyers with a consensus decision or manager-led committee dynamic felt more satisfied with the products they purchased.
1 2 3 4 5 6 7 8 9 10
Com
mit
tee
Dyn
amic
Average Product Satisfaction Rating
8.09
8.14
8.16
8.18
8.48
8.61
1
1
1
2
3
4
5
6
7
8
9
10
Divide & Conquer
Manager-Led
Bracket-Style
Collaborative Recommendation
Single Decision-
Maker
Consensus Decision 9%1 2 32% 34% 22%
17%25%34%14%
17%4%2 35% 27% 12%
17%28%33%10%7%
2 4% 8%
7% 14% 43% 21% 14%
37% 25% 23%
7%1
0% 10% 20% 30% 40% 50% 60% 70% 80% 90% 100%
1
11
11 11 2
1
Now that your organization is using the product, how satisfied are you with the product, on a scale of 1 to 10?

11
Tip for buyersConsider all of these committee dynamics, and think carefully about which one might work best for your organization’s next purchase. Even if you’re not in charge of the project, you can adjust your own workstyle to give it the best chance at success. For example, keep track of your criteria, sources, and notes on products in a format that’s easy to share. Many buyers tell us they like GSuite—Sheets, Docs, and Slides—to collaborate with their committees.
Buyers aren’t as divided in their roles as vendors think.
The majority of vendors think their buyers make decisions with a divide and conquer strategy (34%), or by collaborative recommendation (25%).Vendors are about right on the collaborative recommendation front (22% of buyers said that’s how their committee functioned). But vendors are way overestimating the use of a divide and conquer strategy. Only 17% of buyers said that everyone on their committee had a different role—some were responsible for research, others for trials and evaluation, and others for making a decision. That dynamic is only half as important as vendors think—it’s certainly not the most common way buying decisions now happen.
Vendors don’t realize how often their buyers make decisions by consensus. Only 8% of vendors think their buyers have a consensus decision dynamic—which is way off base! In reality, 24% of buyers said committee members contributed to the decision equally/made decisions together. That’s 200% more consensus buying going on than vendors realize.
Single Decision-Maker
ConsensusDecision
CollaborativeRecommendation
Divide andConquer
Manager-Led Bracket-Style
Committee Dynamics
Buyers
Vendors
Vendor perceptions of buying committee dynamics
26%
18%
24%
8%
22%25%
17%
34%
9%12%
1% 2%
0%
10%
20%
30%
40%
Buyers are 3x as likely to use consensus decision as vendors think.
Vendors Who Think Their Buyers Have a Consensus Decison Dynamic
Buyers Whose Committees Used
a Consensus Decision Dynamic
8%
24%
0% 5% 10% 15% 20% 25%

When buyers collaborate, they take on more tasks as a team.Each buyer plays an average of 3 roles in the process. 2 out of 3 buyers are involved in initial identification of solutions and research. Over half of committee members are also responsible for trialing products and engaging with vendors. But the buyer leading the project is not always the final funding approver, and is typically not in Procurement. 35% of respondents led a purchase for their organization, while only 19% of respondents handled procurement and only 16% approved funding.
Advice for vendors
What can vendors learn from the realities of the business technology buying committee? First, know that you’re selling to more than one person. 9 out of 10 software purchases are made in committees. And 75% of those committees contain 2 to 7 people.
These groups of buyers make decisions more collaboratively than vendors expect. Nearly half (46%) of buying groups employ the consensus decision or collaborative recommendation framework, while only 17% use a divide and conquer strategy. And within these collaborative groups, we see each buyer playing 3 roles in the buying process, on average.
Ultimately, vendors today seem to be disconnected with who is involved in the buying process. It comes down to this: 49% of buyers will never talk to a vendor representative. That’s scary!
Whether it’s the result of a vendor’s sales team not reaching out to enough people or the right people, the fact is that half of the people involved in making a decision will not make direct contact with you. So think about how those important stakeholders are making decisions with what’s available. To start, ask yourself:
• What information are they finding about you on their own? • What resources are available that they will use to learn about your product and guide their decision-making process? • How can you, your company, or your product, be aware of and/or involved with this process?
In the following section of this report, we’ll dive into the resources buyers use to make business technology purchase decisions. Pay attention to the options buyers use most to inform your strategy going forward. (In particular, focus on ungated resources, since data in The Buyer’s Journey section reveals modern buyers aren’t motivated by gated content.)
Buyer role in purchasing the product for their company
Identified or Researched
Options
Trialed or Evaluated Options
Engaged Directly with one of the Vendor Reps
LeadBuyer
SolutionsConsultant
Procurement FundingApprover
Other
67%
59%
51%
35%
20% 19%16%
3%
0%
10%
20%
30%
40%
50%
60%
70%
12

13
Product demos, vendor/product websites, and reviews are the top resources used by buyers.Buyers consult 5.1 different resources, on average. Buyers seek diverse sources of information because they’re trying to compile a complete picture of how the product will work for them, and get the whole truth.
But buyers don’t have time for information overload. They have to be judicious about which sources of information they use and how they fit together. Not all sources of information are created equal. Some contain crucial product specs and pricing, but are biased or fluffy about product value. Some provide a first-hand view of products, but are missing context and relevant advice. Others are helpful for getting a background on the market, but aren’t specific enough to base a decision on. That’s why, in addition to resource usage, we also measure trustworthiness and influence over the decision.
INFORMATION SOURCES USED TO MAKE BUYING DECISIONS
Product Demos
Vendor/Product Website
User Reviews
VendorRep.
Free Trial/
Account
Your Own Prior
Experience
Referral 3rd-PartyPubs.
Forums VendorMktg
Analyst Reports
Vendor-Produced
Case Studies
Vendor-ProvidedCustomerReferences
SolutionConsultant
VendorBlog
Other
Which of the following information sources did you use during your selection process for the product?
0%
10%
20%
30%
40%
50%
60%
70%
61%
56%52%
47%
42%
34%32%
29% 29%25% 24% 23% 22%
17%
10%
3%

14
Trustworthiness of information sources according to buyers
Your Own Prior Experience with the Product
Free Trial/Account
Referral
Product Demos
Communities/ForumsAnalyst
Rankings & Reports
UserReviews
Third-Party Pubs. &Independent Media
Solution Consultant/Agency Recco.
Vendor-Provided Customer References
Vendor-Rep
Vendor/ProductWebsite
Vendor-ProducedCase Studies
Vendor Marketing Collateral
Vendor Blog
3.88
3.68
3.62
3.34
3.3
3.24
3.21
3.16
3.06
2.99
2.81
2.8
2.76
2.75
2.75
1 2 3 4
On
a sc
ale
of 1-
4, h
ow tr
ustw
orth
y w
as e
ach
of th
e in
form
atio
n so
urce
s yo
u us
ed?
Average Trustworthiness Score
Influence of Information Sources on Buyer Decisions
Your Own Personal Experience
with the ProductFree Trial/
Account
Referral
Product Demos
UserReviews
Solution Consultant/Agency Recco.
Analyst Rankings & Reports
Communities/Forums
Third-Party Pubs. &Independent Media
Vendor-Provided Customer References
Vendor-Rep
Vendor-Produced Case Studies
Vendor/ProductWebsite
Vendor Marketing Collateral
Vendor Blog
3.83
3.6
3.47
3.39
3.08
3.08
3.03
2.98
2.97
2.85
2.79
2.67
2.54
2.54
2.42
1 2 3 4
On
a sc
ale
of 1-
4, h
ow in
fluen
tial
was
eac
h re
sour
ce y
ou u
sed
in m
akin
g yo
ur d
ecis
ion?
Average Influence Score
15
Websites, demos, and marketing collateral are the top tactics used by vendors.Vendors recognize that their buyers are hungry for different types and formats of information. On average, vendors use 9.1 different tactics to educate and engage buyers. Not all of those tactics are meaningful for every buyer. But vendors are working with finite resources. So they have to balance the time, energy, and money they pour into different tactics, to get the best mix of results. That’s why, in addition to tactic usage, we also measure effectiveness and difficulty for vendors.
Company/Product Website
ProductDemos
Mktg.Collateral
Case Studies
CustomerReferences
Blog VendorRep.
UserReviews
Partner/AgencyNetwork
FreeTrial/Acct.
3rd-PartyPubs.
AnalystReports
CustomerReferral
Forums Re-EngageFormerUsers
Other
Which of the following tactics do you use to educate and engage prospects?
0%
10%
20%
30%
40%
50%
60%
70%
80%
90% 86%84%
80% 80%
71% 70%
63%58%
52% 51% 51%48%
42%
37%
34%
2%

16
Effectiveness of vendor tactics at moving buyers towards a decision
ProductDemos
CustomerReferences
Vendor-Representative
Free Trial/Account
UserReviews
Company/Product Website
Analyst Rankings & Reports
Partner/Agency Network
CaseStudies
Customer ReferralProgram
Re-EngageFormer Users
Marketing Collateral
Communities/Forums
Third-Party Pubs &Independent Media
Blog
3.69
3.51
3.49
3.39
3.12
3.07
3.07
2.99
2.97
2.93
2.77
2.74
2.68
2.58
2.41
1 2 3 4
On
a sc
ale
of 1-
4, h
ow in
fluen
tial
was
eac
h re
sour
ce y
ou u
sed
in m
akin
g yo
ur d
ecis
ion?
Average Influence Score
Difficulty of tactics for vendors
Free Trial/Account
Blog
Company/Product Website
Communities/Forums
Product Demos
Vendor-Representative
Re-Engage Former Users
Marketing Collateral
Third-Party Publications
UserReviews
Customer Referral
ProgramPartner/
Agency Network
Analyst Rankings & Reports
CaseStudies
CustomerReferences
1.9
1.94
2.16
2.16
2.22
2.27
2.32
2.36
2.38
2.41
2.53
2.59
2.6
2.64
2.65
1 2 3 4
On
a sc
ale
of 1-
4, h
ow c
halle
ngin
g/di
ffic
ult i
s ea
ch o
ne to
cre
ate
or m
anag
e?
Average Difficulty Score

17
Spotlight on Key ResourcesWe chose to dig deeper in these areas because we hear about them a lot from buyers and vendors alike. So we’ve been tracking changes in the roles they play in technology buying and selling processes. This year, we investigated more of the how, why, and what next for analysts, product demos, vendor reps, and reviews than ever before. Use this data to make sure your perceptions line up with reality, and benchmark what you’re doing with these resources against the rest of the industry.
Jump to learn about user reviewsTrack trends in vendor adoption of a review strategy, the role of reviews in the buyer’s journey, the declining importance of star ratings for buyers, what they focus on instead, and which elements lead buyers to trust particular reviews and review sites.
Jump to learn about product demos (and the vendor representatives who lead them)Understand why product demos are a key moment of influence for vendors, the demo experience buyers expect, and how innovative vendors are updating demos to make sure they resonate with buyers.
Jump to learn about analyst rankings & reportsSee differences between buyer and vendor perceptions of analyst influence, find out where analyst research really impacts buyers and where it falls short, and get a view into how other companies are investing in analysts relative to other tactics.

18
52% of buyers used reviews.Reviews continue to be used by more than half of professionals involved in technology buying decisions. That’s slightly lower than the review usage last year, which was 56% of buyers. Note, however, that other important resources like product demos and free trials also fell in usage YoY, as buyers used slightly fewer resources on average.
Did you know?Buyers of HR (67%), Finance and Accounting (62%), and Marketing (60%) technology used reviews the most.
Buyers of Vertical Industry software used reviews the least (29%)—perhaps because reviews of these niche products are harder to find, there are fewer competitors to compare, and/or review sites have not been covering these categories for as long.
At small businesses (1-50 employees), reviews are used more than product demos! (59% of buyers used reviews vs. 53% of buyers used demos.) Reviews are tied with the vendor/product website as the #1 most-used resource for buyers at small businesses.
55% of CEOs and 56% of senior managers surveyed used reviews as part of their buying process. Company leaders are more likely to use reviews than average.
For very large, high-impact purchases, when larger committees of 11 or more—up to 20+ people—are assembled, reviews get more widely used. 60% of buyers on large committees used reviews.
Reviews are the main way buyers get product information that’s not from vendors.Reviews are the #1 way buyers can get unbiased information before they talk to vendors—or after, to check up on vendor claims.
REVIEWS
52% of buyers use reviews in their purchase process.
52%
DEMOSREVIEWS
WEBSITE
FREE TRIAL
VENDORREP

19
Reviews are the top resource buyers consult that’s not controlled/provided by the vendor. Reviews appear to be growing slightly more trustworthy and influential with buyers that use them. That’s why more vendors than ever are adopting review strategies to influence their buyers.
Vendors are now more likely to use reviews with prospects than not. 58% of vendors use user reviews as a tactic to educate and engage prospects. This is an increase from last year, when 43% of vendors used reviews as a tactic to educate and engage prospects. Last year, we reached the tipping point for buyer use of reviews. This year, we’ve reached the tipping point for vendor use of reviews.
1
2
3
4
Buyer Trust Buyer Influence
2019
20202.98
3.21
2.993.08
The trustworthiness and influence of reviews with buyers increased slightly year over year.
60%
40%
20%
0%2019 2020
Perc
ent o
f ven
dors
usi
ng re
view
s
35% more vendors are using reviews this year compared to last year.
43%
58%

20
Advice for vendors Remember how 49% of buyers will never talk to a vendor? Reviews are the #1 independent resource these buyers use instead. How can you get involved with reviews, and connect with more buyers?
Here are some quick tips to kick off your review program.
• Launch your review program internally. You’ll need an executive sponsor as well as a day-to-day stakeholder to manage the project. Day-to-day managers often fall under customer marketing, product marketing, or demand generation. But it can be done by anyone invested in the success of the business.
• Establish your presence on review sites. Aim for a minimum viable presence on relevant B2B review sites.
• Is your product listed?
• Have you claimed your profile?
• Is all the information up to date?
• Does your product have at least 10 reviews written within the last year?
A reputable site will have authenticated and moderated reviews that are not pay to play.
• Invite your customers to review you. Prepare a list of a broad set of customers, not just known advocates, and ask them to review your product. The best time to ask is when your product is top of mind. This could include shortly after implementation (90 days is a sweet spot), at a customer event, or after a quarterly or annual business review.
• Create an email campaign. Email is often the most efficient way to get reviews. You should provide a link to write a review on a 3rd party site, along with specific instructions to make it easy for your customers. Do convey that you are seeking honest feedback. From there, don’t forget to send reminders—multi-step campaigns can help drive more reviews than a single email!
• Partner with a 3rd party review source. Experts can help you run and optimize review acquisition campaigns, assist with review content curation, and implement review content to take marketing campaigns to the next level.
Want more? Get the Definitive Guide to B2B Reviews for a full walkthrough of everything you need to know to launch and maintain a review program.

21
Buyers seek reviews throughout the journey—during Discovery, Evaluation, and Selection.Remember, 52% of buyers used reviews during their purchase process. But we wanted to find out when specifically they consulted reviews.
• 74% of buyers who used reviews did so during the Discovery phase, when they were learning about the space and possible options
• 68% of buyers who used reviews did so during the Evaluation phase, when they were comparing a shortlist of products
• 27% of buyers who used reviews did so during the Selection phase, when they were getting buy-in for their choice internally and negotiating with the vendor
Buyers are most likely to find reviews via search engine, or by checking multiple review sites they know about.By far the most common way buyers found user reviews was through Google (81%). But, around half of buyers also went directly to multiple review sites they know about (49%), and nearly a third of buyers went directly to one review site they know about (31%). 29% of buyers said they found reviews on the vendor’s website or in the vendor’s marketing collateral. 14% of buyers said the vendor sent them reviews. 12% of buyers said their colleague sent them reviews.
60%
40%
80%
20%
0%
Discovery74%
Evaluation68%
Selection27%
Use of reviews during the buyer’s journey

22
When buyers evaluate products on review sites, they care far more about the content (qualitative feedback) than they do about the score.The most important factor when evaluating a business technology product on a review site is the review content (qualitative feedback). 39% of buyers said this was the key for their evaluations.
The second most important factor, according to buyers, was the profile of the reviewer being relatable to them (company size, industry, role, etc.). 29% of buyers said this was the key for their evaluation of products on review sites.
Only 16% of buyers said the product’s overall score was the most important factor. Less than 1 in 5 buyers focus on score when evaluating a product on a review site. This is something buyers are starting to care less about over time. In 2017, around 1 in 4 buyers said the product’s overall score was the most important factor when evaluating a product on TrustRadius. Now, the amount of buyers who are focused on product scores is even lower.
9% of buyers said the most important factor is the recency of reviews, and 8% of buyers said the most important factor is the number of reviews. These buyers are likely trying to get a proxy for relevance—to understand how widely adopted a product is, how popular, trendy, current, etc.
Google I went to multiple review sites I know about
I went to a review site I know about
They were on the vendor’s site/
marketing collateral
The vendor sent them to me
My colleague sent them to me
0%
10%
20%
30%
40%
50%
60%
70%
80%
90%
100%
How did you find user reviews?
81%
49%
31%29%
14%12%
40%
30%
20%
10%
0%
50%
Review Content (Qualitative)
Reviewers Relatable to Me
Product’s Overall Score
Recency of Reviews
Number of Reviews
Which is the most important factor when evaluating a business technology product on review site?
39%
29%
16%
9% 8%

23
Vendors don’t quite know what their buyers care about on review sites.Vendors aren’t sure what the most important factor is for buyers evaluating their product on review sites. They’re divided, and most are out of touch with what buyers actually find to be most important.
28% of vendors think the product’s overall score is the thing buyer’s care about most; 28% of vendors think reviewers relatable to them (company size, industry, role, etc.) is what buyers notice most; 23% of vendors think review content (qualitative feedback) is most important to buyers. Those were the three most common answers.
Then 7% of vendors think review recency is the most important factor, and 5% think number of reviews is most important. Only 9% of vendors say their buyers don’t use reviews.
Advice for vendorsAccording to your buyers, your product is more than its score. What’s really important about a review are the details that can be learned about your product from real people who use it every day. Rather than a surface-level skim, reviews are being examined in-depth, meaning that buyers trust them as a real indicator of value for a buying decision.
This means that your business should prioritize collecting real experiences from representative personas over rosy reviews with an impeccable score. Again, over half of buyers are using reviews. And 77% of buyers said it was critical to understand the cons.
2017 20200%
20%
40%
30% fewer buyers place emphasis on product scores now than in 2017.
22%
16%
Buye
rs w
ho th
ink
scor
e is
th
e m
ost i
mpo
rtan
t fac
tor
Review Content (Qualitative)
Reviewers Relatable to Me
Product’s Overall Score
Recency of Reviews
Number of Reviews
N/A - My buyers don’t use reviews
Buyers
Vendors
40%
30%
20%
10%
0%
Perceptions of most important factor when evaluating products on review sites39%
23%
29% 28% 28%
16%
9% 8%5%
0%
9%7%
24
With that in mind, here’s what you should do to give buyers the right information in reviews:
• Encourage your customers to share their honest feedback within a review. Don’t ask for five stars, ask for their full and complete thoughts!
• Focus on high-quality review sites. Because buyers care about the content within a review, they use sites with highly-vetted, in-depth reviews, written by real users.
• Ensure that your reviews are representative of your customer base. Can each of your core prospect personas find reviews from roles, use cases, or businesses like theirs? If not, focus on filling the gaps by asking customers from your most critical personas to review you.
• When soliciting reviews, look beyond advocates. While your biggest champions will write shining reviews, a potential buyer is looking for the positives and negatives before trusting a review. Sticking to just your biggest champions probably won’t get you enough reviews, either. Expand beyond your best customers to help drive real buying experiences.
• Do not incentivize positive reviews only. Not only is this not allowed by the most trusted review sites, but it’s not what buyers want—and will show your customers that you’re not really listening to them.
• Remember: score isn’t everything! It’s more about the depth of information in the review and having a relatable reviewer than the number at the top. What’s most important is giving buyers what they want, not review sites.
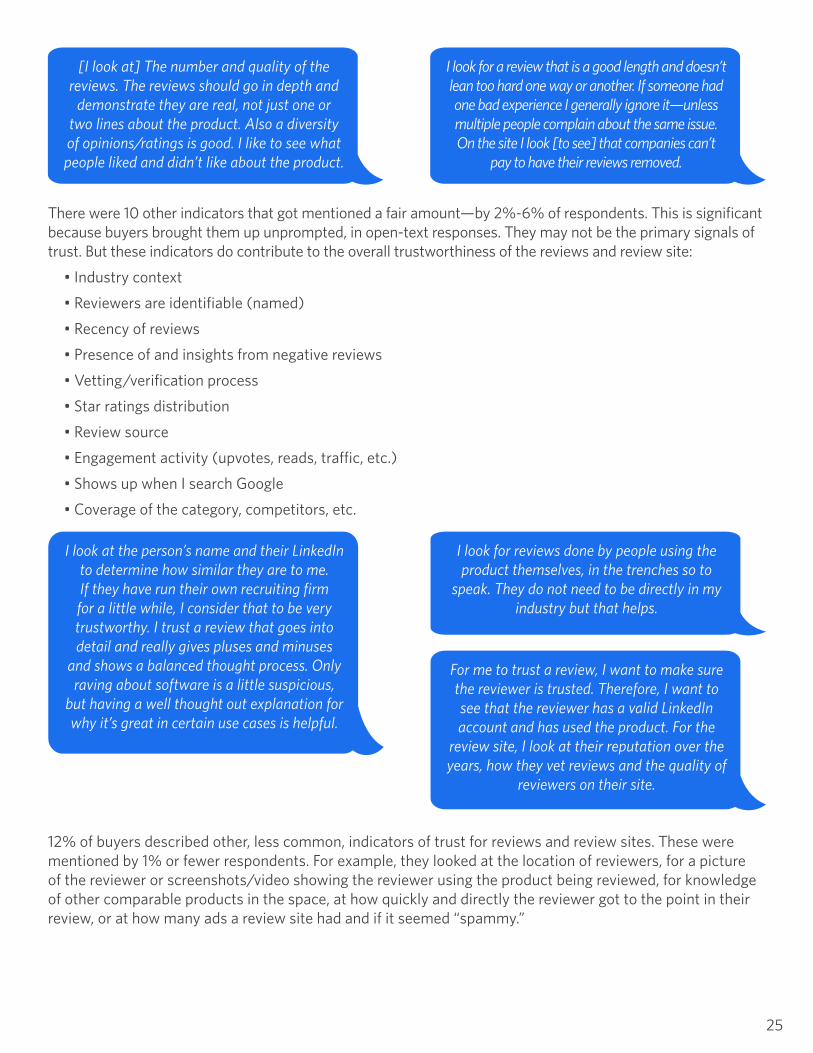
How do buyers know which reviews and review sites they can trust?Balanced feedback, experienced reviewers, review site reputation, detailed examples, and quality of writing matter. Number of reviews, relevance, trends, length, and independent viewpoints are also important.
There are a lot of different ways buyers gauge trust in reviews and review sites. When we asked how they evaluate whether they can trust a review (or a review site), buyers mentioned about 2 indicators they look for on average (1.98 to be precise). However, there is a broad range of indicators buyers use.
Buyers rely on different aspects of reviews and review sites to earn trust. Many of these indicators work together to help buyers feel they can (or can’t!) trust a review or a review site.
Here are the top 10 indicators for buyers of whether they can trust a review or a review site:
• Balanced feedback (22%)• Reviewer experience / background (20%)• Reputation of the review site (20%)• Detail & specificity in the review (18%)• Quality of qualitative feedback (grammar, authenticity, professionalism, etc.) (18%)• Number of reviews (17%)• Relevancy (based on features and issues discussed, skillset and company of the reviewer, etc.) (8%)• Trends across reviews (8%)• Length of reviews (7%)• Appears unbiased/independent (7%)
Evenhandedness is the most important part of a review. It needs to be balanced and demonstrate that the reviewer knows a
good deal about the product and not just the company’s talking points. Usually, some non-
glamorous detail demonstrates this.
I’m looking for details about their experience using the product. Being listed somewhere other than the company’s site increases my trust of the
review as I know it’s not being cherry-picked. I also look for reviews that are 2s, 3s, or 4s (on a scale of 1-5) as they tend to be more objective.
Often, the most helpful reviews are specific use-cases that more closely match my use-case. Beyond that, more information (read:
lengthy) is helpful, as is specificity within the review, so I know it was based on an actual user experience, and not a ‘comped’ review. In terms of the site itself, more reviews with
lengthy content displays authenticity.
25
There were 10 other indicators that got mentioned a fair amount—by 2%-6% of respondents. This is significant because buyers brought them up unprompted, in open-text responses. They may not be the primary signals of trust. But these indicators do contribute to the overall trustworthiness of the reviews and review site:
• Industry context
• Reviewers are identifiable (named)
• Recency of reviews
• Presence of and insights from negative reviews
• Vetting/verification process
• Star ratings distribution
• Review source
• Engagement activity (upvotes, reads, traffic, etc.)
• Shows up when I search Google
• Coverage of the category, competitors, etc.
12% of buyers described other, less common, indicators of trust for reviews and review sites. These were mentioned by 1% or fewer respondents. For example, they looked at the location of reviewers, for a picture of the reviewer or screenshots/video showing the reviewer using the product being reviewed, for knowledge of other comparable products in the space, at how quickly and directly the reviewer got to the point in their review, or at how many ads a review site had and if it seemed “spammy.”
I look for reviews done by people using the product themselves, in the trenches so to
speak. They do not need to be directly in my industry but that helps.
I look at the person’s name and their LinkedIn to determine how similar they are to me. If they have run their own recruiting firm for a little while, I consider that to be very trustworthy. I trust a review that goes into detail and really gives pluses and minuses
and shows a balanced thought process. Only raving about software is a little suspicious,
but having a well thought out explanation for why it’s great in certain use cases is helpful.
For me to trust a review, I want to make sure the reviewer is trusted. Therefore, I want to see that the reviewer has a valid LinkedIn account and has used the product. For the
review site, I look at their reputation over the years, how they vet reviews and the quality of
reviewers on their site.
[I look at] The number and quality of the reviews. The reviews should go in depth and
demonstrate they are real, not just one or two lines about the product. Also a diversity of opinions/ratings is good. I like to see what people liked and didn’t like about the product.
I look for a review that is a good length and doesn’t lean too hard one way or another. If someone had one bad experience I generally ignore it—unless multiple people complain about the same issue. On the site I look [to see] that companies can’t
pay to have their reviews removed.

26
Tip for buyersNot all reviews, nor review sites, are created equal! They have different quality standards, and different standards for vetting reviews and verifying reviewers. The fastest way to figure out on the fly if a review, a review site, or a product’s aggregate score is trustworthy is to skim a few reviews.
If reviews are level-headed and share thoughtful pros as well as cons (regardless of overall sentiment), that’s a strong vote of confidence. If you can see the reviewer’s background—for example, their company size, function, industry, past reviews, etc.—and some of the other products they have experience with, that’s another strong vote of confidence. If you want to dig deeper, investigate the reputation of the review site. What are their policies? What values do they promote? How do they make money? (You can learn all of that about TrustRadius here.)
Reviews solve a lot of problems for buyers!The average buyer is solving around 3 different problems with reviews (2.98 to be precise). The top three problems buyers are using reviews to solve are all in the Discovery phase—which is also the most common point in the journey where buyers use reviews. Here are the top 3 problems reviews solve for buyers:
• I want to hear hear directly from people whose motivations I trust, who have relevant experience.
• I need to identify products that will work in my specific environment.
• If I don’t have any experience in the space, it’s hard to know what I don’t know.
Vendors recognize reviews are solving problems for buyers, but have a few misperceptions.On average, vendors identified 3 problems they think reviews solve for their buyers, which matches the response from buyers.
Vendors and buyers see eye to eye about some of the problems reviews solve. But vendors underestimate how much reviews help buyers identify products that will work in their specific environment. 40% of vendors said they think reviews help buyers identify products that will work in their specific environment, but 51% of buyers said reviews solve this problem. (28% more buyers said reviews solve this problem than vendors thought.
Here are the problems reviews solve for buyers during the purchase process:
I want to hear directly from people whose motivations I trust, who
have relevant experienceI need to identify products that will
work in my specific enviromentIf I don’t have any experience
in the space, it’s hard to know what I don’t know
I need to back up my recommendation and show
that I’ve done my homeworkI don’t trust products are actually
going to work as advertised
There’s no place I can discover all available options and possible features
It’s hard to tell how products are really different
I need to show clear ROI to get the purchase approved
I need more information, and the vendor’s not getting back to me
Internal politics and approval processes are slowing things down
60%
51%
44%
30%
29%
26%
26%
16%
10%
10%
0% 25% 50% 75%
27
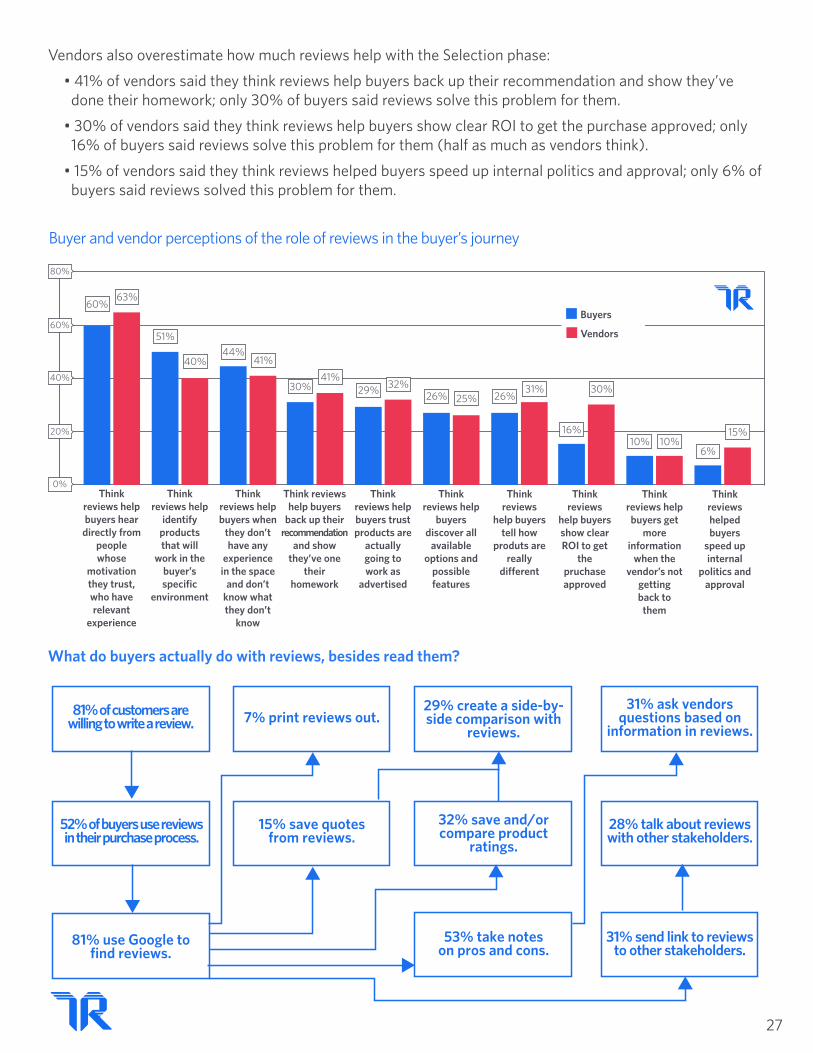
Vendors also overestimate how much reviews help with the Selection phase:
• 41% of vendors said they think reviews help buyers back up their recommendation and show they’ve done their homework; only 30% of buyers said reviews solve this problem for them.
• 30% of vendors said they think reviews help buyers show clear ROI to get the purchase approved; only 16% of buyers said reviews solve this problem for them (half as much as vendors think).
• 15% of vendors said they think reviews helped buyers speed up internal politics and approval; only 6% of buyers said reviews solved this problem for them.
What do buyers actually do with reviews, besides read them?
Buyers
Vendors
80%
60%
40%
20%
0%
Buyer and vendor perceptions of the role of reviews in the buyer’s journey
Think reviews help buyers hear
directly from people whose
motivation they trust, who have relevant
experience
60%63%
Think reviews help
identify products that will
work in the buyer’s specific
environment
51%
40%
Think reviews help buyers when
they don’t have any
experience in the space
and don’t know what they don’t
know
44%41%
Think reviews help buyers
back up their recommendation
and show they’ve one
their homework
30%41%
Think reviews help buyers trust products are
actually going to work as
advertised
29% 32%
Think reviews help
buyers discover all
available options and
possible features
26% 25%
Think reviews
help buyers tell how
produts are really
different
26%31%
Think reviews
help buyers show clear ROI to get
the pruchase approved
16%
30%
Think reviews help buyers get
more information
when the vendor’s not
gettingback to
them
10% 10%
Think reviews helped buyers
speed up internal
politics and approval
6%
15%
7% print reviews out.
15% save quotes from reviews.
81% of customers are willing to write a review.
52% of buyers use reviews in their purchase process.
81% use Google to find reviews.
32% save and/or compare product
ratings.
31% ask vendors questions based on
information in reviews.
28% talk about reviews with other stakeholders.
31% send link to reviews to other stakeholders.
29% create a side-by-side comparison with
reviews.
53% take notes on pros and cons.

28
• 92% of buyers who used reviews said they read them themselves
• Over half (53%) of buyers who used reviews said they take notes on the pros and cons in reviews
• Less than a third (32%) save and/or compare overall product ratings
• 31% of buyers who use reviews send links to reviews to other stakeholders
• 31% also ask vendors questions based on information in reviews
• 29% of buyers who use reviews create a side by side comparison with them
• 28% talk about the reviews with other stakeholders. Whether they’re shared directly or not—which they are a fair amount of the time—they’re starting conversations among the buying committee
• 15% save quotes from reviews that speak to specific topics (like ROI, support, a concern they had, etc.)
• 7% of buyers even print reviews out (To read or share physically, or include in a packet for executive review)
Reviews are most influential in the decision for buyers who save/curate them in some way.This isn’t necessarily a causal relationship—it could be that buyers save reviews when they perceive them to be influential. Here were the top 5 most influential things buyers did with reviews:
• 49% of buyers who printed reviews out rated them “More influential” (4 out of 4 on the influence scale)
• 43% of buyers who saved quotes from reviews that spoke to specific topics (like ROI, support, a concern we had, etc.) rated them “More influential” (4 out of 4 on the influence scale)
• 40% of buyers who used reviews to create a side by side comparison rated them “More influential” (4 out of 4 on the influence scale)
• 39% of buyers who saved/compared overall product ratings rated them “More influential” (4 out of 4 on the influence scale)
• 34% of buyers who took notes on pros and cons in reviews rated them “More influential” (4 out of 4 on the influence scale)
People are more willing than ever to write reviews of business technology products.This year, 81% of buyers said they would be willing to advocate for the product they bought to others (write a review, serve as a reference, etc.) now that they’re customers. That’s an 11% increase from last year.
75%
50%
100%
25%
0%2019 2020
Buyers are becoming more willing to advocate for the products they bought to others (write a review, serve as a reference, etc.).
73%
81%

29
More than 4 out of 5 buyers who used reviews in their own purchase process are willing to become advocates.Buyers who used reviews are slightly more likely to be willing to advocate for the product they bought now that they’re customers than those who didn’t use reviews in their own purchase process—probably because they remember how helpful they are, and want to pass it on!
What do vendors’ review strategies look like in 2020?Most vendors are focused on generating leads, references, or social proof through their review programs.
The three most common ways vendors are using reviews and/or third-party review sites today are:
• Lead generation (51%)
• Customer references (51%)
• Social proof on their website/landing pages (50%)
These three things are measurable, attributable, fit into existing processes, goals, etc. for vendors. But do note: these don’t necessarily match what buyers are looking for.
75%
50%
100%
25%
0%Used reviews Did not use reviews
Buyers who used reviews are even more willing to help other buyers by writing reviews.
84%77%

30
Pro tip: Vendors using reviews to generate references find that references are more effective, and easier to manage.
Pro tip: Vendors using reviews for social proof on their website/landing pages find their websites are more effective.
More than 2 in 5 vendors are using reviews and third-party review sites passively (expecting buyers will find reviews on their own), for external validation. This is along the lines of “reviews are the new analysts” or “Yelp-style” reviews mindset:
• 41% of vendors who use reviews as a tactic said they’re using them for reputation management
• 43% of vendors who use reviews as a tactic said they’re using them for third-party validation
75%
50%
25%
0%Used reviews and/or third-party
review sites for referencesDidn’t use reviews and/or third-party
review sites for references
Of the 58% of vendors who use reviews to educate and engage prospects, here's how the effectiveness of their references compares:
57%
42%
Perc
ent o
f ven
dors
who
foun
d re
fere
nces
ver
y ef
fect
ive
45%
30%
15%
0%Used reviews and/or third-party review sites for social proof on
website/landing pagesDidn’t use reviews and/or third-party
review sites for social proof on website/landing pages
Of the 58% of vendors who use reviews to educate and engage prospects, here's how the effectiveness of their websites compares:
40%
34%
Perc
ent o
f ven
dors
who
foun
d w
ebsi
te v
ery
effe
ctiv
e

31
But over a third of vendors are now using reviews and working with third-party review sites more strategically.These vendors are using reviews to save time and level-up their marketing and sales outreach, competitive positioning, and feedback for the product team:
• 41% of vendors who use reviews as a tactic said they’re using them to create marketing collateral/campaigns
• 40% said they’re using reviews and third-party review sites to get competitive intelligence
• 38% said reviews and third-party review sites are being used to power content marketing
• 36% said reviews and third-party review sites are being used for sales enablement
• 35% said reviews and third-party review sites are providing product insights
• 34% said reviews and third-party review sites are being used to produce sales collateral (case studies, battle cards, etc.)
Pro tip: Vendors using reviews for sales collateral find reps are more effective.
A smaller slice of vendors are doing other cool, high-impact, more cutting edge things with reviews and review sites.
• 20% are generating buyer intent data
• 17% are measuring Net Promoter Score (NPS)
• 14% are running retargeting ads
• 12% are working on conversion optimization
Advice for vendors Buyers are focused on the content of a review, and many vendor goals for review programs align with what buyers want. Using reviews on websites, as part of marketing collateral and campaigns, content marketing, and sales enablement incorporates what buyers find valuable right into your messaging. Vendors are also capitalizing on conversion-focused elements, as well as positioning and competitive learnings that can be gleaned from reviews. All of these are viable goals, but tying to what buyers want has the greatest potential for success.
60%
40%
20%
0%Used reviews and/or third-party review sites for sales collateral
Didn’t use reviews and/or third-party review sites for sales collateral
Of the 58% of vendors who use reviews to educate and engage prospects, here's how the effectiveness of their reps compares:
49%
36%
Perc
ent o
f ven
dors
who
foun
d sa
les
reps
ver
y ef
fect
ive

32
Reviews correlate positively with the success of many marketing activities. To reiterate:
• Vendors using reviews to generate references are 36% more likely to find their references more effective and easy to manage
• Vendors using reviews for social proof on their website/landing pages are 18% more likely to find their websites effective
• Vendors using reviews for sales collateral are 35% more likely to find their reps effective
Don’t forget: the engine that makes all this work is content quality. The content within a review is the #1 thing buyers value when reading reviews, after all! Feed your marketing with powerful review content from quality-focused 3rd-party sites to drive success.
Do pay attention to the emerging trends in review use cases. Buyer intent data, for example, has huge potential for value. Because those looking at reviews are likely involved in a buying cycle, reviews are a great indicator of buying intent. Information about who is looking at reviews is extremely actionable for marketing and sales teams. In addition, insight into what products are compared and what use cases are examined can also be extremely valuable. 20% of vendors are already diving into buyer intent data. Don’t get left behind!
Most vendors using reviews have a paid strategy, and invest in multiple review sites.
Nearly 4 in 5 vendors spend money with third-party review sites to power their review program.
79% of vendors who use reviews as a tactic to educate and engage prospects work with a review site in a paid capacity. (For example, the review site may help them send review invitations, license the review content, report on activity, generate leads, etc.)
26% of vendors who use reviews as a tactic are investing in a paid strategy of up to $10K per year with third-party review sites. That means over half (53%) are spending $11K or more per year on reviews. 20% are spending $11K-$25K per year. 13% are spending $26K-$50K per year on reviews.
Another 20% of vendors are spending more than $50K per year with third-party review sites. 10% are spending $51K-$100K per year. 7% are spending $101K-$500K per year. 3% are spending more than $500K per year with third-party review sites!
21% of vendors don’t spend any money with third-party review sites, choosing to run their own review programs and/or take advantage of free listings.
$0 - We’re not spending any money with
third-party review sites
$10K or less per year
$11K-$25K per year
$26K-$50K per year
$51K-$100K per year
$101K-$500K per year
0%
10%
20%
30%
40%
58% of vendors use reviews as a tactic to educate & engage prospects. 79% of those pay third-party review sites to help.
21%
26%
20%
13%10%
7%
More than $500K per year
3%

33
Did you know?Vendors that target different market segments (i.e. sizes of companies that will buy their products) invest in reviews at different rates. 65% of vendors that sell to small businesses use reviews as a tactic. 62% of vendors that sell to mid-sized companies use reviews as a tactic. 51% of vendors that sell to enterprises use reviews as a tactic. 61% of vendors whose customers and prospects are evenly split across segments use reviews as a tactic.
While all vendors that use reviews are about as equally likely to use a paid vs. free review strategy, vendors that target small businesses are much more likely to spend $10K or less per year with review sites, whereas vendors that target larger markets (or even larger markets in addition to small businesses) are likely to spend more than that with review sites.
Less than 1 in 5 of those vendors (19%) are only investing in one review site.
The other 81% of vendors who partner with third-party review sites are spending money with multiple review sites. Here’s how that breaks down:
• Most commonly, vendors work with multiple review sites but focus their investment on one more than others (42%)• 19% of vendors work with two review sites and split their investment evenly• 13% of vendors split their investment evenly across three review sites• 6% of vendors split their investment evenly across four or more review sites
Vendors who invest in multiple review sites said their reviews and their reps were more effective at moving buyers towards a decision than vendors who only invest in one review site.
In the survey, we asked vendors to rate the effectiveness of their reps, and of their reviews. Then later, we asked vendors to tell us about how they work with review sites. When we looked at patterns in the responses to these two separate questions, we saw differences between vendors who are only working with one review site, versus those who are working with multiple review sites.
• 35% of vendors who invest in multiple review sites said their reviews were very effective, versus 24% of vendors who only invest in one review site.
• 43% of vendors who invest in multiple review sites said their reps were very effective, versus 32% of vendors who only invest in one review site.
40%
30%
20%
10%
0%
50%
We’re working with multiple review sites, but we’ve
focused our investment on one more than others.
We’ve chosen two review sites to work
with, and we split our investment evenly.
We’ve chosen one review site to work
with (100% investment).
We’ve chosen three review sites to work
with, and we split our investment evenly.
We’re working with four or more review sites to work
with, and we split our investment evenly.
How is that investment distributed across review sites?
42%
19% 19%
13%
6%

34
Did you know?Only 21% of vendors who are using reviews as a tactic to educate and engage prospects are doing so in a free capacity.
These vendors said they’re not spending money with review sites because they have no budget for it (17%), it’s not a priority right now or there’s a lack of support from leadership (13%), they’re new to the game and not quite ready for a paid strategy (13%), they’re already tried some type of paid program and it didn’t work out the way they’d hoped (13%), or they don’t see the value (21%). 17% aren’t sure why their company isn’t spending money with reviews sites.
Other reasons included a perception that reviews aren’t relevant enough to their buyers (11%), not feeling comfortable with it (9%) or worrying that the review site won’t provide them with enough control (2%), or even just that they already have internal resources allocated to handle reviews in-house on their own (8%). One vendor said they’re actually planning to launch a paid strategy soon, but are still in the process of evaluating third-party review sites to see which they’d like to work with.
Vendors who don’t spend money with third-party review sites still find using reviews to be a fairly effective strategy for moving prospects towards a decision (avg. effectiveness rating of about 3 out of 4). But vendors who invest with third-party review sites see reviews become an even more effective tactic. For example, vendors who spend $51-$100K/year with third-party review sites rate their effectiveness 10% higher than vendors who use a free review program.
Vendors who invest in paid relationships with third-party review sites also have more effective reps, on average. 58% of vendors who said they invested in reviews also said their reps were very effective vs. 50% of vendors that aren’t spending money on reviews who said their reps were very effective.
Vendors are still figuring out how to think about the ROI of reviews.There are a lot of different ways vendors think about ROI of reviews and review sites. There were 15 ways of thinking about it mentioned by at least 5 separate people in an open-ended response. Considering that these were brought up organically, without prompt, that is significant!
The single most common way vendors think about ROI of reviews is in terms of leads—mentioned by 22% of vendors who invest in paid programs with third-party review sites. After leads, 11% of vendors mentioned they have a generally positive impression about the ROI of their review programs, but have no specific means of measuring it.
0%
15%
30%
45%
Very effective reviews Very effective reps
Only invest in one review siteInvest in multiple review sites
24%
35%32%
43%
Effectiveness of vendor reps and reviews at moving buyers towards a decision

35
Interestingly, some of the traditional, stereotypical views on ROI are now held by only a tiny fraction of vendors:
• 1% of vendors consider a high product score or rank to be the measure of ROI for working with review sites
• 1% of vendors consider clicks to their website from the review site to be a good measure of ROI
These ways of thinking about the value of reviews are outdated; they’re holdovers from a time when B2B review sites were mainly pay-to-play directories.
Advice for VendorsMeasuring reviews only by the number of leads does not provide a complete picture of how they work. In reality, the majority of buyers are using reviews, including those on committees who will never work directly with vendors. These buyers will use reviews to influence their decisions regardless, whether it benefits your pipeline of leads or not.
When you measure reviews, think about their influence across the whole buyer’s journey. Think about metrics like number of deals or logos influenced. Knowing which companies are looking at your reviews can provide invaluable insight into who is actually engaged in a buying cycle. Also consider search engine rankings, as that is how many buyers conduct research and compare products. In addition, look to value-additive comparative content, including side-by-side comparisons and placements on grids, as this is incredibly valuable to buyers. All of this content can supplement your marketing and sales collateral as well.
Here are the top 10 ways vendors think about the ROI of their review programsHow do you think about ROI for third-party review sites?
Leads Generally positive
impression
Attributable marketing
influence on pipeline
New business (revenue,
# of clients)
Conversions Not sure/too early
to tell
Hard to quantify
Awareness Cost efficiency
(PPC, CPA, CPI)
22%
11% 10% 9% 8% 8% 7% 7%5%
Ability to generate
social proof/customer evidence
5%
0%
10%
20%
30%
40%

36
Product demos are the most common source of information for buyers.This has been consistent year over year. Buyers find product demos to be highly trustworthy, and highly influential. 61% of buyers use product demos.
Product demos are the second most-used tactic by vendors, behind their company/product website.Product demos are by far the most effective tactic for helping vendors move buyers towards a decision, according to vendors. Demos are also among the least challenging things for vendors to manage/create. 84% of vendors use product demos as a tactic to educate and engage prospects. 86% use their vendor/product website. This is a slight change from last year, when marketing collateral just barely beat product demos as the most-used vendor tactic (79% usage of product demos vs. 81% usage of marketing collateral vs. 77% usage of company/product website). This signals a small shift towards the kinds of resources buyers actually find helpful from vendors.
PRODUCT DEMOS (AND THE VENDOR REPS WHO LEAD THEM)
75%
50%
100%
25%
0%Buyer Usage Buyer Trust (rated 3 or 4) Buyer Influence (rated 3 or 4)
Buyer usage, trust and influence for product demos
61%
88% 87%
2019 2020
Vendors are investing more in product demos, a more trusted and influential resource for buyers.
79%77%
81%80%
84%
86%
70%
90%
80%
Product Demos Company/Product Website
MarketingCollateral
37
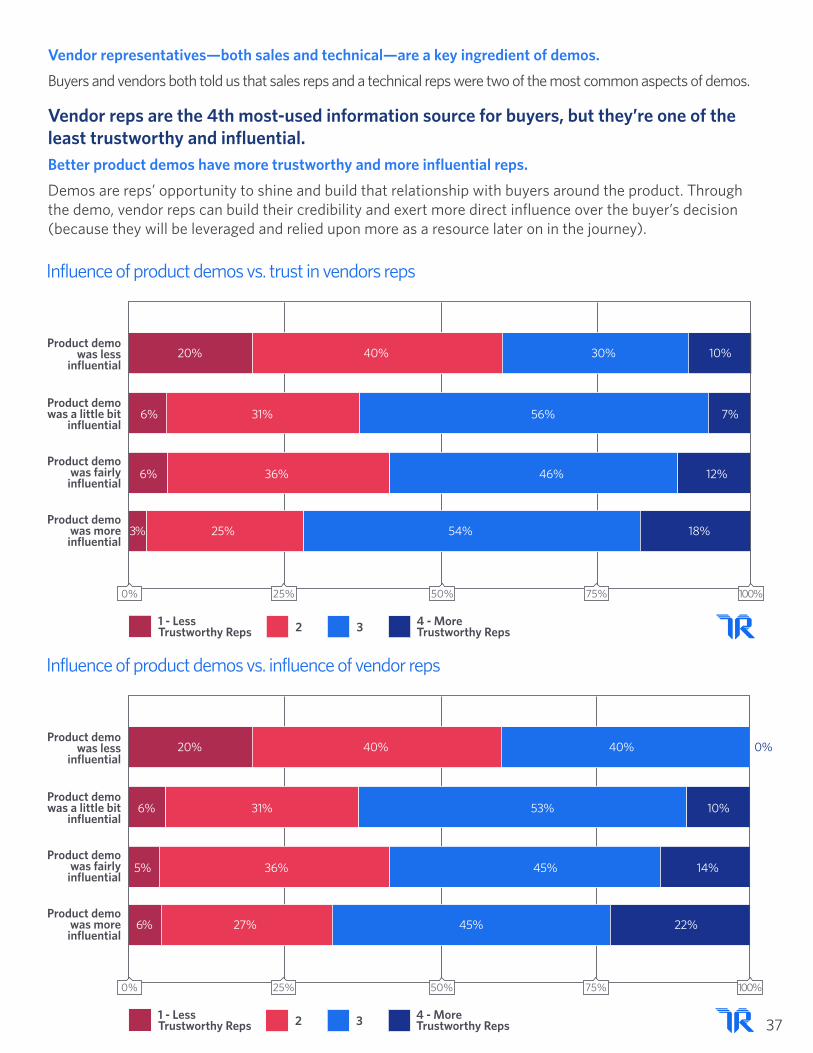
Vendor representatives—both sales and technical—are a key ingredient of demos.Buyers and vendors both told us that sales reps and a technical reps were two of the most common aspects of demos.
Vendor reps are the 4th most-used information source for buyers, but they’re one of the least trustworthy and influential. Better product demos have more trustworthy and more influential reps.Demos are reps’ opportunity to shine and build that relationship with buyers around the product. Through the demo, vendor reps can build their credibility and exert more direct influence over the buyer’s decision (because they will be leveraged and relied upon more as a resource later on in the journey).
1 - Less Trustworthy Reps
4 - More Trustworthy Reps2 3
Product demo was fairly
influential
Product demo was more influential
Product demo was a little bit
influential
Product demo was less
influential20% 40% 30% 10%
7%56%31%
36%6% 46% 12%
18%54%25%3%
6%
0% 25% 50% 75% 100%
Influence of product demos vs. trust in vendors reps
1 - Less Trustworthy Reps
4 - More Trustworthy Reps2 3
Product demo was fairly
influential
Product demo was more influential
Product demo was a little bit
influential
Product demo was less
influential20% 40% 40% 0%
10%53%31%
36%5% 45% 14%
22%45%27%6%
6%
0% 25% 50% 75% 100%
Influence of product demos vs. influence of vendor reps
38
So what makes a good demo, according to buyers?Buyers want demos to be customized/tailored to reflect their specific needs, use case, and requirements. It’s great if the vendor uses a call, a survey, email questions, or independent research before the demo to figure this out.
Buyers either want to be able to drive themselves during the demo, or to see a rep walk through tasks in real time step by step, or to be given a trial/sandbox to play around with on their own after the demo.
They also want to be given pricing information, and to get direct answers to their questions while on the call (rather than sales reps giving fluffy answers to saying they need to ask a more technical person offline and get back with an answer later).
Some buyers still appreciate on-site demos, but many now say that web conferencing technology has evolved enough that doing remote demos is much more convenient than trying to schedule in-person in-office time with a big team.
Taking time to listen to your use case and cover relevant topics instead of just running
through a script. Also letting you take control and walk through tasks.
When a rep takes time to understand our company needs on their own time, then
brings us online for a very brief overview of features and limitations, then walks through
a scenario similar to our company needs, ending with a free multi-user trial for my
team to evaluate.
Realistic views of what the program would look like with our data, what we see and
what the bills look like are very important.
A good product demo includes a live interactive model of the requirements you are looking for. It requires the candidate
purchaser to prepare the vendor with the exact needs before hand. I think a live demo
with open conversation is important. A technical representative must be on the call
to cover all requirement topics.
In this day and age, they should be able to do their demo virtually—the days when everyone
is able to get into a room together are past!
When they walk through your exact use case and freely discuss what the program can or can’t do.
One that is interactive and highlights real world usability. I don’t like canned demos
where we can’t control anything or ask to see specific functions. I also hate when features that were touted are not available in demos.

39
Where do some demos fall short?Buyers mentioned making sure the vendor reps/presenters attending the demo had sufficient knowledge and preparation to answer all of their questions, which is not always the case and is very annoying/time consuming.
Buyers mentioned they’d like to see real data in use, if not their own data.
Buyers mentioned they want to see a realistic, accurate version of the product—the one they’d actually be using, with the same features and limitations.
Buyers don’t want to waste their time seeing features they don’t care about demo’d (some want to be able to skip ahead), but at the same time, demos often contain A LOT of information, and buyers are interested in ways to slow things down, take the demo step by step, break up the demo, or have recordings/a sandbox/vendor rep experts they can consult on their own as needed.
Some buyers want a self-guided demo without vendor reps; other buyers want to make sure they have access to vendor reps for support/questions/advice (not just doing a free trial on their own). Note, however, that when demos leave buyers to play around on their own time, they may end up being less influential—possibly because reps aren’t there to add color.
Buyers want vendors to find more ways to show them realistic use of the product and communicate about product limitations/workarounds. Straight answers to questions, showing what parts of the product really look like today, willingness to poke around/try out examples or workflows that aren’t pre-prepared, demo things that wouldn’t work, etc.
Just making sure to have all of the proper experts included in the demo. Try to prevent
situations where they have to follow up on questions we ask because the proper resources were not included in the demo.
Making sure they show the current version of the software without additional
$$customizations.
Use real data in real use cases for our business needs and requirements. If there are
limitations be up front and honest.
Actually [demos could be] longer. The last demo I saw felt too marketingish and short.
How does this product work?
Maybe having pre-recorded sessions to look before the demo. A direct demo usually makes me
confused because there’s a lot of info to grasp.
I would like an on-demand demo instead of having to schedule one.
My data, by myself, when I feel like it. Don’t like scheduling time for a demo with a guy who is
just going to show me what he wants me to see.

40
Influential demos are more likely to let buyers “drive” (interact with the product) themselves.
More influential demos more often allowed buyers to drive during the demo itself, right in the moment. Less influential demos more often deferred to letting the buyer drive after the fact on their own time (when the sales and technical reps were not available for a dialogue, additional questions, or to point things out). 46% of more influential demos let buyers interact with the product themselves, while 30% gave buyers a trial or sandbox to play with later. 46% of less influential demos gave buyers a trial or sandbox to play with later, while 42% let buyers interact with the product themselves.
Using real data and walking through tasks in real time seem to be less important factors in determining whether a demo will be influential to the decision or not. Hands-on experience is more important—doing it yourself rather than being shown.
61% of buyers used product demos as a resource during their buying process. Here’s what those demos included:
Answered ourquestions
Included a sales rep
Showed us aspects of the product based on
our case/requirements
Included a technical expert
Let us “drive” (interact with the
product) overselvesUsed web
conferencing to present remotely
Used real data
Walked through tasks in real time
Gave us trial or sandbox to play
with later
Came onsite to present in-person
Other
68%
50%
49%
48%
46%
39%
31%
31%
23%
2%
Asp
ects
of D
emos
Percent of Buyers
20%0% 60% 80%40%
37%

41
Less than a third of vendors are capitalizing on this approach to demos.Only 32% of vendors are currently letting buyers “drive” (interact with the product themselves) during a demo. This aspect is, in fact, the least common thing included in demos, according to vendors. Vendors are focusing more on walking through tasks in real time (53%), using real data (53%), and giving buyers a trial or sandbox to play with later (48%). But fewer buyers this year are doing free trials or using these kind of accounts—perhaps because they’re so time consuming, or there’s too much up-front learning required to ascertain the points they care about on their own.
84% of vendors use product demos as a tactic to educate & engage prospects. Here’s what vendors include in their demos:
Answered buyers’ questions
Showed us aspects of the product based on
our case/requirements
Include a sales rep
Used web conferencing to
present remotely
Included a technical expert
Walked through tasks in real time
Use real data
Gave buyers trial or sandbox
to play with laterCame onsite to
present in-person
Let us “drive” (interact with the
product) overselves
Other
87%
80%
75%
74%
53%
48%
32%
3%
25%0% 75% 100%50%
53%
69%
44%

42
Vendors are twice as likely to rely on analyst rankings & reports as their buyers are. 24% of buyers used analyst rankings and reports. This is consistent with last year, and a significant decrease from 2017 and 2018.
48% of vendors used analyst rankings and reports as a tactic. 44% used them last year.
For reference, more than twice as many buyers used reviews as used analyst rankings & reports. Reviews and analysts are rated similarly for trust and influence among buyers who used each resource. However, reviews are much more accessible, and preferred by millennial buyers in particular.
ANALYSTS RANKINGS & REPORTS
60%
40%
20%
0%Buyers Vendors
Vendors are much more likely to rely on analysts as a tactic than buyers are to actually use analysts as a source of information.
24%
48%
Perc
ent w
ho r
ely
onan
alys
t ran
king
s &
rep
orts
0%
25%
50%
75%
100%
ReviewsAnalysts
Buyer usage
52%
24%
Buyer trust (rated 3 or 4)
86% 86%
Buyer influence (rated 3 or 4)
78% 77%
Buyer usage, trust, and influence for reviews vs. analyst rankings & reports

43
Analysts are high-effort for vendors to work with and yield positive-to-mixed results, but are perceived as necessary.We asked the vendors who use analyst rankings and reports as a tactic to educate and engage buyers how they feel about the time and money their organization spends with analysts.
59% feel generally positive about their investment in analysts. Though it is high-effort to build the relationship, these vendors see analysts as an important resource for their buyers and feel the results they see are worth it for the most part. Some of them are truly happy with the dynamic their organizations have with vendors; others feel like it’s a requirement to engage in their market.
29% feel neutral about their investment in analysts. Some of them describe working with analysts as a necessary evil, but are skeptical of whether the time/effort and expense is really generating results. They explained there’s a bit of a disconnect with analysts’ perceived importance vs. actual influence over their buyers, and actual helpfulness getting their differentiators out into the market. It can be hard to attribute ROI. Others say it depends on the analyst and your product, and how well it fits into the categories the analysts have defined. The larger analysts have more reach, but may produce less useful research—for both buyers and vendors. Some vendors in this group said they personally weren’t closely involved with their organization’s strategy around analysts, but felt their orgs probably wouldn’t be working with analysts if it wasn’t somewhat worthwhile.
12% feel negative about their investment in analysts. These vendors said analysts are hard to work with, expensive, and often not worth it. Some of them, like buyers, are frustrated by the pay-to-play dynamic and seeming bias towards older, high-revenue products. They feel a bit like hostages, or at the mercy of the analyst “racket.” Some struggle to articulate their product’s value and strategy to analysts, especially if they are newer to the market or taking an innovative approach that doesn’t fit neatly into the analysts’ paradigm. Others describe analysts as being out of sync with the specific needs and concerns of buyers.
More vendors now use reviews than invest in analyst rankings and reports.According to vendors, reviews are slightly more effective than analyst rankings & reports at helping to move their buyers towards a decision. Reviews received an average effectiveness score of 3.12 versus analysts’ average effectiveness score of 3.07. And buyers agree that reviews are more influential, with reviews receiving an average influence score of 3.08 versus analysts’ average influence score of 3.03.
Reviews are also easier to manage than analysts, according to vendors. Reviews received an average difficulty score of 2.41 versus analysts’ average difficulty score of 2.60. Analysts are the most difficult tactic to manage, aside from customer references.
How vendors who use analyst rankings & reports feel about the
time and money spent with analysts
59%29%
12%
PositiveNeutral
Negative

44
But vendors’ perception of analysts’ impact on buyers is still outsized.The two most common ways buyers used analysts in their buying project were in the Discovery phase:
• Decide which products to evaluate (66%)• Learn about the market (52%)
• About 2 in 5 (42%) of buyers used analysts to pick the right product for their org, and just over a third of buyers (36%) used analyst rankings and reports to support a recommendation to other stakeholders. • 80% of vendors said they think buyers use analysts to decide which product to evaluate,vs. 66% of buyers who actually do.• 58% of vendors think buyers use analysts to learn about the market, fairly close to the 52% of buyers who actually do.• 52% of vendors think buyers use analysts to support a recommendation to other stakeholders,vs. 36% of buyers who actually do.• 46% of of vendors think buyers use analysts to pick the right product for their org, fairly close to the 42% of buyers who actually do.
ReviewsAnalysts
Vendor usage
58%
48%
Effectiveness for vendors (rated 3 or 4)
80% 78%
Ease of managing for vendors (rated 3 or 4)
54%47%
Vendor usage, effectiveness, and ease of managing reviews vs. analyst rankings & reports
0%
25%
50%
75%
100%
Learn about the market
Decide which products to
evaluate
Pick the right product for
your org
Support a recommendation to other stakeholders
Other
Buyers that use analysts this way
Vendors that think buyers use analysts this way
100%
75%
50%
25%
0%
24% of buyers used analysts as a resource in their buying process. Here’s how buyers use analyst rankings & reports (vs. how vendors think they do).
52%58%
66%
80%
46%42%
36%
1% 1%
52%

45
Vendors think analysts play a bigger role than they actually do for buyers. Out of 4 possible roles, buyers picked slightly less than 2 on average, and vendors picked more than 2.
Buyers do appreciate analysts’ market coverage, insights, and expertise, but they struggle with generalizations and worry about analyst bias.The top 5 strengths of analysts buyers identified in qualitative feedback were:
• Their market coverage (21%)
• The useful insights they provide (16%)
• That they’re experts (14%)
• That they’re an independent source of information (8%)
• That they’re influential with other stakeholders, so they give the org confidence in the direction of the project (7%)
I am never sure that analysts are unbiased. Often it feels like there is some sort of influence from vendors that is not
transparent, but readily apparent.
Some may have their hands in the pockets of the vendors so you don’t get an unbiased review. Many don’t know what is important
to my particular business.
Good breadth across vendors, but often limited implementation experience.
I think they bring some industry knowledge and experience which is beneficial. However, if you are looking at newer technology their expertise may be limited and they also do not understand
the cultural environment of the organization.
The strength is that we could demonstrate to our stakeholders that our chosen partner could perform at a high level. The weakness is that our business is very unique and there were no business cases just like ours, so the
comparison is anecdotal.
[Analyst] Rankings helped us to know what products are out on the market, and how
effective some of them are for users. However, reading the rankings can be hard to translate to our specific situation. Rankings also don’t give any feedback for further investigation.
So there’s a rumor about Gartner that you have to pay to have your company listed in their magic quadrant. I don’t know if that’s true, but I don’t like it. I feel that some of
the better solutions may not be included. In my own research for other products, we’ve
found solutions that were not on the Gartner magic quadrant that were much better than
some of the industry leaders. Gartner for us is a checkbox. I need an independent,
third-party source to provide viable options when going out to bid. However, I see it as a recommendation. I think you have to look at
it a little skeptically.
Vendors overestimate the role analysts play in the buyer’s purchase process
1.972.36
Buyers
Vendors

46
The top 5 limitations of analysts buyers identified were:
• That their analyses are too general, not specific to the buyer’s use case, environment, or priorities (33%)
• That they’re biased (24%)
• That they’re not users or practitioners, and therefore are missing some real-world/first-hand perspective (11%)
• That analyst rankings & reports are missing important information, for example on support or integrations (6%)
• That analysts don’t cover new or niche players of interest (6%)
A smaller number of buyers also pointed out that analysts are expensive to work with (2%), and that sometimes the available reports & rankings aren’t current (1%)—either because they’re outdated, or consider a vendor’s future direction too much when the current offering is not there yet.
A common thread is that buyers see analysts as generalists—they are experts with exposure to a lot of vendors, a lot of products, and a lot of organizations’ technology strategies. This has value, but is also limiting, since they aren’t aware of the buyer’s unique circumstances, nor can they really affect a fresh, on-the-ground perspective.
Advice for VendorsOnly 3% of buyers are motivated to become a lead by third-party gated content, like analyst reports. And less than a quarter looked at analyst reports at all during a buying journey. Is your analyst investment worth it?
Understand how your buyers use all sources of third-party validation. Freely available third-party content, like reviews, are used by more than twice as many buyers.
3x as many buyers said they worried analysts were biased—either influenced by paid relationships with vendors, or personal subjectivity—as said analysts’ independence as an objective third-party source was a strength.
30%
20%
10%
0%Independent Biased
24% of buyers used analyst rankings & reports. Of those, it was more common for buyers to see analysts as biased than independent.
8%
24%
Perc
ent o
f buy
ers
who
use
d an
alys
ts

47
On average, organizations spend 33% of their time on Discovery, 43% of their time on Evaluation, and 24% of their time on Selection during a buying project. On average, vendors spend 36% of their resources focusing on enabling the Discovery phase, 36% of their resources enabling the Evaluation phase, and 28% of their resources enabling the Selection phase.
Tip for buyers
It’s helpful to know how long different stages of the purchase will take when you’re planning and managing the project timeline. Be prepared to spend the most time and energy on the Evaluation stage. If your Discovery process takes three weeks, then you might expect Evaluation to take four weeks—and to be signing a contract two weeks after that! Plan ahead.
If you know from the onset that you need to have a product in place two months from now, you should spend no longer than a week or two developing your shortlist. That way, you’ll be on track to complete the process and start implementing before the deadline.
In general, vendors support buyers’ process fairly well. 90% of buyers rate the support they get from vendors positively. 89% of vendors rate their own support for the buying process positively. 10% of buyers rate the support they get from vendors negatively, while 11% of vendors rate the support they give negatively. Interestingly, at the top end of the spectrum (rating of 4—Very well), buyers actually rank vendor support performance higher than vendors themselves. Vendors are doing a bit better than they think they are at supporting their buyers’ process.
THE BUYER’S JOURNEY
Discovery SelectionEvaluation
VendorFocus
BuyerFocus 33% 43% 24%
28%36%36%
0% 25% 50% 75% 100%
When time, energy, and resources are spent in the buyer’s journey
I’m excited to fix this problem and
upgrade our toolset.I need to ID products that will work in my
specific environment.
I don’t trust products are actually going to work as advertised.
As soon as I can get up and running, I’m going to be able
to accomplish so much!
I need to justify the spend by showing clear ROI. I’m also trying to avoid internal politics.
Epiphany Discovery Evaluation Selection Maturity

48
But vendors don’t understand which tasks are truly hardest for buyers: comparing products and researching options.Buyers and vendors identify different tasks as being most difficult in the buying process.
Vendors have, perhaps, selected the tasks they have the most visibility into, where they see their buyers struggling. But vendors are also highlighting some of the key reasons they lose to a no-decision. If a buyer’s organization has no budget or no clear scope for the project, they may never make a purchase. The buyers in our study all purchased the product. Some of them surmounted challenges around budget and scope. Others may not have faced these problems at all, if their organizations already had well defined mandates to purchase a new product.
1 - Not at all 3 - Fairly well2 - A little bit 4 - Very well
Vendor
Buyer 9%
1%
57% 33%
26%63%11%
0% 25% 50% 75% 100%
Buyers and vendors have similar perceptions of how well vendors support the buyer’s journey.
According to buyers, the hardest things to do are:
According to vendors, the hardest parts of the buying process are:
Compare products (40%)
Research options (32%)
Convince org to invest in fixing the problem (49%)
Articulate the business problem, scope, and requirements (40%)
Pitch recommendation to stakeholders for buy-in (29%)
Articulate the business problem, scope, and requirements (27%)
Convince org to invest in fixing the problem (27%)
Research products against requirements (25%)
Implement the product (24%)
Prioritize criteria (22%)
Identify need for technology (28%)
Compare products (26%)
Drive adoption (23%)
Implement the product (22%)

49
Advice for vendorsThe two most difficult steps along the path to purchase are comparing products and researching options. These happen earlier in the buyer’s journey, and likely help buyers make the internal case for purchase. Buyers who are ultimately successful in making a purchase devote more time and effort to this stage.
Buyers who have less difficulty getting buy-in from other stakeholders are doing more research. How are you enabling effective comparison and research? Vendors who do so effectively may be more successful in closing the deal.
Buyers address their needs with comparative content. They spend a lot of time with resources that help clarify the differences between products. In fact, looking at our own site visitors, buyers spend a higher than average amount of time with our comparison pages and our category pages, where they can find a list of products as well as TrustMaps! What comparative content do you have to offer buyers? Effective forms include:
• Quotes and stories from customers who have used competitive products
• 3rd party comparative content that showcases competitive differences in a validated format
• Tables or matricies that visually display differences in features, pricing, etc. between you and your competitors
• Visuals or charts that allow buyers to quickly understand the market
Understanding the “cons” is becoming more important for buyers before making the purchase. But fewer vendors than ever acknowledge it’s a crucial part of the buyer’s journey.77% of buyers said it was very important to understand the cons before making a purchase. But only 33% of vendors said they thought it was very important to buyers to understand the cons before buying.
77%
20%
3%
77% of buyers say it was very important to understand the cons before they
bought the product.
1-Not Important
4-Very Important2 3
37%
25%33%
4%
Only 33% of vendors think/recognize it’s very important for buyers to understand
the cons before making a purchase.
1-Not Important
4-Very Important2 3

50
The gap in perception, or trust, has increased from last year. The cons are getting even more important for buyers, and vendors are recognizing the importance less. In 2019, there was a 29-point gap between buyers and vendors on the perceived importance of cons. This year, there’s a 44-point gap.
Vendors are more comfortable thinking about “cons” in terms of product fit.
71%
77%
20202019
33%
42%
29-point gap
44-point gap
The gap between buyers and vendors who think it’s important to know the cons before buying increased YoY.
86% of vendors aim to be up front about product limitations,
i.e. where it’s not a good fit
86%
14%
We don’t like to lead with the product’s limitations
We aim to be clear about where the product works well
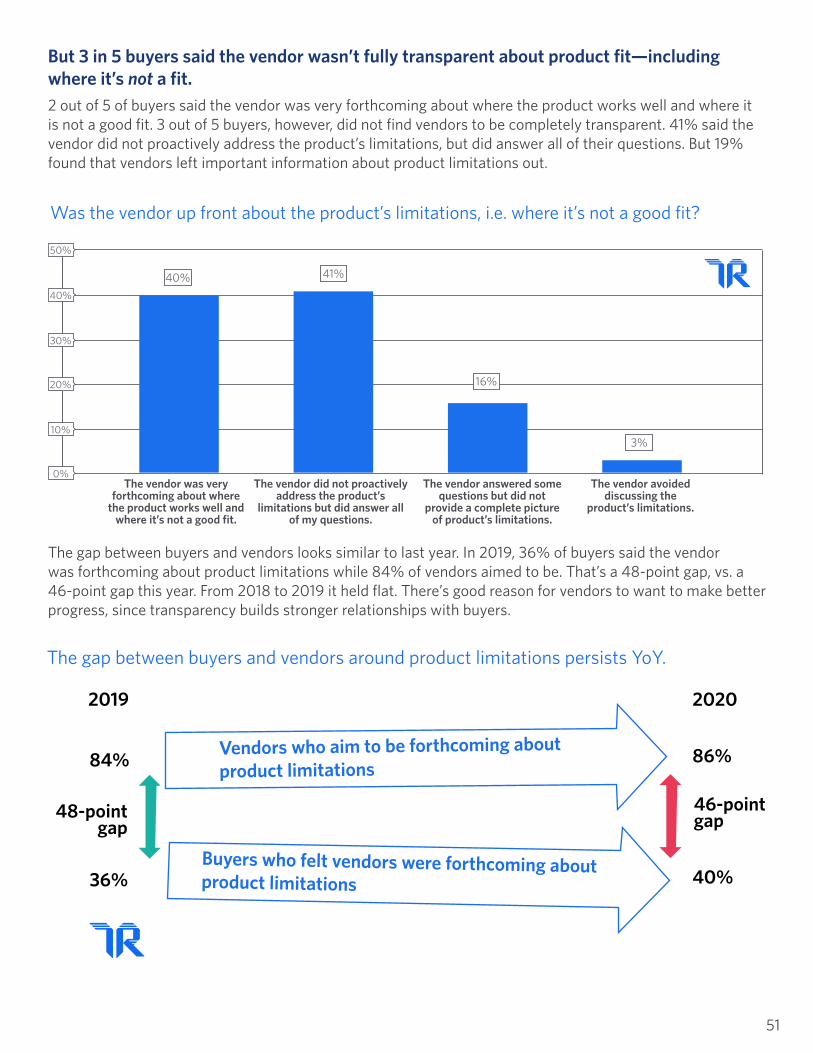
51
But 3 in 5 buyers said the vendor wasn’t fully transparent about product fit—including where it’s not a fit.2 out of 5 of buyers said the vendor was very forthcoming about where the product works well and where it is not a good fit. 3 out of 5 buyers, however, did not find vendors to be completely transparent. 41% said the vendor did not proactively address the product’s limitations, but did answer all of their questions. But 19% found that vendors left important information about product limitations out.
The gap between buyers and vendors looks similar to last year. In 2019, 36% of buyers said the vendor was forthcoming about product limitations while 84% of vendors aimed to be. That’s a 48-point gap, vs. a 46-point gap this year. From 2018 to 2019 it held flat. There’s good reason for vendors to want to make better progress, since transparency builds stronger relationships with buyers.
40%
30%
20%
10%
0%
50%
The vendor was very forthcoming about where
the product works well and where it’s not a good fit.
The vendor did not proactively address the product’s
limitations but did answer all of my questions.
The vendor answered some questions but did not
provide a complete picture of product’s limitations.
The vendor avoided discussing the
product’s limitations.
Was the vendor up front about the product’s limitations, i.e. where it’s not a good fit?
40% 41%
16%
3%
The gap between buyers and vendors around product limitations persists YoY.
84% 86%
20202019
40%36%
48-point gap
46-point gap

52
Tip for buyersHaving confidence about product limitations, how they relate to your use case, and if you need to plan for workarounds will help your organization move faster. Do some research before you talk to vendors, so that you know where to probe. Reviews are a great way to learn about issues you might not have thought of, or that the vendor might not bring up—as well as asking others in your network.
Ask vendor reps to slow down during product demos to show you exactly how a feature or workflow does or doesn’t work. Follow up via email to ask for written answers to key questions. Push for more transparency. If you’re struggling, get inspired by this list of tough questions to ask vendor reps.
Buyers are more likely to feel supported by vendors who are very forthcoming about product limitations.
Buyers who said vendors supported their buying process very well were also more likely to say the vendor was very forthcoming about product fit. 62% of buyers found this to be true—that’s nearly double the transparency from vendors who supported buyers fairly well, and more than 3x the transparency from vendors who supported buyers less well.
The vendor was very forthcoming about where the product works well and where it is not a good fit.
The vendor avoided discussing the product’s limitations.
The vendor did not proactively address the product's limitations, but did answer all of my questions.
The vendor answered some of my questions but did not provide a complete picture of product's limitations.
Fairly well supported
Very wellsupported
A little bit supported
Not at allsupported 17%
17%
58% 17% 8%
7%29%47%
46%32% 19% 3%
3%7%29%62%
0% 25% 50% 75% 100%
Vendors who supported buyers very well were 2-3x more transparent.
53
Advice for vendorsBeing truthful doesn’t hurt your ability to sell. But it does help your ability to satisfy and retain clients. It may be scary to see negatives, but 4 out of 5 buyers think they’re critical to making a purchase.
Where are buyers finding cons? Reviews. Reviews make understanding cons simple, often presenting them in an easy-to-read, visual list. And when over half of buyers find that vendors aren’t forthcoming with product limitations, unbiased resources like reviews become a crucial part of the buyer’s journey.
But having negative information out there about your product can be stressful. Just remember: it’s a necessary part of the process towards successful purchase! And it helps buyers set their expectations, leading to happier customer relationships later on. Here are strategies to own your cons on review sites in a way that will help buyers:
1. Thoughtfully reply to all reviews. Many review sites offer the ability for vendors to leave a comment on reviews. A member of your team should reply to every review, thanking the reviewer for their feedback and addressing any cons in a personalized way.
2. Invite cons as part of positive reviews, too. Remember, the most valuable part of reviews for buyers is the content within. Why? It helps provide a realistic picture of the product—negatives included! It also helps buyers know they can trust the pros, particularly in glowing reviews. Cons are a big part of why review content is so important.
3. Use cons to differentiate yourself from your competitors. Sometimes, knowing where a product doesn’t fit is an easy way to understand where it does. Helping buyers make sense of all the information they find—including the cons—puts all the product fit puzzle pieces together.
4. For negative reviews, reach out to reviewers who would like the opportunity to get help resolving their issues or want to have a more detailed conversation offline. On TrustRadius, negative reviewers have the option to request contact. Don’t neglect this opportunity! Opening dialogue and working with these customers is an opportunity to turn a detractor into an advocate.

54
The most common point at which buyers are first willing to give their information so that vendors can contact them is when they’re ready for a product demo (32%).But buyer opinions vary widely. 26% of buyers said they’re willing to give vendors their contact information right away, when they start gathering information in the Discovery phase. On the other hand, 10% of buyers aren’t willing to give their contact information until they want a free trial, another 9% don’t want vendors to have their information until they decide they’re ready to get on the phone with a salesperson to ask questions, and 7% want to wait until they’ve decided to buy the product to ever release their contact information to the vendor. 3% say they’re never willing to give their information so that vendors can contact them.
Gated content is an industry established norm, but modern buyers aren’t about it.Only a small portion of buyers said the thing that would motivate them to become a lead was content from a vendor about their product (10%). Third-party content that compares products/covers the market was even less likely to motivate buyers to share contact information with vendors (3%)!
Where else do leads come from?In addition to contact forms on vendors’ own properties, 55% of vendors also purchase leads from third parties.
45% of vendors said they don’t purchase leads from third-parties.
But only 9% of vendors feel they’re getting high-quality leads from third parties.
30% of vendors said the leads they purchase from third-parties are average quality. Only 9% of vendors feel they’re getting high quality leads from third parties. 16% of vendors feel they’re getting low quality leads from third parties.
LEADS
When I want to see a
demo of the product.
When I start gathering
information in my Discovery phase.
In exchange for content from a vendor about their product.
In exchange for a free
trial of the product.
When I want to get on the phone
with a salesperson to ask questions.
Once I’ve decided to buy their product.
0%
10%
20%
30%
40%
When is the first point you are willing to give your information so that vendors can contact you?
32%
26%
10% 10% 9%7%
In exchange for third-party content that
compares products/covers the market.
3%
Never!
3%
87%
For 87% of buyers, gated content isn’t what motivates them to become a lead.
The first point buyers are willing to give vendors their contact information
13%
Gated content
Something else
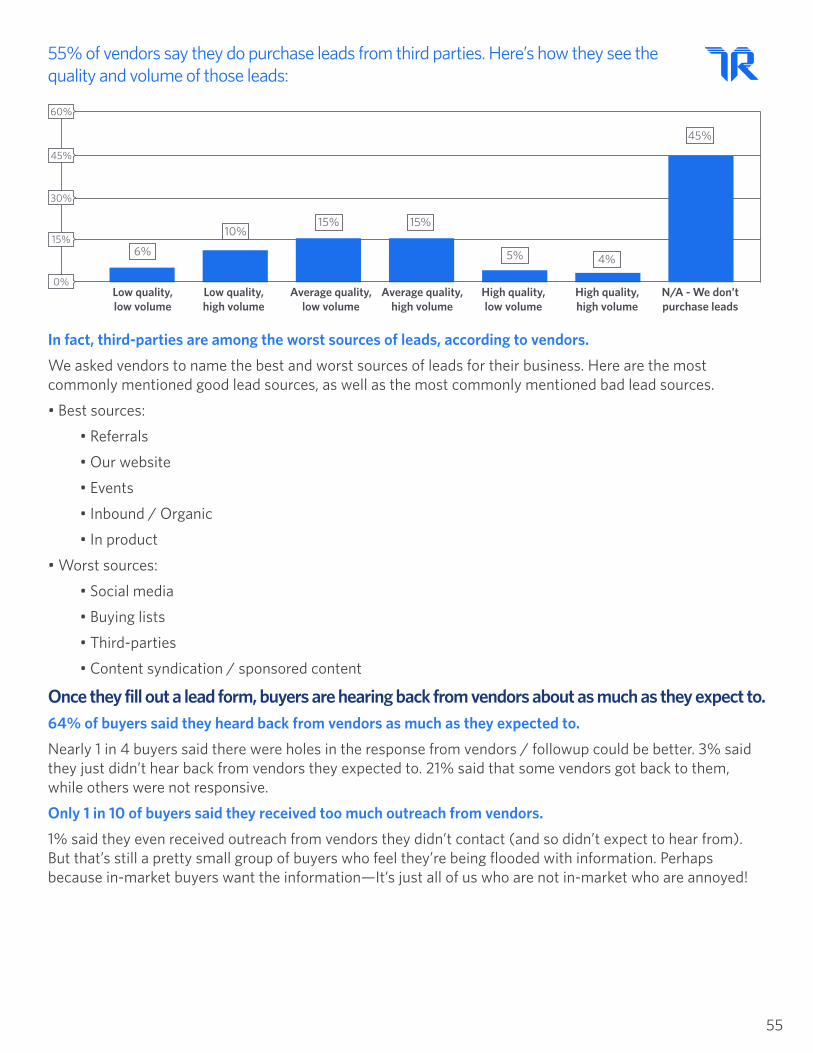
55
In fact, third-parties are among the worst sources of leads, according to vendors.We asked vendors to name the best and worst sources of leads for their business. Here are the most commonly mentioned good lead sources, as well as the most commonly mentioned bad lead sources.
• Best sources:
• Referrals
• Our website
• Events
• Inbound / Organic
• In product
• Worst sources:
• Social media
• Buying lists
• Third-parties
• Content syndication / sponsored content
Once they fill out a lead form, buyers are hearing back from vendors about as much as they expect to.64% of buyers said they heard back from vendors as much as they expected to.Nearly 1 in 4 buyers said there were holes in the response from vendors / followup could be better. 3% said they just didn’t hear back from vendors they expected to. 21% said that some vendors got back to them, while others were not responsive.
Only 1 in 10 of buyers said they received too much outreach from vendors.1% said they even received outreach from vendors they didn’t contact (and so didn’t expect to hear from). But that’s still a pretty small group of buyers who feel they’re being flooded with information. Perhaps because in-market buyers want the information—It’s just all of us who are not in-market who are annoyed!
Low quality, low volume
Low quality,high volume
Average quality, low volume
Average quality, high volume
High quality,low volume
High quality,high volume
0%
15%
30%
45%
60%
55% of vendors say they do purchase leads from third parties. Here’s how they see the quality and volume of those leads:
6%
10%15% 15%
5% 4%
N/A - We don’t purchase leads
45%

56
Meeting expectations for followup is one factor that makes buyers feel supported.
Buyers who felt very well supported by vendors during their buying process more often got the expected amount of followup from vendors. They were less likely to say that vendors were not responsive, and less likely to say that they received too much followup.
No, I didn’t hear back from vendors I expected to.
Ack! I received too much outreach (emails, phone calls, etc.) from vendors.
Sort of. Some vendors got back to me, but others were not responsive.
Yes, I heard back from vendors as much as I expected to.
I even received outreach from vendors I didn’t contact.
Fairly well supported
Very wellsupported
A little bit supported
Not at allsupported 33%
7%
8% 50% 8%
17%39%36%
25%2% 61% 10%
1%
2%9%76%11%3%
0% 25% 50% 75% 100%
Buyers who felt very well supported by vendors were more likely to receive the expected amount of followup.
80%
60%
40%
20%
0%No, I didn’t hear
back from vendors I expected to.
Sort of. Some vendors got back to me, but others were not responsive.
Yes, I heard back from vendors as much as I
expected to.
Ack! I received too much outreach.
Did you receive the followup you expected from the technology vendors?
3%
21%
64%
11%
I even received outreach from vendors
I didn’t contact.
1%

57
Vendors feel pretty good about their lead-handling processes.Overall, most vendors have a solid lead-handling process in place—which checks out, since buyers generally feel they’re getting the right amount of followup. 44% of vendors said they follow up with most or all leads to varying degrees, and 26% said they follow up with every lead in the best way possible. 14% said they follow up with leads selectively.
Still, there is room for improvement. 7% said they don’t follow up with as many leads as they should. 9% said their process is a bit of a mess, and they’re still figuring it out.
But two-thirds of buyers feel neutral or negative about their first contact with vendors, and the way vendors are treating their contact info/exchange of information.Communication is crucial to the relationship vendors are building with buyers, and this resignment or skepticism keeps buyers from feeling great about how they’re treated/valued by vendors (which can damage or prevent them having a relationship with the product itself). Sure, it’s status quo, but buyer tolerance for lead forms, mass nurturing, and too much or too little followup is waning.
A third of buyers feels perfectly good about this process—they feel like it’s their job to be the point person for their company with vendors, they like receiving information and outreach, and forms were easy enough to fill out.
Another 23% of buyers feel neutral about it. Basically, they see filling out lead forms as a necessary evil. They don’t love it, but they’re willing to do it as long as the form isn’t too intrusive and they’re ready to hear from vendors (or are getting something valuable enough in return), because they understand it’s how the process works. They generally say it depends on what they’re trying to buy, what stage they’re at, and how individual vendors “handle” their leads—since some are much better/easier to work with than others. They have a firm handle on opt-outs and unsubscribes, and are careful about which vendors they give their information to, and when.
60%
45%
30%
15%
Our process is a bit of a mess, we’re
still figuring it out.
We don’t follow up with as many leads
as we should.
We follow up with leads selectively.
We follow up with most or all leads to
varying degrees.
How effective is your lead-handling process?
9% 7%14%
44%
We follow up with every lead in the
best way possible.
26%
0%
Fairly easy to do. Most contacted within a day about the products. From there multiple emails and calls to follow up. Those we did not go with
were not pushy and understood our decision.
I understand that it is part of the process. As we moved forward, the more information that I provided on our process and need the better they were able to
align their recommendations and offers.
I don’t mind it, but sometimes it does get in the way of my regular work.
Fairly standard practice. I don’t like it but it is everywhere.

58
More than 2 out of 5 buyers (43%) describe the experience negatively. They’re suspicious of how their contact information will be used, and know it will lead to being bombarded with unwanted, distracting phone calls and emails that feel spammy. Many of them avoid filling out forms, and try to keep their contact information out of vendors’ hands until they’ve already made a decision and they’re ready to buy. Some even said if vendors make them fill out lead forms to get essential information, or have lead follow-up processes that are too much or too little, they will remove that product from consideration.
Buyers in executive and leadership positions are especially likely to have negative feelings about being a lead. 53% of C-level executives, VPs, and SVPs responded with negative sentiment.
But no matter their job title, most buyers don’t want to let vendors in on their journey until they absolutely have to—i.e. when they want to see the product, or get specific questions answered and terms negotiated. They’re making sure they don’t get too much followup by being defensive with their contact information.
I feel fairly comfortable, that is if my company is very interested in the product. If not, the
marketing/spam can be too much.
I am fine with being a sales lead, as long as the information used is only available for a specific
time or product line.
I work in demand generation so I know how it works. It is annoying being contacted by BDRs
all the time, though.
It’s OK. I’m a marketer so I understand the need for it, but I wait to fill out forms until I need more information
than I can find on their website or other places.
Tedious but necessary.
I don’t like it. I wish I could get to the product first and determine if it’s right for me first before
I hand out all my info.
Filling out a lead form simply to see a video or get to the features or get pricing is a turnoff and I automatically disqualify vendors who do this.
I prefer self serve or transparent pricing to start. Very turned off by ‘contact us’ for any
additional/any information.
Painful. Don’t have a lot of time to manage those calls. Would rather initiate
the contact myself.
When I spend 15 minutes filling out a form with a billion questions and then in response I get an email saying ‘let’s set up a time to chat’ which
in turn results in a needless phone conversation where you tell me you will email me details...just
send the details. I honestly don’t really want to talk to you until I have questions. Send me details so I can compose some questions about the product.
ENTIRELY TOO AGGRESSIVE in most cases.

Advice for vendorsVendors, let’s have a chat. You might expect this, but there is good and bad news here.
The good news? A full 97% of buyers are willing to give you their contact info along their path to purchase. And nearly 3 in 5 (57%) either don’t mind or even feel good about doing so!
But becoming a lead happens closer to the purchase than many vendors would like. 60% of buyers who are willing to become a lead do so only when ready to directly engage: when they want to see a demo, start a trial, converse with sales, or even when they’ve decided to buy.
So while your content and lead generation activities are important (and appreciated by a full 40% of buyers), consider the un-gated information that a majority of buyers access before bringing you into the loop. Because by that time, a buyer has likely already made decisions like which products are on the shortlist.
Focus on freely-accessible information and what it says about your product. Is there something currently gated that would capture more of the right attention ungated? Do you have enough ungated information about your product to convince buyers to contact you when they’re ready to dive in?
Third-party reviews are a great example of a resource used to evaluate vendors before making contact. They help buyers investigate real use cases of a product in a way that’s easy to access and highly transparent. Does your product have enough reviews representing enough use cases to keep you on the short list?
Make sure the information that is freely available for buyers points towards conversion opportunities, whenever buyers are ready. Understanding buyer intent, even before they identify themselves to you, is critical to staying top-of-mind. Clearly optimize on-site experiences with opportunities for conversion by including compelling content, like social proof. Another emerging tactic is retargeting—not just from your company’s own site, but from broader audiences in your category. For example, third-party review sites provide a prime opportunity for retargeting active buyers.
Once you do have contact information, treat it with care. In general, buyers feel comfortable with the amount of follow-up received. Nearly 2 in 3 heard from vendors at a frequency they expected. But there’s room for improvement on both sides of the spectrum, with some buyers receiving too much or not enough follow up.
24%
How buyers feel about filling out forms with their contact information
for vendors (i.e. the experience of “becoming a lead”).
33%
Positive
Neutral
43%
Negative
59

60
The buyer’s journey has changed. By now, most people—buyers and vendors—are fully aware. But if you haven’t yet adjusted your strategies, now is the time.
With all this information available, what should you take away? Know this: now, buying software in 2020 is about teams coming together to try to understand real experiences with the products they’re considering to make the right decision.
Buyers do this both by getting hands-on with a product, learning about experiences from similar people through trustworthy resources like reviews, and making sure they understand the pros and cons. Much of the time, they want to find this information on their own. But there’s a gap between what buyers want and what vendors deliver.
There are some low-hanging opportunities vendors can use to connect with buyers in a way that will make their product stand out. Make sure buyers can find information about your product from their peers, not just from the vendors themselves. For example, over half of buyers use reviews. Reviews help buyers check a number of needs off the list when they come from a trusted, third-party site. These include serving buyers who may not be engaged with vendors, helping understanding the cons, providing high-quality qualitative feedback, understanding the experiences of others with similar needs, and easily seeing how products compare.
As we enter a new decade, those who best understand and accommodate the buyer’s journey will stand out in crowded markets. What will you do differently this year to make your products and your company shine?
CONCLUSION

61
STUDY DEMOGRAPHICS
Buyer age
6%
55-73years old
59%
23-38years old
35%
39-54years old
Buyer company size
13%
1-10 employees
10%
10,001+ employees
16%
11-50employees
20%
51-200employees
13%
201-500employees
10%
501-1,000employees
6%
1,001-5,000employees
6%
5,001-10,000employees
Type of technology purchased
Business Intelligence
HR Marketing Professional Services
Finance & Accounting
Sales Customer Support
IT Vertical Industry (e.g. construction
software)
Hardware0%
10%
20%
30%
40%
7%4%
13%
4% 4% 5% 3%
32%
2%
12%
Other
14%
Buyer respondents
Buyer job title
Intern Entry Level
Analyst/Associate
Manager SeniorManager
Director VP Senior VP C-Level Executive
(except CEO)
CEO Owner/Principal
Founder/Co-Founder
0%
10%
20%
30%
0% 1%
20%
25%
11%14%
3%1%
8%
14%
5%
10%
OtherConsultant
5% 6%
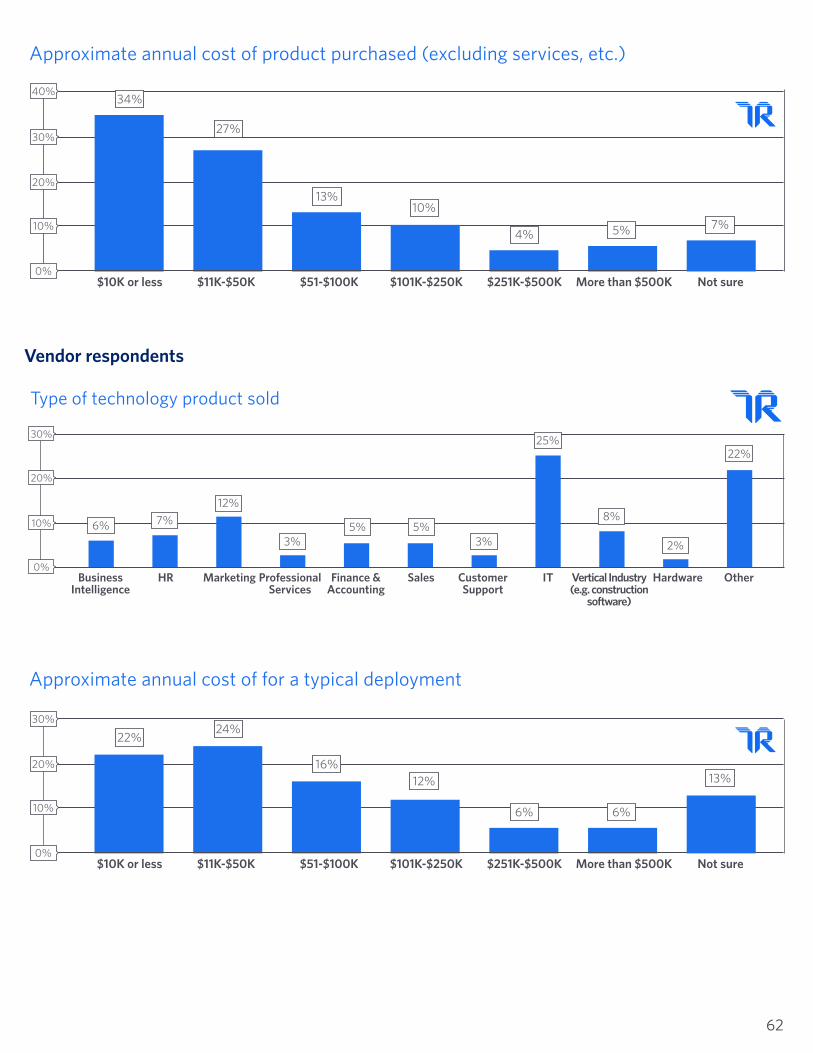
62
Type of technology product sold
Business Intelligence
HR Marketing Professional Services
Finance & Accounting
Sales Customer Support
IT Vertical Industry (e.g. construction
software)
Hardware0%
10%
20%
30%
6% 7%12%
3%5% 5%
3%
25%
8%
2%
Other
22%
Vendor respondents
Approximate annual cost of product purchased (excluding services, etc.)
$10K or less $11K-$50K $51-$100K $101K-$250K $251K-$500K More than $500K0%
10%
20%
30%
40%34%
27%
13%10%
4% 5%
Not sure
7%
$10K or less $11K-$50K $51-$100K $101K-$250K $251K-$500K More than $500K0%
10%
20%
30%
Approximate annual cost of for a typical deployment
22%24%
16%12%
6% 6%
Not sure
13%

63
C-Suite(CEO, COO)
Marketing Leadership
Sales Leadership
Demand Gen/
Digital Marketing
Customer Marketing/Customer Advocacy
Public Relations/Comms/Analyst
Relationship
Product Marketing
Sales Enablement
Customer References
Account Executive
MDR/BDR/SDR
Consultant None of the Above
Vendor job title
0%
10%
20%
30%
40%
7%
28%
17%
34%
20%
13%
25%
18%
8%
14%
5%
10%
0%
Small businesses (1-50 employees)
Mid-sized companies (51-1,000 employees)
Enterprises (1,001+ employees)
Evenly split across multiple segments
Not sure0%
15%
30%
45%
Customer company size segment focus
12%
38% 37%
12%
1%
Vendor company size
3%
1-10employees
2%
5,001-10,000employees
13%
10,001+employees
14%
11-50employees
24%
51-200employees
16%
201-500employees
9%
501-1,000employees
17%
1,001-5,000employees

64
We hope you enjoyed this report! If you have any questions or feedback, please contact us at [email protected].
TrustRadius is the most trusted platform for software and technology reviews. TrustRadius helps technology buyers make confident decisions with in-depth reviews and ratings from real users. TrustRadius also helps vendors influence the market conversation, target the right buyers, and accelerate sales and marketing by putting their customers’ voice to work.
Keep in touch:
https://www.trustradius.com
https://www.linkedin.com/company/trustradius
https://www.facebook.com/TrustRadius
https://twitter.com/trustradius
https://vendors.trustradius.com/blog
Want to learn more about how your buyers use reviews? Check out these great resources:
Reviews 101: The Definitive Guide to B2B Reviews
The Importance of Reviews to Enterprise Technology Buyers
ABOUT TRUSTRADIUS
The Definitive Guide to
B2B Reviews