Embed Size (px)
Citation preview
1
The 2018 Brown Center Report on American Education: How Well are American Students Learning?
Michael Hansen, Elizabeth Levesque, Jon Valant, Diana Quintero
PrOLOGUE
American schools find themselves immersed in politics in 2018. A horrific shooting at Marjory Stoneman Douglas High School in Florida sparked a wave of student demonstrations, culminating in hundreds of thousands of students descending on Washington, D.C., for the
March for Our Lives. A controversial president and his controversial secretary of education have aroused passions on issues including the deportation of young immigrants, civil rights protections for transgender children, and schools’ handling of bullying and student discipline. Meanwhile, unrest among teachers has yielded rallies and strikes across the country.
This, in other words, is a time of heightened political awareness and activity in schools. It is also a time of heightened concern about the state of U.S. politics and democracy. The 2016 election drew attention to the increasing polarization and divisiveness of our politics, and to the susceptibility of American voters’ beliefs to false or misleading information. These concerns have raised important questions about K-12 education in America. Are schools equipping students with the tools to become engaged, informed, and compassionate citizens? Are they equipping some students, or groups of students, better than others?
For all of their flaws, past and present, U.S. public schools have a long history of responding to the perceived needs of the time. Nineteenth-century common schools arose from a desire to create social harmony and political stability, amid strife, by instilling a common set of values and beliefs through public education. A century later, when the Soviet Union launched Sputnik, Congress passed the National Defense Education Act to bolster science education and better align school priorities with national priorities. And when “A Nation at Risk” brought attention to American students’ disap-pointing performance on international tests, states began to adopt content standards and measure students’ progress on tests aligned with those standards.
Jon Valant is a Fellow in the Brown Center on Education Policy at the Brookings Institution.
Elizabeth Levesque is a Fellow in the Brown Center on Education Policy at the Brookings Institution.
Michael Hansen is the Director of the Brown Center on Education Policy and a Senior Fellow at the Brookings Institution.
Diana Quintero is a Research Analyst in the Brown Center on Education Policy at the Brookings Institution.
June 2018
The 2018 Brown Center Report on American Education 2
A growing sentiment holds that many of the country’s greatest challenges today relate to the state of its politics, with implications for the cohesion of American society and functioning of its democracy. However, even as politics increasingly penetrate American classrooms, U.S. education policy—as implemented in state accountability systems, for example—continues to emphasize students’ performance in mathematics and reading as the dominant focus of K-12 schooling. To the extent this emphasis has crowded out a focus on students’ civic development, we should ask whether today’s schools are, in fact, responsive to the needs of our time.
This edition of the Brown Center Report (BCR) on American Education focuses on the state of social studies and civics education in U.S. schools. Like previous editions, which were authored by Tom Loveless, this report examines student performance on a recent assessment—the National Assessment of Educational Progress (NAEP)—before delving into distinct topics in subsequent sections, each of which focuses on a different aspect of civics education.
Specifically, the 2018 BCR is organized as follows:
• Chapter 1 assesses trends in students’ scores on the NAEP, colloquially known as the “Nation’s Report Card.” The 2017 NAEP has drawn particular interest for demarcating the end of the No Child Left Behind era and the beginning of the Every Student Succeeds Act era. This chapter describes trends in standardized scores on the mathematics (1996 through 2017), reading (1998 through 2017), and civics (1998 through 2014) assessments. It examines both overall trends and gaps by race, ethnicity, and family income.
• Chapter 2 examines state policy related to civics education. It describes findings from a 50-state inventory of high school course requirements, K-12 social studies standards, and curriculum frameworks. The analysis is motivated by questions about the alignment between current state requirements for civics education and the practices believed by experts to constitute a high-quality civics education.
• Chapter 3 provides a look at the nation’s social studies teachers. It presents statistics on the demographics, qualifications, responsibilities, compensation, and satisfaction of social studies teachers in secondary grades. Through comparisons with math, English language arts, and science teachers, this section shows the ways in which social studies teachers are—and are not—notably different from teachers of other subjects.
Taken together, these chapters provide a portrait of civics education in the United States. They describe the per-formance of U.S. students in civics education, insofar as we can observe it, while using state policies, teacher characteristics, and student survey results as windows into students’ experiences.
Of course, the resulting portrait is incomplete. Some of the report’s limitations are our own, or reflect the nature of writing a single report on a broad, complicated topic. Other limitations, however, reflect the relative under-emphasis of civics education in the United States. Consider, for example, that the first administration of the NAEP (a trial administration in 1969) measured students’ performance in three subjects—citizenship, science, and writing—yet a lack of funding and political will have made the NAEP civics assessment sporadic in its administration and, in recent years, confined to eighth grade.
We hope this report will add to a growing chorus of voices arguing that education policy and practice in the United States should place greater emphasis on schools’ role in supporting and strengthening American democracy through how it educates its students.
The 2018 Brown Center Report on American Education 3
Chapter 1. Trends in NAEP math, reading, and civics scores
The National Assessment of Educational Progress (NAEP) regularly gauges the academic achievement of nationally representative samples of students. Commonly referred to as the “Nation’s Report Card,” it has become the most prominent appraisal of the knowledge and skills of American students.
The so-called “Main NAEP” has assessed performance in mathematics and reading every two years in recent decades, with enough continuity in tested content to allow for comparisons over time in fourth-grade and eighth-grade math and reading performance.1 Tests in other subjects are administered less frequently and consistently. The civics assessment, which is particularly relevant to this report, allows for comparisons of the performance of eighth-grade students in 1998, 2006, 2010, and 2014, as well as fourth-grade students in 1998, 2006, and 2010.2
In this section, we explore trends in math, reading, and civics performance from the late 1990s through the most recent year in which results are available (2017 in math and reading, 2014 in civics). We show trends in nationwide performance and in test score gaps by race (white-black), ethnicity (white-Hispanic), and family income (based on eligibility for free or reduced-price lunch [FRL]). In doing so, we examine test score trajectories from the beginning to the end of the No Child Left Behind era (NCLB). The 2017 results, in particular, reflect a boundary in the timeline of education policy, demarcating the end of NCLB and the beginning of the Every Student Succeeds Act (ESSA).
We show that math and reading scores for grades 4 and 8 have increased over the last two decades, although the largest increases—with the exception of eighth-grade reading—occurred in the early years of NCLB. White-black
and white-Hispanic math and reading gaps have declined over this period, while gaps by FRL eligibility have remained steady. Meanwhile, the overall trend in eighth-grade civics largely mirrors the trend in eighth-grade reading: slow and modest improvements, with perhaps a slight uptick in scores in recent years. Gaps in civics scores remain alarmingly wide.
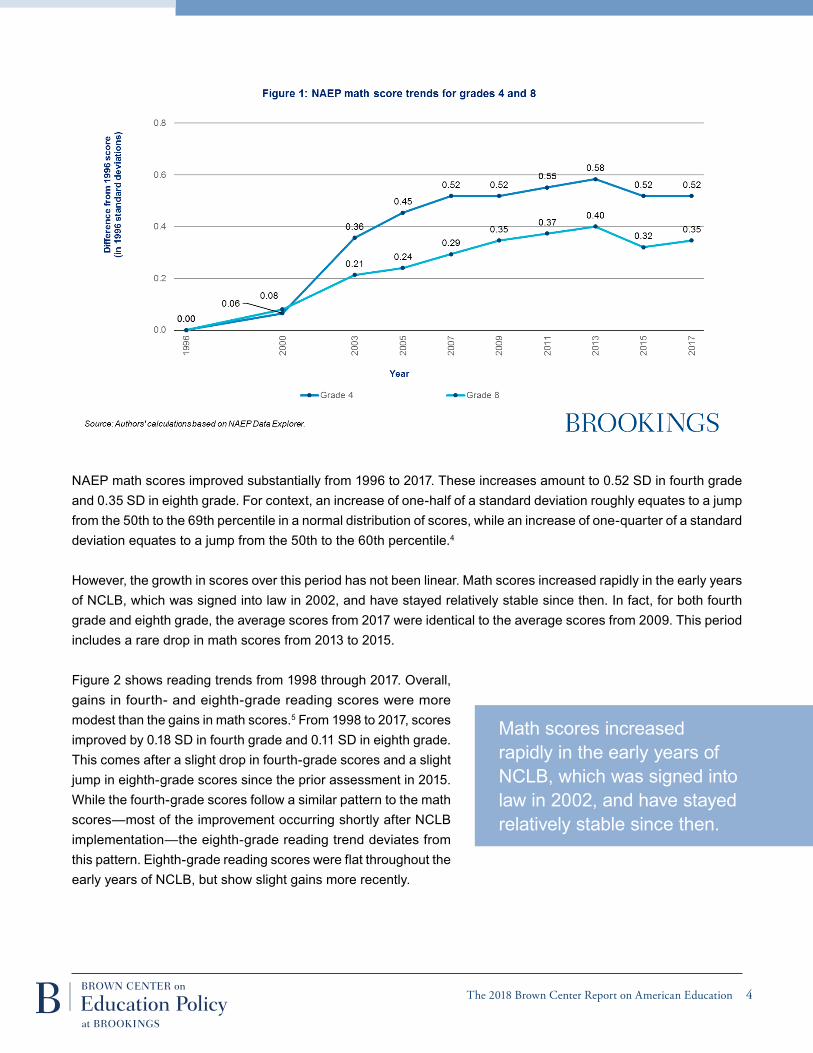
NAEP MAtH AND rEADiNG trENDsFigure 1 shows NAEP math scores for grades 4 and 8 from 1996 through 2017. To facilitate comparisons across years and subjects, we report scores in terms of score differences—in standard deviations (SD)—relative to the first year presented. All of these trend lines begin with a baseline score of 0.00 and then change according to how average scores on that assessment changed relative to the baseline year.3
Gaps in civics scores remain alarmingly wide.
The 2018 Brown Center Report on American Education 4
NAEP math scores improved substantially from 1996 to 2017. These increases amount to 0.52 SD in fourth grade and 0.35 SD in eighth grade. For context, an increase of one-half of a standard deviation roughly equates to a jump from the 50th to the 69th percentile in a normal distribution of scores, while an increase of one-quarter of a standard deviation equates to a jump from the 50th to the 60th percentile.4
However, the growth in scores over this period has not been linear. Math scores increased rapidly in the early years of NCLB, which was signed into law in 2002, and have stayed relatively stable since then. In fact, for both fourth grade and eighth grade, the average scores from 2017 were identical to the average scores from 2009. This period includes a rare drop in math scores from 2013 to 2015.
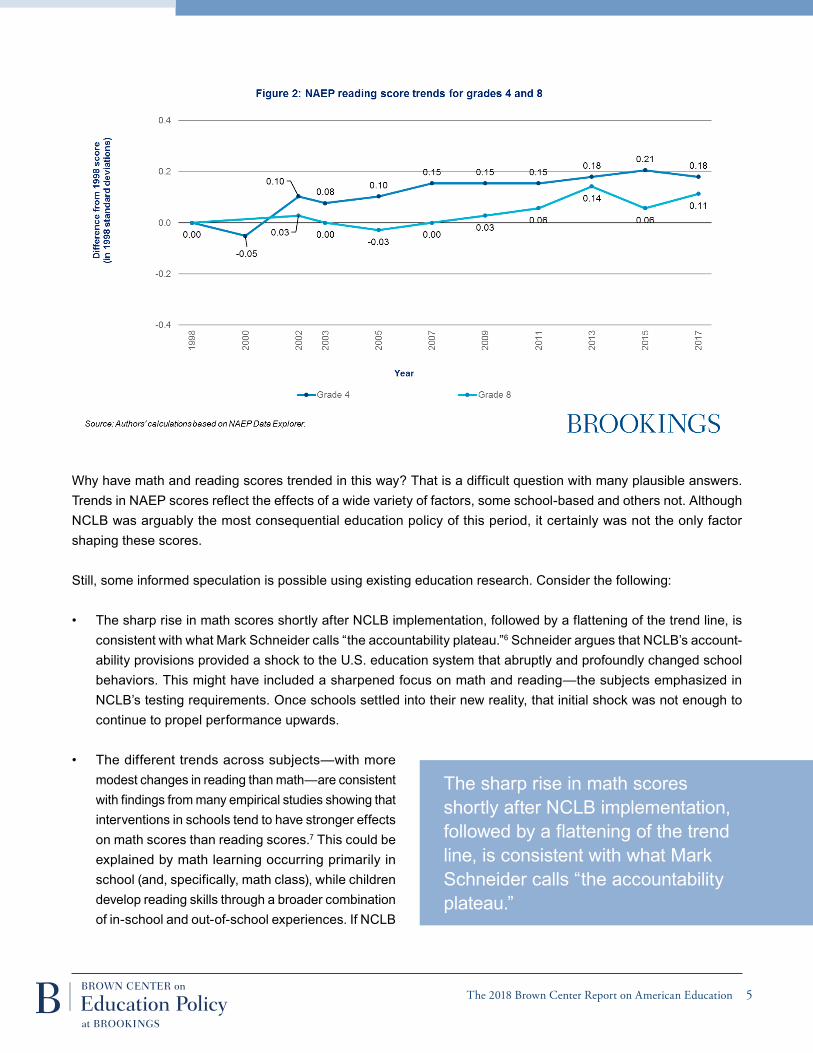
Figure 2 shows reading trends from 1998 through 2017. Overall, gains in fourth- and eighth-grade reading scores were more modest than the gains in math scores.5 From 1998 to 2017, scores improved by 0.18 SD in fourth grade and 0.11 SD in eighth grade. This comes after a slight drop in fourth-grade scores and a slight jump in eighth-grade scores since the prior assessment in 2015. While the fourth-grade scores follow a similar pattern to the math scores—most of the improvement occurring shortly after NCLB implementation—the eighth-grade reading trend deviates from this pattern. Eighth-grade reading scores were flat throughout the early years of NCLB, but show slight gains more recently.
Math scores increased rapidly in the early years of NCLB, which was signed into law in 2002, and have stayed relatively stable since then.
The 2018 Brown Center Report on American Education 5
Why have math and reading scores trended in this way? That is a difficult question with many plausible answers. Trends in NAEP scores reflect the effects of a wide variety of factors, some school-based and others not. Although NCLB was arguably the most consequential education policy of this period, it certainly was not the only factor shaping these scores.
Still, some informed speculation is possible using existing education research. Consider the following:
• The sharp rise in math scores shortly after NCLB implementation, followed by a flattening of the trend line, is consistent with what Mark Schneider calls “the accountability plateau.”6 Schneider argues that NCLB’s account-ability provisions provided a shock to the U.S. education system that abruptly and profoundly changed school behaviors. This might have included a sharpened focus on math and reading—the subjects emphasized in NCLB’s testing requirements. Once schools settled into their new reality, that initial shock was not enough to continue to propel performance upwards.
• The different trends across subjects—with more modest changes in reading than math—are consistent with findings from many empirical studies showing that interventions in schools tend to have stronger effects on math scores than reading scores.7 This could be explained by math learning occurring primarily in school (and, specifically, math class), while children develop reading skills through a broader combination of in-school and out-of-school experiences. If NCLB
The sharp rise in math scores shortly after NCLB implementation, followed by a flattening of the trend line, is consistent with what Mark Schneider calls “the accountability plateau.”
The 2018 Brown Center Report on American Education 6
affected schools’ performance, we might expect to see its effects more clearly through math score trends than reading score trends.
• The patterns in NAEP scores are also broadly consistent with patterns in school funding. A recent study examined the effects of the Great Recession of the late 2000s on student performance, finding that a 10 percent reduction in school spending caused a drop in test scores of about 0.08 SDs.8 Another study assessed school finance reforms during the “adequacy” era of the 1990s and 2000s. It found that the relative performance of low-income districts on the NAEP had climbed by about 0.1 SDs a decade after a reform.9
Of course, to reiterate, every NAEP score and trend reflects a combination of factors far too numerous and com-plicated to fully explain here.
MAtH AND rEADiNG GAPs by rAcE, EtHNicity, AND fAMiLy iNcOMEAn explicit focus of NCLB, reflected even in the name of the legislation, was to improve opportunities for historically disadvantaged groups of students. NCLB required that states disaggregate math and reading scores for specified subgroups and then sanctioned schools for failing to make “adequate yearly progress” within those subgroups. Here, we examine trends in math and reading test score gaps by race (white-black), ethnicity (white-Hispanic), and family income as measured by eligibility for FRL.
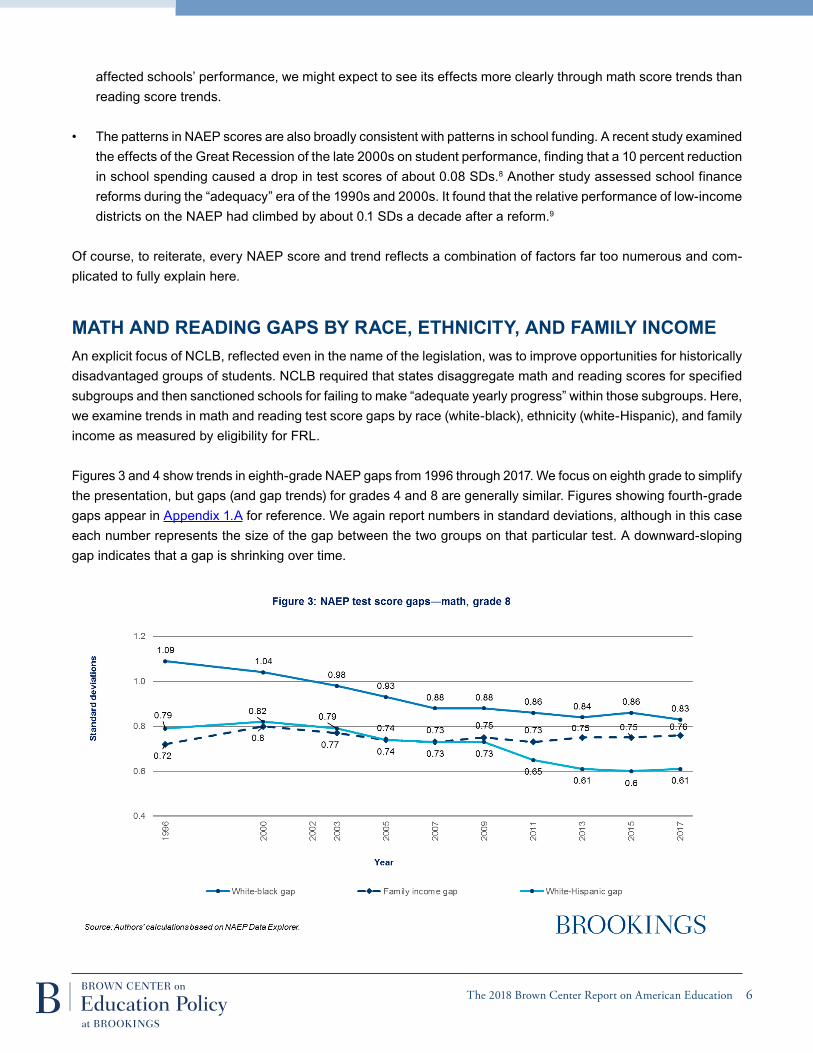
Figures 3 and 4 show trends in eighth-grade NAEP gaps from 1996 through 2017. We focus on eighth grade to simplify the presentation, but gaps (and gap trends) for grades 4 and 8 are generally similar. Figures showing fourth-grade gaps appear in Appendix 1.A for reference. We again report numbers in standard deviations, although in this case each number represents the size of the gap between the two groups on that particular test. A downward-sloping gap indicates that a gap is shrinking over time.
The 2018 Brown Center Report on American Education 7
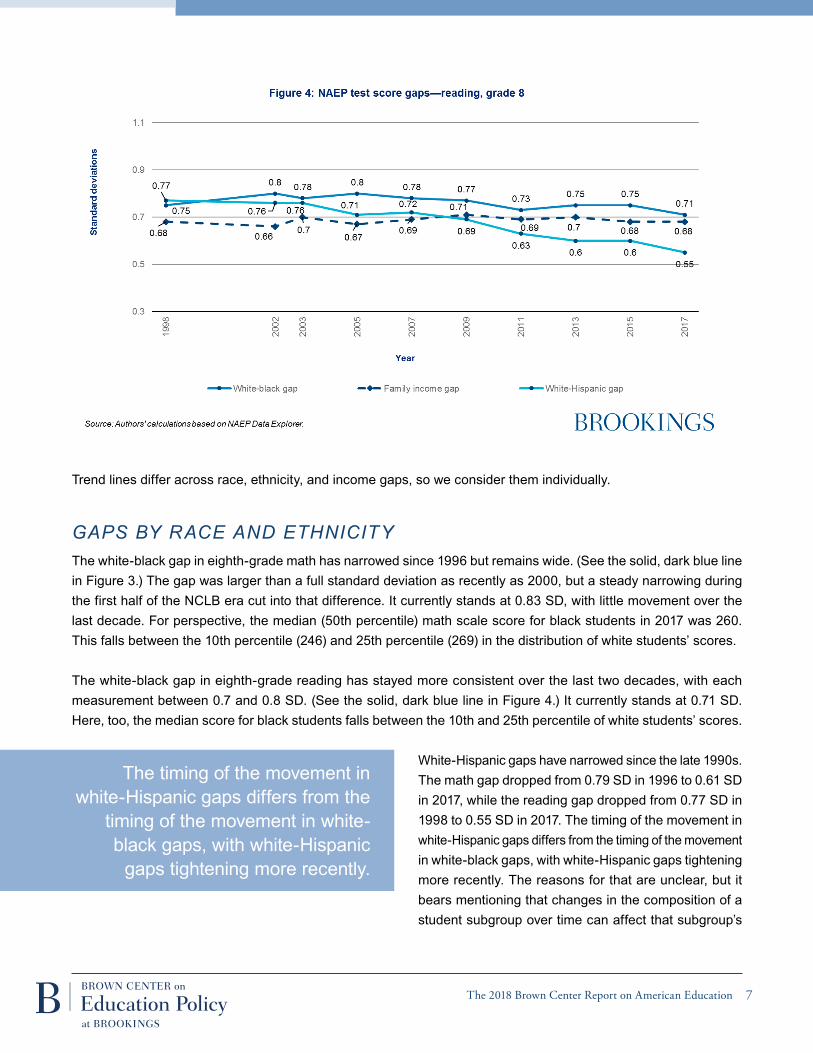
Trend lines differ across race, ethnicity, and income gaps, so we consider them individually.
Gaps by race and ethnicity The white-black gap in eighth-grade math has narrowed since 1996 but remains wide. (See the solid, dark blue line in Figure 3.) The gap was larger than a full standard deviation as recently as 2000, but a steady narrowing during the first half of the NCLB era cut into that difference. It currently stands at 0.83 SD, with little movement over the last decade. For perspective, the median (50th percentile) math scale score for black students in 2017 was 260. This falls between the 10th percentile (246) and 25th percentile (269) in the distribution of white students’ scores.
The white-black gap in eighth-grade reading has stayed more consistent over the last two decades, with each measurement between 0.7 and 0.8 SD. (See the solid, dark blue line in Figure 4.) It currently stands at 0.71 SD. Here, too, the median score for black students falls between the 10th and 25th percentile of white students’ scores.
White-Hispanic gaps have narrowed since the late 1990s. The math gap dropped from 0.79 SD in 1996 to 0.61 SD in 2017, while the reading gap dropped from 0.77 SD in 1998 to 0.55 SD in 2017. The timing of the movement in white-Hispanic gaps differs from the timing of the movement in white-black gaps, with white-Hispanic gaps tightening more recently. The reasons for that are unclear, but it bears mentioning that changes in the composition of a student subgroup over time can affect that subgroup’s
The timing of the movement in white-Hispanic gaps differs from the
timing of the movement in white-black gaps, with white-Hispanic
gaps tightening more recently.
The 2018 Brown Center Report on American Education 8
trends. The U.S. Hispanic population has changed in recent years—changes that include a drop in the share of the population born outside the U.S.10
Even with the recent narrowing of white-Hispanic NAEP gaps, these gaps remain large. The median math score for Hispanic eighth graders falls at the 25th percentile in the distribution of white students’ scores, while the median reading score falls just above the 25th percentile.
Gaps by family income
Next, we examine gaps by family income, comparing the scores of students identified as eligible for FRL and students not identified as eligible. We present these results with a caveat. During this period, Congress expanded eligibility for the federal school lunch program in two notable ways: granting eligibility to “directly certify” students who qualify for other types of public support, like the Supplemental Nutrition Assistance Program, and allowing schools with at least 40 percent of students directly certified to make all of their students eligible (including those whose family incomes exceed the threshold).11 We proceed with FRL-based trends because we believe they remain informative and familiar, but the legislative change could mean that the population of FRL-eligible students has changed over the last decade. For reference, Appendix 1.B shows trends in eighth-grade math and reading gaps over this period based on parental education.12
Looking at Figures 3 and 4, we see that income-based gaps in both subjects remained steady for eighth-grade students from the mid-1990s through 2017. The gaps between FRL-eligible and FRL-ineligible students currently stand at 0.76 SD in math and 0.68 SD in reading. These gaps, like the white-black and white-Hispanic gaps, equate to multiple years of academic learning. The median scale scores for FRL-eligible eighth graders fall between the 10th percentile and 25th percentile in the distributions of scores for FRL-ineligible students.
In recent years, researchers have studied achievement gaps by family income more closely. Sean Reardon has shown the strikingly different trends in white-black and wealthy-poor gaps (e.g., with wealthy-poor defined as the 90th versus 10th percentile in family income).13 He compares test score gaps for cohorts of U.S. students born from the 1940s through early 2000s. Early in that period, white-black gaps in math and reading were considerably larger than wealthy-poor gaps in math and reading. More recently, the reverse is true, with wealthy-poor gaps much larger than black-white gaps (and well above a full standard deviation).
The NAEP data tell a different story than Reardon’s data—but a reconcilable one. These analyses differ in notable ways. For example, our presentation of eighth-grade math and reading results from the late 1990s through 2017 considers a narrower time period, age group, and type of assessment. Critically important, too, is how the wealthier and poorer groups are defined. By comparing students in the 90th and 10th percentiles of the income distribution, Reardon provides a truer comparison of rich and poor. NAEP score trends based on free or reduced-price lunch eligibility—set at family income of 130 percent and 185 percent of the poverty threshold, respectively—compare
Test score gaps by race, ethnicity, and family income remain distressingly wide, and although racial and ethnic gaps show signs of slow improvement, little in the recent trends suggests the gaps will close in the near future.
The 2018 Brown Center Report on American Education 9
roughly the top and bottom halves of student population by family income. While this comparison is more inclusive of middle-class students, it can mask variation within groups of FRL-eligible and FRL-ineligible students. Students from deeply impoverished households may have little in common with students who narrowly qualify for FRL, while students who narrowly miss the FRL cutoff may have little in common with students from truly wealthy households.
Stepping back, this look at subgroup NAEP scores over the past two decades leaves plenty of reason for concern. Test score gaps by race, ethnicity, and family income remain distressingly wide, and although racial and ethnic gaps show signs of slow improvement, little in the recent trends suggests the gaps will close in the near future.
NAEP ciVics trENDsNCLB gave special status to math and reading assessments. It required schools to measure math and reading performance in grades 3 through 8 and once in high school, with sanctions for schools that failed to make adequate yearly progress toward 100-percent proficiency by the 2013-14 academic year. This created strong incentives for schools to emphasize math and reading. That is not necessarily a problem. After all, the logic of test-based account-ability is to give schools the incentives and flexibility to produce outcomes deemed important by policymakers.14
More attention to math and reading, however, could mean less attention to pursuing other important goals. Prior research has, in fact, found schools responding to accountability pressure by cutting instructional time in less-
emphasized subjects, including social studies. One study, using data from the national Schools and Staffing Survey, found that the weekly instructional time in history and social studies for grades 1 through 6 dropped from 3.0 hours in 1999-00 to 2.6 hours in 2003-04.15 It noted that students in states with history assessments spent more time learning history (2.9 hours per week) than students in states without these assessments (2.5 hours per
week). This is consistent with results from another study that attributed increases in the instructional time allocated to English language arts and math to NCLB.16
Whether it was a blessing or a curse for subjects like social studies to escape the direct focus of NCLB depends on one’s perspective. On one hand, this might have liberated educators from pressures to focus their instruction on state test preparation. As Daniel Koretz details in “The Testing Charade,” schools’ responses to accountability pressures often seem better aligned with maximizing test scores than with producing genuine, meaningful learning.17 On the other hand, topics like civics education could get crowded out if schools narrowed their focus—and targeted their resources—toward math and reading.
Below, we examine trends in NAEP civics scores over the NCLB era. NAEP has assessed civics less frequently and consistently than math and reading, but the results still provide useful information about trends in nationwide performance and gaps by race, ethnicity, and family income. Of course, these performance trends are likely not entirely attributable to schools, since students’ understanding of civics arises from learning that occurs both inside and outside of school.
Weekly instructional time in history and social studies for grades 1
through 6 dropped from 3.0 hours in 1999-00 to 2.6 hours in 2003-04.
The 2018 Brown Center Report on American Education 10
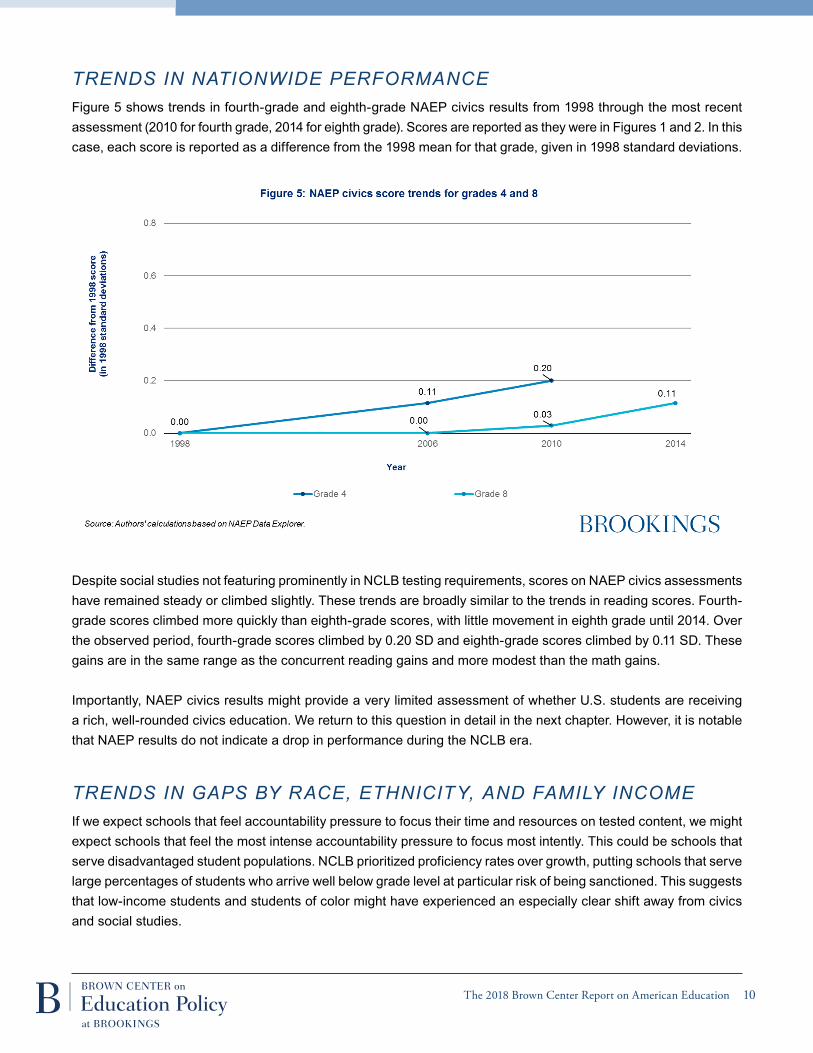
trends in nationwide performanceFigure 5 shows trends in fourth-grade and eighth-grade NAEP civics results from 1998 through the most recent assessment (2010 for fourth grade, 2014 for eighth grade). Scores are reported as they were in Figures 1 and 2. In this case, each score is reported as a difference from the 1998 mean for that grade, given in 1998 standard deviations.
Despite social studies not featuring prominently in NCLB testing requirements, scores on NAEP civics assessments have remained steady or climbed slightly. These trends are broadly similar to the trends in reading scores. Fourth-grade scores climbed more quickly than eighth-grade scores, with little movement in eighth grade until 2014. Over the observed period, fourth-grade scores climbed by 0.20 SD and eighth-grade scores climbed by 0.11 SD. These gains are in the same range as the concurrent reading gains and more modest than the math gains.
Importantly, NAEP civics results might provide a very limited assessment of whether U.S. students are receiving a rich, well-rounded civics education. We return to this question in detail in the next chapter. However, it is notable that NAEP results do not indicate a drop in performance during the NCLB era.
trends in Gaps by race, ethnicity, and family incomeIf we expect schools that feel accountability pressure to focus their time and resources on tested content, we might expect schools that feel the most intense accountability pressure to focus most intently. This could be schools that serve disadvantaged student populations. NCLB prioritized proficiency rates over growth, putting schools that serve large percentages of students who arrive well below grade level at particular risk of being sanctioned. This suggests that low-income students and students of color might have experienced an especially clear shift away from civics and social studies.
The 2018 Brown Center Report on American Education 11
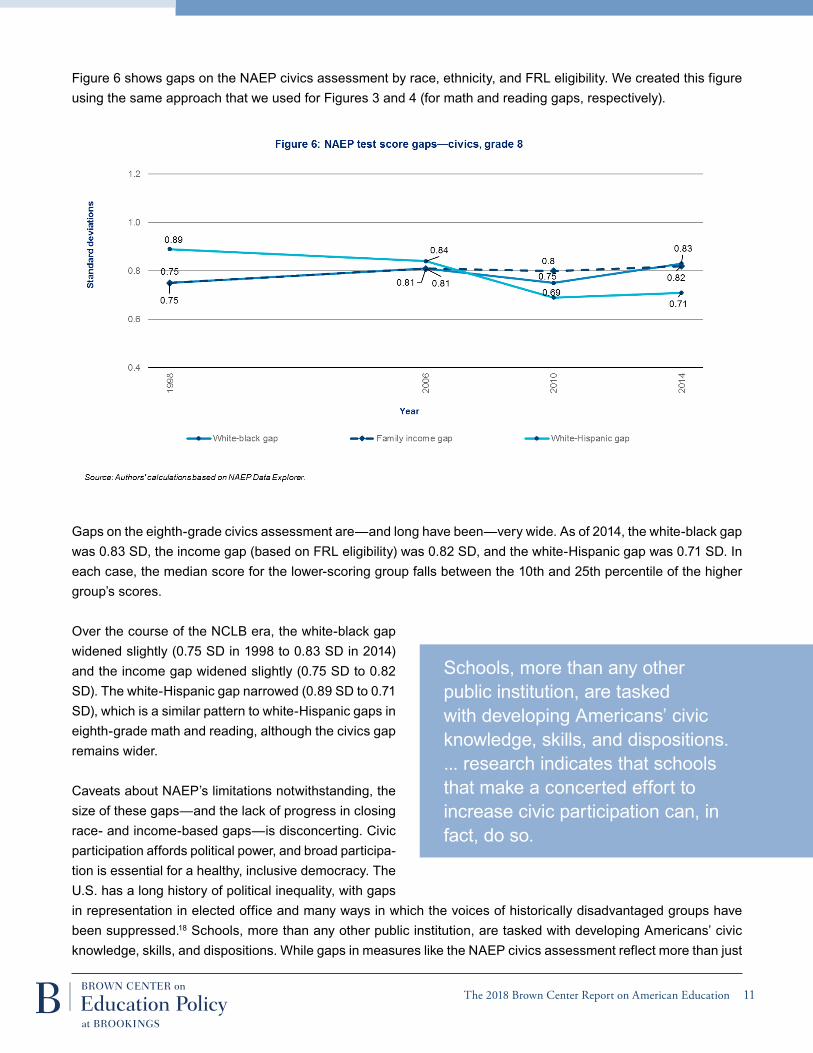
Figure 6 shows gaps on the NAEP civics assessment by race, ethnicity, and FRL eligibility. We created this figure using the same approach that we used for Figures 3 and 4 (for math and reading gaps, respectively).
Gaps on the eighth-grade civics assessment are—and long have been—very wide. As of 2014, the white-black gap was 0.83 SD, the income gap (based on FRL eligibility) was 0.82 SD, and the white-Hispanic gap was 0.71 SD. In each case, the median score for the lower-scoring group falls between the 10th and 25th percentile of the higher group’s scores.
Over the course of the NCLB era, the white-black gap widened slightly (0.75 SD in 1998 to 0.83 SD in 2014) and the income gap widened slightly (0.75 SD to 0.82 SD). The white-Hispanic gap narrowed (0.89 SD to 0.71 SD), which is a similar pattern to white-Hispanic gaps in eighth-grade math and reading, although the civics gap remains wider.
Caveats about NAEP’s limitations notwithstanding, the size of these gaps—and the lack of progress in closing race- and income-based gaps—is disconcerting. Civic participation affords political power, and broad participa-tion is essential for a healthy, inclusive democracy. The U.S. has a long history of political inequality, with gaps in representation in elected office and many ways in which the voices of historically disadvantaged groups have been suppressed.18 Schools, more than any other public institution, are tasked with developing Americans’ civic knowledge, skills, and dispositions. While gaps in measures like the NAEP civics assessment reflect more than just
Schools, more than any other public institution, are tasked with developing Americans’ civic knowledge, skills, and dispositions. ... research indicates that schools that make a concerted effort to increase civic participation can, in fact, do so.
The 2018 Brown Center Report on American Education 12
what happens at school, research indicates that schools that make a concerted effort to increase civic participation can, in fact, do so.19 Moreover, these gaps serve as a reminder that monitoring educational equity requires looking at measures beyond just math and reading scores.
cONcLUsiONSo what do the last two decades of NAEP scores tell us about the NCLB era, and what should we look for in the years to come?
Test-based accountability, the centerpiece of NCLB, has likely had profound effects on school decisionmaking. In the words of Daniel Koretz, “Walk into almost any school, and you will enter a world that revolves around testing and test scores, day after day and month after month.”20 Whether this relentless focus has been healthy is a subject of fierce debate. On one hand, NCLB accountability might have drawn schools’ attention to particularly important subject matter, strengthened their incentives to teach that subject matter well, and improved our understanding of student performance by subgroup and locale. On the other hand, it might have drawn schools’ attention away from other important responsibilities—including preparing students as citizens—and led to instructional approaches more likely to improve test scores than develop meaningful knowledge and skills.
NAEP scores can be used—or misused—to support either perspective. Math scores climbed sharply in NCLB’s early years, in part because of substantial improvements in the scores of black and Hispanic students. Since then, scores have largely plateaued at levels of nationwide performance that many Americans find underwhelming, leaving still-large gaps between historically advantaged and disadvantaged groups. It is fair to say that NCLB-style accountability is not a panacea for closing test score gaps and putting schools on a path toward rapid, sustained gains in academic performance. It is also fair
to say that this would be an unreasonable expectation.
We should reiterate that NAEP scores reflect much more than the effects of a single piece of legislation, even one as consequential as NCLB. NAEP trends over the last two decades likely reflect much more than the impacts of NCLB. Notably, though, research on the causal effects of test-based accountability also show relatively large, sudden test score gains, especially in math.21
It is also important to put NAEP scores in perspective. The education policy community now places so much emphasis on NAEP math and reading performance that many take for granted that the “Nation’s Report Card” covers a small subset of the work we ask of schools. By historical standards, U.S. education policy has been narrowly focused on student performance in core academic subjects, specifically math and reading.22 ESSA, which replaced NCLB in 2015, has the potential to change that. It provides greater flexibility to states in designing their accountability systems while requiring them to incorporate at least one indicator of “school quality or student success,” broadly defined. Still, requirements for math and reading assessments persist, and whether states will use their increased flexibility to reshape the goals they set for schools remains to be seen.
U.S. education policy has been narrowly focused on student
performance in core academic subjects, specifically math and
reading. ESSA, which replaced NCLB in 2015, has the potential to
change that.
The 2018 Brown Center Report on American Education 13
CHAPTER 1 REFERENCES
Brown, A., & Atske, S. (2016, June 28). Blacks have made gains in U.S. political leadership, but gaps
remain. Pew Research Center. Retrieved from http://www.pewresearch.org/fact-tank/2016/06/28/
blacks-have-made-gains-in-u-s-political-leadership-but-gaps-remain/.
Chingos, M. (2016). No more free lunch for education policymakers and researchers. Brookings Institution. Retrieved from
https://www.brookings.edu/wp-content/uploads/2016/06/free-and-reduced-lunch3.pdf.
Cronin, J., Kingsbury, G. G., McCall, M. S., & Bowe, B. (2005). the impact of the no child left behind act on student
achievement and growth: 2005 edition. Portland, OR: Northwest Evaluation Association.
Dee, T. S., & Jacob, B. A. (2010). The impact of No Child Left Behind on students, teachers, and schools. brookings papers
on economic activity, 2010(2), 149-207. Washington, DC: Brookings Institution.
Figlio, D., & Loeb, S. (2011). School accountability. In E. A. Hanushek, S. Machin, L. Woessmann (Eds.), handbook of the
economics of education, Vol. 3 (pp. 383-421). Netherlands: Elsevier.
Flores, A. (2017, September 18). How the U.S. Hispanic population is changing. Pew Research Center. Retrieved from http://
www.pewresearch.org/fact-tank/2017/09/18/how-the-u-s-hispanic-population-is-changing/.
Gill, B., Tilley, C., Whitesell, E., Finucane, M., Potamites, L., & Corcoran, S. (2018). the impact of democracy prep public
schools on civic participation: final report. Princeton, NJ: Mathematica Policy Research.
Hanushek, E. A., & Raymond, M. E. (2001). The confusing world of educational accountability. national tax Journal, 54(2),
365-384.
Hill, C. J., Bloom, H. S., Black, A. R., & Lipsey, M. W. (2008). Empirical benchmarks for interpreting effect sizes in research.
child development perspectives, 2(3), 172-177.
Holland, P. W. (2002). How big is big when it comes to gaps in scores? In Ad Hoc Committee on Confirming Test Results
(Eds.), Using the national assessment of educational progress to confirm state test results. Washington, DC: National
Assessment Governing Board.
Jackson, C. K., Wigger, C., & Xiong, H. (2018). Do school spending cuts matter?: Evidence from the Great Recession. NBER
Working Paper No. 24203.
Koretz, D. (2017). the testing charade: pretending to make schools better. Chicago, IL: University of Chicago Press.
Lafortune, J., Rothstein, J., & Schanzenbach, D. W. (2018). School finance reform and the distribution of student achieve-
ment. american economic Journal: applied economics, 10(2), 1-26.
Loveless, T. (2006). the 2006 brown center report on american education: how well are american students learning?
Washington, DC: Brookings Institution.
The 2018 Brown Center Report on American Education 14
Reardon, S. F. (2011). The widening academic achievement gap between the rich and the poor: New evidence and possible
explanations. In G. J. Duncan & R. J. Murnane (Eds.), whither opportunity? rising inequality and the uncertain life chances
of low-income children. New York, NY: Russell Sage Foundation Press.
Rothstein, R., Jacobsen, R., & Wilder, T. (2008). Grading education: Getting accountability right. Washington, DC: Economic
Policy Institute; New York, NY: Teachers College Press.
Schneider, M. (2011). the accountability plateau. Washington, DC: Thomas B. Fordham Institute.
West, M. (2007). Testing, learning, and teaching: The effects of test-based accountability on student achievement and
instructional time in core academic subjects. In C. E. Finn, Jr. & D. Ravitch (Eds.), beyond the basics: achieving a liberal edu-
cation for all children (pp. 45-62). Washington, DC: Thomas B. Fordham Institute.
CHAPTER 1 ENDNOTES1 The Main NAEP also assesses students in grade 12, but a change in the mathematics framework in 2005 prevents these
scores from being comparable across years before and after that change. For details, see https://nces.ed.gov/nationsreport-
card/about/ltt_main_diff.aspx.
2 The 2018 NAEP civics assessment has been administered, but results are not yet available. Both the 2014 and 2018
assessments were restricted to students in grade 8, after earlier assessments included students in grades 4 and 12 as well.
3 To illustrate, we calculate that the average 2017 math scores were 0.52 SD higher for fourth-grade students than they
were in 1996. We took the average scale score in 2017 (240), subtracted the average scale score in 1996 (224), and then
divided the difference by the standard deviation of the 1996 scores (31).
4 It is also possible to interpret these gains in terms of typical year-to-year student learning. Researchers have proposed
a number of ways of doing so. One rule of thumb is that typical yearly growth from fourth through eighth grade amounts to
about 11 to 12 NAEP points per year (Holland, 2002; Loveless, 2006). Hill, Bloom, Black, and Lipsey (2008) focus on the dif-
ferences in typical gains across grades and subjects. They report that math scores tend to increase by 0.56 SD from grades
4 to 5 and 0.22 SD from grades 8 to 9, while reading scores tend to increase by 0.40 SD from grades 4 to 5 and 0.24 SD from
grades 8 to 9.
5 Changes in scores for reading and civics are reported in 1998 standard deviation units. We calculated change over time
by subtracting the average score in 1998 from a particular year’s score and dividing by the 1998 standard deviation.
6 Schneider (2011).
7 See Cronin, Kingsbury, McCall, & Bowe (2005) for discussion.
8 Jackson, Wigger, & Xiong (2018).
9 Lafortune, Rothstein & Schanzenbach (2018).
The 2018 Brown Center Report on American Education 15
10 Flores (2017).
11 Chingos (2016).
12 NCES defines parental education as the highest level achieved by either of the student’s parents, based on student
responses to two background questions.
13 Reardon (2011).
14 Hanushek & Raymond (2001).
15 West (2007).
16 Dee & Jacob (2010).
17 Koretz (2017).
18 Brown & Atske (2016).
19 Gill, Tilley, Whitesell, Finucane, Potamites, & Corcoran (2018).
20 Koretz (2017), p. 21.
21 Figlio & Loeb (2011).
22 Rothstein, Jacobsen, & Wilder (2008).
The 2018 Brown Center Report on American Education 16
Chapter 2. An inventory of state civics requirements
States adopt standards and coursework requirements to define what knowledge and skills their schools are respon-sible for teaching students. These state policies, when well designed, can facilitate high-quality instructional practice across the state. In the context of rising concerns over civics education, then, an important question is whether state academic requirements incorporate core components of a rigorous civics education.
In this chapter, we examine the extent to which states have incorporated recommended practices into requirements for civics education. In addition, we examine survey data to investigate whether student experiences reflect these practices. We find that while discussion and knowledge-building components of civics education appear common across states, participatory elements and community engagement appear less common.
WHAt cONstitUtEs A HiGH-QUALity ciVics EDUcAtiON?As with almost any attempt to identify a set of “best” practices in education, we find different perspectives from different experts, with a research base too thin to offer unambiguous guidance. In this context, we turn to what appears to be as close as we could reasonably expect to a consensus view from experts—the Six Proven Practices for Effective Civic Learning framework. Motivating this framework is a notion that teaching students facts about U.S. government is a goal, but not the exclusive goal, of civics education. The ultimate aim is a more comprehensive and interactive understanding of civics. Specifically, the framework proposes three key components:1
1. Civic knowledge: an understanding of government structure, government processes, and relevant social studies knowledge and concepts
2. Civic skills: abilities that enable students to participate in a democracy as responsible citizens; and
3. Civic dispositions: attitudes important in a democracy such as a sense of civic duty and concern for the welfare of others
Together, these components of civics education equip individuals to participate in our democratic system. The “proven practices” framework originally identified six practices thought to be critical to a high-quality civics education. In recent years, several experts—some of whom contributed to the framework—have proposed four additions to the original set of practices. We adopt the full set of 10 “proven practices” (PPs) as our model for a high-quality civics education, aware that research on this topic is ongoing and incomplete. Appendix 2.A provides details on the history of this framework, as well as the process that led us to adopt it for the analyses that follow.
In the context of rising concerns over civics education, an important question is whether state academic
requirements incorporate core components of a rigorous civics
education.
The 2018 Brown Center Report on American Education 17
The original six PPs, as described in the “Guardian of Democracy” report, are listed below as numbers one through six. A report from a 2017 convening, “The Republic is (Still) at Risk,” adds four practices to the original six, which we number seven through 10:2
1. Classroom instruction in civics, government, history, law, economics, and geography
2. Discussion of current events
3. Service learning3
4. Extracurricular activities
5. Student participation in school governance
6. Simulations of democratic processes and procedures
7. News media literacy4
8. Action civics
9. Social-emotional learning (SEL)
10. School climate reform
Notably, these 10 practices include dimensions of education that occur both inside and outside of the classroom. Two of the original PPs, extracurricular activities and participation in school governance (four and five, respectively), focus on activities that take place at school but outside of formal classroom instruction. Two of the four new practices, SEL and school climate reform (nine and 10, respectively), focus on promoting a healthy, safe school environ-ment that fosters learning and respectful engagement with peers.
A clear message from this framework is that building a knowledge base is necessary but insufficient to equip students to participate in democratic society. Or, put differently, interactive and participatory components of a civics education are not optional, supplemental, or “extra” aspects of civics education that are nice to have. Rather, interactive and participatory practices are core components of a high-quality civics education.
A 50-stAtE iNVENtOryTo what extent do state accountability frameworks incorporate these components? To answer this question, we examine the content of documents that form the basis of state accountability frameworks: high school course requirements for graduation, state social studies standards (K-12), and curriculum frameworks.5 (We use the label
Interactive and participatory practices are core components of a high-quality civics education.
The 2018 Brown Center Report on American Education 18
“accountability frameworks” in a general sense rather than in reference to specific accountability policies mandated under the No Child Left Behind Act (NCLB) and the Every Student Succeeds Act (ESSA).)
A caveat is in order here. This analysis is limited to the documents mentioned above. It does not include other policies and practices that could affect what students learn and do at school, but which are difficult to collect for this type of study. Instead, we focus on what we believe is the backbone of accountability frameworks at the state level—required courses, standards, and curriculum.
Along similar lines, these documents ideally would contain rich information related to each of the 10 PPs. However, certain PPs are unlikely to appear in this context, since these accountability frameworks generally provide state-level expectations for classroom instruction. For example, state policies seldom define details of schools’ extracurricular offerings. We omit from this analysis the practices that typically fall outside the scope of the documents we examine: extracurricular activities, participation in student governance, SEL, and school climate reform. We also omit action civics (but include service learning, a related but different practice).6 Ultimately, this 50-state inventory assesses the following practices in each state: classroom instruction (PP 1), discussion of current events (PP 2), service learning (PP 3), simulations of democratic processes and procedures (PP 6), and news media literacy (PP 7).
With a systematic review of documents for each state, we build on previous analyses of the state policy landscape in civics education. Earlier reports have provided examples of how states implement the PPs, offering recommenda-tions for how to improve civics education.7 Others have catalogued state-level policies using their own definitions of a high-quality civics education.8 Still others have summarized components of state accountability frameworks, such as whether state testing in civics is required and whether a state has a framework for civics or social studies.9 We take a new approach by analyzing the extent to which states have adopted particular components of the PPs.
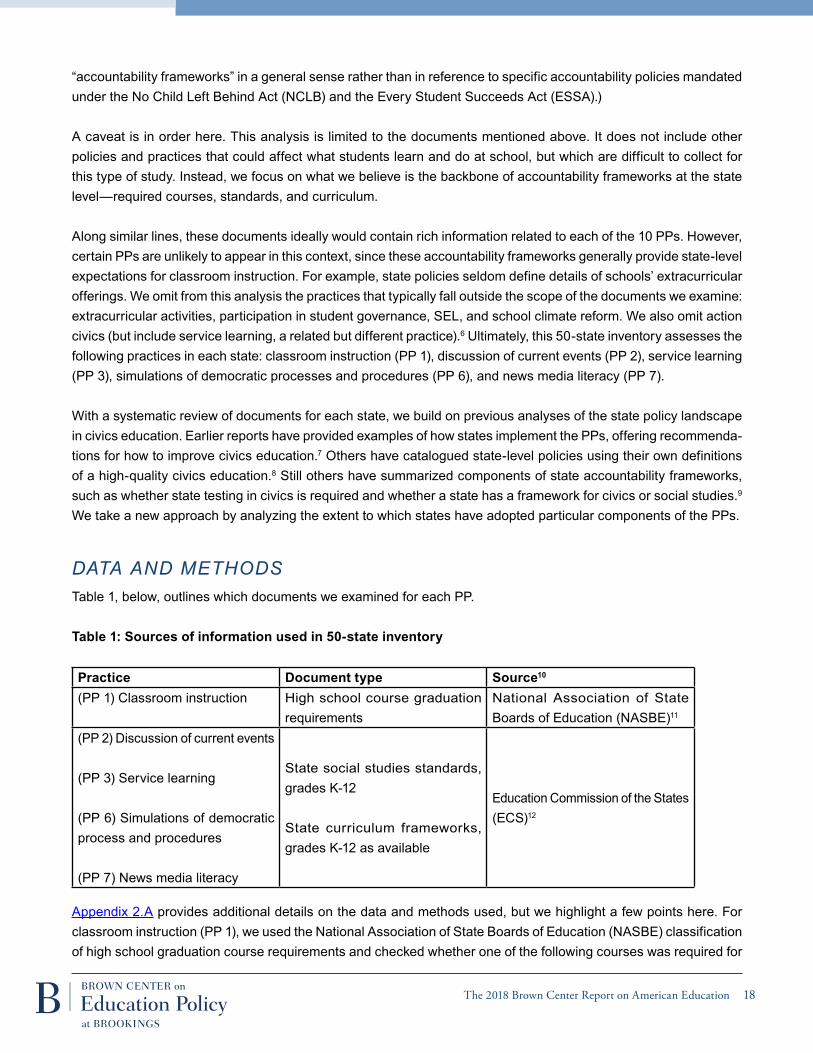
data and methodsTable 1, below, outlines which documents we examined for each PP.
table 1: sources of information used in 50-state inventory
Practice Document type source10
(PP 1) Classroom instruction High school course graduation requirements
National Association of State Boards of Education (NASBE)11
(PP 2) Discussion of current events
(PP 3) Service learning
(PP 6) Simulations of democratic process and procedures
(PP 7) News media literacy
State social studies standards, grades K-12
State curriculum frameworks, grades K-12 as available
Education Commission of the States (ECS)12
Appendix 2.A provides additional details on the data and methods used, but we highlight a few points here. For classroom instruction (PP 1), we used the National Association of State Boards of Education (NASBE) classification of high school graduation course requirements and checked whether one of the following courses was required for
The 2018 Brown Center Report on American Education 19
students to graduate from high school: civics, U.S. history, government, law, democracy, economics, geography, or a combination course that incorporated one or more of these subjects.13 For the other PPs listed in Table 1, we used a keyword search to identify whether state standards or curriculum frameworks discussed relevant aspects of each of these practices. For example, for discussion of current events, we searched whether state standards and curriculum frameworks (if available) mentioned discussion of current events or issues at the local, state, national, and/or global level.14
the colleGe, career, and civic life (c3) framework for social stUdies state standardsWe recognize that some states might have adopted rigorous civics standards in ways that escaped our view because their language does not align with the language of the PPs. This could be true, for example, of states that have used the College, Career, and Civic Life (C3) Framework for Social Studies State Standards in designing their standards or curricula.15 Published by the National Council for the Social Studies and designed through the collaboration of fifteen professional organizations the C3 framework provides resources to help states revise their standards for civics and social studies. Similar to the PPs, the C3 framework emphasizes both knowledge acquisition and active participation in civic life.16
While similar in their approaches to defining a high-quality civics education, the C3 framework is a different type of resource than the PPs. The PPs encourage incorpora-tion of certain practices into civics education, while the C3 framework is a guide to revising state standards. In our state inventory, we consider whether states have used the C3 framework in designing their standards and curriculum frameworks (along with considering the PPs). Doing so allows for a more complete picture of whether and how states have taken steps to align their social studies accountability frameworks with recommended practices.
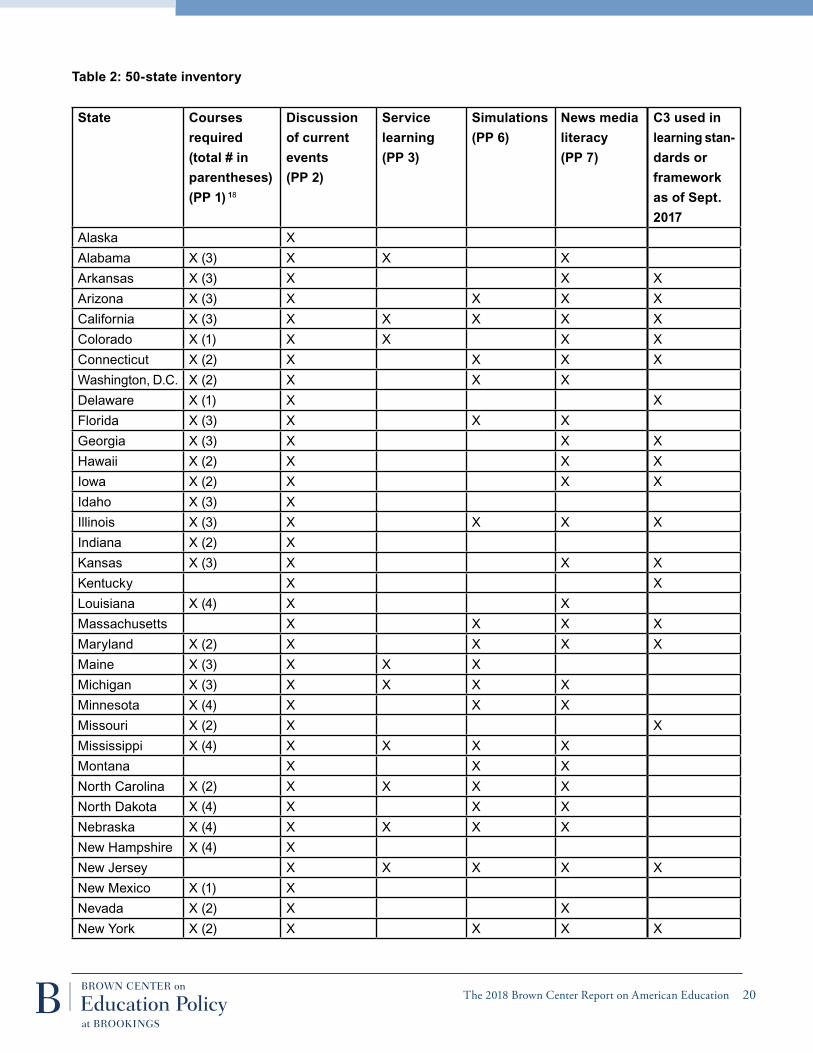
findinGsTable 2, on the next page, provides findings from the inventory. It suggests that some—but certainly not all—PPs are widespread throughout the country. In addition, about half of the states have used or are planning to use the C3 framework.17
With respect to classroom instruction, 42 states and
Washington, D.C. require at least one course related to civics
education. Most states require two or three of these types of courses
for high school graduation.
The 2018 Brown Center Report on American Education 20
table 2: 50-state inventory
state courses required (total # in parentheses)(PP 1) 18
Discussion of current events (PP 2)
service learning (PP 3)
simulations (PP 6)
News media literacy (PP 7)
c3 used in learning stan-dards or framework as of sept. 2017
Alaska XAlabama X (3) X X XArkansas X (3) X X XArizona X (3) X X X XCalifornia X (3) X X X X XColorado X (1) X X X XConnecticut X (2) X X X XWashington, D.C. X (2) X X XDelaware X (1) X XFlorida X (3) X X XGeorgia X (3) X X XHawaii X (2) X X XIowa X (2) X X XIdaho X (3) XIllinois X (3) X X X XIndiana X (2) XKansas X (3) X X XKentucky X XLouisiana X (4) X XMassachusetts X X X XMaryland X (2) X X X XMaine X (3) X X XMichigan X (3) X X X XMinnesota X (4) X X XMissouri X (2) X XMississippi X (4) X X X XMontana X X XNorth Carolina X (2) X X X XNorth Dakota X (4) X X XNebraska X (4) X X X XNew Hampshire X (4) XNew Jersey X X X X XNew Mexico X (1) XNevada X (2) X XNew York X (2) X X X X
The 2018 Brown Center Report on American Education 21
state courses required (total # in parentheses)(PP 1)
Discussion of current events (PP 2)
service learning (PP 3)
simulations (PP 6)
News media literacy (PP 7)
c3 used in learning stan-dards or framework as of sept. 2017
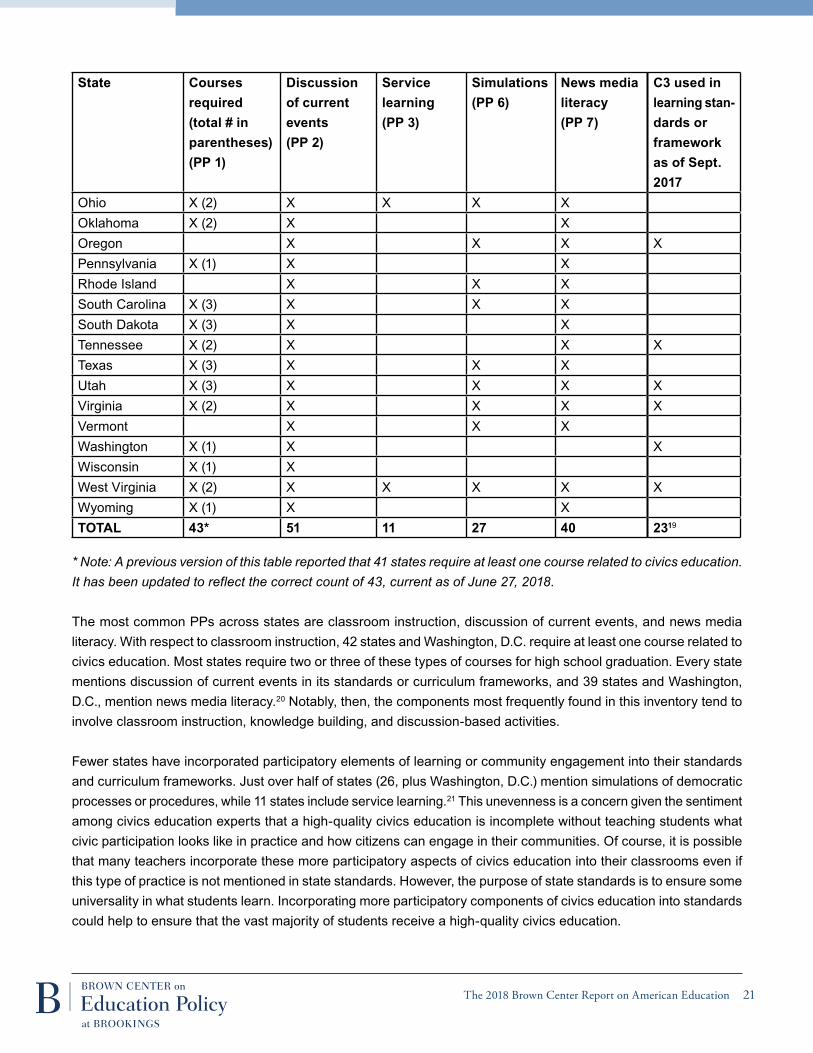
Ohio X (2) X X X XOklahoma X (2) X XOregon X X X XPennsylvania X (1) X XRhode Island X X XSouth Carolina X (3) X X XSouth Dakota X (3) X XTennessee X (2) X X XTexas X (3) X X XUtah X (3) X X X XVirginia X (2) X X X XVermont X X XWashington X (1) X XWisconsin X (1) XWest Virginia X (2) X X X X XWyoming X (1) X XtOtAL 43* 51 11 27 40 2319
* note: a previous version of this table reported that 41 states require at least one course related to civics education. it has been updated to reflect the correct count of 43, current as of June 27, 2018.
The most common PPs across states are classroom instruction, discussion of current events, and news media literacy. With respect to classroom instruction, 42 states and Washington, D.C. require at least one course related to civics education. Most states require two or three of these types of courses for high school graduation. Every state mentions discussion of current events in its standards or curriculum frameworks, and 39 states and Washington, D.C., mention news media literacy.20 Notably, then, the components most frequently found in this inventory tend to involve classroom instruction, knowledge building, and discussion-based activities.
Fewer states have incorporated participatory elements of learning or community engagement into their standards and curriculum frameworks. Just over half of states (26, plus Washington, D.C.) mention simulations of democratic processes or procedures, while 11 states include service learning.21 This unevenness is a concern given the sentiment among civics education experts that a high-quality civics education is incomplete without teaching students what civic participation looks like in practice and how citizens can engage in their communities. Of course, it is possible that many teachers incorporate these more participatory aspects of civics education into their classrooms even if this type of practice is not mentioned in state standards. However, the purpose of state standards is to ensure some universality in what students learn. Incorporating more participatory components of civics education into standards could help to ensure that the vast majority of students receive a high-quality civics education.
The 2018 Brown Center Report on American Education 22
Turning to the C3 framework, we see that 23 states have used this framework in developing their learning standards and/or frameworks.22 It is possible, then, that the majority of states have either aligned their standards with the PPs or used the C3 framework to revise their standards and/or curricula. If so, the picture becomes a bit rosier. Table 2 suggests that, indeed, some states that are less aligned with the PPs have used the C3 framework. For example, four states mention two or fewer of the PPs examined here, but they have used (or are planning to use) the C3 framework. On the other hand, even considering align-ment with either the PPs or the C3 framework, there is incomplete coverage across states. Six states have adopted two or fewer of the PPs examined here and have not used the C3 framework. While many states mention simulations of democratic processes, 13 states neither mention simulations of democratic processes nor appear to use the C3 framework.
Across states, we see modest alignment with the PPs examined here and the C3 framework. All states address at least one of these PPs in their civics accountability frameworks. Further, 22 states have adopted at least two of these PPs and have used (or are planning to use) the C3 framework as well. The most room for improvement lies in the incorporation of participatory and community engagement elements into state standards. This gap suggests that, overall, policy lags behind the widely held view that these aspects of a civics education are essential.
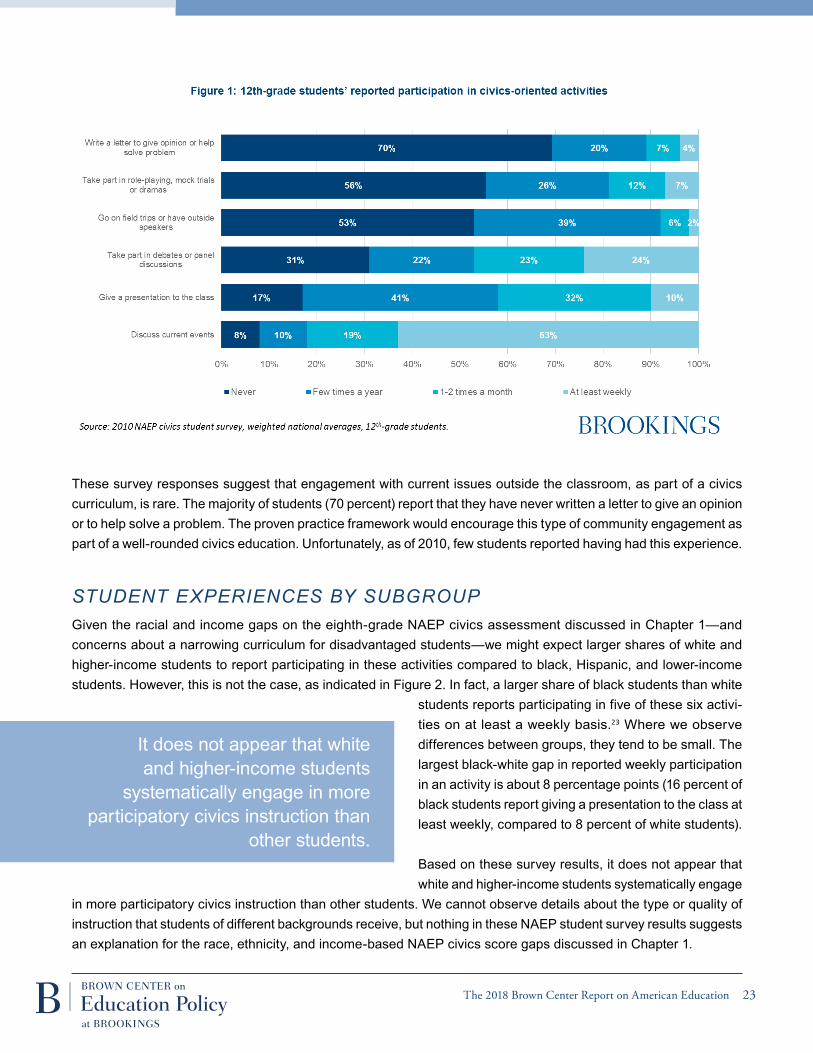
stUDENt ExPEriENcEs iN ciVics EDUcAtiONIn addition to this analysis of state policy, we examine which types of activities students report engaging in during their civics coursework. Similar to the policy inventory, students’ self-reported experiences reflect an emphasis on in-class, discussion-based civics education. Using data from the nationally representative 2010 National Assessment of Educational Progress (NAEP) student survey on civics education, Figure 1 illustrates that discussion of current events occurs regularly. Over half of 12th-grade students (63 percent) report discussing current events on at least a weekly basis. In contrast, about a quarter of students (24 percent) report taking part in debates or panel discussions on a weekly basis, while almost a third (31 percent) report never participating in this type of activity. Over half of students (56 percent) report never taking part in role-playing, mock trials, or dramas. While it might not be desirable for students to stage mock trials on a daily basis, these survey results suggest that many students never have an opportunity to participate in simulations of democratic procedures.
Just over half of states (26, plus Washington, D.C.) mention simulations of democratic processes or procedures, while 11 states include service learning. This ... is a concern given the sentiment among civics education experts that a high-quality civics education is incomplete without teaching students what civic participation looks like in practice.
The 2018 Brown Center Report on American Education 23
These survey responses suggest that engagement with current issues outside the classroom, as part of a civics curriculum, is rare. The majority of students (70 percent) report that they have never written a letter to give an opinion or to help solve a problem. The proven practice framework would encourage this type of community engagement as part of a well-rounded civics education. Unfortunately, as of 2010, few students reported having had this experience.
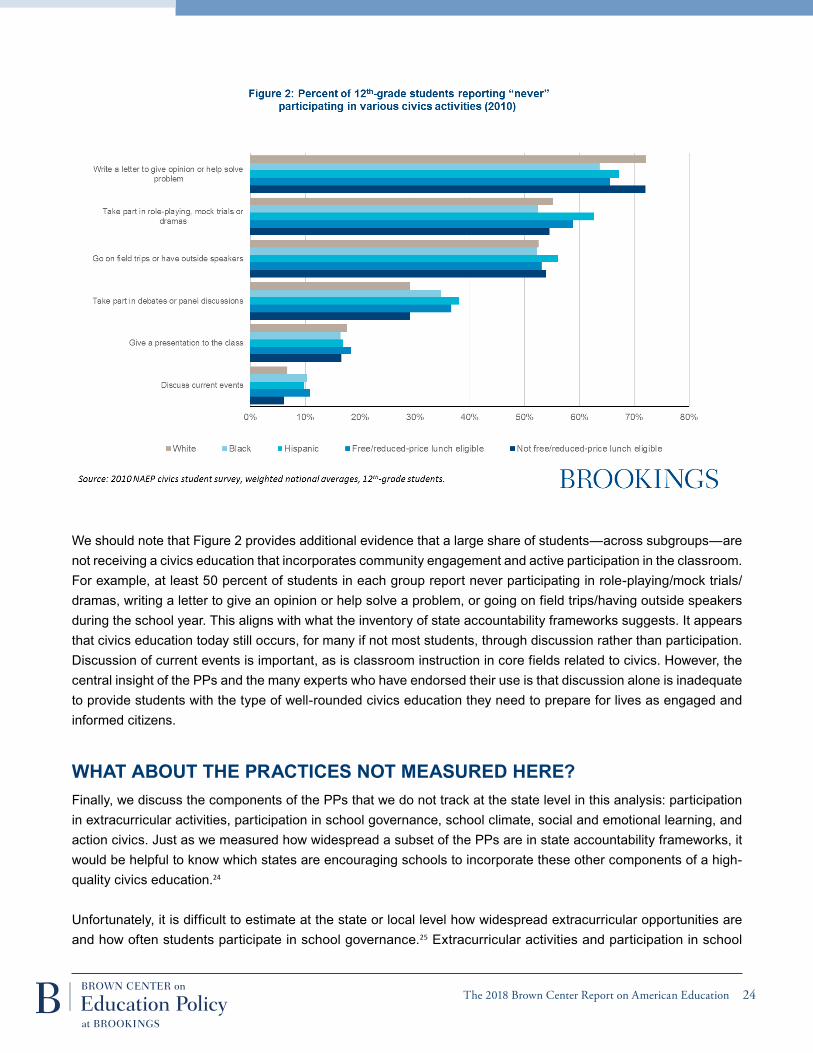
stUdent experiences by sUbGroUpGiven the racial and income gaps on the eighth-grade NAEP civics assessment discussed in Chapter 1—and concerns about a narrowing curriculum for disadvantaged students—we might expect larger shares of white and higher-income students to report participating in these activities compared to black, Hispanic, and lower-income students. However, this is not the case, as indicated in Figure 2. In fact, a larger share of black students than white
students reports participating in five of these six activi-ties on at least a weekly basis.23 Where we observe differences between groups, they tend to be small. The largest black-white gap in reported weekly participation in an activity is about 8 percentage points (16 percent of black students report giving a presentation to the class at least weekly, compared to 8 percent of white students).
Based on these survey results, it does not appear that white and higher-income students systematically engage
in more participatory civics instruction than other students. We cannot observe details about the type or quality of instruction that students of different backgrounds receive, but nothing in these NAEP student survey results suggests an explanation for the race, ethnicity, and income-based NAEP civics score gaps discussed in Chapter 1.
It does not appear that white and higher-income students
systematically engage in more participatory civics instruction than
other students.
The 2018 Brown Center Report on American Education 24
We should note that Figure 2 provides additional evidence that a large share of students—across subgroups—are not receiving a civics education that incorporates community engagement and active participation in the classroom. For example, at least 50 percent of students in each group report never participating in role-playing/mock trials/dramas, writing a letter to give an opinion or help solve a problem, or going on field trips/having outside speakers during the school year. This aligns with what the inventory of state accountability frameworks suggests. It appears that civics education today still occurs, for many if not most students, through discussion rather than participation. Discussion of current events is important, as is classroom instruction in core fields related to civics. However, the central insight of the PPs and the many experts who have endorsed their use is that discussion alone is inadequate to provide students with the type of well-rounded civics education they need to prepare for lives as engaged and informed citizens.
WHAt AbOUt tHE PrActicEs NOt MEAsUrED HErE?Finally, we discuss the components of the PPs that we do not track at the state level in this analysis: participation in extracurricular activities, participation in school governance, school climate, social and emotional learning, and action civics. Just as we measured how widespread a subset of the PPs are in state accountability frameworks, it would be helpful to know which states are encouraging schools to incorporate these other components of a high-quality civics education.24
Unfortunately, it is difficult to estimate at the state or local level how widespread extracurricular opportunities are and how often students participate in school governance.25 Extracurricular activities and participation in school
The 2018 Brown Center Report on American Education 25
governance are not typically incorporated in state accountability frameworks. As such, the availability and quality of these activities may vary widely. Devoting more resources to measuring the quality of civics education would help us understand whether and where there are gaps in access to these activities. A modest step forward would be to include questions about participation in extracurricular activities and school governance in the NAEP civics student survey and to provide state-level data on the civics survey questions.
With respect to school climate and SEL, some states are taking advantage of a new opportunity to incorporate these dimensions of student learning into their account-ability frameworks. Unlike during the NCLB era when accountability systems focused exclusively on student achievement, under ESSA states must include an indicator of School Quality and Student Success (SQSS) in their accountability systems. States have broad latitude in
choosing this indicator and may opt to measure non-academic aspects of their students’ education. By incorporating school climate and SEL into their SQSS measure, states could increase the focus on improving these aspects of students’ education.
There is room to grow in terms of state policy that prioritizes these areas. For example, as of 2017, all 50 states included SEL standards for preschool, although only four states had SEL standards for grades K-12.26 State plans for the new accountability frameworks under ESSA suggest that at least some states are incorporating these dimen-sions of student learning via the SQSS indicator. The following list indicates how states have incorporated SEL and school climate in their ESSA plans thus far through the SQSS indicator:
• Measure of school climate: Iowa, Idaho, Illinois, Maryland, Montana, New Mexico, North Dakota, and South Carolina27
• Rates of school discipline: California, Ohio, Rhode Island, Tennessee, and West Virginia28
• “Whole child” approaches: Washington, D.C. and Kentucky
Finally, action civics is one of the practices that experts have recommended adding to the original Six Proven Practices.29 Action civics refers to civics education that teaches students to participate in their communities and act as citizens, in contrast to traditional classroom instruction.30 While it is difficult to measure the extent to which these practices have been adopted across the country, we see signs that this approach is gaining momentum, through the work of groups such as the National Action Civics Collaborative.
iMPLicAtiONs So what can we learn from this analysis? A seeming consensus among civics education experts has taken shape in recent years, reflected in the “proven practices” and C3 frameworks: High-quality civics education includes a solid foundation of knowledge, discussion of relevant issues, interactive learning, and participation in the community. The inventory here suggests that state policy reflects, at least in part, components of these frameworks. At the same time,
Civics education today still occurs, for many if not most students,
through discussion rather than participation.
The 2018 Brown Center Report on American Education 26
in terms of both state policy and student experiences, civics instruction is still more likely to incorporate traditional, discussion-based instruction than interactive activities or community engagement.
Nonetheless, we find reason to be optimistic. An expanding coalition of researchers and practitioners continues to create resources to help educators teach students how to participate in their communities, in the political process, and in the civic life of the United States. State policy, including subject-area course requirements, standards, and curriculum frameworks, can be an important lever in delivering high-quality civics education to all students. Though adoption of the practices discussed here is not universal, state education leaders across the country have incorporated interactive practices and community engagement into their accountability frameworks. This progress suggests that through continued revisions and updates in state policy, we may gradually see widespread adoption of the practices that experts recommend. Some practices, like participation in extracurricular activities and school climate reform, may not lend themselves to adoption in state standards or curriculum frameworks. In this case, states
may turn to other types of policy levers, like grants, or new components of the accountability system, like the SQSS indicator, to incentivize districts to focus on these components of civics education.
While the transition from NCLB to ESSA granted states more flexibility in designing their accountability systems, measures of student achievement and school perfor-mance are, in large part, still tethered to performance on math and English language arts assessments. Still, this transition period between the NCLB and ESSA eras has provided state leaders with an opportunity to consider how to deliver high-quality education to all students. With respect to civics education, for many states, a crucial next step will be to incorporate recommended practices
in their high school graduation course requirements, standards, and/or curriculum frameworks. This is not the only important step—others might include addressing pre-service training, professional development, and the resources available to support civics education—but it is a critical one to ensure that schools are helping to instill the knowl-edge, skills, and dispositions necessary for active, successful civic participation.
State education leaders across the country have incorporated action-based, participatory components
into their accountability frameworks. This progress suggests that through
continued revisions and updates in state policy, we may gradually see widespread adoption of the
practices that experts recommend.
The 2018 Brown Center Report on American Education 27
CHAPTER 2 REFERENCES
Baumann, P. & Brennan, J. (2017). State Civic Education Policy: Framework and gap analysis tool. Education Commission of
the States.
Brennan, J. & Railey, H. (2017). Education Trends. Education Commission of the States.
California Campaign for the Civic Mission of Schools. (2005). The California Survey of Civic Education.
Civic Education Policies: State standards include civics or citizenship education. (2016). Education Commission of the States,
50-State Comparison. http://ecs.force.com/mbdata/MBQuest2RTANW?Rep=CIP1602S.
Civic Education Policies: Curriculum frameworks include civics or citizenship education. (2016). Education Commission of the
States, 50-State Comparison. http://ecs.force.com/mbdata/MBQuest2RTANW?Rep=CIP1603S.
Cohen, J., McCabe, L., Michelli, N. M., & Pickeral, T. (2009). School climate: Research, policy, practice, and teacher educa-
tion. teachers college record, 111(1), 180-213.
Approved ESSA Plans: Explainer and Key Takeaways From Each State. (2018). Education Week. https://www.edweek.org/ew/
section/multimedia/key-takeaways-state-essa-plans.html.
Jones, S. & Doolittle, E. (2017). Social and emotional learning: Introducing the Issue in Social and Emotional Learning, Vol. 27
No. 1. http://www.wallacefoundation.org/knowledge-center/Documents/FOC-Spring-Vol27-No1-Compiled-Future-of-Children-
spring-2017.pdf.
Gingold, J. (2013). Building an evidence-based practice of action civics: The current state of assessments and recommenda-
tion for the future. circle working paper, No. 78.
Godsay, S., Henderson, W., Levine, P., & Littenberg-Tobias, J. (2012). State Civic Education Requirements. The Center for
Information & Research on Civic Learning & Engagement.
Guardian of Democracy: The Civic Mission of Schools. (2011). Ed. Jonathan Gould. The Leonore Annenberg Institute for Civ-
ics of the Annenberg Public Policy Center at the University of Pennsylvania and the Campaign for the Civic Mission of Schools.
Guilfoile, L. & Delander, B. (2014). Guidebook: Six Proven Practices for Effective Civic Learning. Education Commission of the
States and National Center for Learning and Civic Engagement.
Levine, P. & Kawashima-Ginsberg, K. (2017). The Republic is (Still) at Risk—and Civics is Part of the Solution. Jonathan M.
Tisch College of Civic Life, Tufts University.
National Association of State Boards of Education (NASBE). (2018). State Policy Database: Graduation Requirements. http://
statepolicies.nasbe.org/college-careers/categories/graduation-requirements.
The 2018 Brown Center Report on American Education 28
National Action Civics Collaborative. (n.d.). http://actioncivicscollaborative.org/about-us/mission/.
National Council for the Social Studies. (n.d.). College, Career, and Civic Life (C3) Framework for Social Studies State Stan-
dards. https://www.socialstudies.org/C3.
National Youth Leadership Council. (2008). K-12 Service Learning Standards for Quality Practice.
Osher, D., Kidron, Y., Brackett, M., Dymnicki, A., Jones, S., & Weissberg, R. (2016). Advancing the Science and Practice of
Social and Emotional Learning: Looking Back and Moving Forward. review of research in education 40: 644–81.
Shapiro, S. & Brown, C. (2018). The State of Civics Education. Center for American Progress. https://www.americanprogress.
org/issues/education-k-12/reports/2018/02/21/446857/state-civics-education/.
Stanford History Education Group. (2016). Evaluating Information: The Cornerstone of Civic Online Reasoning. https://stacks.
stanford.edu/file/druid:fv751yt5934/SHEG%20Evaluating%20Information%20Online.pdf.
U.S. Department of Education. (2018). ESSA State Plan Submission. https://www2.ed.gov/admins/lead/account/stateplan17/
statesubmission.html.
Whitehouse, E., Baumann, P., & Brennan, J. (2017). State Civic Education Toolkit. The Council of State Governments and
Education Commission of the States.
The 2018 Brown Center Report on American Education 29
CHAPTER 2 ENDNOTES1 Guardian of Democracy: The Civic Mission of Schools (2011).
2 Levine and Kawashima-Ginsberg (2017).
3 According to “Guardian of Democracy” (2011), service learning is “an instructional methodology that makes intentional
links between the academic curriculum and student work that benefits the community by providing meaningful opportunities
for students to apply what they learn to issues that matter to them” (p. 29).
4 This practice refers to teaching students to identify sources of bias in the news and, more recently, refers to identifying
“fake” news, particularly online. See Appendix 2.A for details on coding this practice.
5 See Appendix 2.A for discussion of why we focus on these types of documents. We do not analyze the content of state
assessments here. While state assessments are a component of accountability frameworks, we focus on the type of instruc-
tion that states require in civics education rather than on the specific content knowledge assessed on state exams. For a
discussion of state civics assessments, see Brennan and Railey (2017).
6 Action civics builds on the service learning approach through curricula that incorporate civic engagement and participation
in students’ communities. We discuss action civics in more detail later in this chapter.
7 Whitehouse, Baumann & Brennan (2017).
8 Shapiro & Brown (2018).
9 “The Republic is (Still) at Risk” (2017).
10 The Education Commission of the States maintains an extensive database of state policies related to standards, cur-
riculum, and course requirements, and the National Association of State Boards of Education similarly maintains a database
of high school graduation requirements, including those for social studies and civics.
11 We used the NASBE classification of high school courses and graduation requirements. See http://statepolicies.nasbe.
org/college-careers/categories/graduation-requirements.
12 For one state, New Mexico, the link to state standards via ECS did not direct us to the standards. As a result, we identi-
fied the state’s social studies standards through a Google search.
13 We identified these courses based on the courses listed in the “Guardian of Democracy” report that discussed in depth
the Six Proven Practices.
14 Please see Appendix 2.A for a full description of the methodology, coding protocol, and search terms.
15 For these data, we rely on Appendix A in the report “The Republic is (Still) at Risk.”
16 See https://www.socialstudies.org/C3.
The 2018 Brown Center Report on American Education 30
17 Mentioning a practice in standards or a curriculum framework does not imply that the practice is required. It may be a
recommended or encouraged practice.
18 Two states, Louisiana and Mississippi, have different course requirements depending on which of two tracks a student is
on. Here, we included the highest number of courses required by the state between the two tracks. Louisiana also offers a
track with three instead of four courses, and Mississippi offers a track with two instead of four courses.
19 As of September 2017, five of these states were still in the process of incorporating C3 into their standards (Arizona,
Colorado, Massachusetts, Oregon, and Washington).
20 Notably, including a practice in state standards does not necessarily mean that schools are doing an adequate job of
preparing students with respect to that particular practice. Although 40 states mention news media literacy, research from
the Stanford History Education Group finds that “young people’s ability to reason about the information on the Internet can
be summed up in one word: bleak” (p. 4). The assessment used in this research contained items that gauged, for example,
whether students could distinguish between advertisements and news stories. In light of this research, although many states
require students to be proficient in news media literacy, it appears that online news media literacy is far from where it should
be.
21 We used a strict definition of service learning. Based on the National Young Leaders Conference K-12 Service Learning
Standards (2008), we distinguish between “service learning” and service projects or community service. States that mention
participation in a service project or activity but do not mention how this service is included in the curriculum or do not require
or encourage participation in service learning specifically are not marked as incorporating service learning in Table 2. In
addition to the states with an “X” for service learning in Table 2, we identified nine states (Alaska, Arizona, Connecticut,
Florida, Montana, New Mexico, Rhode Island, Utah, and Vermont) that mention some type of service activity, community
service, or similar phrase in their standards or curriculum frameworks. Using a broader definition of service learning, then,
the tally of states that mention this PP rises to 20. This is consistent with the findings in the CIRCLE Fact Sheet on State
Civic Education Requirements, which identifies 20 states with “standards related to service-learning” (p. 9). Even by this
more inclusive measure, it is still the case that fewer than half of states have incorporated service learning into their stan-
dards. Some states may have a service learning requirement that is not mentioned in their standards. For example, the state
of Maryland includes a service learning requirement in its public high school graduation requirements.
22 As of September 2017, five of these states were still in the process of incorporating C3 into their standards (Arizona,
Colorado, Massachusetts, Oregon, and Washington).
23 A larger share of Hispanic students report participating in three of the six activities at least weekly compared to white
students. Further, a larger share of free or reduced-priced lunch-eligible students reports at least weekly participation in four
of the six activities compared to non-eligible students.
24 For a discussion of evidence that suggests participation in extracurricular activities and school governance improves
student outcomes and political participation, please see “Guardian of Democracy.” For a review of research on social and
emotional learning, please see David Osher et al. (2016). For a discussion of the research on school climate, please see
Cohen et al. (2009).
The 2018 Brown Center Report on American Education 31
25 The NAEP civics student surveys do not include questions about participation in extracurricular activities. However, the
National Education Longitudinal Studies conducted by the National Center for Education Statistics do. In addition, states
have surveyed their student populations about participation in extracurricular activities (see “The California Survey of Civic
Education”). However, school-level data, by state, on extracurricular offerings is unavailable as far as we know.
26 Jones & Doolittle (2017).
27 This discussion of ESSA plans is based on the author’s analysis of approved plans summarized by Education Week and
submitted plans and peer reviews published online by the Department of Education.
28 California’s plan has not yet been approved.
29 See this discussion in Levine & Kawashima-Ginsberg (2017).
30 Gingold (2013).
The 2018 Brown Center Report on American Education 32
Chapter 3. Understanding the social studies teacher workforce
One of the clearest results emerging from the past decade of education research is that teachers are centrally impor-tant in promoting student learning. However, much of the research evidence available on teachers either focuses on teachers of high-demand subjects (like math or science) or looks at broader trends among all teachers; few studies focus on social studies teachers in particular. As a result, we know comparatively little about those who are responsible for teaching civics to the next generation of young citizens and how they may differ from other educators.
We need a better understanding of the social studies teacher workforce in America’s public schools. Teachers are undisputedly part of the solution in helping to close the stagnant achievement gaps for civics documented in Chapter 1, with primary responsibility for teaching the state civics standards and frameworks described in Chapter 2. In this chapter, we synthesize existing research and analyze nationally representative survey data on sec-ondary social studies teachers to investigate whether this segment of the teacher workforce differs from teachers in other subjects—and whether differences exist across states and schools. We conclude with a discussion of policy implications.
AccOUNtAbiLity POLiciEs AffEctiNG sOciAL stUDiEs tEAcHErsSocial studies is largely absent from federal education law and policy. Both the Every Student Succeeds Act (ESSA) and its predecessor, the No Child Left Behind Act (NCLB), mandated regular testing and state accountability systems to monitor student performance in math, reading or English language arts (ELA), and, at less frequent intervals, science. Civics and the broader portfolio of social studies, on the other hand, received relatively little attention in these federal laws, limited primarily to special programs for preparing teachers under Title II. Seen through the lens of accountability policy, civics and related social sciences have become second-tier academic subjects.
As best we can tell, this lower status has affected social studies teaching. In one nationally representative survey, 44 percent of school districts reported reductions in instructional time on non-tested subjects in elementary grades, including social studies, in the years following the implementation of NCLB.1 Evidence suggests that this type of “crowding out” may be greatest among low-performing schools that tend to serve high proportions of disadvantaged students, and thus face especially strong accountability pressure.2 Moreover, with less classroom time available, teachers report focusing more on facts and history narratives and less on activities like debate or simulation exer-cises3 that are more likely to align with some of the Proven Practices described in Chapter 2.
We need a better understanding of the social studies teacher workforce
in America’s public schools. We know comparatively little
about those who are responsible for teaching civics to the next
generation of young citizens and how they may differ from other
educators.
The 2018 Brown Center Report on American Education 33
cOMPAriNG stUDiEs tEAcHErs tO tEAcHErs iN OtHEr sUbJEct ArEAsTo depict social studies teachers’ characteristics and qualifications compared to those of teachers in other subjects, we draw on the National Teacher and Principal Survey (NTPS), a nationally representative survey of teachers that was administered by the National Center for Education Statistics in the 2015-16 school year.4 Our sample includes all respondents who report their primary role is a subject-specialized teacher in secondary grades (grades 7-12) in any of the four following categories: social sciences (hereafter referred to as social studies), ELA, mathematics, and natural sciences.5
We focus on teacher characteristics in five categories:
• Demographics: age, race/ethnicity, and gender
• Qualifications: years of teaching experience, average SAT scores of undergraduate institution, entry into the profession outside of a traditional university-based teacher training program, and alignment between teacher’s undergraduate studies, teaching certificate, and subject specialty6
• Responsibilities: total number of students taught, course load, share of assigned courses outside of the teacher’s primary specialty, involvement in extracurricular student activities, and involvement in extra school duties7
• Compensation: salary, supplemental pay from the school (e.g., for bonuses or leading extracurricular activities), total reported weekly hours on school-related activities, and whether holding a second job8
• Satisfaction: responses to questions about teachers’ satisfaction in school and intended length of stay in the classroom
These characteristics provide insights into who is teaching and what they do in schools. Table 1, on the next page, reports descriptive statistics of teachers’ attributes across each of these five categories separately by their area of subject specialty.
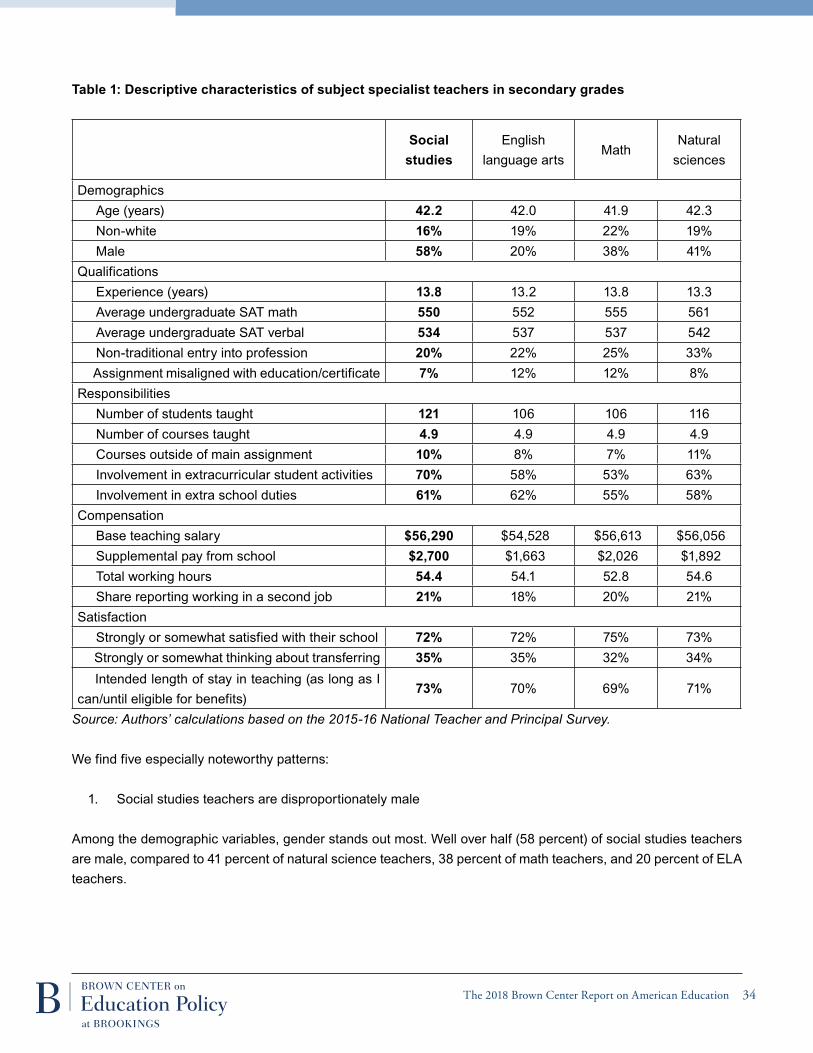
The 2018 Brown Center Report on American Education 34
table 1: Descriptive characteristics of subject specialist teachers in secondary grades
social studies
English language arts
MathNatural
sciences
Demographics Age (years) 42.2 42.0 41.9 42.3 Non-white 16% 19% 22% 19% Male 58% 20% 38% 41%Qualifications Experience (years) 13.8 13.2 13.8 13.3 Average undergraduate SAT math 550 552 555 561 Average undergraduate SAT verbal 534 537 537 542 Non-traditional entry into profession 20% 22% 25% 33% Assignment misaligned with education/certificate 7% 12% 12% 8%Responsibilities Number of students taught 121 106 106 116 Number of courses taught 4.9 4.9 4.9 4.9 Courses outside of main assignment 10% 8% 7% 11% Involvement in extracurricular student activities 70% 58% 53% 63% Involvement in extra school duties 61% 62% 55% 58%Compensation Base teaching salary $56,290 $54,528 $56,613 $56,056 Supplemental pay from school $2,700 $1,663 $2,026 $1,892 Total working hours 54.4 54.1 52.8 54.6 Share reporting working in a second job 21% 18% 20% 21%Satisfaction Strongly or somewhat satisfied with their school 72% 72% 75% 73% Strongly or somewhat thinking about transferring 35% 35% 32% 34% Intended length of stay in teaching (as long as I can/until eligible for benefits)
73% 70% 69% 71%
source: authors’ calculations based on the 2015-16 national teacher and principal survey.
We find five especially noteworthy patterns:
1. Social studies teachers are disproportionately male
Among the demographic variables, gender stands out most. Well over half (58 percent) of social studies teachers are male, compared to 41 percent of natural science teachers, 38 percent of math teachers, and 20 percent of ELA teachers.
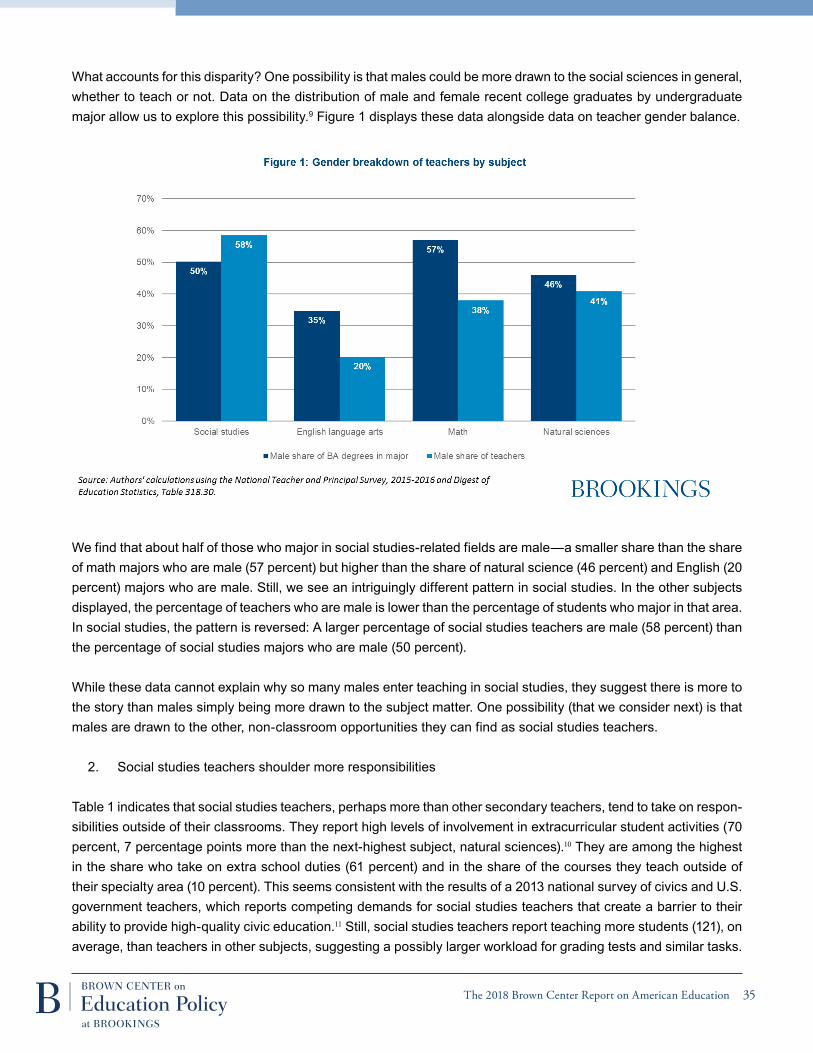
The 2018 Brown Center Report on American Education 35
What accounts for this disparity? One possibility is that males could be more drawn to the social sciences in general, whether to teach or not. Data on the distribution of male and female recent college graduates by undergraduate major allow us to explore this possibility.9 Figure 1 displays these data alongside data on teacher gender balance.
We find that about half of those who major in social studies-related fields are male—a smaller share than the share of math majors who are male (57 percent) but higher than the share of natural science (46 percent) and English (20 percent) majors who are male. Still, we see an intriguingly different pattern in social studies. In the other subjects displayed, the percentage of teachers who are male is lower than the percentage of students who major in that area. In social studies, the pattern is reversed: A larger percentage of social studies teachers are male (58 percent) than the percentage of social studies majors who are male (50 percent).
While these data cannot explain why so many males enter teaching in social studies, they suggest there is more to the story than males simply being more drawn to the subject matter. One possibility (that we consider next) is that males are drawn to the other, non-classroom opportunities they can find as social studies teachers.
2. Social studies teachers shoulder more responsibilities
Table 1 indicates that social studies teachers, perhaps more than other secondary teachers, tend to take on respon-sibilities outside of their classrooms. They report high levels of involvement in extracurricular student activities (70 percent, 7 percentage points more than the next-highest subject, natural sciences).10 They are among the highest in the share who take on extra school duties (61 percent) and in the share of the courses they teach outside of their specialty area (10 percent). This seems consistent with the results of a 2013 national survey of civics and U.S. government teachers, which reports competing demands for social studies teachers that create a barrier to their ability to provide high-quality civic education.11 Still, social studies teachers report teaching more students (121), on average, than teachers in other subjects, suggesting a possibly larger workload for grading tests and similar tasks.
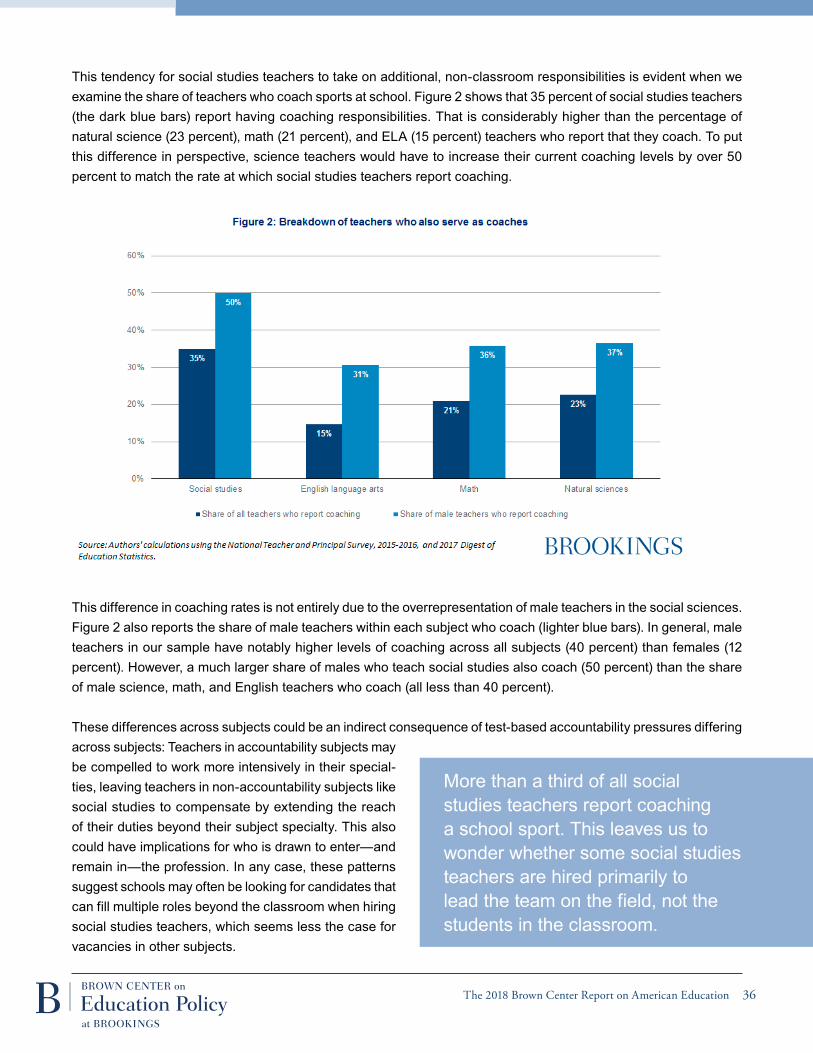
The 2018 Brown Center Report on American Education 36
This tendency for social studies teachers to take on additional, non-classroom responsibilities is evident when we examine the share of teachers who coach sports at school. Figure 2 shows that 35 percent of social studies teachers (the dark blue bars) report having coaching responsibilities. That is considerably higher than the percentage of natural science (23 percent), math (21 percent), and ELA (15 percent) teachers who report that they coach. To put this difference in perspective, science teachers would have to increase their current coaching levels by over 50 percent to match the rate at which social studies teachers report coaching.
This difference in coaching rates is not entirely due to the overrepresentation of male teachers in the social sciences. Figure 2 also reports the share of male teachers within each subject who coach (lighter blue bars). In general, male teachers in our sample have notably higher levels of coaching across all subjects (40 percent) than females (12 percent). However, a much larger share of males who teach social studies also coach (50 percent) than the share of male science, math, and English teachers who coach (all less than 40 percent).
These differences across subjects could be an indirect consequence of test-based accountability pressures differing across subjects: Teachers in accountability subjects may be compelled to work more intensively in their special-ties, leaving teachers in non-accountability subjects like social studies to compensate by extending the reach of their duties beyond their subject specialty. This also could have implications for who is drawn to enter—and remain in—the profession. In any case, these patterns suggest schools may often be looking for candidates that can fill multiple roles beyond the classroom when hiring social studies teachers, which seems less the case for vacancies in other subjects.
More than a third of all social studies teachers report coaching a school sport. This leaves us to wonder whether some social studies teachers are hired primarily to lead the team on the field, not the students in the classroom.
The 2018 Brown Center Report on American Education 37
3. Social studies teachers make more money
Interestingly, social studies teachers’ total annual earnings from school ($58,990) are slightly higher than the earnings of other subject specialists. Although base teaching salaries are roughly the same across subjects (as we expect, given the proliferation of set salary schedules), average reported earnings from other school-funded supplements is significantly higher among social studies teachers. These differences in wages do not appear to reflect different levels of overall effort, as teachers in all subjects report similar numbers of total weekly working hours (around 53 to 55 hours). We also observe social studies teachers taking on second jobs outside of school at similar rates as teachers in other subjects (around 20 percent).
So what explains these higher earnings? The disproportionately male share of teachers in social studies could point to an explanation involving unequal pay to males and females. Although the gender wage gap among teachers is relatively small in comparison to many other professions,12 it could manifest in a variety of ways, including differential
pay by subject or extracurricular activities. The results in Table 1 (page 34) suggest extracurricular pay, and specifically pay for coaching merits a closer look.
In our sample, 86 percent of teachers who report coaching a school sport say they receive supplemental income for extracurricular activities at the school.13 The average amount among those reporting any supplemental pay is $4,516. Male and female coaches are similar in their rates of reporting any extra compensation (87 percent and 84 percent, respectively), although the average extra com-pensation male coaches report ($5,168) is significantly larger than the extra pay to female coaches ($3,157).
What accounts for this difference is unclear from our data, but disparities also appear in how much males and females report being paid for non-coaching extracurricular activities. We examined teachers who report being involved in any extracurricular activity except for coaching. Among this group of teachers, 53 percent report any supplemental income, with similar rates for males and females. Yet, there is still a gender wage difference in the value of their extra pay: Males report supplemental pay of $2,764, while females report supplemental pay of $2,021.
In short, social studies teachers report slightly higher total earnings from school than teachers in other subjects. This may seem counterintuitive in the context of conversations about paying teachers more in hard-to-staff subjects. Supplemental pay for coaching sports could explain part of that difference, with social studies teachers being particularly likely to coach. Gender-based differences in compensation for extracurricular activities warrant further exploration.
4. Social studies teachers are more traditionally certified
Social studies teachers also differ from their peers in how they were trained prior to entering the classroom—and the alignment with what they currently teach. They have relatively low rates of non-traditional entry into the profes-sion (20 percent)14 and low levels of misalignment between their assignments and preparation (7 percent).15 The
Social studies teachers’ total annual earnings from school are slightly higher than the earnings of other subject specialists. The disproportionately male share of teachers in social studies could
point to an explanation involving unequal pay to males and females.
The 2018 Brown Center Report on American Education 38
SAT measures, which lag several points behind all other subjects, indicate that social studies teachers come from marginally less competitive undergraduate institutions than other teachers.
Although these differences suggest a pattern—that social studies teachers are more likely to be traditionally certified and less likely to come from alternative entry programs like Teach for America (known for recruiting students from selective undergraduate institutions)—we should note that these teacher qualifications are not strongly predictive of classroom performance.16 The patterns do suggest less reliance on alternative entry routes to fill social studies vacancies. Data on teacher vacancies tell a similar story: According to a recent study, roughly 5 percent of schools nationwide reported difficult-to-fill vacancies in social studies or ELA during the 2012-13 school year, compared to more than 20 percent of schools reporting difficult-to-fill vacancies in math or science.17
Research has shown that teachers who enter the profession through traditional training programs tend to stay in the classroom longer.18 The results in Table 1 (page 34) are consistent with this finding. Social studies teachers, who are more likely to come from a traditional training program, are slightly more likely to say that they plan to remain in the profession until retirement or as long as they are able (73 percent, compared to 69-71 percent of teachers in other subjects). However, this does not reflect greater reported satisfaction with their schools.
5. Still, social studies teachers are similar to other teachers in many ways
Although the prior points highlight differences between social studies teachers and teachers in other subjects, we should note that social studies teachers are similar with other teachers on a number of important dimensions. These dimensions include teachers’ age and experience levels, course load, working hours, satisfaction with their school, and intentions to transfer in the near future. In each case, social studies teachers in secondary grades appear similar to math, science, and ELA teachers in secondary grades. Moreover, even in some areas where we observe differ-ences across subjects (in qualifications and compensation variables, for example), these differences are smaller than the differences observed among teachers within the same subject area.
In other words, although analyzing the ways in which social studies teachers are unlike their peers can illuminate ways in which students’ experiences in social studies are unlike their experiences in other subjects, we caution against overstating those differences.
DiffErENcEs iN sOciAL stUDiEs tEAcHErs AcrOss scHOOLs AND stAtEs
differences across schoolsThe discussion above examines population-level differences across subject specializations—social studies versus other subjects. Other differences could exist across types of schools or states. Next, we explore for these differences. We categorize schools based on poverty levels (taking the top and bottom 25 percent of schools based on the share of students eligible for free or reduced-price lunch), share of students of color (taking the top and bottom 25 percent of schools based on the share of black and Hispanic students), and locale (urban, suburban, town, or rural setting). We then inspect for differences in social studies teachers’ qualifications and responsibilities across these contexts.
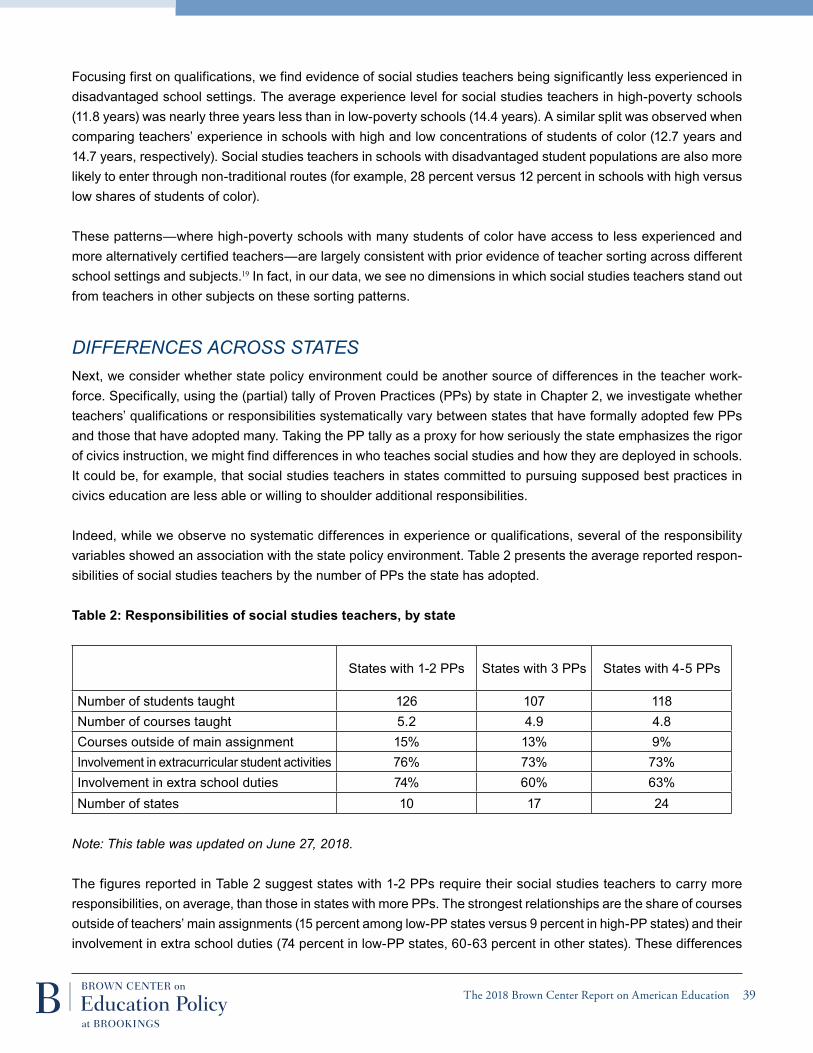
The 2018 Brown Center Report on American Education 39
Focusing first on qualifications, we find evidence of social studies teachers being significantly less experienced in disadvantaged school settings. The average experience level for social studies teachers in high-poverty schools (11.8 years) was nearly three years less than in low-poverty schools (14.4 years). A similar split was observed when comparing teachers’ experience in schools with high and low concentrations of students of color (12.7 years and 14.7 years, respectively). Social studies teachers in schools with disadvantaged student populations are also more likely to enter through non-traditional routes (for example, 28 percent versus 12 percent in schools with high versus low shares of students of color).
These patterns—where high-poverty schools with many students of color have access to less experienced and more alternatively certified teachers—are largely consistent with prior evidence of teacher sorting across different school settings and subjects.19 In fact, in our data, we see no dimensions in which social studies teachers stand out from teachers in other subjects on these sorting patterns.
differences across statesNext, we consider whether state policy environment could be another source of differences in the teacher work-force. Specifically, using the (partial) tally of Proven Practices (PPs) by state in Chapter 2, we investigate whether teachers’ qualifications or responsibilities systematically vary between states that have formally adopted few PPs and those that have adopted many. Taking the PP tally as a proxy for how seriously the state emphasizes the rigor of civics instruction, we might find differences in who teaches social studies and how they are deployed in schools. It could be, for example, that social studies teachers in states committed to pursuing supposed best practices in civics education are less able or willing to shoulder additional responsibilities.
Indeed, while we observe no systematic differences in experience or qualifications, several of the responsibility variables showed an association with the state policy environment. Table 2 presents the average reported respon-sibilities of social studies teachers by the number of PPs the state has adopted.
table 2: responsibilities of social studies teachers, by state
States with 1-2 PPs States with 3 PPs States with 4-5 PPs
Number of students taught 126 107 118Number of courses taught 5.2 4.9 4.8Courses outside of main assignment 15% 13% 9%Involvement in extracurricular student activities 76% 73% 73%Involvement in extra school duties 74% 60% 63%Number of states 10 17 24
note: this table was updated on June 27, 2018.
The figures reported in Table 2 suggest states with 1-2 PPs require their social studies teachers to carry more responsibilities, on average, than those in states with more PPs. The strongest relationships are the share of courses outside of teachers’ main assignments (15 percent among low-PP states versus 9 percent in high-PP states) and their involvement in extra school duties (74 percent in low-PP states, 60-63 percent in other states). These differences
The 2018 Brown Center Report on American Education 40
are statistically significant. Although the differences observed in total students taught, course load, and involvement in extracurricular activities are not statistically significant, the patterns here are suggestive of a similar relationship in low-PP states.
Together, these patterns suggest more and broader responsibilities for social studies teachers in states where the state policy environment is out of step with the consensus for high-quality civics education.
cONcLUsiONThe analyses presented in this chapter reveal that social studies teachers differ from other subject-specialized teachers in many ways. By understanding the teaching force we have in social studies and comparing it with the teaching force we might need, we can better answer questions about which policies and practices would strengthen the social studies teacher workforce.
Our findings indicate that the supply of trained social studies teachers is relatively strong in comparison to other core academic subjects, which is encouraging. Interestingly, secondary teachers in social studies are disproportionately male, which suggests that a different selection process might lead college graduates to teaching positions in social studies relative to other subjects. Our data cannot speak to what these selection differences might be, but we see this—along with gaps we observe in supplemental pay by gender and subject specialty—as fruitful topics for future research. This chapter also illustrates the outsized role of coaching among social studies teachers, where more than a third of all social studies teachers report coaching a school sport. This leaves us to wonder how many social studies teachers are hired primarily to lead the team on the field, not the students in the classroom.
Finally, we show that the qualifications and responsibilities of social studies teachers are not uniform across contexts. Consistent with prior research, our evidence shows teacher qualifications being systematically lower in schools that disproportionately serve students of color and students from low-income families. We also observe differences in social studies teachers’ responsibilities across states, which could reflect differences in what is asked of schools’ social studies programs through state policy.
To provide a high-quality civics education to students across the country, policymakers and practitioners will need to promote a healthy teacher workforce and sustainable teacher pipeline into the field. Strengthening the social studies teaching workforce is particularly important at a time when many Americans are wondering about their country’s civic and political wellbeing—and wondering about what schools could do to help.
By understanding the teaching force we have in social studies and comparing it with the teaching force we might need, we can better answer questions about which policies and practices would strengthen the social studies teacher workforce.
The 2018 Brown Center Report on American Education 41
CHAPTER 3 REFERENCESAaronson, D., Barrow, L., & Sander, W. (2007). Teachers and student achievement in the Chicago public high schools.
Journal of labor economics, 25(1), 95-135.
Clotfelter, C. T., Ladd, H. F., & Vigdor, J. L. (2006). Teacher-student matching and the assessment of teacher effectiveness.
Journal of human resources, 41(4), 778-840.
Darling-Hammond, L. (2007). Race, inequality and educational accountability: The irony of ‘No Child Left Behind.’ race
ethnicity and education, 10(3), 245-260.
Dee, T. S. & Goldhaber, D. (2017). Understanding and addressing teacher shortages in the United states. The Hamilton
Project Policy Proposal 2017-05. Washington, DC: Brookings Institution.
Godsay, S. & Sullivan, F. M. (2014). a national survey of civics and U.s. government teachers. The Center for Information &
Research on Civic Learning & Engagement. Medford, MA: Tufts University.
Goldhaber, D. & Hansen, M. (2013). Is it just a bad class? Assessing the long-term stability of estimated teacher perfor-
mance. economica, 80: 589-612.
Hansen, M. & Quintero, D. (2017). scrutinizing equal work for equal pay among teachers. Washington, DC: Brookings
Institution. https://www.brookings.edu/research/scrutinizing-equal-pay-for-equal-work-among-teachers/.
Hanushek, E. A., Kain, J. F., & Rivkin, S. G. (2004). Why public schools lose teachers. the Journal of human resources,
39(2), 326-354.
Hill, J., & Steans, C. (2015), education and certification qualifications of departmentalized public high school-level teachers of
selected subjects: evidence from the 2011-12 schools and staffing survey (NCES 2015-814). U.S. Department of Education,
National Center for Education Statistics. Washington, DC: U.S. Government Printing Office.
Kane, T. J., Rockoff, J. E., & Staiger, D. O. (2008). What does certification tell us about teacher effectiveness? Evidence from
New York City. economics of education review 27: 615-631.
McMurrer, J. (2007). choices, changes, and challenges: curriculum and instruction in the nclb era. Center on Education
Policy: Washington, DC.
Pace, J. L. (2012) The complex and unequal impact of high stakes accountability on untested social studies. Theory &
research in social education, 39(1), 32-60.
Putman, H., Hansen, M., Walsh, K., & Quintero, D. (2016). High hopes and harsh realities: the real challenges to
building a diverse teacher workforce. Washington, DC: Brookings Institution. https://www.brookings.edu/research/
high-hopes-and-harsh-realities-the-real-challenges-to-building-a-diverse-teacher-workforce/.
Redding, C. & Smith, T. M. (2016). Easy in, easy out: Are alternatively certified teachers turning over at increased rates?
american educational research Journal, 53(4): 1086-1125. http://journals.sagepub.com/doi/full/10.3102/0002831216653206.
The 2018 Brown Center Report on American Education 42
Rivkin, S. G., Hanushek, E. A., & Kain, J. F. (2005). Teachers, schools, and academic achievement. econometrica, 73(2),
417-458.
Vogler, K. E. (2008). Comparing the impact of accountability examinations on Mississippi and Tennessee social studies
teachers’ instructional practices. educational assessment, 13(1), 1-32.
Winstead, L. (2011). The impact of NCLB and accountability on social studies: Teacher experiences and perceptions about
teaching social studies. the social studies, 102(5), 221-227.
CHAPTER 3 ENDNOTES1 McMurrer (2007).
2 Darling-Hammond (2007); Pace (2008).
3 Vogler (2008); Winstead (2011).
4 The NTPS provides information on teacher demographics, teacher preparation, classes taught, compensation, and
school characteristics. All of the analyses presented here were also done on the 2003-04, 2008-09, and 2011-12 waves of
the Schools and Staffing Survey. The patterns for social studies teachers we report in this chapter, in comparison to other
subject specialists, are similar in substance to those seen with earlier survey data.
5 We restrict our sample analysis to regular full- and part-time secondary teachers working in public schools. Our final
sample is comprised of 9,350 teachers, of whom 2,040 are social studies teachers, 2,760 are ELA teachers, 2,490 are math-
ematics teachers, and 2,060 are natural science teachers.
6 Non-traditional entry includes those who enter through alternative certification programs and those who report entering
the profession without a bachelor’s degree. The misalignment measure represents the share of teachers who have neither
an educational background (undergraduate major or minor, graduate degree) nor professional certificate that allows them to
teach in the subject of their main assignment.
7 The share of assigned courses that are outside of the teachers’ primary specialty represents the ratio of courses outside
of their specialty area (for example, a social studies teacher who also teaches an art class) over the total number of courses
they teach. Teachers’ involvement in extracurricular activities includes coaching a sport and sponsoring any extracurricular
student groups. Teachers’ involvement in extra school duties includes serving as a department lead or chair, lead curriculum
specialist, assigned mentor or mentor coordinator for teachers, or serving on a schoolwide or districtwide committee or task
force.
8 Supplements are those paid out during the normal school year; we do not include supplements for teaching summer
school.
9 Male shares among bachelor’s degree recipients are computed from 2017 Digest of Education Statistics, Table
318.30. The social studies category includes all graduates in the social sciences and history division, as well as those in
area, ethnic, cultural, gender and group studies. The ELA category includes all graduates in the communication, journalism,
The 2018 Brown Center Report on American Education 43
and related programs division and the English language and literature/letters division. The math category includes all gradu-
ates in the mathematics and statistics division. The natural sciences category includes all graduates in the agriculture and
natural resources division, biological and biomedical sciences division, and the physical sciences division.
10 Unfortunately, the survey does not include detailed information about the nature of the extracurricular student activities
that teachers lead. Thus, we cannot say whether social studies teachers were leading relevant extracurricular activities (e.g.,
debate or student government) in comparison to those that are unrelated.
11 Godsay & Sullivan (2014).
12 Hansen & Quintero (2017).
13 The survey item asks, “During the current school year, do you, or will you, earn any additional compensation from this
school system for extracurricular or additional activities such as coaching, student activity sponsorship, mentoring teachers,
or teaching evening classes?” and then requests the total value of any compensation that meets this criterion. Thus, we
cannot separate income specifically for coaching from other income related to involvement in extracurricular activities or
extra school duties.
14 The low rates of alternative entry into social studies may also play a role in the relatively low representation of racial/
ethnic minorities in social studies (16 percent) noted in Table 1; see Putman, Hansen, Walsh, and Quintero (2016).
15 This slightly higher level of qualifications among social studies teachers was also documented in Hill & Steans (2015).
16 For example, there is far greater variation in teacher productivity within entry routes into the profession than is seen
across different paths (Kane, Rockoff, & Staiger, 2008). In general, observable teacher characteristics like the qualifica-
tions listed in Table 1 routinely explain less than 5 percent of the observed variation in teacher productivity, based on studies
looking at teacher quality in math and reading or ELA (Aaronson, Barrow, & Sander, 2007; Goldhaber & Hansen, 2013;
Rivkin, Hanushek, & Kain, 2005). It is plausible that teacher characteristics may have a different relationship with classroom
productivity of social studies teachers, but it is unlikely to be overwhelming.
17 Dee & Goldhaber (2017).
18 Redding & Smith (2016).
19 See, for example, Clotfelter, Ladd, and Vigdor (2006) and Hanushek, Kain, & Rivkin (2004).
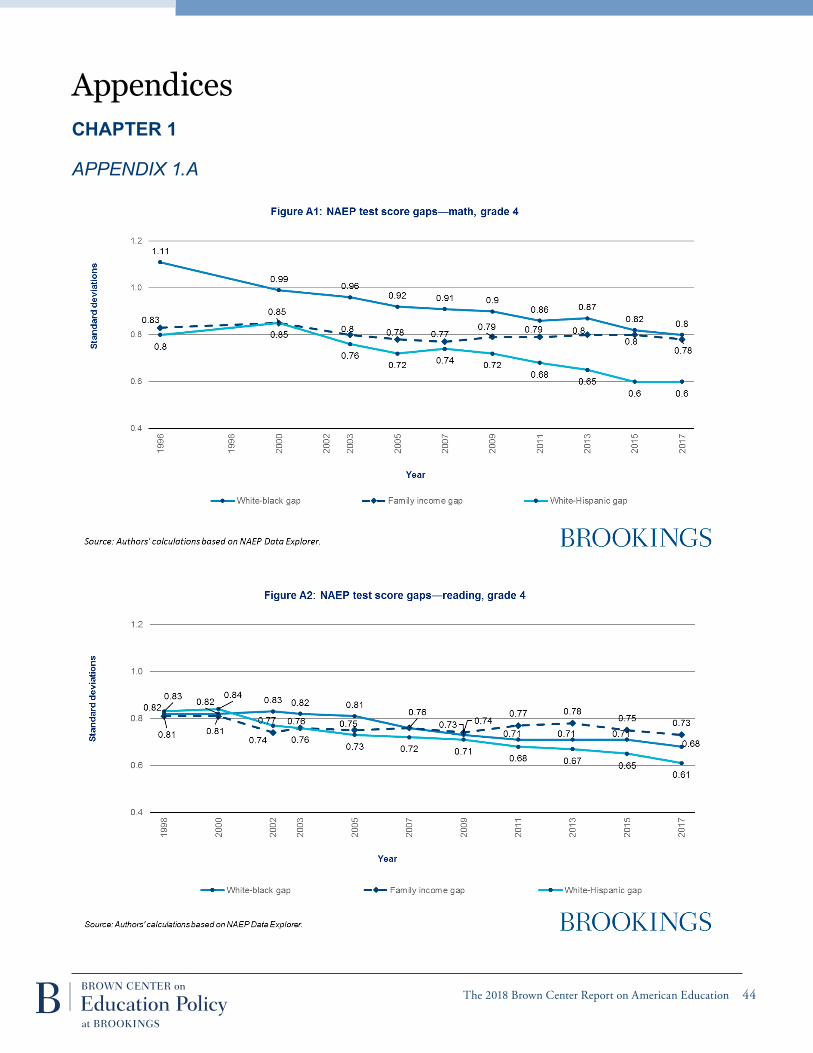
The 2018 Brown Center Report on American Education 44
Appendices cHAPtEr 1
appendix 1.a
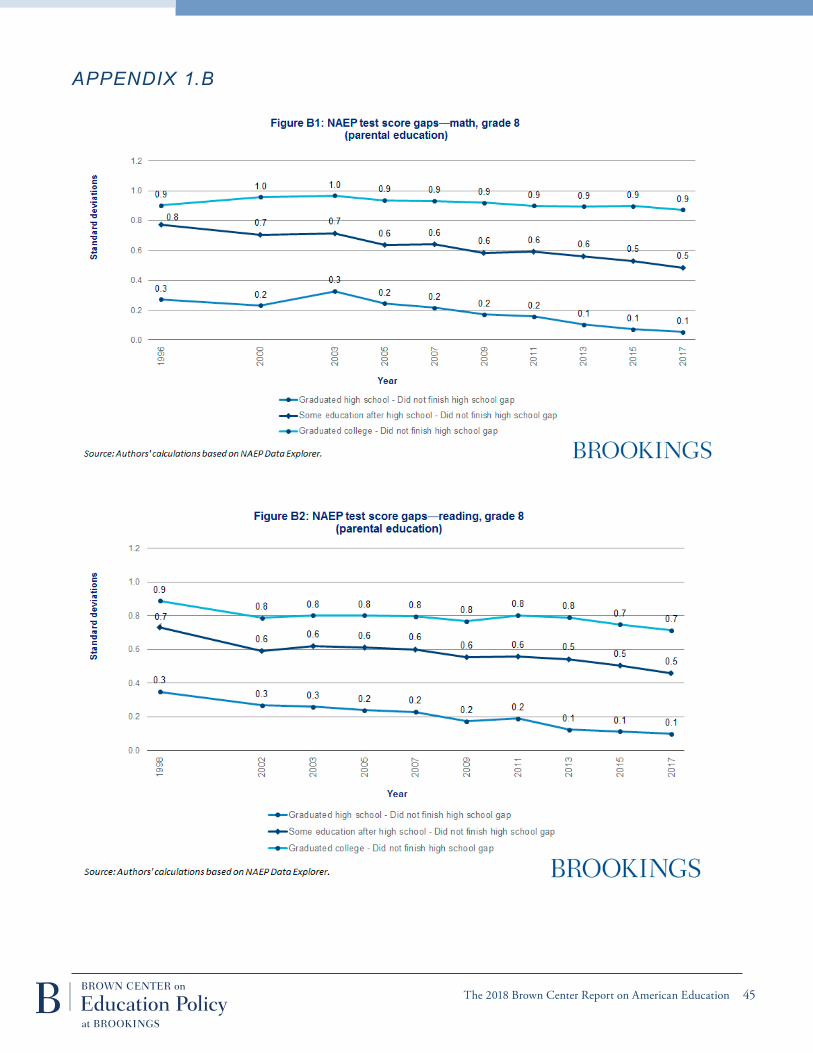
The 2018 Brown Center Report on American Education 45
appendix 1.b
The 2018 Brown Center Report on American Education 46
cHAPtEr 2
appendix 2.a: codinG protocol for 50-state inventory
The goal of the 50-state inventory is to identify which states incorporate recommended practices for high-quality civics education into their accountability frameworks for K-12 civics education. As discussed in the text, we began by identifying a set of recommended practices for high-quality civics education: the Six Proven Practices (6PPs). The 2011 report, “Guardian of Democracy: The Civic Mission of Schools,” explains in detail the 6PPs (renamed from their earlier title, the Six Promising Practices). This report was produced by the Campaign for the Civic Mission of Schools in partnership with the Annenberg Institute for Civics of the Annenberg Public Policy Center at the University of Pennsylvania, the National Conference on Citizenship, the Center for Information and Research on Civic Learning and Engagement at Tufts University, and the American Bar Association Division for Public Education.
This report’s predecessor is the “Civic Mission of Schools” report, published in 2003 by the Carnegie Corpora-tion of New York and the Center for Information and Research on Civic Learning and Engagement. Recently, the 6PPs were included in a 2017 report by the Council of State Governments and the Education Commission of the States.1 As part of the 2017 convening, “The Republic is (Still) at Risk,” the corresponding briefing paper de-scribes a “consensus in the field of civic learning” that the 6PPs “are effective when well done” (p. 4). This report was co-sponsored by the Jonathan M. Tisch College of Civic Life at Tufts University, the Lou Frey Institute at the University of Central Florida, the Campaign for the Civic Mission of Schools, and iCivics.
We reviewed recent reports on civics education to determine whether there was a consensus in support of the 6PPs as a high-quality framework for high quality civics education. From this review, we concluded that the 6PPs are recognized as a framework for high-quality civics education. This review includes the following documents:
• “Guidebook: Six Proven Practices for Effective Civic Learning” (Education Commission of the States and National Center for Learning and Civic Engagement 2014)
• “State Civic Education Toolkit” (The Council of State Governments, Education Commission of the States 2017)
• “State Civic Education Policy: Framework and Gap Analysis Tool” (Education Commission of the States 2017)
• “The Republic is (Still) at Risk—and Civics is Part of the Solution” (Levine and Kawashima-Ginsberg 2017)
As discussed in the text, we incorporate four additional aspects of civics education beyond the original 6PPs, based on recent work by a coalition of civics education leaders. The briefing paper “The Republic is (Still) at Risk—and Civics is Part of the Solution” advocated adding four practices to the original six: news media literacy, action civics, social-emotional learning, and school climate reform.
Furthermore, a number of reports, such as “The Republic is (Still) at Risk,” drew our attention to the “College, Ca-reer, and Civic Life Framework (C3)” in addition to the 6PPs. In addition to the keyword search described below, we used Appendix A from “The Republic is (Still) at Risk” to identify whether a state used the C3 in their current standards, scheduled revision of their standards, current curriculum framework, or planned adoption of their cur-riculum framework.
The 2018 Brown Center Report on American Education 47
Keyword search protocol
We then identified the types of policy documents to review for alignment with the PPs: high school course gradu-ation requirements, state standards, and state curriculum frameworks. We include only these policy documents to allow for systematic comparison across states. Given the wide variety of documents that states publish and the variation in whether and how states publicize these documents, we focused on the three documents that we could obtain across all states. Importantly, these three types of documents work together to create the backbone of state accountability frameworks in civics and in other subject areas. Our analysis excludes other types of policy documents where states may address civics education, such as legislation or grant programs.
We then identified which of the PPs we could reasonably expect states to address in these three types of policy documents. After a preliminary review of the content included in these policy documents, we concluded that the two PPs related to extracurricular activities and participation in school governance were not likely to be topics or issues that states included in these documents. Thus, the analysis focuses on four of the original 6PPs that we anticipated states would address in their graduation requirements, standards, and curriculum frameworks: course requirements, discussion of current events, service learning, and simulations of democratic processes and pro-cedures. In addition, of the four areas that experts recommend adding to the original 6PPs, we expected states to address news media literacy in the policy documents reviewed for this analysis. As a result, we also included a keyword search for news media literacy in our analysis.
To identify alignment between the PPs and state high school graduation requirements, state standards, and cur-riculum frameworks, we used a systematic keyword search of these policy documents for each state. We created a coding protocol that included keywords for each practice. We identified keywords associated with each of the five PPs analyzed here through a review of the 2011 “Guardian of Democracy” report that outlined the PPs, as well as reviewing additional reports that discuss either the PPs themselves or practices related to the PPs. For example, the National Young Leaders Conference provides an in-depth explanation of “service learning,” which was used to inform the keyword search for the service learning practice.3 The coding protocol includes a guide for interpreting whether each keyword was substantively relevant to each PP.
For each state, a research intern searched each relevant document for the keywords that correspond with each PP. If a keyword was found, the coder recorded a “1” for that state and that practice and a “0” otherwise. Our 50-state policy inventory analysis is based on these data from the state keyword searches.
The 2018 Brown Center Report on American Education 48
Coding protocol for Proven Practices 50-state inventory
Proven Practice 1: Classroom instruction
• Data source: NASBE high school graduation requirement inventory of social studies requirements
• Using the NASBE high school graduation requirement inventory, search for requirements on Civics, U.S. History, Government, Economics, Law, Democracy, and/or Geography (“Guardian of Democracy” (2011, p. 26) discussion of PP1).
Classroom instruction
• If any of these courses are required by the state, type “1” in corresponding course cell.
• If any of the required courses combine two or more of the courses we are coding for (e.g., a course called “U.S. History and Geography” as opposed to separate classes on each subject), type “0” in the cells coding for the individual subjects and then type “1” under “Combo.”
• If you type “1” under “Combo,” write the name of the course in the corresponding “Combo Name” cell.
Proven Practice 2: Incorporate discussion of current local, national, and international issues and events in the classroom, particularly those that young people view as important to their lives.4
• Data source: ECS state standards inventory and/or the ECS state civics curriculum frameworks inventory, as available depending on the state.
• For each state, search for the following keywords:
Discussion (of) current, present, contemporary, today(’s) events/issues
• If these produce nothing, search individual terms: discussion, current, present, contemporary, today, event, issue.
• Ensure that these words are being used in the context of current events. For instance, the keywords “event” and “issue” cannot count if they are in the context of a historical or past event/issue.
• If keyword(s) is/are used in a relevant context, type “1” in the “Discussion” cell of corresponding state. If keyword(s) is/are not used appropriately or is/are not mentioned, type “0” in aforementioned cell of corresponding state.
The 2018 Brown Center Report on American Education 49
Proven Practice 3: Service learning
• Data source: ECS state standards inventory and/or the ECS state civics curriculum frameworks inventory
• Requirements of service learning adapted from National Young Leadership Council’s K-12 Service-Learning Standards for Quality Practice (2008).
• For each state, search for the following keywords:
Service learning
• Service learning provides students with the opportunity to apply what they learn through performing community service that is linked to the formal curriculum and classroom instruction. Therefore, when searching key words you must search for “service learning,” otherwise it cannot count. For instance, “service” or even “community service” does not count as they do not demonstrate a link to the formal curriculum and classroom instruction.
• If keyword(s) is/are used in a relevant context, type “1” in the “Service Learning” cell of correspond-ing state. If keyword(s) is/are not used appropriately or is/are not mentioned, type “0” in aforemen-tioned cell of corresponding state.
Proven Practice 6: Simulations of democratic processes
• Data source: ECS state standards inventory and/or the ECS state civics curriculum frameworks inventory
• For each state, search for the following keywords:
Simulations
• Ensure that the mention of simulations is in the context of democratic processes. For example, re-quiring/encouraging students to hold a mock election is relevant for this practice.
• If keyword(s) is/are used in a relevant context, type “1” in the “Simulations” cell of corresponding state. If keyword(s) is/are not used appropriately or is/are not mentioned, type “0” in aforementioned cell of corresponding state.
Specific examples
• If states mention examples of simulations (e.g., mock trial/elections, student government, etc.) code for it in the excel document.
• If keyword(s) is/are used in a relevant context, type “1” in the “Specific Examples” cell of correspond-ing state. If keyword(s) is/are not used appropriately or is/are not mentioned, type “0” in aforemen-tioned cell of corresponding state.
The 2018 Brown Center Report on American Education 50
Suggested additional practice: News media literacy
• Data source: ECS state standards inventory and/or the ECS state civics curriculum frameworks inventory
• For each state, search for the following keywords:
News/media literacy
• If these produce nothing, search individual terms: news, media, and literacy.
• Ensure that these words are being used in context of news and/or media literacy. For example, re-quiring/encouraging students to understand how news and media bias can shape voter understand-ing of policy issues is relevant for this practice
• If keyword(s) is/are used in a relevant context, type “1” in the “News/Media Literacy” cell of cor-responding state. If key word(s) is/are not used appropriately or is/are not mentioned, type “0” in aforementioned cell of corresponding state.
Other words to use for News/Media Literacy: Fake (news) and Bias (news)
• Ensure that these words are being used in context of news and/or media literacy. For example, requiring/encouraging students to understand the difference between real and fake news and the biases of different information outlets, is relevant to this practice.
• If keyword(s) is/are used in a relevant context, type “1” in the “News/Media Literacy” cell of cor-responding state. If keyword(s) is/are not used appropriately or is/are not mentioned, type “0” in aforementioned cell of corresponding state.
Appendix 2.A Endnotes
1 Whitehouse, E., Baumann, P., Brennan, J. (2017). State Civic Education Toolkit. The Council of State Governments. Educa-tion Commission of the States.
2 For more details, please see Levine and Kawashima-Ginsberg (2017).
3 See the K-12 Service Learning Standards (2008).
4 Description of Proven Practice 2 from “Guardian of Democracy” (2011).
The 2018 Brown Center Report on American Education 51
EMAiL yOUr cOMMENts tO [email protected]
This paper is distributed in the expectation that it may elicit useful comments and is subject to subsequent revision.
The Brookings Institution is a nonprofit organization devoted to indepen-dent research and policy solutions. Its mission is to conduct high-quality, independent research and, based on that research, to provide innovative, practical recommendations for policymakers and the public. The con-clusions and recommendations of any Brookings publication are solely those of its author(s), and do not reflect the views of the Institution, its management, or its other scholars.
Support for this publication was generously provided by The Brown Foundation. Brookings recognizes that the value it provides is in its absolute commitment to quality, independence, and impact. Activities supported by its donors reflect this commitment.
GOVErNANcE stUDiEs
The Brookings Institution 1775 Massachusetts Ave., NW Washington, DC 20036 Tel: 202.797.6090 Fax: 202.797.6144 brookings.edu/governance
EDitiNG LOUIS SERINO
PrODUctiON & LAyOUt LIz SABLICH
AckNOWLEDGEMENts
This report was made possible by the generous financial support of The Brown Foundation, Inc., Houston. The authors would also like to thank Tom Loveless for his many contributions to the Brown Center on Education Policy, which includes authoring prior editions of the BCR and offering comments on a portion of this edition. In addition, we are grateful to Elizabeth Sablich and Louis Serino for editorial support, Sarah Andes and Dana Harris for comments and insights, and Caitlin Dermody, Bethany Kirkpatrick, James McIntyre, Maximiliano Rombado, and Kimberly Truong for research assistance.