Embed Size (px)
Citation preview

The 2003 Brown Center Report on American Education:
HOW WELL ARE AMERICAN STUDENTS LEARNING?
With special sections on homework, charter schools, and rural school achievement
ABOUT BROOKINGSThe Brookings Institution is a private nonprofit organizationdevoted to research, education, and publication on importantissues of domestic and foreign policy. Its principal purpose is to bring knowledge to bear on current and emerging policyproblems. The Institution maintains a position of neutrality on issues of public policy. Interpretations or conclusions inBrookings publications should be understood to be solely those of the authors.
BROWN CENTER ON EDUCATION POLICY
Established in 1992, the Brown Center on Education Policy
conducts research on topics in American education, with
a special focus on efforts to improve academic achievement
in elementary and secondary schools. For more information,
see our website, www.brookings.edu/browncenter.
To order copies of this report, please call 800-275-1447, fax 202-797-2960, e-mail [email protected], or visit online at www.brookings.edu.
This report was made possible by the generous financial support of The Brown Foundation, Inc., Houston.

The 2003 Brown Center Report on American Education:
HOW WELL ARE AMERICAN STUDENTS LEARNING?With special sections on homework, charter schools, and rural school achievementOctober 2003
Volume I, Number 4
by:
TOM LOVELESS
Director, Brown Center on
Education Policy

Copyright ©2003 byTHE BROOKINGS INSTITUTION1775 Massachusetts Avenue, NW Washington, D.C. 20036www.brookings.edu
All rights reserved
TABLE OF CONTENTS
3 Introduction
PART I
5 The Nation’s Achievement
PART II
16 Do Students Have Too Much Homework?
PART III
27 Charter Schools: Achievement, Accountability, and the Role of Expertise
36 Endnotes
Research assistance by:
PAUL DIPERNA
Brown Center on Education Policy
JOHN COUGHLAN
Brown Center on Education Policy

THE 2003 BROWN CENTER REPORT ON AMERICAN EDUCATION
This is the fourth edition of the Brown Center Report on American Education.
The report premiered in the fall of 2000, as the presidential campaign
between George W. Bush and Al Gore drew to an exciting finish. This year’s
report is published as Democratic candidates vie for their party’s nomination
for president. Education will figure prominently in the 2004 election, as it did
in the last. President Bush will herald No Child Left Behind (NCLB) as the
most important federal education legislation in a generation. Democrats will
argue that without ample funding the law is an empty promise. They will
point out that the Bush administration put the brakes on federal education
spending just as NCLB was getting off the ground.
The partisan debate over how to improve American education has been
following the same script for the past four years. Republicans stress holding
schools accountable and make concessions on funding increases. They seek
to neutralize the Democrats’ traditional strength with voters on education
issues. Democrats stress the need for providing more resources to schools
and make concessions on accountability provisions. They seek to present
education as a key plank in their party’s domestic agenda for the country.
This year’s Brown Center Report examines several issues that are important
to No Child Left Behind and ongoing efforts to improve American schools.
The first section of the report analyzes the latest data on student
achievement and asks how the nation’s students are doing in reading and
mathematics. Achievement in rural schools receives a closer look.
The second section is a study of homework. Conventional wisdom is
that higher academic standards, a bedrock of No Child Left Behind, have
The Brown Center Report on American Education 3

4 The Brown Center Report on American Education
driven up the amount of students’ homework. Stories of tired, over-worked
kids abound. After examining several different sources of data on the topic,
the study concludes that virtually no evidence exists that homework has
increased in recent years, nor that the homework load has become—or ever
was—overwhelming. The stories of children laboring under onerous
amounts of homework appear to feature a small proportion of children who,
though their predicaments are real, are not typical.
The third section of the report presents a follow-up of last year’s study
on charter schools. This year’s study examines charters’ test scores, with a
special focus on achievement in conversion charters, schools that were pre-
viously regular public schools and converted to charter status, and charters
managed by educational management organizations (EMOs), professional
management firms. Both types of charter school can lay claim to a particular
form of expertise. When a regular public school converts to a charter school,
the most talented and experienced teachers and administrators usually stay
on board. The very existence of educational management organizations is
based on the premise that expert managers, who are usually not educators
and come from the private sector, can employ their leadership skills to make
schools more productive.
Readers should be informed that the author of the Brown Center Report,
Tom Loveless, has had several professional affiliations with charter schools.
These associations cannot change the data on which the following analysis is
based, but they might have, in ways unknown, influenced the choice of
questions in the research or the interpretation of the findings. The data are
downloadable from the Brown Center website (www.brookings.edu/brown-
center) for those who would like to conduct their own analysis.

The Brown Center Report on American Education
Part
ITHE NATION’SACHIEVEMENT
The Brown Center Report on American Education
Part
I

6 The Brown Center Report on American Education
Part I The Nation’s Achievement
THIS SECTION OF THE REPORT EXAMINES FEDERAL AND STATE
assessment data to determine how well American students are
learning reading and mathematics. In the spring of 2003, the fed-
eral government released scores from the 2002 National Assessment of
Educational Progress (NAEP). As the Brown Center Report went to press,
NAEP scores from 2003 were being readied
for release, making it the first time that
comparable NAEP tests had been given in
consecutive years. Annual NAEP testing
reflects the intention of the No Child Left
Behind Act (NCLB) that the NAEP serve as
an independent monitor of state tests.
Accountability systems are based on how
schools perform on state tests. The NAEP
should, ideally, indicate whether states make
their tests too easy or otherwise report
inflated scores.
The NAEP program has two tests—
the main and the trend. The 2002 results
were derived from the main NAEP, the fifth
time the test has been given in reading since
1990. Main NAEP scores in math were last
reported in 2000. The trend NAEP, a test first
administered in 1969 in science, 1970 in
reading, and 1972 in math, will be given
again in 2004. Despite the confusion caused
by using two tests, NAEP is valuable for
providing periodic snapshots of the nation’s
academic achievement based on the perfor-
mance of large, randomly selected, nationally
representative samples of students on tests of
academic skills.
NAEP Gains by Subject and GradeTables 1-1 and 1-2 present the latest NAEP
data. Scores are broken out by subject area
and grade level. Significant findings are evi-
dent along these two dimensions. Math scores
continue to improve at a quicker pace than
reading scores. Math scores at the fourth
grade level rose by approximately .47 stan-
dard deviations from 1992 to 2000, an
extraordinary increase on any achievement
test—about one and one-fourth grade levels
of knowledge. Almost one year’s gain was
made from 1990 to 1996 alone! The gains
made by eighth and twelfth graders have been
less pronounced but are still significant.1
The reading results are quite different.
The 2002 scores are flat (see Table 1-2).
Reading proficiency has changed very little
since 1992. The languid progress in reading is

The Brown Center Report on American Education 7
surprising given the emphasis placed on liter-
acy instruction by policymakers in the 1990s.
The federal government passed the Reading
Excellence Act of 1998, and a long, bruising
battle over phonics legislation transpired
in dozens of states.2 Reading performance
has barely budged.
Younger students are making larger
strides in academic performance than older
students. Twelfth grade reading scores have
actually declined. The loss of 5 scale score
points in that grade level since 1992 is
not only statistically significant, but also sig-
nificant in the real world. One-fourth of
twelfth graders scored below a basic level as
defined by NAEP performance standards.
That means about 700,000 students in the
final year of high school do not have the basic
reading skills that are required for meaningful
employment or success in higher education.
What explains the poor reading perfor-
mance by twelfth graders? No one knows for
sure. High school seniors may not take the
NAEP test seriously. An analysis of responses
on the 1996 NAEP uncovered evidence that
more than a quarter of twelfth graders
engaged in off-task behaviors—leaving ques-
tions blank, doodling in the margins, giving
the same answer on a long string of items, and
the like.3 How students perform on NAEP
does not count for anything, and the test’s low
stakes may hinder its ability to assess what
students really know. Determining whether
off-task test behaviors have increased in recent
years would help explain their role in affecting
trends in test scores. The fact that twelfth
grade NAEP scores in math have not similarly
declined casts doubt on the explanation.
Other theories for the disappointing
reading scores lay blame on high schools
themselves. A federal commission singled out
the senior year in American high schools as
an academic wasteland, the typical student’s
day filled with non-academic classes, study
halls, part-time jobs, and extra-curricular
activities.4 Early admission to college robs
even the most studious seniors of the incen-
tive to work hard. Many top students are noti-
fied that they have been accepted to college
as early as December, making the second half
of the school year irrelevant to their future
plans. High school seniors take so many tests
that count—finals, Advanced Placement tests,
graduation exams—that tests such as the
NAEP risk being seen as unimportant.
State Test ResultsThe Brown Center Report has been monitor-
ing state test scores for the past four years.
State test results now take on heightened
importance. Under No Child Left Behind,
state tests are the instrument by which
schools will be held accountable for produc-
ing student learning. Tables 1-3 and 1-4
summarize the latest results, compiled from
tests given in 2002. Data were obtained from
forty-nine states. The analysis is confined to
The languid progress
in reading is surprising
given the emphasis
placed on literacy
instruction by policy-
makers in the 1990s.
Reading Main NAEP Scores, 1992–2002(average scale scores)
Grade 4
Grade 8
Grade 12
1992
217
260
292
1994
214
260
287
1998
217
264
291
2000
217
—
—
2002
219
264
287
1990-2002Change
+2
+4
–5
Change in SD Units
+0.06
+0.11
–0.15
Table
1-2
Source: Standard Deviations in 1992 were: Grade 4, 36 points; Grade 8, 36 points; Grade 12, 33 points.
As measured by the National Assessment of Educational Progress (NAEP), for grades 4, 8, and 12. NAEP data are expressed as scale scores, ranging from 0 to 500.
Math Main NAEP Scores, 1990–2000(average scale scores)
Grade 4
Grade 8
Grade 12
1990
213
263
294
1992
220
268
299
1996
224
272
304
2000
228
275
301
Table
1-1
Source: Standard Deviations in 1990 were: Grade 4, 32 points; Grade 8, 36 points; Grade 12, 36 points.
As measured by the National Assessment of Educational Progress (NAEP), for grades 4, 8, and 12. NAEP data are expressed as scale scores, ranging from 0 to 500.
1990-2000Change
+15
+12
+7
Change in SD Units
+0.47
+0.33
+0.19

8 The Brown Center Report on American Education
Part I The Nation’s Achievement
states using the same test in the same subject
area and grade level in 2001 and 2002. Since
states assess achievement in various grade
levels, the number of states reporting at any
particular grade varies.
Table 1-3 shows the percentage of
states reporting an improvement, no change,
or a decline in mathematics from 2001 to
2002. Table 1-4 provides the same informa-
tion for reading. The same patterns noted
in the NAEP data are apparent here, with
more states gaining in math than reading
and more states gaining at younger grades
than older grades. In math, more states
reported gains than losses in grades 4, 5,
and 8. Only at tenth grade did declining
states outpace advancers (by a margin of
eight to six, with five states reporting no
change). In reading, more states reported
gains in grades 4 and 5 than reported
declines (see Table 1-4). The fifth grade
advance is small—eight states advancing to
six declining. In grades 8 and 10, declining
states outpaced gainers.
How do the latest state scores compare
with previous years? Is student achievement
in the U.S. improving or deteriorating? The
direction and magnitude of national
achievement must be discerned from several
disparate snapshots. To evaluate national
performance in previous years, the Brown
Center Report tracked over time the per-
centage of states with rising test scores, as
the first rows of Tables 1-3 and 1-4 report
for 2002. The problem with that approach
is that it does not adequately account for
states with falling scores. This year, Brown
Center researchers devised a new statistic
to serve as an indicator of momentum in state
achievement tests.
State Test Results(2001–2002)
Math
Improvement
No Change
Decline
Total
�
��
�
Grade 4
16 (50%)
8 (25%)
8 (25%)
32 states
Improvement
No Change
Decline
Total
�
��
�
Grade 5
11 (55%)
3 (15%)
6 (30%)
20 states
Improvement
No Change
Decline
Total
�
��
�
Grade 10
6 (32%)
5 (26%)
8 (42%)
19 states
Improvement
No Change
Decline
Total
�
��
�
Grade 8
15 (38%)
11 (28%)
13 (33%)
39 states
Table
1-3
0.01
0.59
0.32
0.70 0.68
0.45
0.20
0.32
-1.0
0.0
0.2
0.2
0.4
0.4
0.6
0.6
0.8
0.8
1.0
1999 2000 2001 2002
Reading
Math
Fig
1-1State tests show math gains outpacing gains in reading…
Achievement Momentum Index by subject, 1999–2002
But improvement is slowing in both subjects.
Test ScoreGains
Test ScoreLosses
Source: Test data obtained from 49 states (and the District of Columbia) that administered the same achievement test in consecutive years.
Source: Data obtained from 49 states(and the District of Columbia) thatadministered the same achievementtest in consecutive years.

The Brown Center Report on American Education 9
Achievement Momentum IndexThe index is simple to understand. For any
particular year, the index ranges from –1.00
to +1.00. Each state’s contribution to the
index is weighted to represent its share of the
nation’s student population. The calculations
include reading and math scores for grades 4,
8, and 10. For states reporting higher test
scores than the previous year, their popula-
tion weights are multiplied by +1.00. For
states reporting lower scores, their popula-
tion weights are multiplied by –1.00. States
reporting the same scores are set at 0.00. The
products are summed to create the index.
Interpreting the index is straightfor-
ward. A positive momentum score means test
scores are going up. A negative score indi-
cates they are going down. And a 0.00 means
that scores are unchanged or that the num-
bers of students in improving and declining
states are about equal. If every state reports
test scores that have improved from the previ-
ous year, the momentum index will read
+1.00. If every state reports test scores that
have declined, the index will read –1.00. The
closest corollary to the index is a corpora-
tion’s annual statement of profits or losses,
which compares current performance with
performance in the previous year. Since the
index is population weighted, a gain in a large
state like California can offset losses in several
small states and vice versa.
Figures 1-1 and 1-2 display the
momentum indices from 1999 to 2002.
Figure 1-1 reports by subject area, with
scores averaged across grades 4, 8, and 10.
And Figure 1-2 reports by grade level, with
math and reading scores averaged at each
grade. As shown in Figure 1-1, scores in
reading and math remained positive in 2002
but less so than in recent years. Progress
has slowed. The highest reading scores were
recorded in 1999, the first year the Brown
Center began collecting state test data. Math
scores peaked in 2000. Nevertheless, both
momentum indices are signaling that
students continue to improve, albeit more
slowly, in reading and math.
State Test Results(2001–2002)
Reading
Improvement
No Change
Decline
Total
�
��
�
Grade 4
16 (48%)
6 (18%)
11 (33%)
33 states
Improvement
No Change
Decline
Total
�
��
�
Grade 5
8 (40%)
6 (30%)
6 (30%)
20 states
Improvement
No Change
Decline
Total
�
��
�
Grade 10
5 (36%)
3 (21%)
6 (43%)
14 states
Improvement
No Change
Decline
Total
�
��
�
Grade 8
12 (32%)
11 (30%)
14 (38%)
37 states
Table
1-4
Source: Data obtained from 49 states(and the District of Columbia) thatadministered the same achievementtest in consecutive years.
The National Assessment of Educational
Progress (NAEP) is commonly referred to
as the Nation’s Report Card. Since 1969,
it has been the only nationally representa-
tive and continuing assessment of what
America’s students know and can do in
academic subject areas. The number
of students selected for a NAEP national
sample for any particular grade and sub-
ject is 7,000 or more.
There are three NAEP test types:
(1) the main NAEP gauges national
achievement while also reflecting current
practices in curriculum and assessment,
(2) the long-term trend NAEP allows
reliable measurement of change in national
achievement over time, and (3) the state
NAEP measures achievement of students
in participating states. These assessments
use distinct data collection procedures
and separate samples of students.
Since 1990, the main and state math
tests have been governed by a framework
reflecting recommendations of the National
Council of Teachers of Mathematics
(NCTM). The long-term trend test consists
of essentially the same items and test
procedures used in 1973.
Introduction to NAEP

10 The Brown Center Report on American Education
Figure 1-2 displays academic progress
by grade. Scores at the fourth grade level
remain strong, with 2002 the best year of
the four. Eighth and tenth graders continue
to tally test score gains, but momentum
has tailed off since 2000. Here, the positive
signal for eighth and tenth grades in 2002
is contrary to that given above by Tables 1-3
and 1-4 for the same year. The momentum
index was driven into positive territory
by gains in California and Texas, two
large states.
The latest federal and state test
results give a clear indication of how well
American students are learning. Student
achievement continues to improve in both
reading and math, but at a slower pace than
three or four years ago. Math gains outpace
reading gains, and elementary grade children
are improving more than middle and high
school students. The analysis now shifts to
an often overlooked population in discus-
sions of test scores.
Rural SchoolsRural schools are America’s forgotten educa-
tional institutions. Educational reformers
generate moral energy by championing the
cause of urban education. This focus also
pays political dividends. Federal and state
officials invariably craft education policies
with urban schooling as a central concern.
It is no accident that education’s two most
enduring policy debates—concerning
parental choice and school finance—have
been largely contested over the effects
of policy on children in big cities.
The online archives of Education Week,
the national journal of record in the field of
education, offer a yardstick for measuring
Part I The Nation’s Achievement Rural schools are
America’s forgotten
educational institu-
tions. Educational
reformers generate
moral energy by
championing the cause
of urban education.
Source: Test data obtained from 49 states (and the District of Columbia) that administered the same achievement test in consecutive years.
-1.0
0.0
0.2
0.2
0.4
0.4
0.6
0.6
0.8
0.8
1.0
Test Score Gains
Test Score Losses
0.56
0.550.55
0.01
0.63
0.72 0.69
0.66
0.61
0.26
0.20
0.75
1999 2000 2001 2002
8th Grade
4th Grade
State tests show 4th graders making greater gains than older students…
Achievement Momentum Index by grade, 1999–2002
But the progress of 10th graders has slowed for two consecutive years.
10th Grade
Fig
1-2

The Brown Center Report on American Education 11
media coverage of education in different
types of communities. Consider the number
of times “urban, ” “rural, ” and “suburban”
were mentioned in Education Week from 2000
through 2002. “Rural” appeared 425 times,
“suburban” 346 times, and “urban” 916
times.5 Of all such mentions, the word
“rural” appeared 25% of the time, “suburban”
21%, and “urban” 54%.
Note that suburban schools received
even less attention than rural schools.
That is probably because they are assumed
to be amply endowed with resources and
to be at least adequate, if not excellent, in
quality. Polls show that parents and the gen-
eral public are overwhelmingly satisfied with
suburban schools. But what about rural
schools? They are rarely mentioned in the
public debate over school reform. Are they as
successful as suburban schools? What kinds
of students attend rural schools? Do they
learn as much as students in other settings?
Characteristics of Rural SchoolsRural schools are not monolithic. They look
very different in different regions of the
country, serve different kinds of students,
operate in different economic and social con-
texts, and encounter different challenges.
Table 1-5 compares urban, suburban, and
rural schools on several characteristics.
However, as one reads the ensuing discus-
sion, it should be remembered that for every
characteristic that is exhibited by most rural
schools, pockets of rural schools exist with
contrasting profiles.
Rural schools enroll only 27% of the
nation’s students but occupy 42% of school
buildings. As a consequence, the average
rural school is quite small. It serves only 392
students, which is about 40% smaller than
the average urban or suburban school.
Compared to the typical urban school, the
typical rural school has a smaller proportion
of students who qualify for free and reduced
lunch, a measure of poverty. And rural
schools serve a much larger proportion of
white students than urban or suburban
schools. The black and Hispanic populations
are sparse in rural schools. Only 8% of rural
students are black and 7% are Hispanic,
compared to 33% who are black and 24%
who are Hispanic in urban schools.
Rural schools receive less funding than
most schools, about 13% less than urban
schools ($5,734 vs. $6,575). In part, the
funding shortfall may be attributable to a
greater reliance by rural schools on state
funds. Rural schools receive 53% of their
revenues from states, compared to 44% for
suburban schools. Urban and suburban
districts tap local property wealth to boost
revenues. A lower cost of living also
undoubtedly plays a part. Recent calcula-
tions by the Economic Research Bureau
estimate that the cost of living in rural areas
is 16% less than in urban areas.6
The problems rural schools face in
gaining sufficient financial resources and
well-trained teachers have been documented
Table
1-5Characteristics of Urban, Suburban, and Rural Schools
% of Nation’s Students
% of Nation’s Schools
Mean School Size
% Free/Reduced Lunch
% White
% Black
% Hispanic
% Asian
% Native American
Per Pupil Expenditure
% of Revenue from State
Urban
30
24
663
57
37
33
24
5
1
$6,575
49
Suburban
43
34
665
32
66
13
15
5
1
$6,229
44
Rural
27
42
392
39
80
8
7
1
4
$5,734
53
Source: National Center for Educational Statistics (NCES), “Navigating Resources for Rural Schools: PublicElementary and Secondary Students, Schools, Pupil/Teacher Ratios, and Finances, by Type of Locale: 1998and 1999”, (NCES 2001); National Center for Educational Statistics (NCES), 2002 Common Core of Data.

12 The Brown Center Report on American Education
by The Rural School and Community Trust.7
Rural schools may also lack other types of
education resources. Some of the shortages
stem from rural schools being exceptionally
small. Small schools offer fewer curriculum
options and provide fewer opportunities for
high achievers to enroll in advanced place-
ment or International Baccalaureate pro-
grams. Extracurricular activities are limited.
Even rural schools that possess the facilities
to offer a specialized program—say, an
advanced placement chemistry class—may
have a difficult time staffing it with a well-
qualified teacher.
Choice and Public SupportParents exercise less choice in rural areas.
Only 15.9% of students in rural areas attend
public or private schools of choice, com-
pared to 28.7% in non-rural areas. It is diffi-
cult to say whether this pattern is the result
of short supply or lack of demand. Rural
parents have fewer alternatives to conven-
tional public schools, either in the private
sector or in the public sector through mag-
net or charter schools. Little more than 5%
of rural students attend private schools,
about half of the national percentage.8
Rural parents are satisfied with public
schools, and the support for public schools
extends into the community. In the 2002 Phi
Delta Kappa/Gallup Poll, rural residents gave
their schools higher grades than either sub-
urban or urban residents. In awarding letter
grades to local public schools, 53% of rural
residents assigned an A or B, compared to
51% of suburban residents and 32% of
urban residents. In a survey of students con-
ducted by Metropolitan Life, 59% of rural
students described parental and community
Part I The Nation’s Achievement
212
223 220
Grade 4200
250
275
225
300
268 266
258
Grade 8
290285
Grade 12
284
Suburban
Rural
Urban
Rural 4th graders achieve at levels close to that of suburban students.
By 12th grade, rural students’ performance resembles that of urban students.
2002 NAEP reading average scale score by location
Source: As measured by the National Assessment of Educational Progress (NAEP), for grades 4, 8, and 12. NAEP data are expressed as scale scores, ranging from 0 to 500.
Fig
1-3
A z-score is the distance fromthe mean expressed in standarddeviation units. A z-score of 0.00is, by definition, the mean. A z-score of 1.00 indicates that aschool’s test scores are onestandard deviation above themean, approximately at the 84thpercentile. A z-score of -1.00 puts a school at approximatelythe 16th percentile.
What are z-scores?

The Brown Center Report on American Education 13
support for their schools as excellent or pret-
ty good. Approximately 51% of suburban
students and 44% of urban students offered
such a positive assessment of support for
their schools. Compared to suburban and
urban students, rural students were also
more likely to give their teachers high grades
on such critical aspects of teaching as under-
standing subject matter, treating students
with respect, helping students, and main-
taining control and discipline in the class-
room.9 A recent study by Richard Ingersoll
found that rural schools have lower teacher
turnover than other schools nationally.
Relatively stable teaching staffs may con-
tribute to the confidence that local residents
have in rural schools.10
AchievementHow do rural students perform on state
achievement tests? Table 1-6 displays 2002
test data from fourteen states. Reading and
math scores were combined for grades 4, 8,
and 10. Because the states give different
tests and report scores on different scales,
Brown Center researchers converted school
test scores to z-scores, which designate
where schools fall on the distribution of all
scores within a state. By definition, z-scores
have a mean of 0.00 and standard deviation
of 1.00. For each of the fourteen states,
the average z-score of rural schools is report-
ed in the final column of Table 1-6.
Rural schools are generally perform-
ing quite well, scoring above average in all
states except for Arizona, Minnesota, and
South Carolina. Solid test scores may be a
key reason why rural schools enjoy broad
community support. It is impossible for
these data to tell us much about why rural
students do so well. Almost all of the test
score advantage washed out when regres-
sion analyses controlled for schools’ racial
composition and percentage of students in
poverty. Those demographic statistics are
also listed in the table.
Federal NAEP data provide another
source of data on rural school achievement.
Figure 1-3 displays the 2002 NAEP reading
scores by grade level and location. At fourth
grade, students in rural schools achieve at
levels similar to students in suburban
schools, scoring one point above the nation-
al average of 219. By twelfth grade, rural stu-
dents score about the same as urban
students, two points below the national aver-
age of 287. This slight slippage in rural stu-
dents’ scores from fourth to twelfth grades
shows up in previous NAEP tests—in read-
ing as well as other subjects. Rural students
appear to do better on achievements tests in
elementary school than in high school.
A more profound cause for concern
can be found in data gathered by the
National Center for Education Statistics in
1993-94. First, the good news (see Figure
1-4). In a survey of schools with a twelfth
Achievement and Socioeconomic Characteristics for Rural Schools(2002)
State
Arizona
California
Colorado
Florida
Georgia
Louisiana
Massachusetts
Michigan
Minnesota
North Carolina
Pennsylvania
South Carolina
Texas
Wisconsin
Number of RuralSchools
464
1,106
615
682
990
620
381
1,412
833
1,215
1,267
573
2,344
1,103
% in State
27.3
14.4
40.1
22.8
50.8
45.0
21.1
40.4
51.7
56.6
40.3
54.5
34.9
54.1
% FreeLunch
in RuralSchools
34.1
44.3
30.8
44.1
47.9
62.5
13.1
33.4
32.4
46.1
25.9
59.6
47.0
25.1
StateAverage
43.3
48.1
31.2
47.4
50.0
64.0
27.0
36.6
31.4
45.2
29.9
54.9
48.1
28.2
% Non-white
in Rural Schools
53.6
37.1
21.5
31.8
34.9
40.8
5.0
7.8
8.8
35.1
4.6
49.9
39.5
6.0
Table
1-6
NOTE: Arizona’s poverty data are from 2001. Test scores collected from each state’s department of education.
Source: Demographic data from the National Center for Educational Statistics (NCES),2002 Common Core of Data.
* ρ < .05, two-tailed test of z-score = 0
StateAverage
50.3
59.8
31.6
47.4
47.7
52.1
23.8
25.5
17.9
41.4
20.6
48.3
55.5
17.4
MeanZ-score in Rural Schools
–0.23*
0.11*
0.20*
0.16*
0.10*
0.05
0.28*
0.19*
–0.07
0.06
0.16*
–0.21*
0.16*
0.20*
Schools Poverty Race Achievement
14 The Brown Center Report on American Education
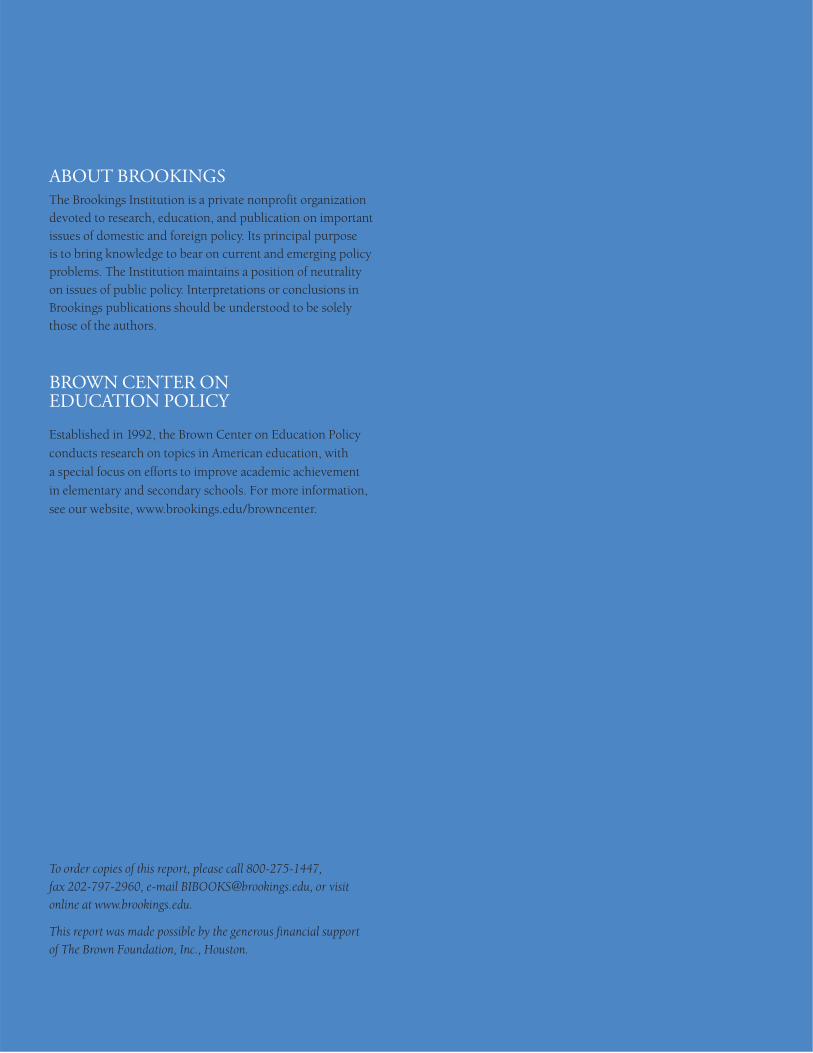
grade, rural schools reported a low drop-out
rate in the senior year. Of students who
started their senior year in the fall, 94.6% in
rural schools graduated in June, compared
to 92.5% in suburban schools and 89.7% in
urban schools. However, the bad news is
that the promising graduation rate does not
convert to a high college application rate.
Only 54.3% of rural seniors apply to col-
lege, compared to 56.5% of urban and
61.6% of suburban seniors. Put another
way, for every 100 suburban high school
graduates, 67 students apply to college. The
comparable figure for urban students is 63
students. For rural schools, it is 57 students.
Nationwide, tens of thousands of
rural students are slipping through the cracks
in the transition from high school to
college. As reported by a recent University
of Chicago study, college matriculation
rates may be pushed down by students want-
ing to stay close to home after high school. In
many rural areas, post-secondary institutions
simply may not exist. Moreover, rural stu-
dents frequently believe that local communi-
ty colleges offer the same college experience
as far-away four-year institutions.11
Summary and DiscussionThis section of the Brown Center Report ana-
lyzed the most recent data on reading and
math achievement. Overall, test scores are
rising. Students continue to make solid
progress in mathematics, but reading
achievement is, at best, only inching for-
ward. Younger students are making greater
academic gains than older students.
Students in rural schools score well
above average on state tests of academic
achievement. Rural students who begin their
Part I The Nation’s Achievement
94.6
54.3
Rural0%
20%
40%
60%
80%
100%
61.6
92.5
Suburban
56.5
Urban
89.7
% Graduating from High School
% Applying to College
Rural 12th graders graduate from high schools in large numbers…
But they are under- represented among college applicants.
Percentage of students
Source: Data obtained from the NCES website “Navigating Resources for Rural Schools”: http://nces.ed.gov/surveys/ruraled
Fig
1-4

Nationwide, tens of
thousands of rural
students are slipping
through the cracks
in the transition from
high school to college.
The Brown Center Report on American Education 15
senior year in high school are also more likely
to graduate in June than seniors in urban or
suburban schools. But the high test scores
and graduation rates are not reflected in high
rates of applying to college. Rural students
are less likely to apply to college than urban
and suburban students. The result is the loss
of potential for rural youth and a loss of tal-
ent for the nation’s colleges and universities.
Recent studies have highlighted several
unique challenges facing rural schools.
Schools in rural areas find recruiting new
teachers difficult. Rural states have many
teachers who teach several subjects, making
it hard to meet the requirement of No Child
Left Behind that teachers major in the aca-
demic subject they teach or pass a test
demonstrating mastery of the subject. The
stipulation that parents whose children
attend failing schools be given the choice
of attending another school nearby is a
daunting endeavor for some rural schools.
On a visit to Alaska in May 2003, Secretary
of Education Rod Paige visited a public
school located on an island where the closest
public school is 164 miles away—across
the Bering Sea.12
These are legitimate problems, and
policymakers should make every effort to see
that they are solved. Policymakers should
also consider programs designed to boost the
rate of rural students applying to colleges
and universities. The academic futures of
rural youth should not end upon completion
of high school.

The Brown Center Report on American Education
Part
IIDO STUDENTSHAVE TOO MUCHHOMEWORK?
The Brown Center Report on American Education

The Brown Center Report on American Education 17
Part II Do Students Have Too Much Homework?
Almost everything in this story is wrong.
A wealth of data exists on the topic of
homework. The evidence paints a more
placid picture than the stories in the press.
The most reliable data support the follow-
ing conclusions: 1) the typical student, even
in high school, does not spend more than
an hour per day on homework, 2) the
homework load has not changed much
since the 1980s, 3) the students whose
homework has increased in the past decade
are those who previously had no homework
and now have a small amount, 4) most par-
ents feel the homework load is about right
and, of those who would like to change it,
more parents would rather see homework
increased than decreased.
Why is it important to get the home-
work story right? Mainly because it is posi-
tively associated with student learning.
Research shows that the relationship of
homework with student achievement is
positive for both middle and high school
students and neutral for elementary school
students. The research does not prove
causality, an ever-present difficulty with
research on many educational practices.
High-achieving students in high school,
for example, may do more homework
because they enjoy studying. They take
tough classes that require a lot of work.
That does not necessarily mean that home-
work is boosting their achievement.
Low-achieving students in elementary
school, on the other hand, may do more
homework because they are struggling
to catch up. The homework is not causing
their learning problems.13
Despite these limitations, the evi-
dence is convincing enough to provide
sober guidance on the current controversy.
Excessive homework is not a common
problem. The critics of homework need to
produce some very powerful evidence
before policymakers start mandating reduc-
tions in homework or even banning it alto-
gether. To date, the evidence put forth by
homework critics has been weak.
So where has the notion of a crushing
homework burden come from? And why has
the press latched onto it with such zeal? Note
that the summary above employs terms such
as “typical student” and “most parents.”
There are children with too much home-
work. There are also parents who believe,
correctly, that their kids are overworked.
Generalizations, however, are meant to apply
generally. Anecdotes can be woven together
to create dramatic stories, but if they apply
only to a small minority of people, they
should not be construed to depict the experi-
ence of the average person. Most parents and
SEVERAL MAJOR NEWSPAPERS AND MAGAZINES HAVE RUN ARTICLES
describing a backlash against homework. The typical story is that
dramatic increases in the amount of homework are robbing American
students of their childhood, turning kids off learning, and destroying
family life. A revolution is brewing. Kids are buried in homework.
Parents are hopping mad, and they’re going to do something about it.

18 The Brown Center Report on American Education
Part II Do Students Have Too Much Homework?
children are comfortable with the current
amount of homework. The amount of home-
work assigned today does not appear out of
line with the amount of homework assigned
in the past.
Yet dramatic stories abound. In 1998,
Newsweek ran an article called “Homework
Doesn’t Help,” which begins by telling the
story of Adam, whose “long, sad battle with
homework” reached a crescendo of three
hours per night in fourth grade. The article
warns that “the trend among schools to pile
on more homework, starting in kindergarten,
could backfire.” Then Time published a 1999
piece, “The Homework Ate My Family: Kids
Are Dazed, Parents Are Stressed, Why Piling
It On Is Hurting Students.” In 2003, People
produced “Overbooked: Four Hours of
Homework for a Third Grader? Exhausted
Kids (and Parents) Fight Back.” Newspapers
have contributed, too. Since 2001, feature
stories about onerous amounts of homework
have appeared in the New York Times,
Washington Post, Chicago Sun-Times, Los
Angeles Times, Seattle Times, Raleigh News and
Observer, The Tennessean, Lexington Herald
Leader, and Tampa Tribune.
Schools piling it on. Kids exhausted.
Parents fighting back. Families being eaten.
Is this the truth about homework? Let’s
examine data addressing two questions.
How much homework do today’s students
have? Has the amount changed appreciably
over time?
The Michigan StudyThe study most often cited to support the
idea that homework has gotten out of con-
trol was conducted by the Population
Studies Center at the Institute for Social
Research, University of Michigan. The
research was led by Sandra L. Hofferth and
John F. Sandberg and focused on how fami-
lies spend their time. Analyzing twenty-four
hour time diaries recorded by randomly
selected families, the researchers compared
data on the activities of children ages 3-12 in
1981 and 1997. Table 2-1 shows the average
number of minutes devoted to activities that
consume at least two hours of children’s time
per week.14
Note that the relevant response catego-
ry is “studying,” which certainly includes
homework but could also include self-initi-
ated studying or studying that parents insist
children do, irrespective of whether the
school sends work home. It ranks quite low
on the list of activities that absorb children’s
time at home. More than studying, kids are
sleeping, going to school, playing, eating,
attending to personal care, participating in
sports, going to daycare, shopping, visiting,
and working around the house. To put it in
perspective, studying ranks close to the cate-
gory “other passive leisure”—board games,
collecting baseball cards, and the like.
For all ages, the amount of weekly
time devoted to studying increased from one
hour 53 minutes in 1981 to two hours 16
minutes in 1997, an increase of 23 minutes.
That is 19 to 27 minutes per day of studying
in 1997 and an increase of about 3-5 min-
utes per day since 1981, depending on
AN ERRONEOUS VIEW FROM THE POPULAR PRESS
Schools piling it on.
Kids exhausted. Parents
fighting back. Families
being eaten. Is this the
truth about homework?
© 1999 TIME Inc., reprinted by permission.

The Brown Center Report on American Education 19
whether weekends are counted. It does not
seem like a backbreaking load. Nor an
extraordinary increase. Time spent on per-
sonal care and sports increased much more.
Watching television decreased by four hours
per week, and some of this freed-up time
may have gone to the 23 minutes of
increased study time. That sounds like cause
for celebration, not hand wringing. Children
have not abandoned TVs. The thirteen and a
half hours that children continue to devote
to television each week is more than six
times the amount of time spent studying.
Changes in time devoted to studying
were driven by a large change for ages 6-8,
mostly first through third graders. The
average amount of study time for that age
group rose from 52 minutes a week to two
hours and 8 minutes, an increase of 76
minutes. Based on a seven day week, the
daily equivalents are about 7 minutes of
homework in 1981 and 18 minutes in 1997,
an increase of 10-11 minutes per day. For
other age groups, changes in the homework
load have been trivial.
Now we’ve reached the nub of the
matter. If one is determined to use the
Michigan data to argue that homework is
onerous, the analysis must be limited to
changes that occurred with ages 6-8. Even
for that age group, the change in study time
was less than meets the eye. The total
increase was no more than 11 minutes per
day. And the average went up primarily
because the percentage of children who had
no homework at all declined. In 1981, only a
third of children ages 6-8 spent any time at
all on studying. In 1997, about half did. So
the rising average has nothing to do with a
crushing homework burden. It is largely
attributable to children with no homework
now receiving a small amount.
A remarkable story—overlooked in
press coverage of the Michigan study—is
found in the other age groups. In every case,
fewer children were doing homework in
1997 than in 1981 (see Figure 2-1, page
20). Even among children ages 9-12, the
oldest group in the study, only 62% spent
time studying at home in 1997, down from
82% in 1981. In other words, more than
one-third of American school children ages
9-12, who are mostly attending fourth
through seventh grades, do not do any
Weekly Time Spent on Activities by Age(hours:minutes)
Sleeping
School
Television
Playing
Eating
Personal Care
Sports
Daycare
Shopping
Visiting
Household Work
Studying
Other Passive Leisure
1981 (N=61)
77:19
14:30
15:14
25:50
9:43
6:18
1:31
0:10
2:35
2:58
2:09
0:25
2:59
1997 (N=665)
76:11
12:05
13:52
17:21
9:24
8:32
4:08
7:30
3:44
3:04
2:20
0:36
2:35
***
***
***
*
1981 (N=60)
70:04
27:52
15:55
14:58
9:08
6:13
6:01
0:12
0:59
3:40
2:49
0:52
1:58
1997 (N=602)
70:49
32:46
12:54
11:10
8:05
7:53
5:13
1:33
2:38
2:48
2:07
2:08
1:33
Table
2-1
*ρ< .05, **ρ<.01, ***ρ<.001, for 1981-1997 changes
Source: Data resorted from Table 2, Sandra L. Hofferth and John F. Sandberg, “Changes in American Children’s Use of Time, 1981-1997,” Children at the Millennium: Where Have We Come From, Where Are We Going? edited by S. Hofferth and T. Owens, (Elsevier Science Ltd., 2001), pp. 193-229.
**
*
**
**
***
***
***
***
1981 (N=101)
65:36
29:02
20:01
7:24
8:13
6:21
4:51
0:18
1:57
3:48
5:18
3:22
3:24
1997 (N=851)
67:24
34:03
13:36
8:54
7:23
7:53
6:33
0:24
2:24
2:40
3:42
3:41
2:19
**
***
***
*
**
***
**
**
***
*
1981 (N=222)
70:01
24:45
17:35
14:30
8:52
6:18
4:15
0:14
1:52
3:32
3:46
1:53
2:53
1997 (N=2119)
71:07
26:48
13:29
12:12
8:13
8:05
5:25
2:57
2:53
2:50
2:49
2:16
2:11
*
**
***
***
***
***
***
**
***
*
***
Age 3-5 Age 6-8 Age 9-12 All Ages

20 The Brown Center Report on American Education
Part II Do Students Have Too Much Homework?
homework. For the broader group of chil-
dren in the Michigan study, ages 3-12, half
did no homework in 1997.
The Michigan study is an example of
carefully conducted social science and the
researchers’ dispassionate reporting of
results. The authors explain that fluctua-
tions in the amount of time that children
engage in various activities should be
understood in the larger context of change
occurring in families. Compared to 1981,
children now spend less time in discre-
tionary activities such as playing and
watching television and more time in struc-
tured activities such as studying, reading,
and participating in arts and sports pro-
grams. With both parents working and
more things to accomplish during the day,
today’s families manage children’s schedules
more carefully. Nevertheless, the study’s
findings have been used to give the impres-
sion that a rising homework burden is
swamping families. “Homework Hours
Tripled Since 1980,” ran the Associated
Press headline.15
This impression does not reflect how
the Michigan study’s authors interpret their
own findings. As to whether the amount of
time studying is large or small, Hofferth and
Sandberg conclude, “While time spent
studying increased significantly between
Age 3-50%
20%
40%
60%
80%
100%
Age 6-8 Age 9-12 All Ages
1981
1997
Fewer children were doing homework in 1997 than in 1981.
Percentage of children who study—at all
The only exception is children aged 6-8, two-thirds of whom did no homework at all in 1981.
26
17
55
34
62
82
46
54
Source: Sandra L. Hofferth and John F. Sandberg, “Changes in American Children’s Use of Time, 1981-1997,” Children at the Millennium: Where Have We Come From, Where Are We Going? edited by S. Hofferth and T. Owens, (Elsevier Science Ltd., 2001), pp. 193–229, Table 1.
Fig
2-1
AN ERRONEOUS VIEW FROM THE POPULAR PRESS
From Newsweek, March 30 © 1998 Newsweek, Inc. All rights reserved.Reprinted by permission.

The Brown Center Report on American Education 21
1981 and 1997, the time spent studying is
still small, only about two hours per week,
and the increase was concentrated among
6-8 year olds.” As to the cause of the
increase among 6-8 year olds, the
researchers explain, “The main reason for
the increase in studying among 6-8 year
olds was an increase in the proportion who
did some studying at all, from one-third
to more than half.” Of the dozens of press
accounts that cited figures from the
Michigan study and were reviewed for this
Brown Center Report, not a single one
quoted how the researchers themselves
interpreted their data.16
Asking Kids How MuchHomework They HaveAs just reported, about 50% of kids have
no homework at all, which means that a
lot of zeros are going into computing the
average student’s homework load. Even
a trivial increase in the average could hide
the fact that students who once had some
homework are suddenly getting a lot more.
An excellent source of data to explore
whether this is happening is the National
Assessment of Educational Progress
(NAEP), which for two decades has been
asking a nationally representative sample
of students how much homework they
had the previous day. Table 2-2 shows
the responses for ages 9, 13, and 17 since
the early 1980s.17
The NAEP data reinforce the notion
that it is students who once had no home-
work who have experienced a change. They
now have some, but not a lot. For 9 year
olds, the question about homework was first
asked in 1984. The proportion with no
assigned homework declined by ten percent-
age points between 1984 and 1999, while
those with less than one hour, the lowest cat-
egory indicating any homework, increased
by twelve points. The same shift, although
less pronounced, is evident at age 13. Students
without assigned homework declined by six
percentage points from 1980 to 1999, and
there was a five point rise in students with
less than an hour.
Seventeen year olds’ homework
appears to have peaked in the surveys
conducted from 1984 through 1992, with
slight decreases since then. Across all three
age groups, the percentage of students
with an hour or more of homework—the
category where the horror stories should
show up—has declined since 1984. In
1999 only about one-third of students at
ages 13 and 17 had an hour or more per
Students Were Asked: How much time did you spend on homework yesterday?(percentage of students)
NoneAssigned
Did Not Do It
< 1 hr.
1-2 hrs.
> 2 hrs.
1984
36
4
41
13
6
1988
29
4
47
13
7
1992
32
4
47
12
5
1996
26
4
53
13
4
Table
2-2
1999
26
4
53
12
5
NoneAssigned
Did Not Do It
< 1 hr.
1-2 hrs.
> 2 hrs.
1980
30
6
32
24
7
1984
23
4
36
29
9
1988
17
4
37
30
11
1992
21
4
36
29
10
1996
22
5
37
27
8
1999
24
5
37
26
8
NoneAssigned
Did Not Do It
< 1 hr.
1-2 hrs.
> 2 hrs.
1980
32
12
24
23
10
1984
22
11
26
27
13
1988
21
13
28
26
12
1992
22
12
29
25
11
1996
23
13
28
24
11
1999
26
13
26
23
12
Age 9
Age 13
Age 17
NOTE: Age 9 students were not surveyed on homework until 1984.
Source: NAEP 1999 Long-term Trend Reading Summary Data Tables for ages 9, 13, and 17.
22 The Brown Center Report on American Education
Part II Do Students Have Too Much Homework?
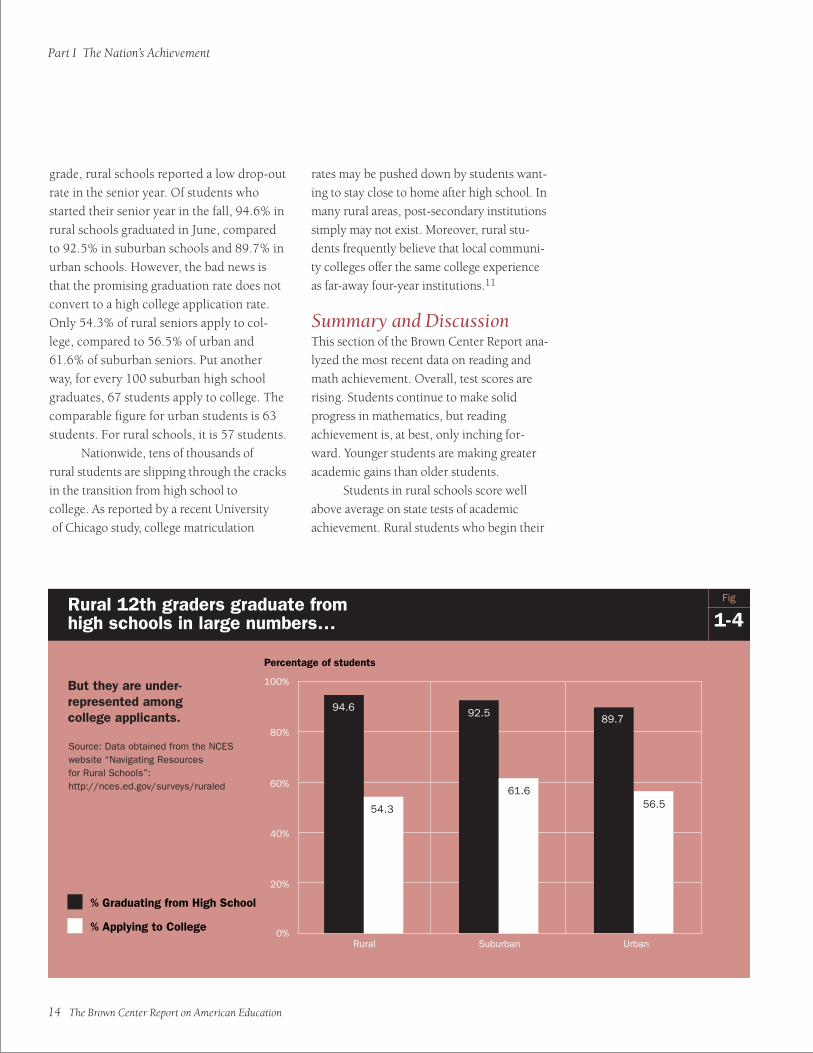
night. And combining the responses “none
assigned,” “did not do it,” and “less than
1 hr” yields the percentage of children with
less than an hour of daily homework. For
1999, the figures are 83% at age 9, 66% at
age 13, and 65% at age 17 (see Table 2-3).
Based on these statistics, it appears
that less than one hour per day is the typical
amount of homework for American children,
even for students in high school. Remember
the third grader in the Newsweek story with
three hours of homework? Or the families in
the Time article, “The Homework Ate My
Family?” Or People asking whether four
hours was too much homework for a third
grader? These tales, though very real to the
children and parents experiencing them, are
what statisticians refer to as “outliers.” They
are not representative. A whopping 83% of
9 year olds have an hour or less of daily
homework. Students with more than two
hours constitute only 5% of 9 year olds.
Reasonable people could argue that two
hours is too much homework for a third
grader, at least on a regular basis. But accord-
ing to survey data, that amount of home-
work is quite rare.
High School StudentsInterestingly, high school students are usual-
ly left out of the public discussions of home-
work. Most of the stories of schools “piling it
on” focus on young children. The NAEP data
give a hint that high school students’ home-
work load might be considered light, with
only about a third of 17 year olds having an
hour or more of daily homework. That does
not sound like a lot for students who are
within a year of graduating from high school.
How does it compare with students in other
countries? It is an extraordinarily light load.
The Third International Mathematics and
Science Survey in 1995 asked students in
their final year of secondary school how
many hours per day they spent studying or
doing homework. Of twenty nations, the
U.S. ranked near the bottom, tied for the
next-to-last position. Students in France,
Italy, Russia, and South Africa reported
spending at least twice as much time on
homework as American students.18
Even when surveys are restricted to
the top high school students in the country,
those who go on to attend college, the
homework load does not appear heavy.
Researchers at UCLA have been surveying
college freshmen nationwide annually
since 1966. The researchers began asking a
question about homework in 1987. That
year, 47% of respondents reported that they
spent more than five hours per week study-
ing or doing homework during the senior
year of high school. The figure has dropped
every year since then, hitting a record low of
34% in 2002 (see Figure 2-2). That means
two-thirds of college-bound high school
seniors have no more than one hour of
homework per night and none on week-
ends. And remember that these are students
who were preparing for college and
probably took the toughest courses that
high schools have to offer—honors,
Advanced Placement, and International
Baccalaureate.19
Two additional findings from the UCLA
survey stand out. First, at the same time stu-
dents are reporting record lows in the amount
of homework given in high school, they are
reporting record high grade point averages.
Almost half, 46%, of the college freshmen
reported graduating from high school with an
A average. Second, in a pattern remarkably
similar to the young children in the Michigan
study, college students in the UCLA survey
seem to live well-rounded lives. Socializing
with friends, working at paid employment,
and exercise and sports took up more of the
students’ time as high school seniors than
Percentage of Students ReportingLess Than an Hour of Daily Homework
Age
9 Year Olds
13 Year Olds
17 Year Olds
Percent
83%
66%
65%
Source: NAEP 1999 Long-term TrendReading Summary Data Tables for ages9, 13, and 17.
Table
2-3

The Brown Center Report on American Education 23
studying and homework. About one-fourth of
college freshmen report that they spent more
than five hours per week partying or watching
television as high school seniors, a little less
than the one-third who spent that much time
studying (see Figure 2-3, page 24).
What Do Parents Think?Impressions matter, and despite the
large amount of empirical evidence to the
contrary, parents may think children have
too much homework. If so, that would
explain the reports of rebellions cropping
up in local areas. What do parents think
about the homework load? Public Agenda
Foundation conducted a poll on the
matter in 2000, surveying a representative
sample of parents. They were asked to eval-
uate their children’s homework load (see
Figure 2-4, page 25). Almost two-thirds,
64%, described the amount of homework
as “about the right amount,” 25% said there
was “too little homework,” and 10%
responded that there was “too much home-
work” (2% responded “don’t know”).20
These attitudes are the opposite of those
expressed by parents in the anti-homework
articles. Most parents are satisfied with the
amount of homework, and of those who
favor a change, more parents would
increase rather than decrease the amount.
Only one out of ten parents believe there is
too much homework.
Summary and DiscussionIn recent years, newspapers and magazines
have published several stories about a
growing amount of homework in the United
States. Facing mounting pressures to per-
form, schools are piling on the homework,
34%More than 5 hours
66%5 hours or less
Two-thirds of college-bound seniors do five hours or less of homework per week.
College freshmen were asked:During your last year in high school, how many hours did you spend in a typical week studying or doing homework?
Fig
2-2
Source: Linda Sax, J.A. Lindholm, A.W. Astin, W.S. Korn, and K.M. Mahoney, The American Freshman: National Norms for Fall 2002, (Higher Education Research Institute, UCLA, 2002).
Most parents are satis-
fied with the amount
of homework, and of
those who favor a
change, more parents
would increase
rather than decrease
the amount.

24 The Brown Center Report on American Education
Part II Do Students Have Too Much Homework?
kids are stressed out, and parents are
demanding relief.
The stories are misleading. They do not
reflect the experiences of a majority—or even
a significant minority—of American school
children. The best social science on the topic,
which consist of studies collecting data from
nationally representative samples of students,
are in general agreement. A University of
Michigan study shows that homework for
elementary schoolchildren has increased
slightly since the early 1980s. But the
increase was due to fewer children ages 6-8
getting no homework and more children
receiving some homework. Homework has
not become overwhelming. Data from NAEP
indicate that more than 80% of children at
age 9 have less than an hour of homework
per day. Only one out of twenty have more
than two hours. For students in middle
school and high school, the amount of home-
work has remained stable—and hardly bur-
densome. According to UCLA’s annual
survey of college freshmen, the homework
required in the senior year of high school is
particularly light. And it has been declining
since the late 1980s. According to the TIMSS
international survey, American high school
students have one of the lightest homework
loads in the world. Parents are not con-
cerned about too much homework.
According to a study by the Public Agenda
Foundation, only one of ten parents want less
homework for their children, 25% want
more, and two-thirds describe the home
work load as about right.
OK, we can all relax; kids aren’t being
worked to death. But what about parents with
legitimate concerns? What should they make
of the homework controversy? The problem
75.8
Socializing with friends
0%
10%
20%
30%
40%
60%
70%
80%
50%58.3
Working (for pay)
49.9
Exercise or sports
33.4
Studying/ homework
26.0
Watching TV
25.1
Partying
14.0
Student clubs/groups
Studying does not dominate the lives of high school seniors.
Socializing, working, and sports command more time than studying.
Students spending more than five hours per week on activities in their last year of high school
Source: Linda Sax, J.A. Lindholm, A.W. Astin, W.S. Korn, and K.M. Mahoney, The American Freshman: National Norms for Fall 2002, (Higher Education Research Institute, UCLA, 2002).
(percentage)
Fig
2-3
According to UCLA’s
annual survey of
college freshmen, the
homework required
in the senior year of
high school is particu-
larly light. And it has
been declining since
the late 1980s.

The Brown Center Report on American Education 25
of too much homework may be exaggerated
in the press, but it can exist. On any particular
school night, the most diligent student in the
world may come home with an unmanageable
amount of homework. Or the most reasonable
teacher in the world may assign an unreason-
able amount. Teachers are human and they
make mistakes. What can parents learn from
the homework controversy that will help
them monitor their children’s workloads? The
following suggestions make the most sense.
1. Take anti-homework articles
with a grain of salt.
Opposition to homework has been a main-
stay of progressive education for the past
100 years. Edward Bok, editor of The Ladies
Home Journal, launched a campaign against
homework in 1900. Bok argued that chil-
dren under the age of 15 shouldn’t be
assigned any homework.21 After an inten-
sive media campaign in the early twentieth
century, progressives managed to persuade
lawmakers in one state, California, to ban
homework. Progressives charged that staying
indoors, reading books, and engaging in
other intellectual activities were unhealthy
for children.
Progressives revere children’s natural
development, which they believe unfolds
through play and self-guided exploration.
Homework is work. It interferes with play. It
is assigned by an adult. Progressives are hos-
tile to homework because “children need
time to be children.” Progressives also
believe that education is best left to experts.
Children who take home schoolwork might
be taught “incorrectly” by their parents. And
parents who scrutinize their children’s home-
work will have a good idea of what’s being
25%Too little
10%Too much
2%Don’t know
64%About right
Parents are not concerned about too much homework.
Parents of K-12 students were asked what they thought about their children’s homework load.
Fig
2-4
Source: Public Agenda Foundation, Questionnaire and Full Survey Results, National Poll of Parents of Public School Students, (Public Agenda Foundation, September 2000).
AN ERRONEOUS VIEW FROM THE POPULAR PRESS
© 2003 People, reprinted by permission.

26 The Brown Center Report on American Education
Part II Do Students Have Too Much Homework?
taught at school, an invitation for parental
meddling in school affairs.22
2. Follow the PTA guidelines
on homework.
Based on the work of Harris Cooper at the
University of Missouri, the Parent-Teacher
Association offers as a rule of thumb
10 minutes of homework per grade—
for example, 30 minutes a night for third
graders, 60 minutes for sixth graders,
90 minutes for ninth graders. That seems
reasonable. However…
3. Understand that homework varies.
Homework fluctuates from day to day.
Teachers assign different amounts depend-
ing on what is being studied. Kids have
days when they are extremely productive
and get a lot of work done at school. Other
days they are not productive, and the work
comes home. Homework also naturally
varies from child to child. Some kids use
every spare minute at school to complete
their work. They take home virtually noth-
ing. Other kids enjoy socializing at school.
Companions are sitting next to them when
they are at school, not when they are at
home in the evenings. Others simply prefer
to work at a leisurely pace. These students
take home full backpacks. Plus, once at
home, some kids spend an hour just to get
ready to do homework—not actually to do
it, mind you, but to get ready—sharpening
a pencil, getting the lighting just right,
making sure that the pet dog is in his prop-
er place, adjusting the mirror on the wall,
pouring a glass of water, sharpening a back-
up pencil...and on and on. Some kids get
right to work and finish quickly. The
upshot is that individual circumstances
must be considered when hearing about
huge amounts of homework. Children
do not all possess the same study habits.
4. If a homework problem exists,
solutions should come from parents and
teachers, not policy interventions.
This recommendation flows from the
previous point. Homework loads vary by
student. Even in the same family, children
experience homework differently. If parents
believe their child has too much home-
work, they should talk to the teacher, or
teachers in the case of high school. It is
a conceptual mistake to try to standardize
school assignments in units of time. If
the page you are currently reading were
assigned to thirty high school students
to read, they would take varying amounts
of time to complete the task. Teachers
should try to standardize the content of
schoolwork, not the time to complete it.
Only teachers and parents working together
can assess the individual circumstances
regarding homework and determine
whether children’s homework loads are
appropriate. Making such decisions away
from classrooms is inappropriate. For
school districts to place limits on home-
work, such as the Piscataway District in
New Jersey recently did, seems unwise.23
For state legislatures to pass laws on home-
work seems downright silly.
Only teachers and
parents working together
can assess the individ-
ual circumstances
regarding homework
and determine whether
children’s homework
loads are appropriate.

The Brown Center Report on American Education
Part
IIICHARTER SCHOOLS:ACHIEVEMENT,ACCOUNTABILITY,AND THE ROLE OF EXPERTISE

28 The Brown Center Report on American Education
Part III Charter Schools: Achievement, Accountability, and the Role of Expertise
The study combined data over three years
to form a composite achievement score
for each school. A three-year composite
smoothes out some of the year to year
fluctuations in test scores. The study dis-
covered that charters score –.24 z-scores or
approximately one-fourth standard
deviation below regular public schools
with similar demographic profiles.
As was cautioned last year, examining
test score levels is not conclusive in evaluat-
ing the effectiveness of charter schooling.
Many parents pull their children out of
regular public schools and send them to
charter schools because of unhappiness
with how much their children are learning.
Researchers call this a “selection effect.”
When low achievers select charter schools,
the effect depresses charter school test
scores irrespective of the quality of educa-
tion charters are providing. Charter schools
may also experience a positive selection
effect by attracting parents who are extraor-
dinarily concerned about their children’s
success at school and are highly motivated
to intervene on their children’s behalf.
Selection effects limit the ability of analysts
to make causal inferences from charter
schools’ test scores. That said, an analysis of
scores does give a reasonable estimate of
how well students in charter schools—or
any other type of school—are functioning
academically at a given point in time. In
discussing charter schools and academic
L AST YEAR’S BROWN CENTER REPORT INCLUDED AN ANALYSIS
of charter school test scores from 1999 through 2001. Following on
the heels of several state-specific studies, the study was the first to assess
charter school achievement nationwide. Brown Center researchers computed
z-scores for charter schools—indexing charter schools’ test scores relative
to the mean and standard deviation of test scores within each state—and
then examined the z-scores nationally. This strategy, although possessing its own
limitations, gets around the problem that states use different achievement
tests and report scores in different metrics.24

The Brown Center Report on American Education 29
achievement, test score levels are a starting
point, not the final word.25
This year’s report offers a follow up
study with several new elements. (Last
year’s sample will be referred to as the 1999
cohort and this year’s as the 2000 cohort.)
The 2000 cohort consists of all charter
schools that were open in 2000 and have
three years of test data—through 2002—in
state databases. The sample size grew from
376 schools in the 1999 cohort to 569
schools in the 2000 cohort. Last year’s anal-
ysis focused on test score levels, with math
and reading scores combined for each year.
This year’s study includes an analysis of
both levels and test score changes from
2000 to 2002. The latter will be referred to
as “gains” or “gain scores” even though loss-
es may occur. Gain scores indicate whether
students in a particular year are scoring
higher or lower than students at the same
school in a previous year.
Both levels and gains play important
roles in accountability systems. The federal
government’s No Child Left Behind Act
requires states to use a school’s achieve-
ment level from a starting year (or “base-
line”) and calculate the annual gains
needed for 100% of students to reach aca-
demic proficiency by 2014. This statistic
becomes the standard by which schools
demonstrate Adequate Yearly Progress
(AYP), the key accountability measure in
the act. Adequate progress is not the same
for all schools. Schools with low baseline
scores have more improvement to make to
get to 100% proficiency and as a conse-
quence have higher AYP targets; those with
higher baseline scores do not have to
improve as much and have lower AYP tar-
gets. Schools failing to meet their AYP tar-
gets face sanctions.
The main lesson from last year’s study
of charter schools was that, compared to
regular public schools, charter schools have
more ground to make up and as a conse-
quence are more likely to be subjected to
sanctions in accountability systems. States
issue annual lists of failing schools facing
possible sanctions. Below, we examine how
often charters appear on the 2003 lists.
This year’s study concludes by scruti-
nizing two forms of expertise found in
charter schools. Conversion charters—
schools that have converted from regular
public schools to charter status—constitute
about one-third of the charter schools
in California. The test scores of conversion
charters in California are analyzed. When
a regular public school converts to a
charter school, the expertise of teachers and
administrators who stay at the school car-
ries over. Conversion schools are funda-
mentally different from charters that start
from scratch.26
A second form of expertise can be
found in educational management
organizations (EMOs). A 2003 study by
the Education Policy Studies Laboratory
at Arizona State University identified 47
companies managing 417 schools in 24
states. Chancellor Beacon Academies,
Edison Schools, The Leona Group, and
National Heritage Academies are among the
most prominent EMOs.27 These firms usu-
ally operate for profit. They either
contract to manage charter schools or hold
charters outright, with authority over
hiring and firing personnel, developing cur-
ricula, and providing instruction.
Proponents of EMOs claim that they inject
new blood into the educational system
by bringing entrepreneurs onto school cam-
puses who may otherwise not be involved
with public education. The study compares
test scores of EMO-managed charter
schools to scores of other charters and regu-
lar public schools.
Schools that have converted from regular public schools to charter schools.
A firm dedicated to operatingschools or districts,usually on a for-profit basis.
EMO(educational management organization)
Conversion charters

30 The Brown Center Report on American Education
Part III Charter Schools: Achievement, Accountability, and the Role of Expertise
Conversions are more
likely to be located in
urban areas than other
charters or regular
public schools and more
likely to serve black
students and students
in poverty.
A caveat. The study is not meant to
serve as an evaluation of charter schools.
The most reliable way to do that is through
a randomized field trial. The fact that seats
in over-subscribed charter schools are
granted by lottery allows for the creation of
randomly selected treatment and control
groups, thereby making it less likely that
selection effects are tainting achievement
outcomes. Randomized field trials are
extremely expensive to conduct, however,
and as of the summer of 2003, one has not
yet been conducted with charter schools.
Charter School AchievementThe study focuses on ten states with signifi-
cant numbers of charter schools. Technical
details can be found in the 2002 Brown
Center Report. Here are the basics. The ten
states administer several different tests to
measure student achievement, so analyzing
raw test scores is only possible within a
single state. To examine the performance of
schools across states, scores must be
expressed in the same metric. Brown Center
researchers converted raw scores to z-scores
for the 569 charter schools and 25,614
regular public schools in the ten states.
The z-score of a school reveals the
school’s performance relative to the state
average—negative scores indicating how far
below average in standard deviation units,
positive scores, how far above average. By
definition, in any particular year, the average
z-score for all schools in a state is 0.00. After
adjusting the z-scores for poverty and racial
composition, we found the average z-score
for the 569 charters in the study. The average
score of –.31 in 2002 means that charter
schools score significantly lower than regular
public schools in their own states with com-
parable demographic characteristics.
In terms of percentile ranks, a z-score
of –.31 is equal to the 38th percentile.
Percentiles range from 1 to 99, with 50 being
the median score, the point at which half
rank above and half rank below. The 50th
percentile is also the average score. A score
at the 38th percentile indicates that about
62% of schools with similar demographic
characteristics have higher test scores than
the average charter school.28
Table 3-1 also reveals that charter
schools made steady improvements in
scores each year, from –.53 in 2000, to –.40
in 2001, to –.31 in 2002. The positive gains
registered by the 2000 cohort of charter
schools are a significant change from last
year’s study. Gains registered from 1999 to
2001 for the 1999 cohort were insignificant
from zero (+.02). Charters’ test scores
rose, but by the same amount as regular
public schools. Test scores for the 2000
cohort of charters, on the other hand, are
rising sharply and the +.22 z-score gain
exceeds the gains made by all public schools
(which also is 0.00 by definition).
What is different about the two
cohorts? The new charters that opened in
2000 did not experience the negative “two
year effect” described in last year’s study. In
the 1999 cohort, test scores were depressed
for the first two years that new charters
were open. In the current study, the 126
charter schools that opened for the first time
in 2000 gained .18 z-scores by 2002.
Charters and AccountabilityHow are charter schools faring under state
accountability systems? Table 3-2 displays
the proportion of charters on state lists of
failing schools, based on lists that were
available on state websites in August, 2003.
Charters are over-represented. The table
displays data for the ten states in the study.
Of 569 charters, 140 schools (24.6%) were
failing. Among all public schools in the
same ten states, 21.3% were failing. This is

The Brown Center Report on American Education 31
the second year in a row that we have found
charters over-represented on state failure
lists. The comparable figures in 2002
were 18.6% for charters and 12.3% for all
public schools, so the over-representation
is shrinking.29 A cautionary word. States
may change policies regarding how failing
schools are identified, and a single state can
strongly influence the national average.
Pennsylvania ratcheted up its standards in
2003. In the cohort of charter schools
studied last year, none from Pennsylvania
were failing. This year, 25 out of 32 charters
appear on the state’s failing schools list.
The statewide failure rate for all public
schools in Pennsylvania increased from
8.4% to 40.3%.
As noted above, failure in account-
ability systems is predicated on two aspects
of test scores—level and gain. For the 1999
cohort, findings were negative in terms
of levels and neutral in terms of gains. So
it is not surprising that a larger share of
charters than regular public schools were
found on lists of failing schools. The 2000
cohort fares a little better. The news is
again negative in terms of levels, but the
significant gains that charters have made
on achievement tests have kept many of
them off failing schools lists.
California ConversionsCalifornia has the largest proportion of
conversion charter schools of any state in
the nation. After the state’s 1992 charter
law was enacted, most of the schools char-
tered in the first few years were conver-
sions. Since then start-ups have dominated
as new, independent schools were launched
by parents, teachers, concerned citizens,
and entrepreneurs. Conversions constituted
about one-third of the state’s charters oper-
ating in 2000.30 Schools may petition local
school boards for permission to convert to
charter status. If the petition is denied,
schools may appeal to the local county
board of education. Unlike several states,
California prohibits private schools from
becoming charters. Conversions are freed
from district regulations beyond those
that are negotiated with districts during the
conversion process and stipulated in the
charters. Some charter schools contract with
former districts to provide food services,
transportation, or administrative services.31
Charter School Achievement(scores expressed as adjusted z-scores, N=569)
Z-score
2000
–0.53*(0.05)
2001
–0.40*(0.05)
2002
–0.31*(0.05)
2000-2002Z-score Gain
+0.22*(0.04)
Table
3-1
* ρ < .05, two-tailed test of z-score = 0
NOTE: Z-scores adjusted for poverty and racial composition. Standard error in parentheses.
Number of Failing Charter Schools(August 2003)
State
Arizona
California
Colorado
Florida
Massachusetts
Michigan
Minnesota
Pennsylvania
Texas
Wisconsin
Total
Schools in Study
71
132
51
59
26
111
21
32
48
18
569
NumberFailing
8
69
1
0
9
13
7
25
6
2
140
PercentFailing
11.2%
52.2%
2.0%
0.0%
34.6%
11.7%
33.3%
78.1%
12.5%
11.1%
24.6%
Schools in State
1,489
8,238
1,516
2,616
1,858
3,512
1,969
3,172
6,894
2,065
33,329
NumberFailing
346
3,715
86
10
209
121
265
1,279
1,000
72
7,103
Table
3-2
NOTE: Each state has its own criteria, based on individual state tests, for determining whether or not aschool is failing.
Source: Data compiled from respective state department of education websites.
PercentFailing
23.2%
45.1%
5.7%
0.3%
11.2%
3.4%
13.4%
40.3%
14.5%
3.5%
21.3%
Charter Schools All Public Schools

32 The Brown Center Report on American Education
Part III Charter Schools: Achievement, Accountability, and the Role of Expertise
Table 3-3 displays characteristics of
the conversions. They are much larger than
other charters. With a median enrollment
of 633 students, conversions resemble
California’s traditional public schools in
size. Conversions are more likely to be
located in urban areas than other charters
or regular public schools and more likely
to serve black students and students in
poverty. Although conversions are only
about one-third of charters in California,
they constitute exactly one-half of the
current study’s 2002 cohort of charters.
Conversions are more likely to show up
in this sample because they tend to be
older, larger charters and therefore more
likely to have met the requirements for
the study (i.e., have three consecutive
years of test data).
Table 3-4 exhibits the z-scores of
the different types of schools, adjusted for
racial composition and poverty. Conversions’
test scores are higher than those of other
charters and regular public schools. In 2002,
conversions scored .20 z-scores above the
average school in California with similar
demographic characteristics. This is equal to
about the 58th percentile. Start-up charters
scored significantly below average (–.40),
at approximately the 34th percentile.
Charters as a whole scored –.10, which is
statistically indistinguishable from 0.00, the
average for California’s regular public
schools. The change in scores from 2000 to
2002 is essentially the same for conversions,
start-ups, and regular public schools.
This raises an important drawback of
using z-scores to track changes in test
scores. Z-scores are relative scores. They
tell us how one competitor is doing in a
race—outdistancing the others or falling far
behind—but they do not reveal whether the
participants as a group are running or walk-
ing. In other words, by themselves z-scores
cannot tell us whether test scores are going
up, down, or sideways. In Table 3-4, they
only tell us that—whatever the direction—
the scores of conversion charters, start-up
charters, and regular public schools have
changed approximately the same amount.
None of the three types of schools stand out
as having improved or declined more than
the others.
David Rogosa of Stanford University
has written extensively on achievement
in California schools. Rogosa cautions that
making comparisons based on residuals
from regression equations, as the z-scores
presented here do to control for demo-
graphic characteristics, may produce mis-
leading results—especially when applied
to changes in test scores. He points out that
researchers often imply that they are
answering the question, “How much would
the school have changed if all schools had
started out equal? rather than the answer-
able question, how much did the school
improve?”32 As useful as regression analy-
sis may be, it cannot answer questions
about imagined conditions. And packing
several variables into regression equations
in order to isolate the effects that are of pri-
mary interest may increase the chances of
getting the story wrong.
As a check on the preceding analysis,
we examined the national percentile rank-
ings (NPRs) of conversion charters on the
Stanford Achievement Test (SAT-9) from
2000-2002 and the gains schools registered
Granting charter status to existing schools, in other words,
has probably functioned more as a reward for demonstrating
success than as a turn-around or intervention strategy for
low performance.

The Brown Center Report on American Education 33
in NPRs during the same period. Table 3-5
presents the data. In 2002, charters scored
at about the 50th percentile. Regular
public schools scored slightly higher, at the
52.7 percentile. From 2000 to 2002, the
different types of schools all gained 3 to 4
percentile points.
These results clarify the findings pre-
sented above. Let’s sum them up. From
2000 to 2002, test scores of charter schools
in California were lower than those of regu-
lar public schools. During the same period,
scores rose by about the same amount in
California’s charter and regular public
schools—3 to 4 percentile points on the
SAT-9. Among the charters, conversions
and start-ups scored at about the same
level, and their scores increased about the
same amount from 2000 to 2002. Any anal-
ysis that controls for demographic charac-
teristics will find conversions scoring
significantly higher than both start-ups and
regular public schools. This is because con-
versions serve large numbers of students
with socioeconomic characteristics that are
correlated with low test scores. Gain scores
look about the same for conversions and
start-ups when demographic controls are
employed with the data.33
Many conversion charters are produc-
ing average test scores with populations of
children historically associated with low
test scores. These schools may be doing
something that is worth identifying and dis-
seminating to others. The phenomenon
may also be related to how conventional
public schools convert to charter status.
Local school boards grant charters in
California. They are probably reluctant to
approve charter petitions coming from a
district school unless the petitioners have a
solid track record. Granting charter status
to existing schools, in other words, has
probably functioned more as a reward for
Characteristics of California Conversion Charter Schools(2002)
Enrollment (median)
Poverty
White
Black
Hispanic
Asian
Urban
Suburban
Rural
Conversion Charters(N=66)
633
58%
33%
19%
41%
6%
55%
36%
8%
Start-up Charters(N=66)
234
42%
57%
13%
23%
4%
40%
38%
22%
California Regular Public Schools
(N=6,623)
669
49%
38%
8%
41%
11%
34%
55%
12%
Table
3-3
NOTE: Mean enrollments: Conversion = 746, Start-up = 487, CA Regular Public School = 837
California Charter School Achievement(scores expressed as adjusted z-scores)
Regular Public Schools(N=6,623)
All Charters(N=132)
Conversion Charters(N=66)
Start-up Charters(N=66)
2000
0.00(.01)
–0.08(.07)
0.24*(.08)
–0.39*(.11)
2001
0.00(.01)
–0.07(.07)
0.24*(.07)
–0.39*(.12)
2002
0.00(.01)
–0.10(.08)
0.20*(.08)
–0.40*(.12)
2000-2002 Z-score Gain
0.00(.01)
–0.02(.06)
–0.04(.07)
–0.01(.08)
Table
3-4
* ρ < .05, two-tailed test of z-score = 0
NOTE: Conversion charter scores are statistically significantly different (p < .05) from start-up charterscores in all years. Z-scores adjusted for poverty and racial competition. Standard error in parentheses.
California Charter School Achievement(scores expressed as unadjusted national percentile ranks)
Regular Public Schools(N=6,623)
All Charters(N=132)
Conversion Charters(N=66)
Start-up Charters(N=66)
2000
49.2(0.2)
46.5(1.7)
46.3(2.5)
46.7(2.3)
2001
51.2(0.2)
48.9(1.7)
48.6(2.5)
49.1(2.3)
2002
52.7(0.2)
50.1(1.7)
50.2(2.4)
50.0(2.3)
2000-2002NPR Gain
+3.5(0.1)
+3.6(0.9)
+3.9(1.3)
+3.3(1.3)
Table
3-5
NOTE: SAT-9 scores used to measure achievement. Standard error in parentheses.

34 The Brown Center Report on American Education
Part III Charter Schools: Achievement, Accountability, and the Role of Expertise
demonstrating success than as a turn-
around or intervention strategy for low per-
formance. This is important for researchers
to note. The selection factors that plague
the evaluation of charter school achieve-
ment may play out differently with conver-
sions, especially if a school has
institutional prestige that precedes its
charter status.
Educational ManagementOrganizations (EMOs)EMOs operate 90 charter schools in the
study’s sample of ten states (see Table 3-6).
Michigan dominates the EMO landscape,
with 62 of the 90 schools located there.
Like California’s conversions, the EMO
schools are larger than the average charter.
Compared to both other charters and regu-
lar public schools, they serve a larger pro-
portion of black children and children in
poverty and are more likely to be located in
urban communities. They are less likely to
serve Hispanic students, which is due to
relatively few EMOs operating in states
such as California, Florida, and Texas with
large Hispanic populations.
Charters run by EMOs typically
target low-achieving students. Table 3-7
reveals that EMOs scored significantly
below non-EMO charters and further
yet below regular public schools, with
controls in place to compare schools with
similar demographic characteristics. The
EMO charters’ z-score in 2000 (–1.00)
was equal to about the 16th percentile.
In contrast to conversion charters, EMO-
operated charters apparently are not
brought in to manage schools in recogni-
tion of schools’ success, but to intervene in
the case of school failure.
EMOs are controversial. Many people
are hostile to the notion of firms profiting
financially from public schools. When
charter authorizers consider approving
an EMO-operated charter, it often gener-
ates intense political opposition. The test
score data suggest that in situations where
student achievement is extremely low,
the political opposition to EMOs may
be weakened.34
EMO-operated charters registered
solid gains in test scores from 2000 to 2002
(see last column, Table 3-7), significantly
out-gaining non-EMO charter schools with
similar demographic profiles. In 2002, the
test scores of the 90 EMO charters in the
study had moved up to approximately the
28th percentile (z-score of –.58). To run a
check on the analysis using raw test scores,
we analyzed the scores of EMO-operated
charters in Michigan on the Michigan
Educational Assessment Program (MEAP).
The z-score and raw score treatments yield-
ed essentially the same results. EMO-operat-
ed charters score significantly lower than
regular public schools and non-EMO char-
ters but registered greater test score gains
from 2000 to 2002.
Summary and ConclusionThis section of the report analyzed test
score data of charter schools. As was found
last year in the first segment of the study,
test scores in charter schools lag behind the
scores of regular public schools. Charter
schools in this year’s study—contrary to the
charters in last year’s—registered significant
gains in test scores from 2000 to 2002. On
the lists of failing schools that states com-
piled in both 2002 and 2003, charter
schools are over-represented.
Two forms of expertise were exam-
ined by analyzing achievement data from
conversion charters in California and EMO-
operated charters in several states. In 2002,
the conversion charters scored at approxi-
mately the 50th percentile on reading and
Future research should
focus on identifying the
broadest range of
policies and practices
that are capable of
creating achievement
successes out of
achievement failures.

The Brown Center Report on American Education 35
math tests. From 2000 to 2002, they made
gains comparable to those of start-up char-
ters and regular public schools. Conversions
produced average test scores despite a
demographic profile that is usually correlat-
ed with low scores.
A recent study by Bruce Fuller at the
University of California, Berkeley found
that charter schools have fewer fully certi-
fied teachers than regular public schools.35
Conversion charters are an exception, with
their teachers comparable to those of regu-
lar public schools in experience and certifi-
cation. Can the conversions’ solid test
scores be attributed to teachers’ expertise?
Perhaps, but not necessarily. The test scores
of non-conversion charters are improving
just as much. And, as noted above, neither
Fuller’s nor this study can control for selec-
tion effects—in terms of which schools
were allowed to convert or the students
who chose to attend conversions and start-
ups. Much more research is needed com-
paring the performance of conversion and
start-up charters.
The test scores of charters operated
by educational management organizations
were also examined. Compared to regular
public schools and to other charters serving
students with similar socioeconomic
characteristics, EMO-operated charters
have much lower test scores. This is almost
certainly because companies have been
chartered to run already low-performing
schools or to create new schools serving
low-performing students. Gains made from
2000 to 2002 have been significantly larger
than those of both non-EMO charters
and regular public schools. Again, causality
cannot be determined conclusively. However,
importing management expertise from the
private sector should be explored further
as an option for improving low-achieving
schools. The results presented here are
quite positive for EMOs. The findings raise
doubts about a strain of thought in the
charter school movement: that anyone can
successfully start and operate a school if
he or she merely possesses abundant energy
and a love of children. In the extreme, this
form of romanticized amateurism dismisses
the importance of educational expertise.
That appears unwise. Future research should
focus on identifying the broadest range
of policies and practices that are capable
of creating achievement successes out of
achievement failures.
EMO Charter Achievement(scores expressed as adjusted z-scores)
Regular Public Schools(N=25,614)
All Charters(N=569)
EMO Charter(N=90)
Non-EMO Charter (N=479)
2000
0.01(.01)
–0.53*(.05)
–1.00*(.10)
–0.44*(.06)
2001
0.01(.01)
–0.40*(.05)
–0.69*(.09)
–0.35*(.06)
2002
0.01(.01)
–0.31*(.05)
–0.58*(.08)
–0.26*(.05)
2000-2002Z-score Gain
0.00(.01)
+0.22*(.04)
+0.41*(.08)
+0.18*(.05)
Table
3-7
* ρ < .05, two-tailed test of z-score = 0
NOTE: Z-scores adjusted for poverty and racial composition. Standard error in parentheses.
Characteristics of EMO Charter Schools(2002)
Enrollment (median)
Poverty
White
Black
Hispanic
Asian
Urban
Suburban
Rural
EMO(N=90)
498
53%
43%
41%
14%
1%
45%
41%
15%
Non-EMO(N=479)
248
47%
51%
25%
19%
3%
52%
33%
15%
Regular Public School(N=25,614)
546
42%
57%
12%
25%
5%
30%
40%
29%
Table
3-6
NOTE: Mean enrollments are: EMO = 507, Non-EMO = 369, Regular Public School = 664

36 The Brown Center Report on American Education
1 Approximating one year’s growth on NAEP is explained in the 2000 Brown Center Report on AmericanEducation, p. 7.
2 Richard L. Allington, “Does State and FederalReading Policymaking Matter?” in The GreatCurriculum Debate: How Should We Teach Reading andMath? edited by Tom Loveless, (Brookings InstitutionPress, 2001), pp. 268-298.
3 Linda Dager Wilson and Rolf K. Blank, ImprovingMathematics Education Using Results from NAEP andTIMSS, (Council of Chief State School Officers, 1999).
4 National Commission on the High School Senior Year, The Lost Opportunity of Senior Year: Finding a Better Way, (National Commission on the High SchoolSenior Year, 2001).
5 The counts were stable across years.
6 School funding data reported in “Public Elementaryand Secondary Students, Schools, Pupil/Teacher Ratios, and Finances, by Type of Locale: 1998 and1999” on the National Center for Education Statistics“Navigating Resources for Rural Schools” website(http://nces.ed.gov/surveys/ruraled). Cost of livingfigures from Mark Nord, “Does It Cost Less to Live in Rural Areas? Evidence from New Data on FoodSecurity and Hunger,” Rural Sociology, vol.65, no.1 (March, 2000), pp. 104-125.
7 The Rural School and Community Trust, Why RuralMatters 2003, (The Rural School and CommunityTrust, 2003).
8 “Navigating Resources for Rural Schools,” National Center for Education Statistics website:http://nces.ed.gov/surveys/ruraled
9 Dana Markow and Marc Scheer, The MetLife Surveyof The American Teacher 2002: Student Life: School,Home, and Community,(MetLife, Inc., 2002); LowellRose and Alec Gallup, “The 34th Annual Phi DeltaKappa/Gallup Poll Of the Public’s Attitudes Toward thePublic Schools,” Phi Delta Kappan supplement(September, 2002).
10 Richard Ingersoll, “Teacher Turnover and TeacherShortages: An Organizational Analysis,” AmericanEducational Research Journal, vol. 38 no. 3 (Fall, 2001),pp. 499-534; also see U.S. Department of Education,National Center for Education Statistics, Digest of Education Statistics 2001, (NCES 2002-130, U.S.Government Printing Office, 2002), Table 75.
11 Mihaly Csikszentmihalyi and Barbara Schneider,Becoming Adult: How Teenagers Prepare for the World ofWork, (Basic Books, 2001). Also see U.S. Department of Education, National Center for Education Statistics,Digest of Education Statistics 2001, (NCES 2002-130,U.S. Government Printing Office, 2002), Table 186.
12 CNN.com, “Alaskan Schools Mired in RusticConditions,” May 14, 2003.
13 Harris Cooper, The Battle Over Homework:Common Ground for Administrators, Teachers andParents, (Corwin Press, 2001).
14 Sandra L. Hofferth and John F. Sandberg,“Changes in American Children's Use of Time, 1981-1997,” Children at the Millennium: Where Have We ComeFrom, Where Are We Going? edited by S. Hofferth and T.Owens, (Elsevier Science Ltd., 2001), pp. 193-229.
15 The website for CBS Evening News lists a story forDecember 10, 2002, “Study Says Kids’ HomeworkLoad Bigger,” which includes the following, “Since1981, homework has stayed about the same for highschool students—but for 6- to 9-year olds, it’s tripled.”The report does not list a source. The Michigan studydid not include high school students, but the CBSreport’s reference to 1981 and ages 6 to 9, reasonablyclose to the ages 6 to 8 category in the study, indicatesit probably was the source. The website forCNNfyi.com includes an AP story, July 25, 2001,“Homework Hours Tripled Since 1980,” stating thefollowing, “One University of Michigan study suggeststhat young children are seeing up to three times asmuch homework as children did 20 years ago.”
16 Sandra L. Hofferth and John F. Sandberg,“Changes in American Children's Use of Time, 1981-1997,” Children at the Millennium: Where Have We ComeFrom, Where Are We Going? edited by S. Hofferth and T.Owens, (Elsevier Science Ltd., 2001), pp. 218, 226.
17 NAEP Reading 1999 Long-term trend summarydata. Other NAEP surveys ask for a daily estimateusing different response categories. The results lead toessentially the same conclusions reached here.
18 Maryellen Harmon, Teresa A. Smith, Michael O.Martin, Dana L. Kelly, Albert E. Beaton, Ina V.S. Mullis,Eugenio J. Gonzalez, and Graham Orpwood,Performance Assessment in IEA’s Third InternationalMathematics and Science Study, (The InternationalStudy Center at Boston College, 1997).
19 Linda Sax, Jennifer Lindholm, Alexander Astin,William Kirn, and Kathryn Mahoney, The AmericanFreshman: National Norms for Fall 2002, (HigherEducation Research Institute, UCLA, 2002).
20 Public Agenda Foundation, Questionnaire and FullSurvey Results, National Poll of Parents of Public SchoolStudents, (Public Agenda Foundation, 2000).
21 Diane Ravitch, Left Back: A Century of Failed SchoolReforms, (Simon & Schuster, 2000), p. 90.
22 Brian Gill and S.L. Schlossman, “ ‘A Sin AgainstChildhood’: Progressive Education and the Crusade to Abolish Homework, 1897- 1941,” American Journalof Education, vol. 105, no. 1 (November, 1996), pp. 27-66; Gill and Schlossman, “Parents and thePolitics of Homework: Some Historical Perspectives,”Teachers College Record, vol. 105, no. 5 (June, 2003),pp. 846-871.
23 CNN.com “Restrictions on Homework Put NewJersey School District in Spotlight,” October 23, 2000.
24 Some limitations: z-scores do not tell whether testscores are rising or falling statewide; and they mayimply that one standard deviation in one state is equalto one SD in another.
25 Gains provide a better control if the basis onwhich selection occurs remains stable from the startand end point of the time period for which the gain iscalculated.
26 For the challenges facing start from scratch char-ters, see Tom Loveless and Claudia Jasin, “Startingfrom Scratch: Organizational and Political ObstaclesFacing Charter Schools,” Education AdministrationQuarterly, vol. 34, no. 1 (February, 1998), pp. 9-30.
27 Alex Molnar, Glen Wilson, and Daniel Allen,Profiles of For-Profit Education Management Companies:Fifth Annual Report 2002-2003, (Education PolicyStudies Laboratory, Arizona State University, 2003)
28 Last year’s calculations were weighted by enroll-ment to give larger schools more influence than small-er schools. For the sake of simplicity, we did notweight the means reported this year. Two reasons: (1)The three-year composite already smoothes out fluctuations that are endemic to small schools’ testscores. (2) When we ran the analyses using weights,the results were not significantly different from theoutcomes reported here.
29 Failing lists for 2002 are analyzed in Tom Loveless“Charter School Accountability and Achievement,” inLeave No Child Behind: The Politics and Practice of SchoolAccountability, edited by Paul Peterson and MartinWest, (Brookings Institution Press, forthcoming).
30 Priscilla Wohlstetter, Noelle C. Griffin, andDerrick Chau “Charter Schools in California,” in TheCharter School Landscape, edited by Sandra Vergari,(University of Pittsburgh Press, 2002), pp. 32-53.
31 Web information on California conversions isavailable at: http://www.cde.ca.gov/charter/about.html
32 David Rogosa, “Student Progress in California Charter Schools, 1999-2002,” (California Department of Education, 2003).
33 Rogosa finds, and our data confirm, that gainscores have a modestly positive association with indica-tors of poverty. This is enormously intriguing, and wehope to explore it in greater depth in the future. SeeRogosa, 2003, for his discussion.
34 For an example of strong public backlash againstEMO-operated schools, note the case of EdisonSchools’ withdrawal from San Francisco in JulianGuthrie, “S.F. Schools Vote to End Edison Compact,”San Francisco Chronicle, June 29, 2001.
35 See the working paper by Bruce Fuller, MarytzaGawlik, Emlel Kuboyama Gonzales, Sandra Park, andGordon Gibbings, “Charter Schools and Inequality:National Disparities in Funding, Teacher Quality, andStudent Support,” (Policy Analysis for CaliforniaEducation, 2003).
ENDNOTES

Des
igne
d by
Lip
man
Hea
rne,
Chi
cago
/Was
hing
ton
THE BROOKINGSINSTITUTION
STROBE TALBOTTPresident
CAROL GRAHAMVice President and Director of Governance Studies
BROWN CENTER STAFF
TOM LOVELESSSenior Fellow and Director
PAUL T. HILLNon-resident Senior Fellow
DIANE RAVITCHNon-resident Senior Fellow
PAUL DIPERNASenior Research Analyst and Brown Center Manager
JOHN COUGHLANResearch Assistant
KATHLEEN ELLIOTT YINUGCoordinator Brookings Papers on Education Policy
ADVISORY & REVIEW BOARD
CHRISTOPHER N. AVERYHarvard University
PAUL T. HILLUniversity of Washington
THOMAS J. KANEUniversity of California-Los Angeles
DIANE RAVITCHNew York University
BARBARA SCHNEIDERUniversity of Chicago
RESEARCH VERIFIER
JIMMY KIMHarvard University
Views expressed in this report are solely those of the author.

1775 Massachusetts Avenue, NW • Washington, DC 20036Tel: 202-797-6000 • Fax: 202-797-6004
www.brookings.edu
Tel: 202-797-6426 • Fax: 202-797-2968www.brookings.edu/browncenter