Embed Size (px)
Citation preview
The 2015 Refugio Beach Oil Spill: Field and Laboratory Assessment of Injury
to Grunion (Leuresthes tenuis)
August 2019
Karen Martin, Ph.D., Professor of Biology, Pepperdine University, Malibu, CA
David Witting, Ph.D., Fisheries Biologist, National Oceanic and Atmospheric Administration, Fisheries Restoration Center, Long Beach, CA
Regina Donohoe, Ph.D., Staff Toxicologist, California Department of Fish and Wildlife, Office of Spill Prevention and Response, Monterey, CA

2
Table of Contents
INTRODUCTION ............................................................................................................. 3
METHODS ...................................................................................................................... 4
Spawning Observations ............................................................................................... 4
Field Collection of Grunion Eggs .................................................................................. 5
Laboratory Hatching ..................................................................................................... 5
Estimates of Baseline Grunion Embryo Mortality Rates ............................................... 6
Analytical Methods ....................................................................................................... 6
RESULTS ........................................................................................................................ 7
Spawning Observations ............................................................................................... 7
Egg Collection Observations ........................................................................................ 8
Grunion Egg and Sand Chemistry ............................................................................. 12
Hatching Observations in the Laboratory ................................................................... 14
Primary Hatching and Mortality Rates ........................................................................ 14
Delayed Hatching and Mortality Rates ....................................................................... 17
Post-hatching Survival of Grunion from Oil-Exposed and Reference Beaches .......... 19
REFERENCES .............................................................................................................. 20
3
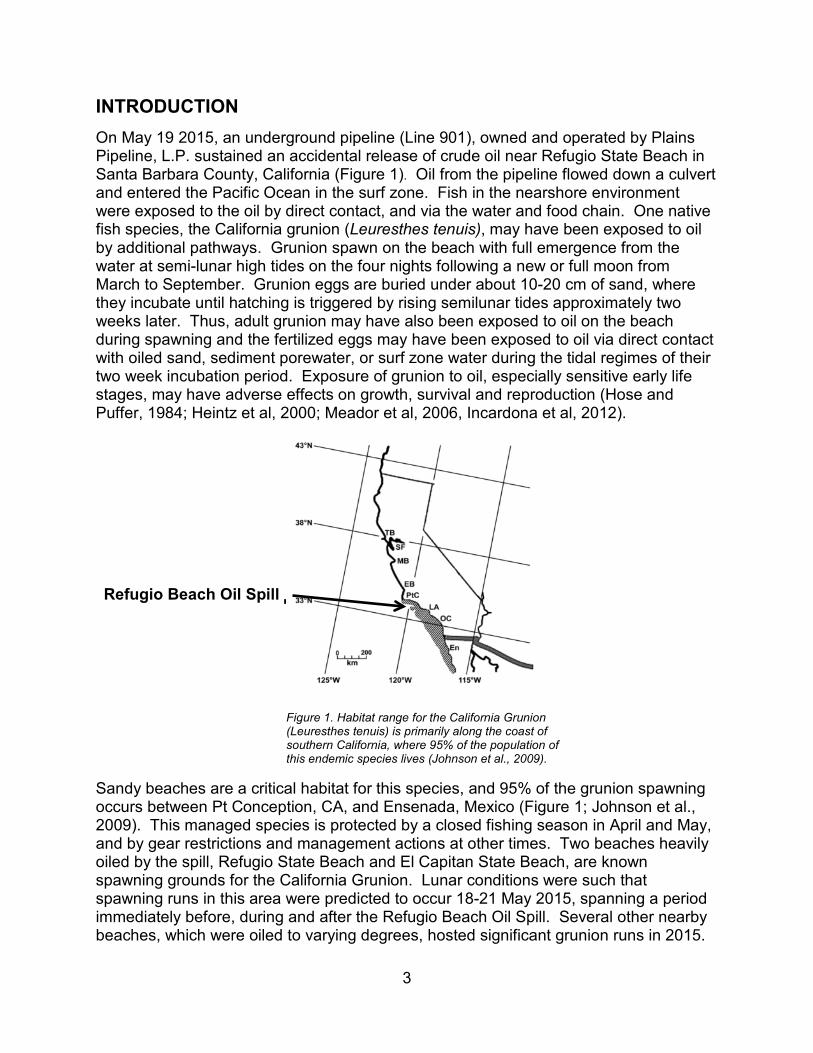
INTRODUCTION On May 19 2015, an underground pipeline (Line 901), owned and operated by Plains Pipeline, L.P. sustained an accidental release of crude oil near Refugio State Beach in Santa Barbara County, California (Figure 1). Oil from the pipeline flowed down a culvert and entered the Pacific Ocean in the surf zone. Fish in the nearshore environment were exposed to the oil by direct contact, and via the water and food chain. One native fish species, the California grunion (Leuresthes tenuis), may have been exposed to oil by additional pathways. Grunion spawn on the beach with full emergence from the water at semi-lunar high tides on the four nights following a new or full moon from March to September. Grunion eggs are buried under about 10-20 cm of sand, where they incubate until hatching is triggered by rising semilunar tides approximately two weeks later. Thus, adult grunion may have also been exposed to oil on the beach during spawning and the fertilized eggs may have been exposed to oil via direct contact with oiled sand, sediment porewater, or surf zone water during the tidal regimes of their two week incubation period. Exposure of grunion to oil, especially sensitive early life stages, may have adverse effects on growth, survival and reproduction (Hose and Puffer, 1984; Heintz et al, 2000; Meador et al, 2006, Incardona et al, 2012).
Refugio Beach Oil Spill
Figure 1. Habitat range for the California Grunion (Leuresthes tenuis) is primarily along the coast of southern California, where 95% of the population of this endemic species lives (Johnson et al., 2009).
Sandy beaches are a critical habitat for this species, and 95% of the grunion spawning occurs between Pt Conception, CA, and Ensenada, Mexico (Figure 1; Johnson et al., 2009). This managed species is protected by a closed fishing season in April and May, and by gear restrictions and management actions at other times. Two beaches heavily oiled by the spill, Refugio State Beach and El Capitan State Beach, are known spawning grounds for the California Grunion. Lunar conditions were such that spawning runs in this area were predicted to occur 18-21 May 2015, spanning a period immediately before, during and after the Refugio Beach Oil Spill. Several other nearby beaches, which were oiled to varying degrees, hosted significant grunion runs in 2015.

4
In addition to evaluating direct impacts of Line 901 oil on grunion, the life history and accessibility of grunion early life stages make them an ideal model for evaluating the impacts of Line 901 oil on marine fish early life stages in field conditions. The objectives of this assessment were to: 1) document exposure pathways by verifying grunion were present and spawning in the spill-affected area; 2) quantify exposure of grunion eggs to oiling conditions in the spill affected area during the month after the spill, 3) initiate evaluation of potential effects of oiling on grunion early life stages that may have occurred during the spawning runs during the month after the spill and 4) evaluate potential effects of oiling one year after the spill. Beach sampling locations were selected because they were suitable for grunion spawning and represented varying degrees of Line 901 oiling (Figure 2). Refugio State Beach and El Capitan were heavily oiled, while East Beach received only light tarball oiling. It should be noted that several natural oil seeps are known to occur in the Santa Barbara Channel, especially near Coal Oil Point (Lorensen et al., 2009). Forensic chemistry analysis was used to distinguish between Line 901 oil and seep oil (Stout, 2016). A long-term grunion monitoring location, Topanga State Beach, Malibu, California, served as another reference location.
Figure 2. Grunion spawning observation and sampling locations.
METHODS
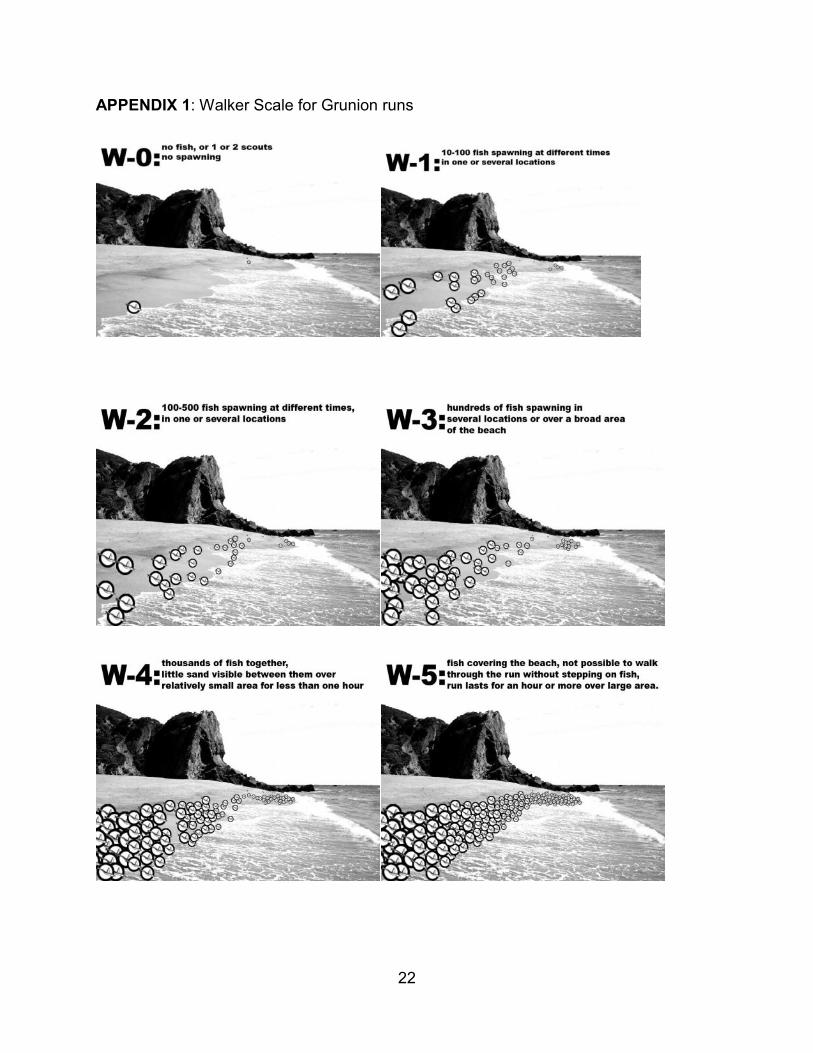
Spawning Observations Beach observations occurred on the evening high tides from approximately 2300-0130 hours on the dates of the anticipated grunion runs. Observations were made at Refugio State Beach, El Capitan State Beach, and, East Beach (Figure 2). A standard data collection form developed by the Grunion Greeter1 program was used to collect information on the density of a run, using the Walker Scale (Appendix 1), as well as conditions that might affect grunion spawning. The GPS locations of the spawning runs were recorded, and the runs were photo-documented. The Grunion Greeter database was also queried to identify spawning locations in the spill affected area that were reported by trained volunteer monitors.
1 Grunion Greeter, a citizen science group, works in conjunction with local university researchers, non-profits and government agencies to observe and record beaches on nights of grunion runs during the peak season ( http://grunion.pepperdine.edu/ggproject.htm )

5
Field Collection of Grunion Eggs Grunion eggs and the surrounding sand were collected from oiled (Refugio State Beach, El Capitan State Beach) and reference (East Beach, Topanga State Beach) beaches after multiple spawning events in 2015 and 2016. Eggs were collected five to seven days after the 2015 spawning observations, eight days after spawning in May 2016 and one day after spawning in June 2016. Grunion nests were located by digging with a gentle scraping motion in the sand where grunion spawning was observed. When a clutch was found, the GPS location, depth of the clutch in the sand and egg color were noted, and a photograph was taken. Grunion eggs are typically orange in color. Approximately half of the clutch was removed for chemical analysis, using a clean wooden tongue depressor to place the material in a pre-cleaned, amber glass sampling jar with a Teflon-lined lid. Sand surrounding the clutch was also removed for chemical analysis, using a clean wooden tongue depressor to place the material in a separate pre-cleaned, foil-wrapped, clear glass sampling jar with a Teflon-lined lid. The remaining eggs in the clutch were collected into a zip-top quart plastic bag, along with some surrounding sand, labelled by clutch, and stored in a cooler without ice and transported to Pepperdine University, Malibu, CA for subsequent hatching analysis. Photographs of the samples and sample labels were taken. For the chemical analysis, samples of eggs or sand from three clutches were pooled in the field to obtain sufficient mass for analysis and were then immediately placed in a cooler on ice. For the June 2016 collection, egg and sand samples from each clutch were collected in separate jars, then composited in the lab in order to pool egg clutches with similar hatch rates. No sand or egg samples for chemical analysis were collected from Topanga State Beach. Samples were delivered, under chain of custody, to the California Department of Fish and Wildlife Petroleum Chemistry Laboratory, Rancho Cordova, California. These grunion egg and sand samples were later transferred to Newfields Analytical Laboratory, Rockland, Massachusetts, for polycyclic aromatic hydrocarbon (PAH) analysis.
Laboratory Hatching All the collected eggs were taken to Pepperdine University and held in environmental chambers at 20°C, with seawater sprayed onto the clutches to maintain moisture levels of the natal sand, in accordance with standard animal care protocols for this species.
Grunion eggs require an environmental cue, agitation in seawater, to hatch (Griem and Martin, 2000; Martin et al., 2011). That happens naturally when tides rise before a new or full moon, about 10-12 days after fertilization after the high semilunar tides of the previous new or full moon. Because grunion require this environmental trigger to hatch, some embryos or entire clutches fail to hatch during the first exposure to seawater. These embryos are capable of delaying hatching beyond the time that they first develop competence to hatch. If eggs are not washed out at the semilunar high tide series immediately following spawning, they can incubate an additional two weeks and most will still hatch (Moravek and Martin, 2011). We will refer to embryos that hatch during the first exposure to seawater 10-12 days post fertilization as the “primary” hatch and embryos that delay hatching until the subsequent high tide as “delayed” hatch.
6
The field collected eggs were triggered to hatch in the laboratory by agitation in seawater, using previously established protocols (Matsumoto and Martin, 2008). A primary hatch was initiated two weeks post spawning and a delayed hatch was initiated for a subset of the clutches approximately four weeks post spawning. Small batches of approximately 100 eggs from each clutch were counted, placed in seawater, and agitated for one minute. After 5 minutes, eggs were agitated again for one minute. After 10 minutes, any unhatched eggs were counted. The hatchling behavior and survival was closely observed during the first few hours after hatching. Surviving larvae from the June 11, 2015 collections at El Capitan and East Beach (no eggs were collected at Refugio) were cultured, separated by clutch, in clean seawater without feeding for ten days to observe larval survival over time. Yolk reserves are generally depleted within four days and mortality occurs after that time point without feeding.
Estimates of Baseline Grunion Embryo Mortality Rates Few published estimates of grunion embryo mortality rates exist. Published values for embryo morality rates are based on a variety of methods that are unlikely to be comparable to the methods used in this study. We therefore chose to use embryo mortality rate data derived from clutches collected from reference beaches in 2015 (East Beach and Topanga Beach) and from all anniversary clutches collected in 2016 to estimate a baseline grunion hatch rate. Collectively, these reference and anniversary clutches will be referred to as baseline clutches. Baseline embryo mortality rates were determined for primary and delayed hatch separately. Differences in baseline mortality among years and beaches were tested using a mixed model ANOVA to determine if a single base line hatch rate estimate could be calculated based on the average mortality estimate among all beaches and years. Average mortality was estimated by calculating the average mortality among individual clutches within beaches and years, then among beaches within years, and finally among years. This approach reduced pseudo-replication bias and balanced the impact of unequal distribution of samples among beaches and years.
Analytical Methods Grunion egg and sand extracts were analyzed for PAHs by GC/MS-SIM (USEPA Method 8270 mod). Results for 50 individual PAHs and alkylated homologue groups were summed to estimate total PAHs (TPAH50): naphthalene; naphthalenes, C1; naphthalenes, C2; naphthalenes, C3; naphthalenes, C4; acenaphthylene; acenaphthene; fluorene; fluorenes, C1; fluorenes, C2; fluorenes, C3; phenanthrene; anthracene; phenanthrene/anthracene, C1; phenanthrene/anthracene, C2; phenanthrene/anthracene, C3; phenanthrene/anthracene, C4; pyrene; benzo(b)fluorene; fluoranthene; fluoranthene/pyrenes, C1 -; fluoranthene/pyrenes, C2; fluoranthene/pyrenes, C3; fluoranthene/pyrenes, C4; benz[a]anthracene; chrysene; chrysenes, C1; chrysenes, C2; chrysenes, C3; chrysenes, C4; benzo(a)pyrene; benzo(e)pyrene; benzo(b)fluoranthene; benzo(k)fluoranthene; benzo(a)fluoranthene; benzo(g,h,i)perylene; indeno(1,2,3-c,d)pyrene; dibenz(a,h)anthracene; dibenzothiopene; dibenzothiophenes, C1; dibenzothiophenes, C2; dibenzothiophenes, C3; dibenzothiophenes, C4; biphenyl; dibenzofuran; naphthobenzothiophene; naphthobenzothiophene, C1; naphthobenzothiophene, C2; naphthobenzothiophene, C3

7
and naphthobenzothiophene, C4. When calculating TPAH50, non-detects were assumed to be zero (Forth et al, 2015). Tissue results are reported on a wet weight basis and sand on a dry weight basis. Fingerprinting methods are detailed in Stout (2016).
RESULTS
Spawning Observations Grunion spawning runs were anticipated from 18-21 May 2015, immediately before, during, and following the oil spill. Due to spill response efforts, it was not possible to gain nighttime access to Refugio and El Capitan State Beaches on 20-21 May 2015, so direct observations were not possible. However, it is likely that adult grunion were staging for spawning runs during the day of the spill and the following days based on observations of pelicans and sea lions feeding on fishes in the surf zone nearshore at Refugio State Beach on 22 May 2015, the morning following a predicted run. Clean-up activities extended into the night and bright lights on the beach may have deterred the grunion from spawning on Refugio Beach on 21-22 May. Response activities involved removing the top layers of oiled sand and this action may have also impacted any grunion egg nests that were present. Additionally, hatchlings from the 4-7 May spawning run, and perhaps earlier runs, would likely have been in the nearshore plankton during the early days after the spill and were likely exposed to oil.
Grunion spawning runs were observed on Refugio and El Capitan State Beaches on the next lunar tide series the nights of 4-5 June 2015 (Table 1). The response operation was advised to avoid removing sand from the spawning areas and to avoid disturbing or removing any nests in areas where the runs occurred. Observations from Grunion Greeter volunteers that were recorded and submitted to the Grunion Greeter database indicated similar large runs on other beaches in Santa Barbara County during the months of May, June, and early July. Typically, larger runs occur in more southern parts of the habitat range, in Los Angeles, Orange, and San Diego Counties, and smaller runs occur in Santa Barbara. During 2015, Santa Barbara had the largest runs in the range since records have been kept.
In 2016, teams returned to Refugio State Beach, El Capitan State Beach and East Beach to observe grunion runs (Table 1). On 8 May 2016, the substrate at El Capitan State Beach was primarily cobble and was not suitable for grunion spawning but spawning was observed there on 7 June 2016 when sandy substrate was available.

8
Table 1. Grunion Run Observations based on the Walker Scale (Appendix 1)
Observation Date Beach Walker Scale* 21 May 2015 Refugio State Beach
El Capitan State Beach No Access
4 June 2015 El Capitan State Beach W4 4 June 2015 Refugio State Beach W3 5 June 2015 El Capitan State Beach W3 5 June 2015 Refugio State Beach W3 8 May 2016 Refugio State Beach W2+ 8 May 2016 East Beach W2 7 June 2016 Refugio State Beach W2+ 7 June 2016 El Capitan State Beach W4
*W4 = thousands of fish; W3 = hundreds of fish; W2 =100-500 fish; W2+ = higher end of W2 range
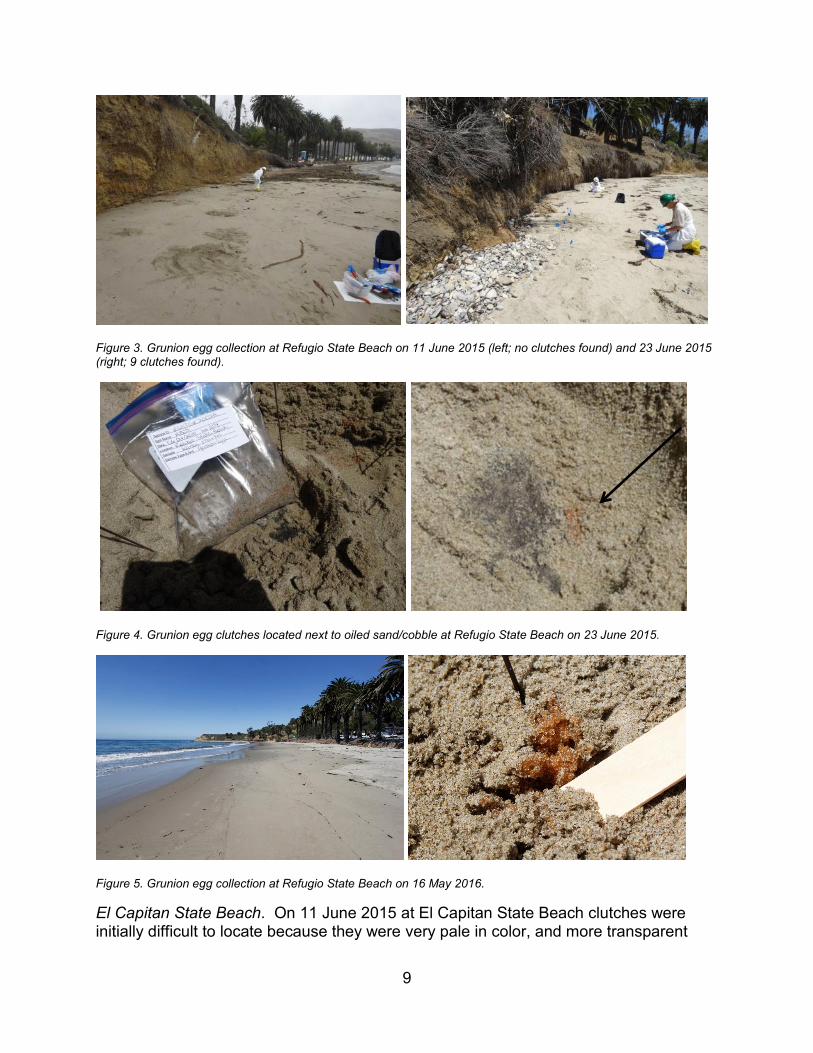
Egg Collection Observations Refugio State Beach. On 11 June 2015, no eggs were located during two hours of searching by a team of four people, in spite of the spawning run previously observed there on 4-5 June (Figure 3). On 23 June 2015, grunion egg nests were located on the western portion of Refugio beach where previous spawning runs were observed (Table 2). Three of the clutches were located adjacent to oiled sand/cobble (Figure 4). In 2016, oiled sand/cobble was not observed around grunion clutches (Figure 5).
Table 2. Grunion Egg Collection Observations
Date Beach # Clutches Color Depth (cm) 10 June 2015 Topanga 3 orange NA 11 June 2015 Refugio 0 11 June 2015 El Capitan 9 light yellow 4-20 11 June 2015 East Beach 9 light orange 7-23 23 June 2015 Refugio 9 light orange 6-14 23 June 2015 El Capitan 3 light orange 12-14 23 June 2015 El Capitan 3 (delayed) light yellow NA 23 June 2015 East Beach 3 orange 10-11 23 June 2015 East Beach 1 (delayed) light orange NA 10 May 2016 Topanga 6 NA NA 16 May 2016 Refugio 6 orange 8-20 16 May 2016 East Beach 9 light orange 2-5 8 June 2016 Refugio 9 orange 4-8 8 June 2016 El Capitan 9 orange 7-9 9 June 2016 Topanga 9 NA NA
NA = Not available
9
Figure 3. Grunion egg collection at Refugio State Beach on 11 June 2015 (left; no clutches found) and 23 June 2015 (right; 9 clutches found).
Figure 4. Grunion egg clutches located next to oiled sand/cobble at Refugio State Beach on 23 June 2015.
Figure 5. Grunion egg collection at Refugio State Beach on 16 May 2016.
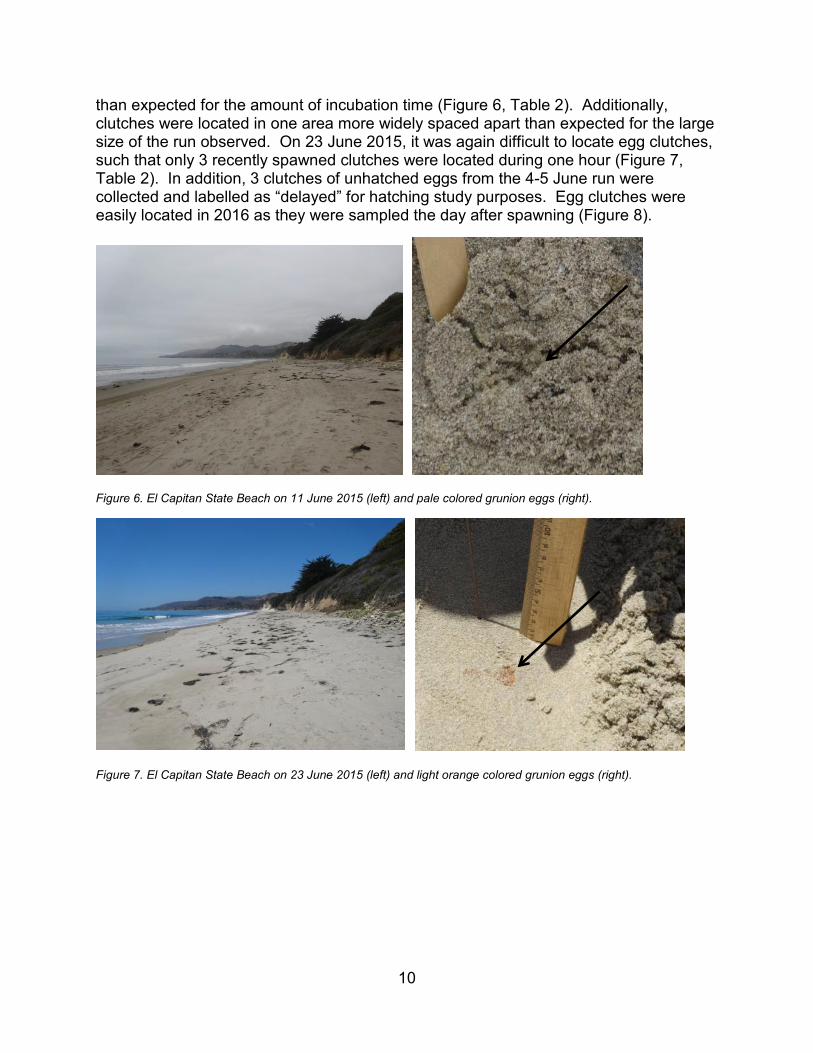
El Capitan State Beach. On 11 June 2015 at El Capitan State Beach clutches were initially difficult to locate because they were very pale in color, and more transparent
10
than expected for the amount of incubation time (Figure 6, Table 2). Additionally, clutches were located in one area more widely spaced apart than expected for the large size of the run observed. On 23 June 2015, it was again difficult to locate egg clutches, such that only 3 recently spawned clutches were located during one hour (Figure 7, Table 2). In addition, 3 clutches of ucollected and labelled as “delayed” foeasily located in 2016 as they were s
nhatched eggs from the 4-5 June run were r hatching study purposes. Egg clutches were ampled the day after spawning (Figure 8).
Figure 6. El Capitan State Beach on 11 June 2015 (left) and pale colored grunion eggs (right).
Figure 7. El Capitan State Beach on 23 June 2015 (left) and light orange colored grunion eggs (right).

11
Figure 8. El Capitan State Beach on 8 June 2016 (left) and orange colored grunion eggs (right).
East Beach. On 11 June 2015, grunion egg clutches were located based on the Grunion Greeter volunteers’ spawning observations (Figure 9). On 23 June 2015, only 3 clutches were located after searching for one hour (Figure 10). One clutch of pale orange eggs from the 4-5 June run was collected and labelled as “delayed” for hatching study purposes. In 2016, egg clutches were orange in color and at relatively shallow depths (Figure 11).
Figure 9. East Beach on 11 June 2015 (left) and pale orange colored grunion eggs (right).

12
Figure 10. East Beach on 23 June 2015 (left) and orange colored grunion eggs (right).
Figure 11. East Beach on 16 May 2016 (left) and orange colored grunion eggs (right).
Grunion Egg and Sand Chemistry The TPAH50 concentrations varied among samples of grunion eggs and the sand associated with the grunion egg clutches (Figure 12 and 13). In 2015, during Run 1 (11 June egg collection), the egg TPAH50 concentrations from the oiled beach (El Capitan) were higher than the concentrations at the reference beach (East Beach; Figure 12). Eggs were not collected during Run 1 at Refugio. No major differences in egg TPAH50 concentrations were noted between oiled and the reference beach during Run 2 (23 June 2015). In 2016, no major differences in egg TPAH50 concentrations were noted among runs or beaches (Figure 12).
Sand samples collected in 2015 did not vary between the oiled beach (El Capitan) and reference beach (East Beach; Figure 13).

13
Figure 12. TPAH50 concentrations in grunion egg samples (ug/kg wet weight) collected during and after the oil spill. In 2015, Run 1 egg collection occurred on 11 June (El Capitan n=3, East Beach n=3, Refugio n=0), and Run 2 egg collection occurred on 23 June (El Capitan n=1, East Beach n=1, Refugio n=3). In 2016, Run 1 egg collection occurred on 16 May (El Capitan n=0, East Beach n=3, Refugio n=2),, and Run 2 egg collection occurred on 8 June (El Capitan n=3, East Beach n=0, Refugio n=3),.
Figure 13. TPAH50 concentrations in sand samples (ug/kg dry weight) collected during and after the oil spill. In 2015, Run 1 sand collection occurred on 11 June (El Capitan n=3, East Beach n=3, Refugio n=0), and Run 2 sand collection occurred on 23 June (El Capitan n=1, East Beach n=1, Refugio n=3). In 2016, Run 1 sand collection occurred on 16 May (El Capitan n=0, East Beach n=3, Refugio n=2) and Run 2 sand collection occurred on 8 June (El Capitan n=3, East Beach n=0, Refugio n=3).
2015
2016

14
Hatching Observations in the Laboratory.
The egg envelope, or chorions, after hatching showed that the eggs collected from El Capitan on 11 June 2015 had a dark, oily appearance that contrasted with the clear chorions from eggs of East Beach from the same date (Figure 14). In addition, embryos hatched very rapidly out of eggs from El Capitan but less quickly from the eggs from East Beach, collected on 11 June 2015.
Figure 14. El Capitan chorions (left) had a dark, yellow appearance compared to clear chorions from East Beach (right) collected on 11 June 2015.
Primary Hatching and Mortality Rates Baseline mortality estimates (primary hatch): Mortality rates were similar among baseline beaches, either within or between years (Table 3). Mortality of embryos from all baseline beaches was low (<10%, Table 3) and did not vary significantly among beaches or between years (Table 4).
Table 3. Mean grunion embryo mortality from 2015 reference and 2016 anniversary samples from all beaches (primary hatch; n = number of clutches).
Year Beach n Average Mortality2015 East 11 0.092015 Topanga 1 0.042015 Mean 2 0.062016 East 8 0.052016 El Capitan 9 0.072016 Refugio 15 0.092016 Topanga 15 0.072016 Mean 4 0.07Grand Mean 2 0.07

15
Table 4. ANOVA testing for effect of year and beaches within year for primary hatch of clutches collected from baseline beaches (2015 reference beaches and all 2016 collections).
Source of Variation Df
Sum of Sq Mean sq F Pr(>F)
Year 1 0.0035 0.003502 0.1545 0.6959 Beach within Year 4 0.02431 0.006077 0.2681 0.8972 Residuals 53 1.20141 0.022668
We used the average mortality rate among the baseline beaches to estimate a baseline grunion embryo mortality rate. First, the individual clutch mortality rates (the number of eggs that do not hatch and the number of hatchlings that die within 24 hours of hatching expressed as a fraction of the total number of eggs) were averaged within beaches; second, the average mortality for the beaches were averaged within years; and finally, a grand average was calculated from the two yearly averages (Table 3). Average mortality among reference and anniversary beaches ranged from 0.04 at Topanga Beach in 2015 and 0.09 at East Beach in 2015 and at Refugio Beach in 2016. The grand mean of 0.07 (7% mortality after 24 hours) was used as a baseline level of mortality.
Primary hatch mortality rates: Primary hatch (2 week incubation period) grunion embryo mortality rates were significantly higher than estimated baseline values for both of the beaches that were exposed to Line 901 oil in 2015 at the time the grunion eggs were collected (Refugio and El Capitan, Figure 15, Table 5). Mortality rates at the reference site (East Beach) were not significantly higher than baseline values.
Table 5. Egg clutch sample size, mean, and variance of mortality rates of grunion eggs collected in 2015. Run refers to the spawning run from which eggs were collected (1 = clutch collected on 6/10/2015 from Topanga and 6/11/2015 from Refugio and El Capitan. 2 = clutches collected on 6/23/2015). T-values and P-values refer to the comparison of the mean morality to the estimated baseline mortality of 0.07. P-values that are less than 0.05 indicate that differences between the mean mortality and baseline mortality are statistically significant.
MortalityBeach Run n Mean Variance t-value p-valueEast 1 8 0.069 0.005 0.087 0.466East 2 3 0.139 0.005 1.818 0.083El Capitan 1 9 0.181 0.012 3.147 0.006El Capitan 2 3 0.260 0.030 1.940 0.074Refugio 2 9 0.108 0.002 2.613 0.014Topanga 1 1 0.037 NA NA NA

16
Figure 15. Grunion egg mortality in 2015 by beach (Primary Hatch) plotted against the number of days post oil spill. Blue vertical bars represent the timing of spawning events; horizontal green arrows represent baseline egg mortality and incubation duration.

17
Delayed Hatching and Mortality Rates Mortality rates of embryos whose hatch was delayed by two weeks were more variable among beaches within years (Table 6). This variability among beaches was driven by mortality rates at El Capitan beach where nearly all the eggs in one or the two clutches failed to hatch. This level of clutch failure is anomalous among all the clutches tested in the study is likely due to poor egg quality or lack of fertilization. Results from this clutch were retained in the estimate of baseline mortality of delayed clutches to account for the impacts of poor egg quality or fertilization failure (Table 7).
Table 6. ANOVA testing for effect of year and beaches within year for delayed hatch of clutches collected from baseline beaches (2015 reference beaches and all 2016 collections).
Source of Variation Df Sum of Sq Mean sq F Pr(>F) Year 1 0.09083 0.09083 1.3384 0.257447 Beach within Year 3 1.11852 0.37284 5.4937 0.004445Residuals 27 1.83242 0.06787
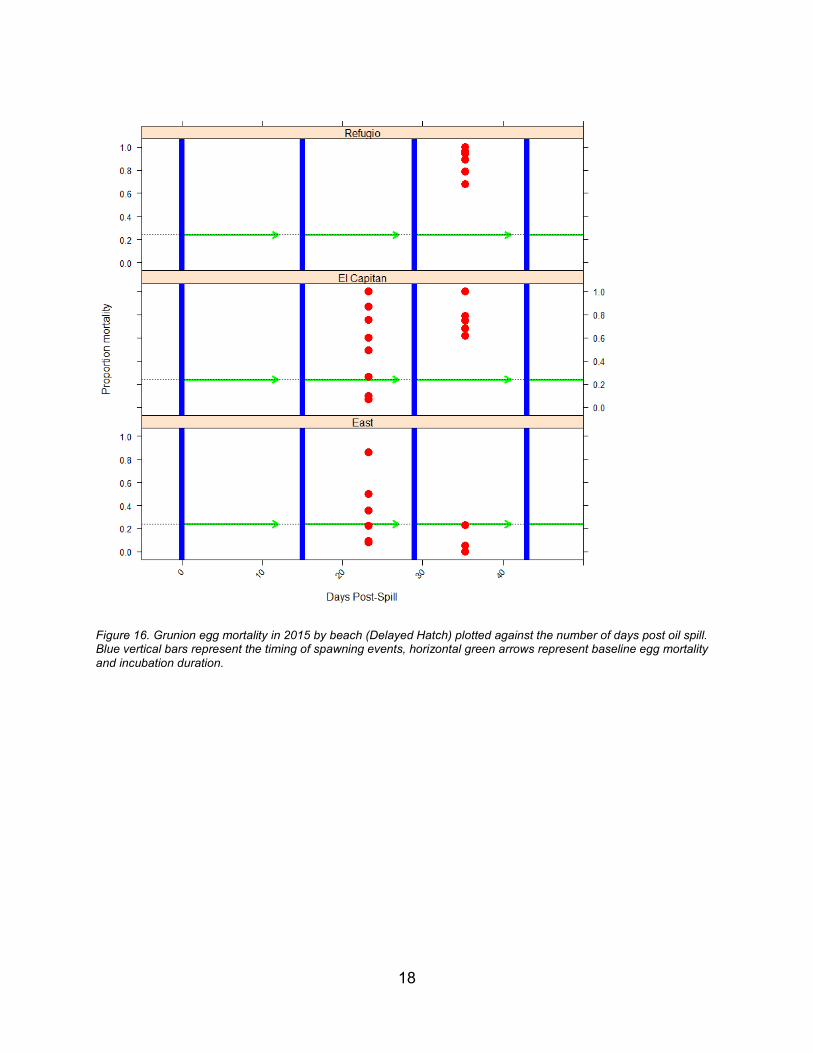
Delayed hatch (4 week incubation period) grunion embryo mortality rates were significantly higher than estimated baseline values for both of the beaches that were exposed to Line 901 oil in 2015 at the time the grunion eggs were collected (Refugio and El Capitan, Figure 16, Table 8). Mortality rates at the reference site (East Beach) were not significantly higher than baseline values. Table 7. Mean grunion embryo mortality from 2015 reference and 2016 anniversary samples from all beaches (delayed hatch).
Year Beach n Average Mortality 2015 East 10 0.25 2015 Mean 1 0.252016 East 8 0.152016 El Capitan 2 0.642016 Refugio 6 0.072016 Topanga 6 0.072016 Mean 4 0.23Grand Mean 2 0.24
18
Figure 16. Grunion egg mortality in 2015 by beach (Delayed Hatch) plotted against the number of days post oil spill. Blue vertical bars represent the timing of spawning events, horizontal green arrows represent baseline egg mortality and incubation duration.

19
Table 8. Egg clutch sample size, mean, and variance of mortality rates of delayed hatch grunion eggs collected in 2015. Run refers to the spawning run from which eggs were collected (1 = clutch collected on 6/10/2015 from Topanga and 6/11/2015 from Refugio and El Capitan. 2 = clutches4r collected on 6/23/2015). T-values and P-values refer to the comparison of the mean morality to the estimated baseline mortality of 0.07. P-values that are less than 0.05 indicate that differences between the mean mortality and baseline mortality are statistically significant.
Year Beach run n Mean Variance t-value p-value2015 East 1 3 0.092 0.014 2.146 0.0612015 East 2 7 0.314 0.083 0.681 0.2592015 El Capitan 1 5 0.766 0.022 7.992 0.0002015 El Capitan 2 9 0.571 0.135 2.700 0.0122015 Refugio 1 9 0.905 0.012 18.114 0.000
Mortality
Post-hatching Survival of Grunion from Oil-Exposed and Reference Beaches Post-hatching survival was tracked in grunion larvae from seven clutches from East Beach (reference) and nine clutches from El Capitan Beach (oiled beach) in 2015. Post hatching survival was used as a proxy to compare the amount of yolk reserve available to larvae from the two beaches. Larvae that survived longer without food were assumed to have larger yolk reserves than larvae that died earlier. The larvae were held without food for 10 days because approximately 4-5 days has been found to be the typical amount of time to deplete the yolk reserve. Survival data (age at death) was analyzed using the Kaplan-Meier Method and Log Rank Test, which is a non-parametric statistic that estimate the survival function. The log-rank test can be used to compare survival curves of two groups. The log-rank test is a statistical hypothesis test that tests the null hypothesis that survival curves of two populations do not differ.
The survival curves of larvae from the two beaches were similar, but with higher mortality of larvae from East Beach between day 5 and 8 of the trial (Figure 17). The log-rank test indicated that the differences between the two survivorship curves was statistically significant (p<0.05).

20
Figure 17. Survivorship curves for starved grunion larvae from reference (East) and oil exposed (El Capitan) beaches. Survivorship curves are represented by solid lines and thicker bar represent 95% confidence intervals around the survivorship estimates.
REFERENCES Forth, HP, JM Morris, CR Lay, J Lipton, CL Mitchelmore, SE Suttles. 2015. Characterization of Oil and Water Accommodated Fractions Used to Conduct Aquatic Toxicity Testing in Support of the Deepwater Horizon Natural Resource Damage Assessment. Technical Report. DWH-AR0155415.

21
Griem, JN and KLM Martin. 2000. Wave action: the environmental trigger for hatching in the California grunion Leuresthes tenius (Teleostei: Atherinopsidae). Marine Biology 137: 177-181. Heintz RA, SD Rice, AC Werthheimer, RF Bradshaw, FP Thrower, JE Joyce, JW Short. 2000. Delayed effects on growth and marine survival of pink salmon Onchorynchus gorbuscha after exposure to crude oil during embryonic development. Marine Ecology Progress Series 208:205-216. Hose, J and HW Puffer.1984. Oxygen consumption rates of grunion (Leuresthes tenuis) embryos exposed to the petroleum hydrocarbon, benzo(a)pyrene. Environmental Research 35:413-420. Incardona JP, CA Vines, BF Anulacion, DH Baldwin, HL Day, BL French, JS Labenia, TL Linbo, MS Myers, OP Olson, CA Sloan, S Sol, FJ Griffin, K Menard, SG Morgan, JE West, TK Collier, GM Ylitalo, GN Cherr, NL Scholz. 2012. Unexpectedly high mortality in Pacific herring embryos exposed to the 2007 Cosco Busan oil spill in San Francisco Bay. Proceedings of the National Academy of Sciences 109(2):E51-58. Johnson, PB, KL Martin, TL Vandergon, RL Honeycutt, RS Burton and A Fry. 2009. Microsatellite and mitochondrial genetic comparisons between northern and southern populations of California grunion (Leuresthes tenuis). Copeia 2:465-474. Lorenson TD, Hostettler FD, Rosenbauer RJ, Peters KE, Kvenvolden KA, Dougherty JA, Gutmacher CE, Wong FL, Normark WR. 2009. Natural offshore seepage and related tarball accumulation on the California coastline; Santa Barbara Channel and the southern Santa Maria Basin; source identification and inventory. U.S. Geological Survey Open File Report 2009-1225 and Minerals Management Service Report 2009-030. Reston, VA. 116 pp. Martin, KL, K Bailey, C Moravek, and K Carlson. 2011. Taking the plunge: California Grunion embryos emerge rapidly with environmentally cued hatching (ECH). Integrative and Comparative Biology 51:1-12. Matsumoto, JK, and KLM Martin. 2008. Lethal and sublethal effects of altered sand salinity on embryos of beach-spawning California grunion. Copeia 2008: 483-490. Meador JP, FC Sommers, GM Ylitalo, CA Sloan. 2006. Altered growth and related physiological responses in juvenile Chinook salmon (Oncorhynchus tschawytscha) from dietary exposure to polycyclic aromatic hydrocarbons (PAHs). Canadian Journal of Fisheries and Aquatic Sciences 63: 2364-2376. Moravek, CL and KL Martin. 2011. Life goes on: Delayed hatching, extended incubation and heterokairy in development of embryonic California grunion Leuresthes tenuis. Copeia 2011(2): 308-314. Stout, SA. 2016. Refugio Beach Oil Spill NRDA Investigation: Trustees Forensic Oil Source Analysis. December 19, 2016 Report. NewFields Government Services, LLC, Rockland, Massachusetts.
22
APPENDIX 1: Walker Scale for Grunion runs