Embed Size (px)
Citation preview

1 August 2015
The 2015 Annual Revision of the National Income and Product Accounts
By Stephanie H. McCulla and Shelly Smith
THE BUREAU of Economic Analysis (BEA) released revised estimates of the national income
and product accounts (NIPAs) for 2012–2014 and for the first quarter of 2015 along with the advance estimates for the second quarter of 2015 on July 30. As is usual for annual NIPA revisions, the revised estimates incorporated newly available source data that are more complete, more detailed, and otherwise more reliable than those that were previously incorporated. The period of revision was generally limited to the first quarter of 2012 through the first quarter of 2015, but personal income and select components were revised back to 1976. The reference year (2009) for price and quantity estimates was unchanged.
Highlights from this year’s revision include the following: ● The picture of the economy shown in the revised esti
mates is similar in broad outline to that shown in the previously published estimates. From 2011 to 2014, real gross domestic product (GDP) increased at an average annual rate of 2.0 percent; in the previously published estimates, real GDP had increased at an average annual rate of 2.3 percent.
● From 2011 to 2014, real gross domestic income (GDI) increased at an average annual rate of 2.4 percent; in the previously published estimates, real GDI had increased at an average annual rate of 2.6 percent. The average of real GDP and real GDI, a new measure introduced with this annual revision, increased 2.2 percent for this same period.
● Real final sales to private domestic purchasers—another new measure that is the sum of personal consumption of expenditures and private fixed invest-ment—grew at an average annual rate of 2.7 percent from 2011 to 2014. In comparison, real final sales to domestic purchasers, which also includes government spending, grew at an average annual rate of 1.9 percent.
● The growth rate in real GDP was revised down for 2012 and 2013 and was unrevised for 2014. For 2012,
Alyssa E. Holdren and Marissa J. Crawford prepared the tables and charts.
GDP grew 2.2 percent, a downward revision of 0.1 percentage point from the previously published estimate. For 2013, GDP grew 1.5 percent, a downward revision of 0.7 percentage point. For 2014, GDP grew 2.4 percent, the same rate as in the previously published estimate.1
● For the period of expansion from the second quarter of 2009 through the first quarter of 2015, real GDP increased at an average annual rate of 2.1 percent, a downward revision of 0.1 percentage point from the previously published estimate. The rate of growth in real GDI was revised down 0.2 percentage point, to 2.5 percent.
● Over the revision period, the difference between first-quarter GDP growth rates and growth rates in other quarters was lessened (see chart 1). Specifically, the
1. In the annual revisions since 1982, the revisions (without regard to sign) to the annual estimates of the percent change in real GDP have averaged 0.3 percentage point.

2 Annual NIPA Revision August 2015
average rate of change in real GDP for first-quarter estimates was revised up 0.4 percentage point; for the other three quarters, the combined average rate of change was revised down 0.5 percentage point. Of particular note is the average rate of change for third-quarter estimates, which was revised down 1.4 percentage points, mainly reflecting the new seasonal adjustment of federal defense spending for services.
● From the fourth quarter of 2011 to the first quarter of 2015, the average annual rate of increase in the price index for gross domestic purchases was revised up to 1.2 percent from 1.1 percent. Excluding food and energy, prices increased 1.5 percent, an upward revision of 0.1 percentage point from the previously published estimates.
● The personal saving rate (personal saving as a per
centage of disposable personal income) was revised up 0.4 percentage point to 7.6 percent for 2012; for 2013 and 2014, the rate was revised down from 4.9 percent to 4.8 percent.
Sources of Revision The revisions resulted from the incorporation of newly available and revised source data and the adoption of improved estimating methods (see the box “The NIPA Revision Cycle”). Table 1 summarizes the major source data that were incorporated. Additional information on the NIPA components affected by the incorporation of these data is provided in table 13, beginning on page 17.
Source data. In general, the source data with the most significant effects on this year’s revisions include
Table 1. Major Source Data Incorporated for the 2015 Annual Revision
Agency Data Years covered and vintage
Census Bureau
Annual survey of wholesale trade
Annual survey of retail trade
Annual survey of manufactures
Economic census
Monthly surveys of manufactures, merchant wholesale trade, and retail trade
Service annual survey
Annual surveys of state and local government finances
Monthly survey of construction spending (value put in place)
Quarterly services survey
Current population survey/housing vacancy survey
2012 (revised) and 2013 (new)
2012 (revised) and 2013 (new)
2013 (new)
2012 (new)
2012–2014 (revised)
2012 and 2013 (revised) and 2014 (new)
Fiscal years 2012 (revised) and 2013 (new)
2013 and 2014 (revised)
2012–2014 (revised)
2012 and 2013 (revised) and 2014 (new)
Office of Management and Budget Federal Budget Fiscal years 2014 and 2015
Internal Revenue Service
Tabulations of tax returns for corporations
Tabulations of tax returns for sole proprietorships and partnerships
2012 (revised) and 2013 (new)
2012 (revised) and 2013 (new)
Bureau of Labor Statistics Quarterly census of employment and wages 2012–2014 (revised)
Department of Agriculture Farm statistics 2012–2014 (revised)
Bureau of Economic Analysis International transactions accounts 2012–2014 (revised)

3 August 2015 SURVEY OF CURRENT BUSINESS
the following:2
● Newly available Census Bureau service annual survey (SAS) data for 2014 and revised data for 2012 and 2013, which replaced Census Bureau quarterly services survey (QSS) data for 2014 and previous SAS data for 2012 and 2013 in the derivation of annual estimates of personal consumption expenditures (PCE) for services.
● Revised and newly available Census Bureau surveys of government finances data for fiscal years 2012 and 2013, which affected estimates of state and local government spending.
● Newly available data from the Census Bureau’s American housing survey and revised and newly available data from its current population/housing vacancy survey, which affected estimates of PCE for housing services and estimates of rental income of persons.
● Newly available Internal Revenue Service (IRS) tax return tabulations for corporations and for sole proprietorships and partnerships for 2013 and revised data for 2012, which replaced annual estimates that were based on previous IRS tabulations and on quar
2. For more information on the source data used to prepare the successive vintages of the NIPA estimates, see the component chapters of the NIPA Handbook: Concepts and Methods of the U.S. National Income and Product Accounts, which is available on BEA’s Web site.
terly indicators; the indicators used a variety of source data, including data from the Census Bureau’s quarterly financial report and from regulatory agency reports, other NIPA estimates, and judgmental trends. The estimates most significantly impacted by the incorporation of the IRS data were corporate profits, nonfarm proprietors’ income, and net interest.
Methodology improvements. This year’s revisions also reflect a number of improvements to the methods that underlie BEA’s estimates. These improvements, discussed in detail in the June issue of the SURVEY OF
CURRENT BUSINESS, include the following:3
● New seasonal adjustments and improvements to the existing seasonal adjustments for a number of NIPA components. With this annual revision, BEA now seasonally adjusts several series from the Census Bureau’s QSS that are used as indicators in the estimation of quarterly PCE, inventory data from the
3. Additionally, advance quarterly estimates of GDP were improved by the incorporation of data from the Census Bureau’s newly introduced advance report on U.S. international trade in goods, which is made available to BEA in time to incorporate into the advance estimates. For more detail on the improvements implemented as part of this annual revision, see Stephanie H. McCulla and Shelly Smith, “Preview of the 2015 Annual Revision of the National Income and Product Accounts,” SURVEY OF CURRENT BUSINESS 95 (June 2015).
The NIPA Revision Cycle The national income and product accounts (NIPAs) are marking to the BEA benchmark input-output accounts regularly revised in order to incorporate the most com- and the incorporation of newly available and revised plete and most reliable source data available, to improve source data, such as data from the Census Bureau’s quinthe estimating methods and definitions underlying the quennial economic censuses; in addition, these estimates estimates, and to change the presentation of the accounts. often reflect the introduction of conceptual changes, such Released in a series of vintages—current quarterly esti- as those that implement updated international guide-mates, annual revision estimates, and comprehensive lines, and other major methodological improvements to revision estimates— this process improves the accuracy the accounts. of the estimates and provides a more detailed picture of These regular revisions maintain and improve the the economy. Revisions are not corrections of errors; they accuracy and relevance of the NIPA estimates, as judged are mainly driven by the incorporation of more complete by their ability to reflect long-term growth rates, trends and revised source data, and the release of the revised in key components of GDP, and broad features of the estimates is determined by the availability of these data. business cycle, including the timing and depth of reces-
Current quarterly estimates provide an “early read” of sions, the strength of recoveries, the major components economic activity and are produced using a variety of contributing to growth and to contractions, and the pat-source data, including preliminary survey results, various tern of quarterly growth. The successive revisions do not indicators, and trade source data. Annual revision esti- substantially change the general picture of economic mates incorporate newly available and revised source activity. data, such as data from mandatory annual surveys and For more information, see Dennis J. Fixler, Ryan from administrative records, that are more complete, Greenaway-McGrevy, and Bruce T. Grimm, “Revisions to more detailed, and more reliable than those incorporated GDP, GDI, and Their Major Components,” SURVEY OF
for the current quarterly estimates; these estimates may CURRENT BUSINESS 94 (August 2014). For more information also reflect the introduction of methodological improve- on the source data that are used to prepare the successive ments. Comprehensive revision estimates reflect bench- vintages of the NIPA estimates, see the NIPA Handbook.

4 Annual NIPA Revision August 2015
Census Bureau’s quarterly financial report that areused in the estimation of quarterly changes in inven-tories and of corporate profits, and Department ofthe Treasury data that are used in the estimation offederal government consumption expenditures fordefense services. (For details, see the box “Seasonalityin the NIPAs” and the sections for each of these com-ponents.)
● Improved prices for financial services. The pricesused for portfolio management and investmentadvice services are now based on producer priceindexes (PPIs) for portfolio management and forinvestment advice from the Bureau of Labor Statistics(BLS). Prices for trust, fiduciary, and custody activi-ties are now based on the BLS PPI for commercialbank services. For more details, see the section on“Prices.”
● Improved accounting treatment for federal refund-able tax credits. This year’s annual revision alsointroduced a new treatment of federal refundable taxcredits. Federal income tax credits allow taxpayerswho meet certain eligibility criteria to reduce theamount that they are required to pay in federal
income taxes. A tax credit is considered to be“refundable” if any excess of the tax credit over a tax-payer’s total tax liability is paid to the taxpayer as arefund.4 Examples of refundable tax credits includethe earned income tax credit and the temporary“Making Work Pay” tax credit.5
The new treatment records the full value of thecredits associated with refundable tax credit programsadministered by the federal government as a currenttransfer payment.6 Consistent with the recommenda-tions of the System of National Accounts 2008, this newtreatment provides a comprehensive picture of the
4. Tax credits are considered to be “nonrefundable” if taxpayers can onlyclaim the credit up to the amount of their tax liability. In contrast torefundable and nonrefundable tax credits, tax allowances, exemptions, anddeductions are subtracted in the calculation of taxable income, reducingthe amount of the original liability.
5. For a list of federal refundable tax credit programs, see table C inMcCulla and Smith, “Preview of the 2015 Annual Revision.”
6. Refundable tax credits are also offered by some state governments, butsource data are not currently available for estimating the value of thesecredits, and no change will be made to their treatment in the NIPAs at pres-ent. Preliminary BEA research suggests that the value of state governmentcredits is much smaller than the value of federal credits, and for most stateand local tax credit programs, the full value is already captured in the NIPAestimates of government social benefit payments.
As discussed in the June issue of the SURVEY OF CURRENT
BUSINESS, BEA’s estimates of first-quarter GDP over thelast decade have tended to grow, on average, at a slowerpace than the estimates for the other three quarters. Eco-nomic analysts have debated extensively about whether,and to what extent, this phenomenon reflects special fac-tors, such as unusually harsh winter weather, or “resid-ual” seasonality—that is, a manifestation of seasonalpatterns in estimates that have already been seasonallyadjusted.1
BEA adjusts its estimates for seasonality by using sea-sonally adjusted source data whenever possible and byregularly reviewing and updating its adjustment proce-dures. BEA’s use of seasonally adjusted source data main-tains the transparency of BEA’s estimating methods,allowing users to trace the estimating process—from theincorporation of the initial source data to the publicationof NIPA estimates. But this “indirect” approach to sea-sonal adjustment does not eliminate the possibility ofresidual seasonality, which can arise for a variety of rea-sons.2
1. See, for example, Jason Furman, “Second Estimate of GDP for theFirst Quarter of 2015,” Council of Economic Advisers Blog, May 29,2015, and Charles E. Gilbert, Norman J. Morin, Andrew D. Paciorek,and Claudia R. Sahm, “Residual Seasonality in GDP,” FEDS Notes, May14, 2015.
2. See McCulla and Smith, “Preview of the 2015 Annual Revision ofthe National income and Product Accounts.”
Nevertheless, BEA has expanded its efforts to addressseasonality in the NIPAs. As part of this year’s annualrevision, BEA (1) has adopted new methods to seasonallyadjust the indicators that it uses to estimate personal con-sumption expenditures for services, the change in privateinventories, and corporate profits and (2) has seasonallyadjusted its measures of federal defense spending on ser-vices, beginning with the first quarter of 2012.
BEA is also developing a longer term comprehensivestrategy to review the estimation methods it currentlyuses to derive seasonally adjusted GDP. First, a detailedcomponent-by-component review will allow BEA toidentify potential sources of residual seasonality. Theresults of this analysis will help BEA and its source dataagencies to develop improved seasonal adjustment tech-niques and estimation procedures that will mitigateresidual seasonality in the NIPAs. Second, BEA willdevelop a not seasonally adjusted GDP series that will bereleased in parallel with BEA’s quarterly GDP estimates.3
This series will facilitate analyses of BEA’s seasonallyadjusted GDP estimates and may provide earlier indica-tions of changes in seasonal patterns.
3. BEA previously published not seasonally adjusted estimates of cur-rent-dollar GDP and its major components for quarters for whichannual estimates had been released. Current quarterly estimates andreal estimates were excluded. The not seasonally adjusted GDP esti-mates were discontinued in 2008 in response to budget cuts.
Seasonality in the NIPAs

5 August 2015 SURVEY OF CURRENT BUSINESS
costs and benefits of these government tax programs; that is, households not only receive the amount by which tax credits exceed their tax liabilities—but they are also relieved of the associated liabilities.7 Similarly, the government not only pays the refunds, but it also relinquishes its claim on the associated tax liabilities.
In the previous NIPA treatment, the portion of refundable tax credits that is not directly paid to taxpayers as refunds (that is, the amount up to, but not exceeding, the total liability) was recorded as a reduction in the income taxes paid by persons to the federal government, and the portion that is paid to taxpayers as refunds (that is, any excess of the credit over the liability) was recorded as a government social benefit.
As a result of the new treatment, the estimates of federal government social benefit payments to persons for 1976 forward were revised up to reflect the total amount of the refundable tax credits, and estimates of personal current taxes paid to the federal government were revised up by an equal amount to reflect the total tax liability of taxpayers.8 Within the personal income and outlays account, current transfer receipts of government social benefits—and therefore, personal in-come—were revised up. As personal current tax payments were revised up by the same amount, disposable personal income, derived as personal income less personal current taxes, was not affected by this change. Estimates of personal saving and the personal saving rate were also unaffected. Within the government receipts and expenditures account, equal upward
7. See Commission of the European Communities, International Monetary Fund, Organisation for Economic Co-operation and Development, United Nations, and the World Bank, System of National Accounts 2008 (Brussels/Luxembourg, New York, Paris, and Washington, DC, 2009): paragraphs 22.95–22.98, 445.
8. Estimates of tax credits are reported for the year following the year of the tax liability. This treatment is consistent with the treatment of other NIPA estimates of tax settlements and refunds.
revisions to government social benefits and to personal current taxes resulted in equal upward revisions to government current expenditures and current receipts, and consequently, government saving was not affected by this change.9
Improvements in presentation. In addition to introducing the two new series—the average of GDP and GDI and real final sales to private domestic purchasers—BEA introduced two changes in presentation that provide users with more detail on international transactions. ● An expanded presentation of payments and receipts
of transfers and taxes between the United States and the “rest of world” shows current transfer and tax payments to and from the rest of the world on a gross basis. The new presentation more closely aligns with BEA’s international transactions accounts and aligns the NIPAs with recommendations from the Organisation for Economic Co-operation and Development’s Balance of Payments and International Investment Position Manual and from the System of National Accounts 2008.10 Previously, the NIPAs presented current transfer and tax payments to the rest of the world net of the transfers and taxes received from the rest of the world.
● An expanded and consistent presentation of exports and imports aligns the presentations of exports and imports of industrial supplies and materials and provides additional detail on exports of petroleum and petroleum products. This new presentation provides users with this previously unpublished—and frequently requested—detail.
9. Similarly, net lending or net borrowing of the federal government was not affected by this change.
10. See Balance of Payments and International Investment Position Manual, Sixth Edition (Washington, DC: International Monetary Fund, 2009).

6 Annual NIPA Revision August 2015
Gross Domestic Product
● From 2011 to 2014, real GDP increased at an average annual rate of 2.0 percent; in the previously published estimates, real GDP had increased at an average annual rate of 2.3 percent. Current-dollar GDP was revised to 3.8 percent from 3.9 percent, and GDP prices were revised to 1.7 percent from 1.6 percent.
● The percent change in real GDP was revised down for 2012 (0.1 percentage point) and for 2013 (0.7 percentage point) and was unrevised for 2014.
● For the expansion from the second quarter of 2009 to the first quarter of 2015, real GDP increased at an average annual rate of 2.1 percent, 0.1 percentage point less than in the previously published estimates.
● The quarterly pattern of real GDP changed for four of the thirteen quarters in the revision period. The revised estimates indicate a slowdown in real GDP for the third quarter of 2012; in the previously published estimates, real GDP accelerated. For the fourth quarter of 2013, real GDP picked up; in the previously published estimates, it slowed. For the third quarter of 2014, real GDP slowed; in the previously published estimates, it accelerated. For the first quarter of 2015, real GDP slowed; in the previously published estimates, it turned down.
Table 2. Real Gross Domestic Product (GDP)
Share of current-dollar GDP
(percent)
Change from preceding period
(percent)
Contribution to percent change
in real GDP (percentage points)
2014 2012 2013 2014 2012 2013 2014
Gross domestic product 1 ............... Personal consumption expenditures
Goods ................................................. Durable goods ................................ Nondurable goods ..........................
Services ............................................. Gross private domestic investment ...
Fixed investment ................................ Nonresidential .................................
Structures .................................... Equipment ................................... Intellectual proper ty products ......
Residential ...................................... Change in private inventories .............
Net expor ts of goods and services .... Exports ...............................................
Goods ............................................. Services ..........................................
Impor ts ............................................... Goods ............................................. Services ..........................................
Government consumption expenditures and gross investment Federal ...............................................
National defense ............................. Nondefense ....................................
State and local ...................................
Gross domestic product ..............
100.0 68.4 22.8 7.4
15.4 45.6 16.5 16.0 12.9 2.9 6.0 4.0 3.2 0.4
–3.1 13.5 9.3 4.2
16.6 13.8 2.8
18.2 7.0 4.3 2.7
11.1
2.2 1.5 2.7 7.4 0.6 0.8
10.6 9.8 9.0
12.9 10.8
3.9 13.5 ....... .......
3.4 3.6 3.0 2.2 2.1 3.0
–1.9 –1.9 –3.4
0.9 –1.9
1.5 1.7 3.1 5.8 1.9 1.0 4.5 4.2 3.0 1.6 3.2 3.8 9.5
......
...... 2.8 2.8 2.7 1.1 1.0 1.5
–2.9 –5.7 –6.7 –4.0 –1.0
2.4 2.7 3.3 5.9 2.1 2.4 5.4 5.3 6.2 8.1 5.8 5.2 1.8
.......
....... 3.4 4.4 1.2 3.8 4.3 1.6
–0.6 –2.4 –3.8 –0.1 0.6
2.2 1.01 0.63 0.53 0.10 0.38 1.52 1.38 1.05 0.32 0.58 0.15 0.33 0.14 0.08 0.46 0.34 0.12
–0.38 –0.30 –0.09
–0.38 –0.15 –0.18
0.03 –0.22
1.5 1.16 0.71 0.42 0.29 0.45 0.70 0.64 0.38 0.04 0.19 0.15 0.27 0.06 0.20 0.38 0.26 0.11
–0.18 –0.14 –0.04
–0.58 –0.46 –0.34 –0.12 –0.12
2.4 1.84 0.75 0.43 0.32 1.09 0.87 0.82 0.77 0.23 0.34 0.20 0.05 0.05
–0.18 0.46 0.41 0.05
–0.63 –0.59 –0.05
–0.11 –0.18 –0.18
0.00 0.07
Revisions (percentage points)
............. –0.1 –0.7 0.0 –0.1 –0.7 0.0 Personal consumption expenditures ...... ............. –0.3 –0.7 0.2 –0.24 –0.48 0.11 Gross private domestic investment ........ ............. 1.4 –0.4 –0.4 0.19 –0.06 –0.05
Fixed investment ................................ ............. 1.5 –0.5 0.0 0.21 –0.06 –0.01 Nonresidential ................................. ............. 1.8 0.0 –0.1 0.21 0.01 –0.01 Residential ...................................... ............. 0.0 –2.4 0.2 0.00 –0.06 0.00
Change in private inventories ............. ............. ....... ...... ....... –0.01 0.00 –0.04 Net expor ts of goods and services ........ ............. ....... ...... ....... 0.04 –0.02 0.04
Exports ............................................... ............. 0.1 –0.2 0.2 0.02 –0.03 0.03 Impor ts ...............................................
Government consumption expenditures ............. –0.1 0.0 –0.2 0.02 0.01 0.02
and gross investment ......................... ............. –0.5 –0.9 –0.4 –0.08 –0.19 –0.08 Federal ............................................... ............. –0.1 0.0 –0.5 0.00 –0.01 –0.04 State and local ................................... ............. –0.7 –1.5 –0.4 –0.07 –0.18 –0.04
1. The estimates under the contribution columns are also percent changes. NOTE. Percent changes are from NIPA table 1.1.1, contributions are from NIPA table 1.1.2, and
shares are from NIPA table 1.1.10.

7 August 2015 SURVEY OF CURRENT BUSINESS
Personal Consumption Expenditures
● Current-dollar PCE was revised down for all 3 years, primarily because of downward revisions to spending for health care services, for housing, and for 2013 and 2014, for durable goods. The percent change in real PCE was revised down 0.3 percentage point for 2012 and 0.7 percentage point for 2013, and it was revised up 0.2 percentage point for 2014.
● The quarterly pattern of real PCE over the period of the revision was not much changed. Revisions to the quarterly pattern were primarily due to revisions to current-dollar estimates of spending on services.
● From the fourth quarter of 2011 to the first quarter of 2015, the average annual rate of increase in the “core” PCE price index (which excludes the prices of food and energy) was 1.5 percent, an upward revision of 0.1 percentage point.
Methodology changes
This annual revision introduced two major improvements to the PCE estimates. The seasonal adjustment of several data series from the Census Bureau’s quarterly services survey improved both the current-dollar estimates and the real estimates of PCE by better adjusting for the impact of regular seasonal variations; previously, moving averages were used to reduce volatility. A listing of the PCE components that are estimated using QSS series and the seasonal adjustment methods applied to those data series are detailed in the BEA FAQ “How is BEA using the Census Bu-
Table 3. Real Personal Consumption Expenditures (PCE)
Share of current-dollar PCE
(percent)
Change from preceding period
(percent)
Contribution to percent change
in real PCE (percentage points)
2014 2012 2013 2014 2012 2013 2014
Personal consumption expenditures 1...............................
Goods ................................................... Durable goods..................................
Motor vehicles and parts ................ Fur nishings and durable household
equipment ................................... Recreational goods and vehicles ... Other durable goods.......................
Nondurable goods ........................... Food and beverages for off-
premises consumption ................ Clothing and footwear .................... Gasoline and other energy goods Other nondurable goods.................
Services ............................................... Household consumption expenditures
(for ser vices) .................................. Housing and utilities ....................... Health care ..................................... Transportation services .................. Recreation services........................ Food services and
accommodations......................... Financial services and insurance ... Other services ................................
Final consumption expenditures of NPISHs .......................................... Gross output of NPISHs ................. Less: Receipts from sales of goods
and services by NPISHs .............
Personal consumption
100.0 33.3 10.8
3.7
2.4 3.0 1.7
22.5
7.5 3.1 3.4 8.5
66.7
64.0 18.1 16.5
3.0 3.8
6.3 7.4 8.9
2.7 10.8
8.1
1.5 2.7 7.4 7.6
4.4 11.6
3.7 0.6
0.1 1.1
–1.6 2.0 0.8
0.6 0.1 2.2 1.7 2.0
2.6 –5.5
1.5
7.0 2.9
1.7
1.7 3.1 5.8 4.6
5.4 8.8 3.4 1.9
1.0 1.4 1.7 2.9 1.0
1.0 0.5 1.0 3.2 1.8
1.6 1.1 0.3
1.9 1.2
1.0
2.7 3.3 5.9 5.6
6.5 7.1 3.4 2.1
0.5 1.4 0.7 4.3 2.4
2.4 1.2 2.7 4.9 2.9
3.0 1.2 4.0
2.0 1.4
1.2
1.5 0.91 0.76 0.26
0.11 0.34 0.06 0.15
0.01 0.03
–0.06 0.17 0.55
0.37 0.01 0.36 0.05 0.08
0.16 –0.41
0.13
0.18 0.31
0.13
1.7 1.04 0.61 0.17
0.13 0.26 0.06 0.43
0.07 0.04 0.06 0.24 0.66
0.61 0.09 0.16 0.09 0.07
0.10 0.08 0.02
0.05 0.13
0.08
2.7 1.09 0.62 0.20
0.16 0.21 0.06 0.47
0.04 0.05 0.03 0.36 1.60
1.55 0.21 0.45 0.14 0.11
0.19 0.09 0.35
0.05 0.15
0.10
Revisions (percentage points)
expenditures ................................. ........... –0.3 –0.7 0.2 –0.3 –0.7 0.2 Goods .................................................... ........... –0.1 –0.3 –0.1 –0.02 –0.10 –0.05
Durable goods ................................... ........... 0.1 –0.9 –1.0 0.00 –0.10 –0.11 Nondurable goods ............................. ........... –0.1 0.0 0.3 –0.02 0.00 0.06
Services ................................................ ........... –0.5 –0.9 0.3 –0.33 –0.59 0.23
NPISHs Nonprofit institutions serving households 1. The estimates under the contribution columns are also percent changes. NOTE. Percent changes are from NIPA table 2.3.1, contributions are from NIPA table 2.3.2, and
shares are calculated from NIPA table 2.3.5.
reau’s quarterly services survey in its estimates of personal consumption expenditures?”
Additionally, the prices of selected components of financial services were improved by using PPIs from the BLS. For details, see the section on “Prices.”

8 Annual NIPA Revision August 2015
Private Fixed Investment
● Current-dollar private fixed investment was revised up for all 3 years, primarily as a result of upward revisions to nonresidential equipment that were partly offset by downward revisions to residential structures, particularly revisions to residential improvements.
● The percent change in real private fixed investment was revised up 1.5 percentage points for 2012, was revised down 0.5 percentage point for 2013, and was unrevised for 2014.
● The quarterly pattern of the real estimates of private fixed investment was changed for seven of the thirteen quarters of the revision period. Revised estimates show that fixed investment for the following quarters accelerated—for the first quarter of 2012, the fourth quarter of 2013, the first and third quarters of 2014, and the first quarter of 2015; in the previously published estimates, investment for these quarters decelerated. Investment for the second quarter of 2013 and the second quarter of 2014 decelerated; in the previously published estimates, investment for these quarters acclerated. The largest contributors to these revisions were investment in nonresidential equipment and in nonresidential structures.
Updated source data
BEA’s measures of private fixed investment are revised as a result of the incorporation of newly available and revised source data and the revision of seasonal factors for certain components. Specifically, the revisions to investment in equipment primarily reflect the incorporation of newly available Census Bureau data from the 2012 economic cen-
Table 4. Real Private Fixed Investment (PFI)
Share of current-dollar PFI
(percent)
Change from preceding period
(percent)
Contribution to percent change
in real PFI (percentage points)
2014 2012 2013 2014 2012 2013 2014
Private fixed investment 1................. Nonresidential .......................................
Structures .......................................... Commercial and health care ............ Manufacturing .................................. Power and communication ............... Mining exploration, shafts, and wells Other structures ...............................
Equipment.......................................... Information processing equipment...
Computers and peripheral equipment .................................
Other ............................................ Industrial equipment ........................ Transportation equipment ................ Other equipment ..............................
Intellectual property products.......... Software........................................... Research and development ............. Entertainment, literary, and ar tistic
originals ........................................ Residential.............................................
Structures .......................................... Permanent site.................................
Single family ................................. Multifamily ....................................
Other structures ............................... Equipment ..........................................
Private fixed investment ...................
100.0 80.3 18.2
4.6 2.0 3.8 5.2 2.6
37.3 11.1
2.8 8.2 8.0 9.8 8.4
24.8 11.2 10.7
2.8 19.7 19.4 8.5 7.0 1.5
10.9 0.3
9.8 9.0
12.9 8.6
14.8 21.0 11.7 9.5
10.8 6.0
6.6 5.8 9.0
19.6 11.2
3.9 5.5 2.6
2.3 13.5 13.8 24.1 21.0 46.6 8.8 1.5
4.2 3.0 1.6 3.6 4.2
–4.5 2.3 4.7 3.2 3.7
4.0 3.6
–2.5 11.1 0.5 3.8 3.2 5.1
1.5 9.5 9.6
24.5 22.6 36.0 1.3 7.4
5.3 6.2 8.1
13.0 11.2
6.2 6.5 4.0 5.8 3.8
–3.3 6.5 7.3
11.8 0.9 5.2 6.5 4.5
2.9 1.8 1.7 9.2 5.5
29.5 –3.4
5.6
9.8 7.41 2.27 0.36 0.26 0.79 0.61 0.24 4.10 0.75
0.23 0.52 0.78 1.56 1.01 1.04 0.67 0.30
0.08 2.37 2.36 1.35 1.03 0.32 1.01 0.01
4.2 2.48 0.28 0.15 0.08
–0.19 0.13 0.12 1.23 0.44
0.13 0.31
–0.22 0.96 0.04 0.97 0.37 0.55
0.05 1.75 1.72 1.57 1.24 0.33 0.15 0.03
5.3 4.92 1.45 0.55 0.21 0.24 0.34 0.10 2.18 0.43
–0.10 0.53 0.58 1.09 0.08 1.30 0.73 0.48
0.08 0.35 0.33 0.73 0.37 0.36
–0.40 0.02
Revisions (percentage points)
............. 1.5 –0.5 0.0 1.5 –0.5 0.0 Nonresidential ......................................... ............. 1.8 0.0 –0.1 1.48 0.00 –0.10
Structures ............................................ ............. –0.2 2.1 –0.1 –0.03 0.37 –0.01 Equipment ........................................... ............. 4.0 –1.4 –0.6 1.51 –0.48 –0.18 Intellectual proper ty products .............. ............. 0.0 0.4 0.4 0.00 0.11 0.09
Residential .............................................. ............. 0.0 –2.4 0.2 0.00 –0.47 0.03 Structures ............................................ ............. 0.0 –2.4 0.2 0.00 –0.47 0.03 Equipment ........................................... ............. 0.3 0.4 0.6 0.01 0.00 0.00
1. The estimates under the contribution columns are also percent changes. NOTE. Percent changes are from NIPA table 5.3.1, contributions are from NIPA table 5.3.2, and
shares are calculated from NIPA table 5.3.5.
sus and newly available data from the 2013 annual survey of manufactures that replaced monthly shipments data for 2013.
Additionally, the incorporation of updated Census Bureau data on construction spending for 2013 and 2014, which included updated Census Bureau seasonal adjustments, resulted in revisions to BEA’s estimates of investment in nonresidential and residential structures.

9 August 2015 SURVEY OF CURRENT BUSINESS
Change in Private Inventories
● Change in real private inventories, or real inventory investment, was revised down by less than $3 billion for all 3 years.
● Real farm inventory investment was revised down for all 3 years; the largest revision was for 2012.
● For nonfarm industries, the largest revisions to real inventory investment were to wholesale trade industries; the levels were revised up by more than $4 billion for 2012 and by $3 billion for 2013, and the level was revised down by more than $2 billion for 2014.
● The quarterly pattern of inventory investment was not notably changed from the previously published estimates.
Updated source data
With this annual revision, Census Bureau data on inventory book values from a number of surveys were incorporated, including data from the 2012 economic census, the annual survey of manufactures, the annual retail trade survey, the annual wholesale trade survey as well as revised monthly Census Bureau data on inventories. Revised data on farm inventories from the Department of Agriculture were also incorporated.
The revised estimates reflect updated seasonal factors, including the introduction of new seasonal factors for the Census Bureau’s quarterly financial report data, which are used to estimate inventories for the mining and information industries.
Table 5. Change in Real Private Inventories by Industry [Billions of chained (2009) dollars]
Level Change from preceding period
2012 2013 2014 2012 2013 2014
Change in private inventories 1................ Farm ............................................................... Mining, utilities, and construction ................... Manufacturing .................................................
Durable-goods industries ............................ Nondurable-goods industries ......................
Wholesale trade ............................................. Durable-goods industries ............................ Nondurable-goods industries ......................
Retail trade ..................................................... Motor vehicle and parts dealers.................. Food and beverage stores .......................... General merchandise stores ....................... Other retail stores .......................................
Other industries .............................................. Residual 2 .......................................................
Change in private inventories ..................
54.7 –12.6
7.0 11.1 10.0 1.5
25.8 21.2 5.7
25.8 20.5 0.1 1.0 4.3 3.4
–7.6
61.4 6.7
–3.9 5.4 7.0
–1.1 24.5 14.9
9.8 27.4 16.7
0.7 0.1
10.1 1.0
–0.6
68.0 3.7 1.6
14.5 21.3 –5.4 29.6 20.6 9.6
11.9 6.8 0.8
–0.5 5.0 7.1
–2.6
17.1 –14.0
11.4 –10.2 –10.3
–0.3 9.1
–1.7 10.1 26.9 19.3 0.3 0.1 7.4 0.1
–5.3
6.8 19.3
–10.9 –5.6 –3.0 –2.6 –1.3 –6.2
4.1 1.6
–3.8 0.5
–0.9 5.8
–2.4 6.9
6.6 –3.0 5.5 9.1
14.3 –4.3 5.2 5.7
–0.2 –15.5
–9.9 0.1
–0.6 –5.1 6.1
–1.9
Revisions
–2.4 –2.1 –2.6 –2.4 0.3 –0.5 Farm ............................................................... –7.0 –0.9 –1.8 –7.0 6.1 –0.9 Mining, utilities, and construction ................... 1.4 –2.3 0.7 1.4 –3.7 3.0 Manufacturing ................................................. 0.5 –1.9 –0.4 0.5 –2.4 1.6 Wholesale trade ............................................. 4.3 3.0 –2.4 4.3 –1.3 –5.4 Retail trade ..................................................... 0.2 –1.0 0.7 0.2 –1.1 1.7 Other industries .............................................. 0.3 1.1 1.2 0.3 0.8 0.0
1. The levels are from NIPA table 5.7.6B. 2. The residual is the difference between the first line and the sum of the most detailed lines. NOTE. The chained-dollar series are calculated as the period-to-period change in end-of
period inventories. Because the formula for the chain-type quantity indexes uses weights of more than one period, chained-dollar estimates are usually not additive.
10 Annual NIPA Revision August 2015
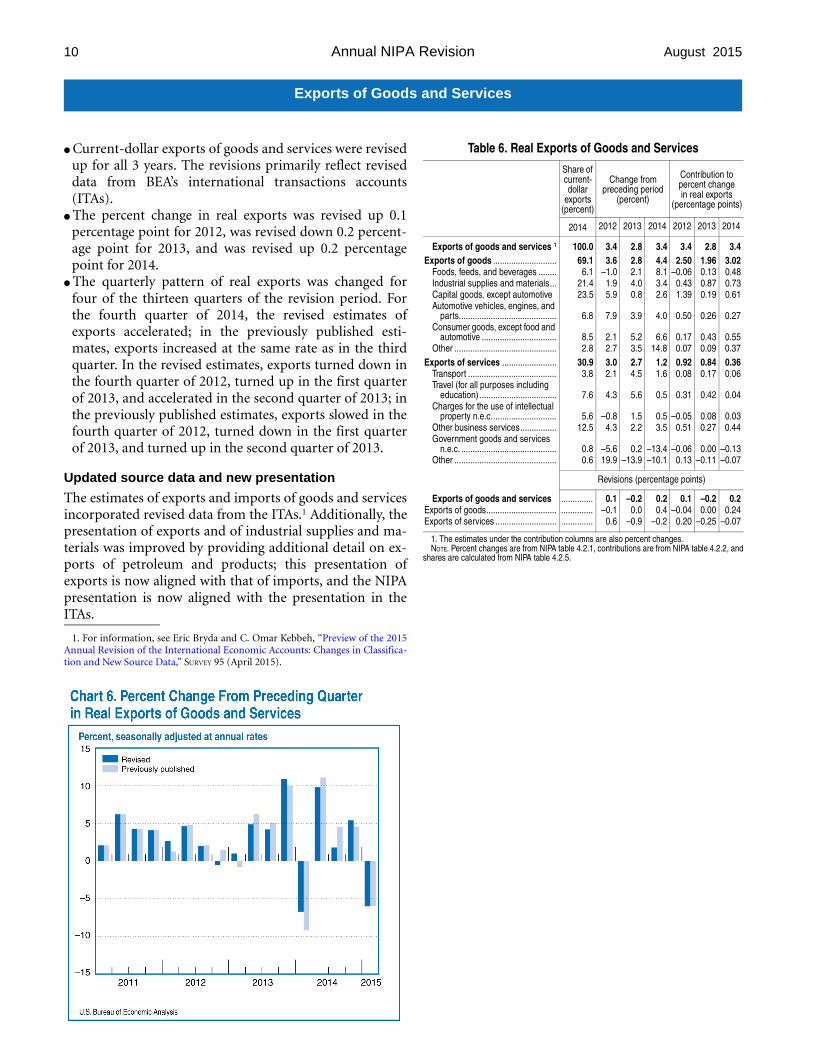
Exports of Goods and Services
● Current-dollar exports of goods and services were revised up for all 3 years. The revisions primarily reflect revised data from BEA’s international transactions accounts (ITAs).
● The percent change in real exports was revised up 0.1 percentage point for 2012, was revised down 0.2 percentage point for 2013, and was revised up 0.2 percentage point for 2014.
● The quarterly pattern of real exports was changed for four of the thirteen quarters of the revision period. For the fourth quarter of 2014, the revised estimates of exports accelerated; in the previously published estimates, exports increased at the same rate as in the third quarter. In the revised estimates, exports turned down in the fourth quarter of 2012, turned up in the first quarter of 2013, and accelerated in the second quarter of 2013; in the previously published estimates, exports slowed in the fourth quarter of 2012, turned down in the first quarter of 2013, and turned up in the second quarter of 2013.
Updated source data and new presentation
The estimates of exports and imports of goods and services incorporated revised data from the ITAs.1 Additionally, the presentation of exports and of industrial supplies and materials was improved by providing additional detail on exports of petroleum and products; this presentation of exports is now aligned with that of imports, and the NIPA presentation is now aligned with the presentation in the ITAs.
1. For information, see Eric Bryda and C. Omar Kebbeh, “Preview of the 2015 Annual Revision of the International Economic Accounts: Changes in Classification and New Source Data,” SURVEY 95 (April 2015).
Table 6. Real Exports of Goods and Services
Share of current-dollar
expor ts (percent)
Change from preceding period
(percent)
Contribution to percent change in real exports
(percentage points)
2014 2012 2013 2014 2012 2013 2014
Expor ts of goods and services 1
Exports of goods ............................ Foods, feeds, and beverages ........ Industrial supplies and materials ... Capital goods, except automotive Automotive vehicles, engines, and
par ts........................................... Consumer goods, except food and
automotive ................................. Other .............................................
Expor ts of services ........................ Transport ....................................... Travel (for all purposes including
education) .................................. Charges for the use of intellectual
proper ty n.e.c............................. Other business services ................ Government goods and services
n.e.c. .......................................... Other .............................................
Expor ts of goods and services Exports of goods............................... Exports of services ...........................
100.0 69.1 6.1
21.4 23.5
6.8
8.5 2.8
30.9 3.8
7.6
5.6 12.5
0.8 0.6
3.4 3.6
–1.0 1.9 5.9
7.9
2.1 2.7 3.0 2.1
4.3
–0.8 4.3
–5.6 19.9
2.8 2.8 2.1 4.0 0.8
3.9
5.2 3.5 2.7 4.5
5.6
1.5 2.2
0.2 –13.9
3.4 4.4 8.1 3.4 2.6
4.0
6.6 14.8
1.2 1.6
0.5
0.5 3.5
–13.4 –10.1
3.4 2.50
–0.06 0.43 1.39
0.50
0.17 0.07 0.92 0.08
0.31
–0.05 0.51
–0.06 0.13
2.8 1.96 0.13 0.87 0.19
0.26
0.43 0.09 0.84 0.17
0.42
0.08 0.27
0.00 –0.11
3.4 3.02 0.48 0.73 0.61
0.27
0.55 0.37 0.36 0.06
0.04
0.03 0.44
–0.13 –0.07
Revisions (percentage points)
..............
..............
..............
0.1 –0.1 0.6
–0.2 0.0
–0.9
0.2 0.4
–0.2
0.1 –0.04
0.20
–0.2 0.00
–0.25
0.2 0.24
–0.07
1. The estimates under the contribution columns are also percent changes. NOTE. Percent changes are from NIPA table 4.2.1, contributions are from NIPA table 4.2.2, and
shares are calculated from NIPA table 4.2.5.

11 August 2015 SURVEY OF CURRENT BUSINESS
Imports of Goods and Services
● Current-dollar imports of goods and services were revised up for 2012 and 2013 and were revised down for 2014. Like the revisions to exports, the revisions to imports primarily reflect the use of revised data from BEA’s ITAs.
● The percent change in real imports was revised down 0.1 percentage point for 2012, was unrevised for 2013, and was revised down 0.2 percentage point for 2014.
● The revised estimates changed the quarterly pattern of imports for six of the thirteen quarters of the revision period. In 2012, imports slowed in the second and third quarters and turned down in the fourth quarter. In the previously published estimates for 2012, imports accelerated in the second quarter, turned down in the third quarter, and decreased more in the fourth quarter than in the third quarter. In 2013, imports turned up in the first quarter, accelerated in the second quarter, and decelerated in the fourth quarter. In the previously published estimates for 2013, imports decreased less in the first quarter than in the fourth quarter of 2012, turned up in the second quarter, and accelerated in the fourth quarter.
● Revisions to quarterly real imports reflect revisions to current-dollar estimates and revisions to prices.
Table 7. Real Imports of Goods and Services
Share of current-dollar
imports (percent)
Change from preceding period
(percent)
Contribution to percent change in real imports
(percentage points)
2014 2012 2013 2014 2012 2013 2014
Imports of goods and services 1...........................
Imports of goods ..................... Foods, feeds, and beverages Industrial supplies and
materials............................. Capital goods, except
automotive .......................... Automotive vehicles, engines,
and parts ............................ Consumer goods, except food
and automotive ................... Other ......................................
Imports of services ................. Transport ................................ Travel (for all purposes
including education) ........... Charges for the use of
intellectual proper ty n.e.c. Other business ser vices ........ Government goods and
services n.e.c. .................... Other ......................................
Imports of goods and
100.0 83.2
4.4
23.2
20.7
11.4
19.5 3.9
16.8 3.3
3.9
1.5 7.2
0.8 0.2
2.2 2.1 3.8
–4.3
7.2
14.8
–0.9 4.6 3.0 2.9
10.8
5.3 1.0
–8.5 –0.3
1.1 1.0 3.9
–3.5
2.1
4.1
3.1 2.9 1.5 5.3
3.7
–0.4 0.9
–11.1 –0.3
3.8 4.3 5.1
0.6
7.0
6.7
4.4 4.6 1.6 0.2
6.8
6.5 –0.1
–6.3 –3.8
2.2 1.73 0.15
–1.20
1.37
1.42
–0.17 0.17 0.50 0.09
0.36
0.07 0.08
–0.10 0.00
1.1 0.81 0.16
–0.90
0.41
0.45
0.59 0.11 0.24 0.16
0.14
–0.01 0.07
–0.11 0.00
3.8 3.55 0.22
0.14
1.42
0.75
0.85 0.18 0.28 0.01
0.26
0.09 –0.01
–0.06 –0.01
Revisions (percentage points)
services ......................... .......... –0.1 0.0 –0.2 –0.1 0.0 –0.2 Impor ts of goods ....................... .......... 0.0 0.1 0.2 –0.04 0.03 0.18 Impor ts of ser vices .................... .......... –0.4 –0.7 –2.0 –0.06 –0.13 –0.32
1. The estimates under the contribution columns are also percent changes. NOTE. Percent changes are from NIPA table 4.2.1, contributions are from NIPA table 4.2.2, and
shares are calculated from NIPA table 4.2.5.

12 Annual NIPA Revision August 2015
Government Consumption Expenditures and Gross Investment
● Current-dollar government consumption expenditures and gross investment, or government spending, was revised down for all 3 years, primarily reflecting downward revisions to state and local government spending.
● The percent change in real government spending was revised down 0.5 percentage point for 2012, 0.9 percentage point for 2013, and 0.4 percentage point for 2014.
● The quarterly pattern of the estimates differs notably from the previously published estimates (see chart 8); generally, the pattern is less volatile than in the previously published estimates. The revisions to the pattern of total government spending are primarily due to revisions to the pattern of defense spending, for which the differences in the growth rates between one quarter and the next are lessened in absolute value for eleven of the thirteen quarters of the revision period. For instance, federal defense spending is now estimated to have decreased 8.1 percent in the fourth quarter of 2012 after increasing 0.8 percent in the third quarter. Previously, federal defense spending was estimated to have decreased 20.1 percent after increasing 11.9 percent. This reduction in volatility is due primarily to the seasonal adjustment of federal defense spending on services that was introduced as part of this annual revision.
Major improvements and updated source data
The revisions to the annual estimates primarily reflect revisions to state and local government spending. The downward revisions primarily reflect the incorporation of revised and newly available data from the Census Bureau surveys of government finances, which are used to estimate the intermediate goods and services purchased by state and local governments, and revised Census Bureau construction spending data, which are used to estimate state and local government investment in structures.
The revisions to the quarterly pattern of government spending largely reflect revisions to federal defense spending, which resulted from the seasonal adjustment of the Treasury Department data that underlie the NIPA estimates of defense spending on services. The previously published estimates were derived from data that were not seasonally adjusted; seasonality tests indicated that a seasonal pattern had emerged in this source data in recent years. The most significant impacts were to the third-quarter and fourth-quarter estimates; the revised estimates reduced third-quarter expenditures and increased fourth-quarter expenditures.
Table 8. Real Government Consumption Expenditures and Gross Investment (CEGI)
Share of current-dollar CEGI
(percent)
Change from preceding period
(percent)
Contribution to percent change
in real CEGI (percentage points)
2014 2012 2013 2014 2012 2013 2014
Government consumption expenditures and gross investment 1 ................................ Consumption expenditures .......... Gross investment .........................
Federal ............................................... National defense............................
Consumption expenditures .......... Gross investment .........................
Nondefense .................................... Consumption expenditures .......... Gross investment .........................
State and local .................................. Consumption expenditures.............. Gross investment ............................
Government consumption expenditures and gross
100.0 81.1 18.9 38.7 23.7 19.0 4.7
15.0 11.3 3.7
61.3 50.8 10.5
–1.9 –0.9 –5.7 –1.9 –3.4 –2.4 –7.1
0.9 2.1
–2.6 –1.9 –0.9 –6.2
–2.9 –2.5 –4.8 –5.7 –6.7 –6.7 –6.9 –4.0 –3.7 –4.8 –1.0 –0.4 –3.8
–0.6 –0.5 –1.1 –2.4 –3.8 –3.8 –4.0 –0.1
0.4 –1.5
0.6 0.7 0.4
–1.9 –0.70 –1.16 –0.76 –0.89 –0.50 –0.39
0.13 0.23
–0.10 –1.10 –0.43 –0.67
–2.9 –2.01 –0.94 –2.33 –1.73 –1.37 –0.36 –0.60 –0.42 –0.18 –0.61 –0.21 –0.40
–0.6 –0.37 –0.22 –0.96 –0.94 –0.75 –0.20 –0.01 0.04
–0.06 0.38 0.34 0.04
Revisions (percentage points)
investment .................................. ............. –0.5 –0.9 –0.4 –0.5 –0.9 –0.4 Federal................................................ ............. –0.1 0.0 –0.5 –0.03 –0.01 –0.21
National defense ............................. ............. –0.1 –0.1 –1.7 –0.02 –0.02 –0.42 Nondefense ..................................... ............. –0.1 0.1 1.4 –0.01 0.01 0.22
State and local .................................... ............. –0.7 –1.5 –0.4 –0.38 –0.91 –0.21
1. The estimates under the contribution columns are also percent changes. NOTE. Percent changes are from NIPA table 3.9.1, contributions are from NIPA table
3.9.2, and shares are calculated from NIPA table 3.9.5.

13 August 2015 SURVEY OF CURRENT BUSINESS
Prices
● The revisions to the percent change in price indexes for gross domestic purchases, GDP, and PCE generally reflect revised and newly available source data and revised current-dollar weights; for PCE, the revisions also reflect the introduction of a new estimating method for financial services.
● Prices for gross domestic purchases were revised up 0.1 percentage point for each year for 2012–2014. Prices for GDP were unrevised for 2012 and were revised up 0.1 percentage point for 2013 and 2014. Prices for PCE were revised up 0.1 percentage point for 2012 and for 2014 and were revised up 0.2 percentage point for 2013.
● For all 3 years, prices for PCE, most notably for financial services, were a major contributor to the upward revisions to gross domestic purchases prices. Additionally, for 2013 and 2014, prices for state and local government spending were major contributors to the revisions, and for 2014, prices for federal government spending were a major contributor.
Methodology change
This annual revision introduced a methodology change for PCE for financial services prices. Specifically, PPIs from BLS were used to derive price indexes for portfolio management and investment advice services and for trust, fiduciary, and custody activities. For portfolio and management and investment advice, an equally weighted aver-
Table 9. Prices for Gross Domestic Purchases
Change from preceding period
(percent)
Contribution to percent change
in gross domestic purchases prices
(percentage points)
2012 2013 2014 2012 2013 2014
Gross domestic purchases 1 .................... Personal consumption expenditures .........
Goods ......................................................... Durable goods ......................................... Nondurable goods ...................................
Services ...................................................... Gross private domestic investment............
Fixed investment ......................................... Nonresidential .........................................
Structures ............................................ Equipment............................................ Intellectual proper ty products ..............
Residential .............................................. Change in private inventories .....................
Government consumption expenditures and gross investment ............................... Federal........................................................
National defense ..................................... Nondefense .............................................
State and local ............................................ Addenda: Gross domestic purchases:
Food............................................................ Energy goods and services ........................ Excluding food and energy .........................
Personal consumption expenditures (PCE): Food and beverages purchased for off-
premises consumption ............................ Energy goods and services ........................ Excluding food and energy .........................
Gross domestic product (GDP) ...................... Exports of goods and services ....................... Impor ts of goods and ser vices .......................
Gross domestic purchases .........................
1.8 1.9 1.2
–1.3 2.4 2.2 1.4 1.5 1.7 4.0 1.0 1.1 0.9
........
1.6 1.0 1.1 0.9 1.9
2.2 1.4 1.8
2.3 1.4 1.9 1.8 0.9 0.6
1.4 1.4
–0.5 –1.8 0.2 2.3 1.5 1.6 0.8 1.6 0.4 0.7 5.1
........
1.6 1.0 0.6 1.6 2.0
1.0 –0.8
1.5
1.0 –0.9 1.5 1.6 0.2
–0.8
1.5 1.4
–0.4 –2.3 0.6 2.3 1.8 1.9 1.0 1.5 0.7 0.9 6.1
........
1.8 1.6 1.4 2.0 1.9
1.4 –0.8
1.6
1.9 –0.8 1.5 1.6 0.1
–0.2
1.8 1.25 0.27
–0.10 0.37 0.98 0.21 0.22 0.19 0.10 0.05 0.04 0.02
–0.01
0.30 0.08 0.06 0.02 0.22
0.11 0.05 1.60
........
........
........
........
........
........
1.4 0.91
–0.11 –0.13 0.03 1.01 0.23 0.23 0.09 0.04 0.02 0.03 0.14 0.00
0.29 0.07 0.03 0.04 0.22
0.05 –0.03
1.41
........
........
........
........
........
........
1.5 0.95
–0.08 –0.17
0.09 1.03 0.28 0.30 0.12 0.04 0.04 0.04 0.18
–0.02
0.32 0.11 0.06 0.05 0.21
0.07 –0.03
1.51
.........
.........
.........
.........
.........
.........
Revisions (percentage points)
0.1 0.1 0.1 0.1 0.1 0.1 Food............................................................ 0.0 0.0 –0.1 0.00 0.00 0.00 Energy goods and services ........................ 0.0 0.0 0.0 0.00 0.00 0.00 Excluding food and energy ......................... 0.1 0.1 0.1 0.06 0.14 0.16
PCE ................................................................ Food and beverages purchased for off
0.1 0.2 0.1 0.03 0.11 0.06
premises consumption ............................ 0.0 0.0 0.0 ........ ........ ......... Energy goods and services ........................ 0.0 –0.1 –0.1 ........ ........ ......... Excluding food and energy ......................... 0.1 0.2 0.1 ........ ........ .........
Gross domestic product ................................. 0.0 0.1 0.1 ........ ........ ......... Expor ts of goods and services ....................... 0.0 0.1 0.0 ........ ........ ......... Impor ts of goods and ser vices ....................... 0.1 0.0 0.0 ........ ........ .........
1. The estimates under the contribution columns are also percent changes. NOTE. Most percent changes are from NIPA table 1.6.7; percent changes for PCE for food and
energy goods and services and for PCE excluding food and energy are from NIPA table 2.3.7. Contributions are from NIPA table 1.6.8. GDP, expor t, and impor t prices are from NIPA table 1.1.7.
age of PPIs for portfolio management and for investment advice replaced prices that were derived using BLS data on employment, hours, and earnings. For trust services, the PPIs for commercial bank services replaced prices that were derived based on expenditure data from the Federal Deposit Insurance Corporation and BLS data on quantities.

14 Annual NIPA Revision August 2015
National Income
● National income was revised down for 2012 and 2013, and it was unrevised for 2014.
● For 2012, a small downward revision primarily reflects downward revisions to corporate profits and to proprietors’ income that were partly offset by an upward revision to net interest.
● For 2013, a large downward revision primarily reflects downward revisions to corporate profits, to proprietors’ income, and to rental income of persons that were partly offset by upward revisions to taxes on production and imports, to net interest, and to current surplus of government enterprises. For corporate profits and nonfarm proprietors’ income, estimates derived from newly available IRS tabulations of tax return data replaced estimates that were based on extrapolations using various indicator series. For rental income of persons, the downward revision primarily reflects newly available data from the Census Bureau’s American housing survey and revised and newly available data from its current population/housing vacancy survey.
● For 2014, downward revisions to proprietors’ income, to rental income of persons, and to corporate profits were mostly offset by upward revisions to net interest, to wages and salaries, and to current surplus of government enterprises. The revisions to proprietors’ income, to rental income of persons, and to corporate profits primarily reflect revisions to estimates for the preceding years as well as the incorporation of newly available and revised source data for 2014. For net interest, the revisions are primarily due to the incorporation of newly available and revised data from the Federal Reserve Board and the Federal Deposit Insurance Corporation. For wages and salaries, the revised estimates primarily reflect revised and newly available data from the BLS quarterly census of employment and wages.
Table 10. National Income by Type of Income [Billions of dollars]
Level Change from preceding period
2012 2013 2014 2012 2013 2014
National income ................. Compensation of employees ...
Wages and salaries ................. Government ......................... Other ....................................
Supplements to wages and salaries ................................ Employer contributions for
employee pension and insurance funds ................
Employer contributions for government social insurance ..........................
Proprietors’ income with IVA and CCAdj .............................. Farm ........................................ Nonfarm ..................................
Rental income of persons with CCAdj .....................................
Corporate profits with IVA and CCAdj ..................................... Taxes on corporate income ..... Profits after tax with IVA and
CCAdj .................................. Net dividends ....................... Undistributed profits with IVA
and CCAdj ........................ Net interest and miscellaneous
payments................................ Taxes on production and
imports ................................... Less: Subsidies ........................ Business current transfer
payments (net) ....................... To persons (net) ...................... To government (net) ................ To the rest of the world (net)....
Current surplus of government enterprises .............................
National income .................
14,061.9 8,609.9 6,930.3 1,198.2 5,732.0
1,679.6
1,165.3
514.3
1,241.4 61.6
1,179.8
525.3
1,998.2 447.6
1,550.5 859.4
691.2
527.7
1,132.1 58.0
104.7 42.7 72.6
–10.6
–19.3
14,458.3 8,839.7 7,114.4 1,207.6 5,906.8
1,725.3
1,197.8
527.5
1,285.1 88.8
1,196.3
563.4
2,037.4 468.9
1,568.5 924.0
644.5
513.5
1,178.0 59.4
119.4 41.2 91.9
–13.7
–18.8
15,076.5 9,248.9 7,477.8 1,237.2 6,240.5
1,771.2
1,224.0
547.2
1,346.7 78.1
1,268.6
610.8
2,072.9 513.9
1,559.1 860.0
699.0
532.3
1,213.7 57.9
127.3 42.0 94.8 –9.5
–18.3
709.6 340.9 297.1
3.5 293.6
43.8
23.3
20.4
97.7 –14.0 111.7
40.0
181.5 68.5
113.0 155.7
–42.7
39.7
29.4 –2.0
–26.9 –7.5
–16.7 –2.7
5.2
396.5 229.8 184.1
9.4 174.7
45.6
32.5
13.1
43.7 27.2 16.5
38.1
39.2 21.3
18.0 64.7
–46.7
–14.2
45.9 1.3
14.7 –1.6 19.4 –3.1
0.5
618.2 409.3 363.4 29.6
333.8
45.9
26.2
19.7
61.6 –10.6
72.2
47.4
35.6 45.0
–9.4 –64.0
54.6
18.7
35.7 –1.4
7.9 0.8 2.9 4.2
0.5
Revisions
–7.6 –118.7 0.0 –7.6 –111.1 118.8 Compensation of employees ...... Proprietors’ income with IVA and
3.4 –5.1 21.3 3.4 –8.5 26.4
CCAdj...................................... Rental income of persons with
–18.8 –51.5 –33.5 –18.8 –32.7 18.0
CCAdj...................................... Corporate profits with IVA and
–7.6 –32.4 –29.4 –7.6 –24.8 3.0
CCAdj...................................... Net interest and miscellaneous
–24.6 –69.5 –16.9 –24.6 –44.8 52.6
payments ................................. 36.0 13.8 46.0 36.0 –22.2 32.2 Taxes on production and imports 0.0 15.5 10.6 0.0 15.5 –5.0 Less: Subsidies........................... Business current transfer
0.0 –0.8 0.6 0.0 –0.8 1.4
payments (net) ........................ Current surplus of government
–2.0 –1.2 –13.3 –2.0 0.8 –12.1
enterprises .............................. 6.0 10.8 15.9 6.0 4.8 5.1
CCAdj Capital consumption adjustment IVA Inventory valuation adjustment NOTE. Dollar levels are from NIPA table 1.12.

15 August 2015 SURVEY OF CURRENT BUSINESS
GDI, the Average of GDP and GDI, and the Statistical Discrepancy
● GDI measures the value of U.S. output as the sum of income payments and other costs incurred in the production of goods and services. In principle, GDP should equal GDI; however, they differ in practice because each is estimated using different, and largely independent, source data. The statistical discrepancy is current-dollar GDP less current-dollar GDI. With this annual revision, BEA introduced a new aggregate—the average of GDP and GDI—to provide users a supplemental way to track economic growth.
● Current-dollar GDI for all 3 years was revised down; the largest revision was for 2013. The primary sources of the revisions to current-dollar GDI are the same as those underlying the revisions to national income.
● The level of real GDI for all 3 years was also revised down. The revisions primarily reflect the revisions to the current-dollar estimates of GDI; the revisions to the implicit price deflator for GDP, which is used to deflate GDI, are small.
● From 2011 to 2014, the average of real GDP and real GDI increased at an average annual rate of 2.2 percent.
● The statistical discrepancy as a percentage of GDP was –1.3 percent for 2012, –1.1 percent for 2013, and –1.2 percent for 2014.1
1. The statistical discrepancy as a percentage of GDP has been added as a published estimate in the addenda to table 1.7.5; until now, the measure has been presented only as part of the analysis of the NIPA annual revision.
Table 11. Relation of GDP, GDI, Gross National Income, National Income, and Personal Income
[Billions of dollars]
Level Change from preceding period
2012 2013 2014 2012 2013 2014
Gross domestic product ......... Less: Statistical discrepancy Equals: Gross domestic
income .................................. Plus: Income receipts from the
rest of the world ..................... Less: Income payments to the
rest of the world ..................... Equals: Gross national income Less: Consumption of fixed
capital .................................... Equals: National income ........ Less:
Cor porate profits with IVA and CCAdj.................................
Taxes on production and impor ts less subsidies ........
Contributions for gover nment social insurance, domestic
Net interest and miscellaneous payments on assets ...........
Business current transfer payments (net) ...................
Current sur plus of gover nment enterprises .........................
Plus: Personal income receipts on assets ...............................
Plus: Personal current transfer receipts ..................................
Equals: Personal income ........
Gross domestic product ............ Statistical discrepancy ............... Gross domestic income .............
16,155.3 –203.3
16,358.5
801.5
563.9 16,596.1
2,534.2 14,061.9
1,998.2
1,074.0
951.6
527.7
104.7
–19.3
2,123.8
2,366.3 13,915.1
16,663.2 –177.6
16,840.8
826.2
575.8 17,091.2
2,632.8 14,458.3
2,037.4
1,118.6
1,106.8
513.5
119.4
–18.8
2,060.4
2,426.6 14,068.4
17,348.1 –212.0
17,560.1
854.3
591.2 17,823.2
2,746.7 15,076.5
2,072.9
1,155.8
1,159.0
532.3
127.3
–18.3
2,117.5
2,529.2 14,694.2
637.3 –164.9
802.3
8.9
17.9 793.2
83.6 709.6
181.5
31.5
33.8
39.7
–26.9
5.2
209.9
5.9 660.6
507.9 25.6
482.3
24.6
11.9 495.1
98.6 396.5
39.2
44.6
155.2
–14.2
14.7
0.5
–63.4
60.3 153.3
684.9 –34.4
719.3
28.1
15.4 732.1
113.9 618.2
35.6
37.2
52.2
18.7
7.9
0.5
57.1
102.5 625.8
Revisions
–7.9 5.9
–13.8
–104.9 34.3
–139.2
–70.9 –30.0 –40.9
–7.9 5.9
–13.8
–97.0 28.4
–125.3
34.0 –64.3
98.3
CCAdj Capital consumption adjustment IVA Inventory valuation adjustment NOTE. Dollar levels are from NIPA table 1.7.5.

16 Annual NIPA Revision August 2015
Personal Income and Personal Saving
● Personal income was revised, beginning with 1976. For 1976–2014, the revisions reflect the new treatment of refundable tax credits; for 2012–2014, the revisions also reflect the incorporation of revised and newly available source data.
● The revisions to the estimates of personal income for 1976–2007 were less than $10 billion. For 2008, the revision exceeded $70 billion because of the tax refunds that were implemented as part of the Economic Stimulus Act of 2008. For 2010 and 2011, the effects were also large (close to $50 billion for each year) because of the “Making Work Pay” tax credit that was implemented in these years.
● For 2012–2014, downward revisions to nonfarm proprietors’ income and to rental income of persons were partly offset by upward revisions to personal interest income and to personal transfer receipts. The most notable revision to personal income was a downward revision of nearly $100 billion for 2013.
● The revisions to the estimates of personal saving for 1999– 2011 were less than $10 billion.1 They reflect revisions to personal current transfer payments to the rest of the world that were primarily due to improved measures of cross-border transfers in the international transactions accounts.2
● For 2012, personal saving was revised up about $50 billion, primarily reflecting an upward revision to personal interest
1. As discussed previously, personal saving and the personal saving rate are not affected by the changed treatment of refundable tax credits.
2. As part of the 2015 annual revision of the international economic accounts, BEA introduced the use of IRS data that more accurately reflect the value of cross-border charitable donations. For information, see Bryda and Kebbeh, “Preview of the 2015 Annual Revision of the International Economic Accounts.”
Table 12. Personal Income and Its Disposition [Billions of dollars]
Level Change from preceding period
2012 2013 2014 2012 2013 2014
Personal income.................. Compensation of employees ....
Wages and salaries ............... Private industries ............... Government .......................
Supplements to wages and salaries ..............................
Proprietors’ income with IVA and CCAdj ............................. Farm ...................................... Nonfarm ................................
Rental income of persons with CCAdj....................................
Personal income receipts on assets .................................... Personal interest income ....... Personal dividend income .....
Personal current transfer receipts.................................. Government social benefits to
persons .............................. Other current transfer
receipts, from business (net) ...................................
Less: Contributions for government social insurance, domestic ................................
Less: Personal current taxes Equals: Disposable personal
income (DPI) ........................ Less: Personal outlays ........... Equals: Personal saving ........ Personal saving as a
percentage of DPI (percent)
Personal income .......................
13,915.1 8,609.9 6,930.3 5,732.0 1,198.2
1,679.6
1,241.4 61.6
1,179.8
525.3
2,123.8 1,288.8
834.9
2,366.3
2,323.6
42.7
951.6 1,511.4
12,403.7 11,457.0
946.7
7.6
14,068.4 8,839.7 7,114.4 5,906.8 1,207.6
1,725.3
1,285.1 88.8
1,196.3
563.4
2,060.4 1,271.3
789.0
2,426.6
2,385.5
41.2
1,106.8 1,672.8
12,395.6 11,805.7
589.9
4.8
14,694.2 9,248.9 7,477.8 6,240.5 1,237.2
1,771.2
1,346.7 78.1
1,268.6
610.8
2,117.5 1,302.0
815.5
2,529.2
2,487.2
42.0
1,159.0 1,780.2
12,913.9 12,293.7
620.2
4.8
660.6 340.9 297.1 293.6
3.5
43.8
97.7 –14.0 111.7
40.0
209.9 57.2
152.7
5.9
13.4
–7.5
33.8 58.2
602.4 365.8 236.6
...........
153.3 229.8 184.1 174.7
9.4
45.6
43.7 27.2 16.5
38.1
–63.4 –17.5 –45.9
60.3
61.9
–1.6
155.2 161.4
–8.1 348.7
–356.8
..........
625.8 409.3 363.4 333.8
29.6
45.9
61.6 –10.6
72.2
47.4
57.1 30.7 26.5
102.5
101.7
0.8
52.2 107.5
518.3 488.0
30.3
...........
Revisions
27.4 –98.5 –39.7 –25.1 –125.9 58.8 Less: Personal current taxes..... 7.7 11.0 36.3 –44.8 3.3 25.3 Equals: DPI ............................... 19.7 –109.5 –76.1 19.7 –129.2 33.5 Less: Personal outlays .............. –30.8 –91.4 –63.7 –31.8 –60.6 27.7 Equals: Personal saving ........... Personal saving as a
percentage of DPI
50.5 –18.1 –12.4 51.5 –68.7 5.8
(percentage points) ............... 0.4 –0.1 –0.1 ........... .......... ...........
CCAdj Capital consumption adjustment IVA Inventory valuation adjustment NOTE. Dollar levels are from NIPA table 2.1.
income and a downward revision to PCE, both resulting from revised and newly available source data.
● For 2013 and 2014, downward revisions to personal saving (of about $18 billion and $12 billion, respectively) reflect downward revisions to personal income (specifically, to nonfarm proprietors’ income, to personal dividend income, and to rental income of persons) and upward revisions to personal current taxes that were partly offset by downward revisions to personal outlays (specifically, to PCE).
● The personal saving rate (personal saving as a percentage of disposable personal income) for 2012 was revised up to 7.6 percent; this is the highest rate since 1992 (8.9 percent). For 2013 and 2014, the rate was revised down to 4.8 percent from 4.9 percent for both years.

17 August 2015 SURVEY OF CURRENT BUSINESS
Current-Dollar NIPA Measures
This table shows the NIPA components that had revi- Note that the incorporation of newly available and resions of $4.0 billion or more (in absolute value) for vised source data for a year usually results in a revision 2012–2014. The table also lists the major source data to the level of an estimate both for that year and for that were incorporated as part of this annual revision. subsequent years.
Table 13. Selected Components Detail and Major Source Data Incorporated—Continues
Line NIPA component
Billions of dollars Revised
2014 level
Major source data incorporated 1Revision in level
2012 2013 2014
1 Gross domestic product ................................................... –7.9 –104.9 –70.9 17,348.1
2 Personal consumption expenditures ........................... –32.5 –92.1 –64.4 11,865.9 3 Goods ........................................................................... –2.8 –14.4 –20.2 3,948.4 4 Durable goods ........................................................... –0.2 –11.5 –22.3 1,280.2 5 Motor vehicles and par ts .......................................
Of which: 0.7 –1.0 –7.7 440.2
6 Net purchases of used motor vehicles............ 0.3 –1.9 –9.6 109.2 Revised trade source data on cars and trucks in operation for 2012 and 2013; new trade source data on cars and trucks in operation for 2014; revised Census Bureau monthly retail trade sur vey (MRTS) data on retail sales of used motor vehicle dealers for 2014.
7 Furnishings and durable household equipment ..... 0.3 –0.7 0.4 287.9 8 Recreational goods and vehicles ...........................
Of which: 9 Video, audio, photographic, and information
1.8 –1.9 –7.0 354.6
processing equipment and media ............... 2.2 –1.7 –6.5 210.8 Revised Census Bureau annual retail trade survey (ARTS) data for 2012; new ARTS data for 2013; revised MRTS data for 2014; revised trade source retail scanner data for 2012 and 2013; new trade source retail scanner data for 2014.
10 Other durable goods .............................................. –3.0 –7.9 –8.0 197.5 Revised ARTS data for 2012; new ARTS data for 2013; revised MRTS data for 2014.
11 Nondurable goods ..................................................... –2.6 –3.0 2.0 2,668.2 12 Food and beverages purchased for off-premises
consumption ....................................................... Of which:
13 Food and nonalcoholic beverages purchased
–6.1 –6.2 –2.1 886.5
for off-premises consumption ...................... –5.8 –4.8 –1.6 759.9 Revised ARTS data for 2012; new ARTS data for 2013; revised MRTS data for 2014; revised trade source retail scanner data for 2012 and 2013; new trade source retail scanner data for 2014.
14 Clothing and footwear ............................................ 0.6 1.8 3.4 368.9 15 Gasoline and other energy goods.......................... 1.4 4.7 2.9 401.1 Revised Energy Information Administration supply data on non-diesel fuel
for 2012–2014; new Bureau of Labor Statistics (BLS) consumer expenditure survey data on diesel fuel for 2013.
16 Other nondurable goods ........................................ 1.6 –3.2 –2.2 1,011.7 17 Services ........................................................................ –29.7 –77.6 –44.2 7,917.5 18 Household consumption expenditures (for services) –34.1 –75.9 –38.5 7,595.2 19 Housing and utilities............................................... –13.6 –28.9 –23.4 2,142.6 20 Housing ..............................................................
Of which: –13.5 –28.4 –21.4 1,824.8
21 Rental of tenant-occupied nonfarm housing
22 Imputed rental of owner-occupied nonfarm
–11.3 –21.2 –13.1 448.7 Revised Census Bureau current population survey/housing vacancy sur vey (CPS/HVS) data for 2012 and 2013; new CPS/HVS data for 2014; new American housing survey (AHS) units for 2013; revised Bureau of Economic Analysis (BEA) household utilities data for 2012 and 2013; new BEA household utilities data for 2014; new BLS consumer expenditure survey data on tenant expenditures for 2013.
housing .................................................... 1.3 –5.3 –6.2 1,351.0 Revised CPS/HVS data for 2012 and 2013; new CPS/HVS data for 2014; new AHS data for 2013.
23 Household utilities .............................................. –0.1 –0.6 –2.0 317.7 24 Health care ............................................................ –18.8 –39.6 –43.2 1,954.0 25 Outpatient ser vices ............................................
Of which: –8.9 –20.0 –18.9 874.7
26 Physician services....................................... –5.9 –19.2 –16.9 451.1 Revised Census Bureau ser vice annual sur vey (SAS) taxable and tax-exempt revenue data for 2012 and 2013; new SAS data for 2014.
27 Hospital and nursing home services .................. Of which:
–10.0 –19.6 –24.3 1,079.3
28 Hospitals ..................................................... –10.0 –20.6 –26.8 908.9 Revised SAS taxable and tax-exempt revenue data for 2012 and 2013; new
SAS data for 2014. 29 Transportation ser vices..........................................
Of which: –0.4 1.2 9.7 354.5
30 Motor vehicle maintenance and repair ............ –0.4 0.1 5.9 177.4 Revised SAS taxable revenue data for 2012 and 2013; new SAS data for 2014; new ARTS data for 2013; revised MRTS data for 2014; revised trade source data for 2012–2014.
See the footnotes and abbreviations at the end of the table.
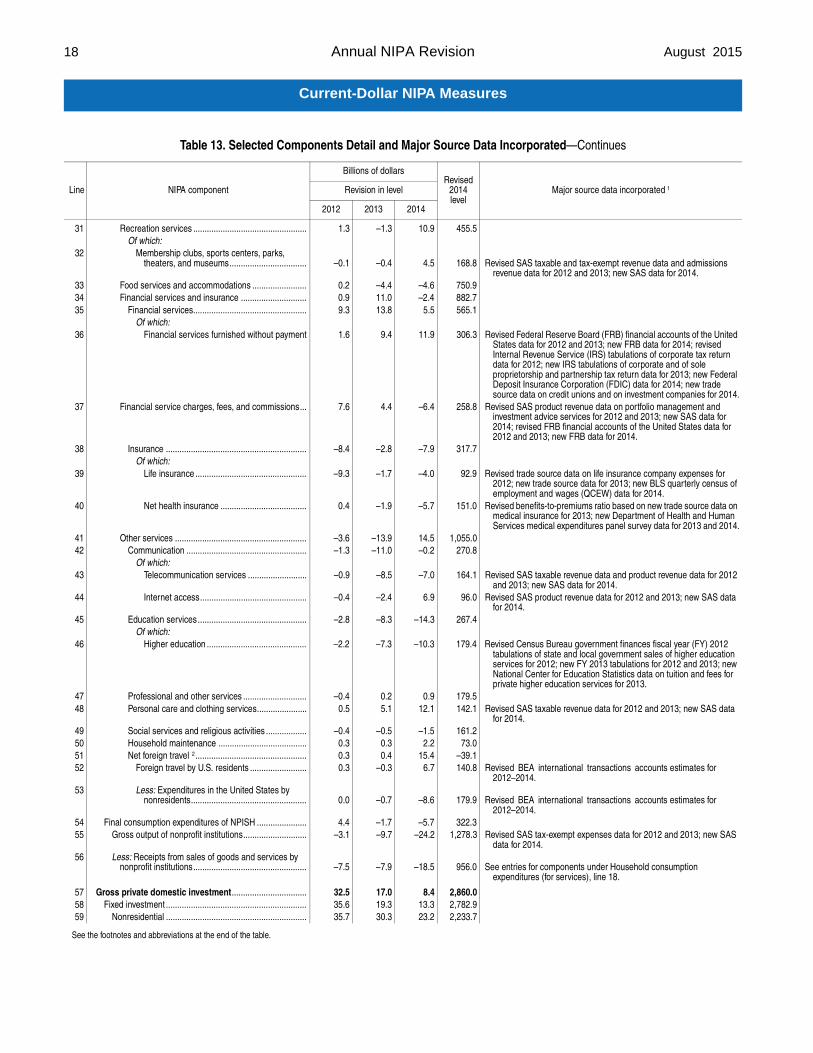
18 Annual NIPA Revision August 2015
Current-Dollar NIPA Measures
Table 13. Selected Components Detail and Major Source Data Incorporated—Continues
Line NIPA component
Billions of dollars Revised
2014 level
Major source data incor porated 1Revision in level
2012 2013 2014
31 Recreation services .................................................. Of which:
32 Membership clubs, spor ts centers, parks,
1.3 –1.3 10.9 455.5
theaters, and museums .................................. –0.1 –0.4 4.5 168.8 Revised SAS taxable and tax-exempt revenue data and admissions revenue data for 2012 and 2013; new SAS data for 2014.
33 Food services and accommodations ........................ 0.2 –4.4 –4.6 750.9 34 Financial services and insurance ............................. 0.9 11.0 –2.4 882.7 35 Financial ser vices..................................................
Of which: 9.3 13.8 5.5 565.1
36 Financial services furnished without payment 1.6 9.4 11.9 306.3 Revised Federal Reser ve Board (FRB) financial accounts of the United States data for 2012 and 2013; new FRB data for 2014; revised Internal Revenue Ser vice (IRS) tabulations of corporate tax return data for 2012; new IRS tabulations of corporate and of sole proprietorship and par tnership tax return data for 2013; new Federal Deposit Insurance Corporation (FDIC) data for 2014; new trade source data on credit unions and on investment companies for 2014.
37 Financial service charges, fees, and commissions ... 7.6 4.4 –6.4 258.8 Revised SAS product revenue data on por tfolio management and investment advice services for 2012 and 2013; new SAS data for 2014; revised FRB financial accounts of the United States data for 2012 and 2013; new FRB data for 2014.
38 Insurance .............................................................. Of which:
–8.4 –2.8 –7.9 317.7
39 Life insurance ................................................. –9.3 –1.7 –4.0 92.9 Revised trade source data on life insurance company expenses for 2012; new trade source data for 2013; new BLS quar terly census of employment and wages (QCEW) data for 2014.
40 Net health insurance ...................................... 0.4 –1.9 –5.7 151.0 Revised benefits-to-premiums ratio based on new trade source data on medical insurance for 2013; new Depar tment of Health and Human Services medical expenditures panel survey data for 2013 and 2014.
41 Other services .......................................................... –3.6 –13.9 14.5 1,055.0 42 Communication .....................................................
Of which: –1.3 –11.0 –0.2 270.8
43 Telecommunication ser vices .......................... –0.9 –8.5 –7.0 164.1 Revised SAS taxable revenue data and product revenue data for 2012 and 2013; new SAS data for 2014.
44 Internet access ............................................... –0.4 –2.4 6.9 96.0 Revised SAS product revenue data for 2012 and 2013; new SAS data for 2014.
45 Education ser vices ................................................ Of which:
–2.8 –8.3 –14.3 267.4
46 Higher education ............................................ –2.2 –7.3 –10.3 179.4 Revised Census Bureau government finances fiscal year (FY) 2012 tabulations of state and local government sales of higher education services for 2012; new FY 2013 tabulations for 2012 and 2013; new National Center for Education Statistics data on tuition and fees for private higher education services for 2013.
47 Professional and other services ............................ –0.4 0.2 0.9 179.5 48 Personal care and clothing services...................... 0.5 5.1 12.1 142.1 Revised SAS taxable revenue data for 2012 and 2013; new SAS data
for 2014. 49 Social services and religious activities .................. –0.4 –0.5 –1.5 161.2 50 Household maintenance ....................................... 0.3 0.3 2.2 73.0 51 Net foreign travel 2 ................................................. 0.3 0.4 15.4 –39.1 52 Foreign travel by U.S. residents .........................
53 Less: Expenditures in the United States by
0.3 –0.3 6.7 140.8 Revised BEA international transactions accounts estimates for 2012–2014.
nonresidents................................................... 0.0 –0.7 –8.6 179.9 Revised BEA international transactions accounts estimates for 2012–2014.
54 Final consumption expenditures of NPISH ...................... 4.4 –1.7 –5.7 322.3 55 Gross output of nonprofit institutions ............................
56 Less: Receipts from sales of goods and services by
–3.1 –9.7 –24.2 1,278.3 Revised SAS tax-exempt expenses data for 2012 and 2013; new SAS data for 2014.
nonprofit institutions .................................................. –7.5 –7.9 –18.5 956.0 See entries for components under Household consumption expenditures (for services), line 18.
57 Gross private domestic investment ................................. 32.5 17.0 8.4 2,860.0 58 Fixed investment .............................................................. 35.6 19.3 13.3 2,782.9 59 Nonresidential .............................................................. 35.7 30.3 23.2 2,233.7
See the footnotes and abbreviations at the end of the table.

19 August 2015 SURVEY OF CURRENT BUSINESS
Current-Dollar NIPA Measures
Table 13. Selected Components Detail and Major Source Data Incorporated—Continues
Line NIPA component
Billions of dollars Revised
2014 level
Major source data incor porated 1Revision in level
2012 2013 2014
60 Structures ................................................................. 1.1 4.9 0.1 507.0 61 Commercial and health care ................................. 0.0 0.1 6.1 127.5 Revised Census Bureau construction spending (value-put-in-place)
data for 2013 and 2014. 62 Manufacturing ....................................................... 0.0 2.6 2.2 56.1 63 Power and communication ....................................
Of which: 0.0 3.2 –2.0 106.3
64 Other power ................................................... 0.0 3.1 –6.6 27.2 Revised Census Bureau construction spending (value-put-in-place) data for 2013 and 2014.
65 Mining exploration, shafts, and wells .................... Of which:
1.1 –2.1 –9.5 144.4
66 Petroleum and natural gas ............................. 1.1 –3.5 –10.5 132.8 Revised trade source data on footage drilled for 2012–2014; new Census Bureau annual capital expenditures survey data for 2013.
67 Other structures .................................................... 0.0 1.0 3.2 72.8 68 Equipment ................................................................ 33.9 22.6 19.4 1,036.7 69 Information processing equipment........................
Of which: 7.8 10.1 13.8 308.0
70 Computers and peripheral equipment ........... 1.4 4.5 3.6 79.3 New Census Bureau economic census data for 2012; new Census Bureau annual survey of manufactures (ASM) data for 2013; revised Census Bureau monthly industr y shipments data for 2014.
71 Communication equipment ............................ –5.6 –4.8 –1.4 97.2 New Census Bureau economic census data for 2012; new ASM data for 2013; revised Census Bureau monthly industr y shipments data for 2014.
72 Medical equipment and instruments .............. 4.5 3.6 4.1 84.8 New Census Bureau economic census data for 2012; new ASM data for 2013; revised Census Bureau monthly industr y shipments data for 2014.
73 Nonmedical instruments ................................ 6.6 7.3 8.1 36.1 New Census Bureau economic census data for 2012; new ASM data for 2013; revised Census Bureau monthly industr y shipments data for 2014.
74 Industrial equipment ............................................. Of which:
10.1 –2.8 –14.8 223.8
75 Engines and turbines ..................................... 4.5 3.7 0.9 9.8 New Census Bureau economic census data for 2012; new ASM data for 2013; revised Census Bureau monthly industr y shipments data for 2014.
76 Special industry machinery, n.e.c. ................. –4.0 –9.6 –22.4 40.0 New Census Bureau economic census data for 2012; new ASM data for 2013; revised Census Bureau monthly industr y shipments data for 2014.
77 General industrial, including materials handling, equipment ...................................
4.8 –0.2 3.5 83.7 New Census Bureau economic census data for 2012; new ASM data for 2013; revised Census Bureau monthly industr y shipments data for 2014.
78 Electrical transmission, distribution, and industrial apparatus ....................................
2.7 4.1 4.5 34.7 New Census Bureau economic census data for 2012; new ASM data for 2013; revised Census Bureau monthly industr y shipments data for 2014.
79 Transpor tation equipment ..................................... Of which:
1.7 12.4 14.8 272.4
80 Railroad equipment........................................ 2.3 6.7 7.6 18.2 Revised BEA annual input-output accounts data for 2012 and 2013; revised Census Bureau monthly industry shipments data for 2014.
81 Other equipment ................................................... Of which:
13.7 1.6 1.6 240.3
82 Agricultural machiner y ................................... 18.3 20.3 19.5 39.5 New Census Bureau economic census data for 2012; new ASM data for 2013; revised Census Bureau monthly industr y shipments data for 2014.
83 Construction machinery ................................. –12.5 –25.8 –24.8 40.7 New Census Bureau economic census data for 2012; new ASM data for 2013; revised Census Bureau monthly industr y shipments data for 2014.
84 Mining and oilfield machiner y ........................ 5.6 7.2 6.6 31.2 New Census Bureau economic census data for 2012; new ASM data for 2013; revised Census Bureau monthly industr y shipments data for 2014.
85 Intellectual property products ................................... 0.7 2.8 3.7 690.0 86 Software................................................................
Of which: 0.2 0.5 8.2 313.0
87 Prepackaged.................................................. 0.5 0.6 4.4 84.8 Revised SAS revenue data for 2012 and 2013; new SAS data for 2014.
See the footnotes and abbreviations at the end of the table.
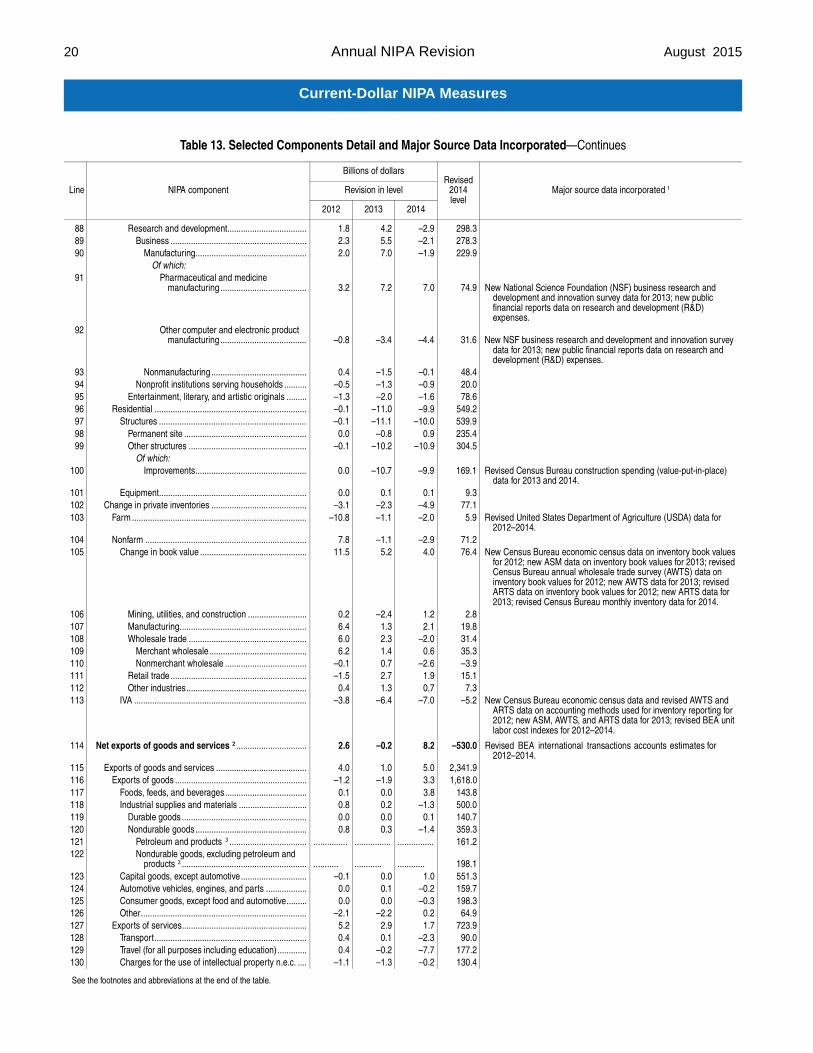
20 Annual NIPA Revision August 2015
Current-Dollar NIPA Measures
Table 13. Selected Components Detail and Major Source Data Incorporated—Continues
Line NIPA component
Billions of dollars Revised
2014 level
Major source data incor porated 1Revision in level
2012 2013 2014
88 Research and development................................... 89 Business ............................................................ 90 Manufacturing.................................................
Of which: 91 Pharmaceutical and medicine
manufacturing ......................................
92 Other computer and electronic product manufacturing ......................................
93 Nonmanufacturing .......................................... 94 Nonprofit institutions serving households .......... 95 Entertainment, literary, and artistic originals ......... 96 Residential ................................................................... 97 Structures ................................................................. 98 Permanent site ...................................................... 99 Other structures ....................................................
Of which: 100 Improvements.................................................
101 Equipment................................................................. 102 Change in private inventories .......................................... 103 Farm .............................................................................
104 Nonfarm ....................................................................... 105 Change in book value ...............................................
106 Mining, utilities, and construction .......................... 107 Manufacturing........................................................ 108 Wholesale trade .................................................... 109 Merchant wholesale ........................................... 110 Nonmerchant wholesale .................................... 111 Retail trade ............................................................ 112 Other industries ..................................................... 113 IVA ............................................................................
114 Net exports of goods and services 2 ...............................
115 Expor ts of goods and services ........................................ 116 Expor ts of goods .......................................................... 117 Foods, feeds, and beverages .................................... 118 Industrial supplies and materials .............................. 119 Durable goods ....................................................... 120 Nondurable goods ................................................. 121 Petroleum and products 3 .................................. 122 Nondurable goods, excluding petroleum and
products 3 ....................................................... 123 Capital goods, except automotive ............................. 124 Automotive vehicles, engines, and parts .................. 125 Consumer goods, except food and automotive ......... 126 Other ......................................................................... 127 Expor ts of services....................................................... 128 Transpor t ................................................................... 129 Travel (for all pur poses including education) ............. 130 Charges for the use of intellectual property n.e.c. ....
1.8 4.2 –2.9 2.3 5.5 –2.1 2.0 7.0 –1.9
3.2 7.2 7.0
–0.8 –3.4 –4.4
0.4 –1.5 –0.1 –0.5 –1.3 –0.9 –1.3 –2.0 –1.6 –0.1 –11.0 –9.9 –0.1 –11.1 –10.0
0.0 –0.8 0.9 –0.1 –10.2 –10.9
0.0 –10.7 –9.9
0.0 0.1 0.1 –3.1 –2.3 –4.9
–10.8 –1.1 –2.0
7.8 –1.1 –2.9 11.5 5.2 4.0
0.2 –2.4 1.2 6.4 1.3 2.1 6.0 2.3 –2.0 6.2 1.4 0.6
–0.1 0.7 –2.6 –1.5 2.7 1.9 0.4 1.3 0.7
–3.8 –6.4 –7.0
2.6 –0.2 8.2
4.0 1.0 5.0 –1.2 –1.9 3.3 0.1 0.0 3.8 0.8 0.2 –1.3 0.0 0.0 0.1 0.8 0.3 –1.4
............... ................ ................
........... ............ ............ –0.1 0.0 1.0 0.0 0.1 –0.2 0.0 0.0 –0.3
–2.1 –2.2 0.2 5.2 2.9 1.7 0.4 0.1 –2.3 0.4 –0.2 –7.7
–1.1 –1.3 –0.2
298.3 278.3 229.9
74.9 New National Science Foundation (NSF) business research and development and innovation survey data for 2013; new public financial reports data on research and development (R&D) expenses.
31.6 New NSF business research and development and innovation sur vey data for 2013; new public financial reports data on research and development (R&D) expenses.
48.4 20.0 78.6
549.2 539.9 235.4 304.5
169.1 Revised Census Bureau construction spending (value-put-in-place) data for 2013 and 2014.
9.3 77.1 5.9 Revised United States Depar tment of Agriculture (USDA) data for
2012–2014. 71.2 76.4 New Census Bureau economic census data on inventor y book values
for 2012; new ASM data on inventor y book values for 2013; revised Census Bureau annual wholesale trade survey (AWTS) data on inventory book values for 2012; new AWTS data for 2013; revised ARTS data on inventor y book values for 2012; new ARTS data for 2013; revised Census Bureau monthly inventory data for 2014.
2.8 19.8 31.4 35.3 –3.9 15.1 7.3
–5.2 New Census Bureau economic census data and revised AWTS and ARTS data on accounting methods used for inventory repor ting for 2012; new ASM, AWTS, and ARTS data for 2013; revised BEA unit labor cost indexes for 2012–2014.
–530.0 Revised BEA international transactions accounts estimates for 2012–2014.
2,341.9 1,618.0
143.8 500.0 140.7 359.3 161.2
198.1 551.3 159.7 198.3 64.9
723.9 90.0
177.2 130.4
See the footnotes and abbreviations at the end of the table.

21 August 2015 SURVEY OF CURRENT BUSINESS
Current-Dollar NIPA Measures
Table 13. Selected Components Detail and Major Source Data Incorporated—Continues
Line NIPA component
Billions of dollars Revised
2014 level
Major source data incor porated 1Revision in level
2012 2013 2014
131 Other business ser vices ........................................... 132 Government goods and services n.e.c. .................... 133 Other ........................................................................ 134 Impor ts of goods and services ........................................ 135 Impor ts of goods .......................................................... 136 Foods, feeds, and beverages ................................... 137 Industrial supplies and materials 3 ........................... 138 Durable goods ...................................................... 139 Nondurable goods 3 .............................................. 140 Petroleum and products .................................... 141 Nondurable goods, excluding petroleum and
products ......................................................... 142 Capital goods, except automotive ............................ 143 Automotive vehicles, engines, and parts .................. 144 Consumer goods, except food and automotive ........ 145 Other ........................................................................ 146 Impor ts of services ...................................................... 147 Transpor t .................................................................. 148 Travel (for all pur poses including education) ............ 149 Charges for the use of intellectual property n.e.c. .... 150 Other business ser vices ........................................... 151 Government goods and ser vices n.e.c. .................... 152 Other ........................................................................
153 Government consumption expenditures and gross investment .....................................................................
154 Federal gover nment ........................................................ 155 National defense .......................................................... 156 Consumption expenditures.......................................
Of which: 157 Services ............................................................
158 Gross investment .....................................................
159 Nondefense ................................................................. 160 Consumption expenditures.......................................
Of which: 161 Services ............................................................
162 Gross investment .....................................................
163 State and local ................................................................ 164 Consumption expenditures ..........................................
Of which: 165 Compensation of general government employees
166 Nondurable goods ................................................
167 Services ................................................................
168 Less: Sales to other sectors ................................. Of which:
169 Tuition and related educational charges ........
3.3 3.4 9.8 –1.4 –1.6 1.5 3.6 2.5 0.6 1.4 1.2 –3.3
–0.2 –0.4 3.0 0.0 0.0 –0.1
............... ................ ................ –0.1 0.0 0.5
............... ................ ................ 0.0 0.1 –0.2
0.0 0.0 1.3 0.0 0.1 –0.1 0.0 0.0 –0.4 0.0 0.0 0.4
–0.1 –0.5 1.5 1.6 1.6 –6.3 0.0 –0.1 –0.5 0.0 –0.6 –2.9
–0.8 0.0 0.6 2.5 2.3 –4.0 0.0 0.0 0.4
–0.1 0.1 0.0
–10.6 –29.7 –23.1 1.1 –0.9 0.7
–0.2 –2.3 –13.3 3.5 –2.0 –19.1
–0.2 –3.3 –17.7
–3.7 –0.2 5.8
1.3 1.4 14.0 0.8 0.3 9.2
0.8 1.3 6.6
0.6 1.1 4.8
–11.7 –28.8 –23.8 –9.8 –23.9 –19.4
0.1 –0.6 9.0
–6.8 –15.1 –18.9
–8.8 –21.2 –25.4
–5.9 –12.8 –15.1
–1.6 –5.4 –8.0
292.5 19.3 14.5
2,871.9 2,388.5
126.7 667.0 169.0 498.0 350.9
147.0 595.7 328.5 559.4 111.3 483.4
94.2 110.8
42.1 206.1
24.2 6.0
3,152.1 1,219.9
748.2 599.8
161.1 Revised allocations of FY 2012 and FY 2013 OMB Budget data for 2012 and 2013; revised FY 2014 OMB Budget data for 2013 and 2014; new preliminary FY 2015 OMB Budget data for 2014.
148.5 Revised Department of Defense Budget justification data for 2012– 2014; revised NSF data for 2012 and 2013; revised OMB Budget data for 2014.
471.6 355.5
84.1 Revised allocations of FY 2012 and FY 2013 OMB Budget data for 2012 and 2013; revised FY 2014 OMB Budget data for 2013 and 2014; new preliminary FY 2015 OMB Budget data for 2014.
116.1 Revised allocations of FY 2012 and FY 2013 OMB Budget data for 2012 and 2013; revised FY 2014 OMB Budget data for 2013 and 2014; new preliminary FY 2015 OMB Budget data for 2014; new and revised NSF survey data for 2012 and 2013.
1,932.3 1,601.0
1,238.9 Revised BLS quar terly census of employment and wages (QCEW) data for 2012 and 2013; new QCEW for 2014.
241.5 Revised Census Bureau gover nment finances FY 2012 tabulations for 2012; new FY 2013 tabulations for 2012 and 2013.
372.8 Revised Census Bureau government finances FY 2012 tabulations for 2012; new FY 2013 tabulations for 2012 and 2013.
430.1
96.3 Revised Census Bureau government finances FY 2012 tabulations for 2012; new FY 2013 tabulations for 2012 and 2013.
See the footnotes and abbreviations at the end of the table.

22 Annual NIPA Revision August 2015
Current-Dollar NIPA Measures
Table 13. Selected Components Detail and Major Source Data Incorporated—Continues
Line NIPA component
Billions of dollars Revised
2014 level
Major source data incorporated 1Revision in level
2012 2013 2014
170 Gross investment ......................................................... Of which:
–1.9 –4.9 –4.4 331.3
171 Structures .............................................................. –1.7 –4.8 –4.3 256.8 Revised Census Bureau gover nment finances FY 2012 tabulations for 2012; new FY 2013 tabulations for 2012 and 2013; revised Census Bureau construction spending (value-putin-place) data for 2013 and 2014.
172 Gross domestic product ...................................................... –7.9 –104.9 –70.9 17,348.1 173 Less: Statistical discrepancy 4 ................................................ 5.9 34.3 –30.0 –212.0
174 Equals: Gross domestic income ......................................... –13.8 –139.2 –40.9 17,560.1 175 Compensation of employees, paid ...................................... 3.6 –4.9 21.7 9,258.4 See entries for components under Compensation of employees, line
195, and additional source data below. 176 Wages and salaries ......................................................... –1.6 –10.1 26.5 7,487.2 177 Supplements to wages and salaries ................................ 5.2 5.2 –4.8 1,771.2 178 Taxes on production and impor ts ........................................ 0.0 15.5 10.6 1,213.7 See entries for components under Taxes on production and imports,
line 257. 179 Less: Subsidies ................................................................... 0.0 –0.8 0.6 57.9 180 Net operating sur plus .......................................................... –21.5 –156.2 –83.0 4,399.2 181 Private enterprises........................................................... –27.5 –167.1 –99.0 4,417.5 182 Current sur plus of government enter prises ..................... 6.0 10.8 15.9 –18.3 183 Consumption of fixed capital ............................................... 4.0 5.6 10.5 2,746.7 184 Private.............................................................................. 3.8 5.8 13.6 2,229.9 185 Domestic business ....................................................... 3.7 5.7 13.0 1,775.2 Revised BEA fixed investment and price estimates for 2012–2014. 186 Capital consumption allowances............................... –11.3 28.6 301.4 1,815.6 Revised IRS tabulations of corporate tax return data for 2012; new IRS
tabulations of cor porate and of sole proprietorship and partnership tax return data for 2013; revised Office of Tax Analysis bonus depreciation estimates for 2012–2014; revised BEA fixed investment estimates for 2012–2014.
187 Less: CCAdj 5............................................................ –15.0 22.9 288.3 40.4 188 Households and institutions ......................................... 0.1 0.1 0.6 454.8 189 Government ..................................................................... 0.3 –0.2 –3.1 516.8 190 Plus: Income receipts from the rest of the world 2................... 7.7 15.8 26.6 854.3 Revised BEA international transactions accounts estimates for
2012–2014. 191 Less: Income payments to the rest of the world 2................... –2.5 –10.3 –24.8 591.2 Revised BEA inter national transactions accounts estimates for
2012–2014.
192 Equals: Gross national income ........................................... –3.6 –113.1 10.5 17,823.2 193 Less: Consumption of fixed capital ......................................... 3.8 5.5 11.3 2,747.5 See entries for components under Consumption of fixed capital, line
183.
194 Equals: National income ...................................................... –7.6 –118.7 0.0 15,076.5
195 Compensation of employees ........................................... 3.4 –5.1 21.3 9,248.9 196 Wages and salaries ......................................................... –1.8 –10.3 26.1 7,477.8 197 Government.................................................................. –0.1 –0.5 15.1 1,237.2 Revised QCEW data for 2012 and 2013; new QCEW data for 2014;
revised FY 2014 OMB Budget data for 2013 and 2014; new preliminary FY 2015 OMB Budget data for 2014.
198 Other ............................................................................ –1.8 –9.8 11.0 6,240.5 Revised QCEW data for 2012 and 2013; new QCEW data for 2014; revised BLS noncovered industries data for 2013.
199 Supplements to wages and salaries ................................ 200 Employer contributions for employee pension and
5.2 5.2 –4.8 1,771.2
insurance funds ........................................................ 4.8 3.9 –2.4 1,224.0 New Department of Labor pension data for 2012; revised Pension Benefit Guaranty Corporation (PBGC) data for 2012; new PBGC data for 2013; revised FRB financial accounts of the United States data for 2012 and 2013; new FRB data for 2014; revised FY 2012 Census Bureau survey of public pensions data for 2012; new FY 2013 survey of public pensions data for 2012 and 2013; new Depar tment of Health and Human Services medical expenditure panel survey data for 2013 and 2014.
201 Employer contributions for government social insurance ..................................................................
0.4 1.3 –2.4 547.2
202 Proprietors’ income with IVA and CCAdj ........................ –18.8 –51.5 –33.5 1,346.7 203 Farm ................................................................................ –10.7 5.6 14.5 78.1 204 Proprietors’ income with IVA ........................................ –10.7 5.6 14.6 84.1 Revised USDA data for 2012–2014. 205 CCAdj ........................................................................... 0.0 0.0 –0.1 –6.0
See the footnotes and abbreviations at the end of the table.

23 August 2015 SURVEY OF CURRENT BUSINESS
Current-Dollar NIPA Measures
Table 13. Selected Components Detail and Major Source Data Incorporated—Continues
Line NIPA component
Billions of dollars Revised
2014 level
Major source data incorporated 1Revision in level
2012 2013 2014
206 Nonfarm ............................................................................ 207 Proprietors’ income ........................................................
208 IVA ................................................................................. 209 CCAdj ............................................................................
210 Rental income of persons with CCAdj .............................. 211 Rental income of persons .................................................
212 CCAdj ................................................................................
213 Corporate profits with IVA and CCAdj .............................. 214 Domestic industries ........................................................... 215 Financial ........................................................................ 216 Nonfinancial ................................................................... 217 Rest of the world 2.............................................................
218 Less: CCAdj..........................................................................
219 Equals: Corporate profits with IVA ........................................
220 Domestic industries ........................................................... 221 Financial ........................................................................ 222 Federal Reserve banks .............................................. 223 Other financial ............................................................ 224 Nonfinancial ................................................................... 225 Utilities........................................................................ 226 Manufacturing............................................................. 227 Durable goods ........................................................ 228 Nondurable goods .................................................. 229 Wholesale trade ......................................................... 230 Retail trade ................................................................. 231 Transpor tation and warehousing ................................ 232 Information ................................................................. 233 Other nonfinancial ...................................................... 234 Rest of the world 2 .............................................................
235 Less: IVA ............................................................................... 236 Equals: Corporate profits before tax without IVA and CCAdj
237 Less: Taxes on corporate income ......................................... 238 Equals: Profits after tax......................................................... 239 Less: Net corporate dividend payments ............................... 240 Equals: Undistributed corporate profits.................................
241 Net interest and miscellaneous payments ....................... 242 Net interest ........................................................................ 243 Domestic business.........................................................
Of which: 244 Monetary interest paid ............................................
–8.1 –57.1 –48.1 –7.4 –75.5 –139.1
–0.4 –0.4 0.3 –0.3 18.8 90.7
–7.6 –32.4 –29.4 –7.6 –32.3 –29.3
0.0 –0.1 –0.1
–24.6 –69.5 –16.9 –33.1 –81.2 –41.1 –13.4 –104.2 –65.0 –19.8 23.0 24.0
8.5 11.7 24.2
–14.6 4.3 197.7
–10.0 –73.8 –214.6
–18.5 –85.5 –238.8 –9.8 –109.8 –87.5
0.0 0.0 10.9 –9.8 –109.8 –98.4 –8.7 24.3 –151.3 –0.4 5.5 –19.8 –8.4 23.9 –57.3 –2.8 7.5 –39.3 –5.6 16.4 –18.1 –1.4 –9.0 –17.8 –3.1 –11.8 –19.9
2.0 –9.6 –12.8 –0.6 21.1 –4.3
3.2 4.0 –19.4 8.5 11.7 24.2
–4.7 –0.1 –2.5 –5.3 –73.7 –212.1
–7.2 –5.4 –78.8 1.9 –68.3 –133.4 2.2 –35.5 –45.1
–0.4 –32.8 –88.3
36.0 13.8 46.0 36.0 13.8 45.2 34.0 –0.5 ...............
7.1 –82.7 ...............
1,268.6 1,072.0 Revised IRS tabulations of corporate tax return data for the
posttabulation adjustments for 2012; new IRS tabulations of sole proprietorship and par tnership tax retur n data for 2013; new Census Bureau nonfiler income data for 2013; revised Office of Tax Analysis bonus depreciation estimates for 2012–2014.
1.1 195.5 See entries for components under Consumption of fixed capital, line
183.
610.8 628.0 Revised Census Bureau current population survey/housing vacancy
survey (CPS/HVS) data for 2012 and 2013; new CPS/HVS data for 2014; new Census Bureau American housing survey (AHS) data for 2012 and 2013; revised BEA household utilities data for 2012 and 2013; new BEA household utilities data for 2014; revised trade source data on insurance for 2012; new trade source data on insurance for 2013.
–17.2
2,072.9 1,654.7
383.6 1,271.1
418.2 Revised BEA international transactions accounts estimates for 2012–2014.
–131.9 See entries for components under Consumption of fixed capital, line 183.
2,204.9 See entries for components under Corporate profits before tax without IVA and CCAdj, line 236.
1,786.6 423.4 103.4 320.0
1,363.2 27.7
439.8 223.3 216.5 147.7 158.4
65.3 126.5 397.7 418.2 See entries for components under Corporate profits with IVA and
CCAdj, line 217. –2.9
2,207.8 Revised IRS tabulations of corporate tax return data for 2012; new IRS tabulations for 2013; revised Census Bureau quar terly financial report data for 2014; new and revised regulatory agency and public financial reports data on profits for 2014.
513.9 1,693.9
860.0 833.9
532.3 508.5 357.2
1,198.2 Revised IRS tabulations of corporate tax return data for 2012; new IRS tabulations of corporate and of sole proprietorship and par tnership tax return data for 2013; revised FRB financial accounts of the United States data on nonfinancial corporate liabilities for 2012 and 2013; new FRB data for 2014; revised USDA data on interest paid by farmers for 2012 and 2013; new USDA data for 2014; new FDIC data for 2014; new trade source data on credit unions and on investment companies for 2014.
See the footnotes and abbreviations at the end of the table.

24 Annual NIPA Revision August 2015
Current-Dollar NIPA Measures
Table 13. Selected Components Detail and Major Source Data Incorporated—Continues
Line NIPA component
Billions of dollars Revised
2014 level
Major source data incorporated 1Revision in level
2012 2013 2014
245 Less: Monetary interest received .......................
246 Imputed interest paid, depositor, insurance, and pension ser vices ............................................. Of which:
247 Banks, credit agencies, and investment companies ...............................................
248 Life insurance carriers .................................
249 Employee pension plans .............................
250 Less: Imputed interest received, depositor, insurance, and pension services ....................
251 Owner-occupied housing .......................................... 252 Nonprofit institutions .................................................. 253 Rest of the world 2 ..................................................... 254 Miscellaneous payments............................................... 255 Federal rents and royalties ........................................ 256 State and local rents and royalties ............................
257 Taxes on production and imports ................................. 258 Federal ..........................................................................
259 State and local ..............................................................
260 Less: Subsidies .............................................................. 261 Federal .......................................................................... 262 State and local ..............................................................
263 Business current transfer payments (net) ................... 264 To persons (net) ............................................................ 265 To government (net) ......................................................
266 To the rest of the world (net) 2 ......................................
267 Current surplus of government enterprises ................ 268 Federal ..........................................................................
269 State and local ..............................................................
Addenda:
270 Gross national product .....................................................
271 Gross saving ......................................................................
–26.4 –69.7 ..............
–2.2 28.6 ..............
0.4 8.4 ..............
–0.2 9.8 ..............
–0.2 13.2 ..............
–1.6 17.2 ..............
0.2 –0.1 .............. 0.0 –0.1 .............. 1.9 14.5 .............. 0.0 –0.1 0.8 0.0 0.1 0.9 0.0 –0.2 –0.2
0.0 15.5 10.6 0.1 4.9 3.7
–0.1 10.6 6.8
0.0 –0.8 0.6 0.0 –0.8 0.6 0.0 0.0 0.0
–2.0 –1.2 –13.3 –0.4 –1.2 –2.2 0.7 2.9 –4.8
–2.3 –2.9 –6.3
6.0 10.8 15.9 0.2 4.0 10.0
5.8 6.9 5.9
2.3 –78.9 –19.5
35.7 5.1 111.2
1,599.9 Revised IRS tabulations of cor porate tax return data for 2012; new IRS tabulations of cor porate and of sole proprietorship and par tnership tax return data for 2013; revised FRB financial accounts of the United States data on nonfinancial corporate assets for 2012 and 2013; new FRB data for 2014; new FDIC data for 2014; new trade source data on credit unions and on investment companies for 2014.
931.9
271.9 Revised IRS tabulations of corporate tax return data for 2012; new IRS tabulations for 2013; new FDIC data for 2014; new trade source data on credit unions and on investment companies for 2014.
264.3 New trade source data on investment income of life insurance carriers for 2013; revised FRB financial accounts of the United States data on life insurance company assets for 2012 and 2013; new FRB data for 2014.
361.4 Revised PBGC data on defined benefit pension plans for 2012; new PBGC data for 2013; revised FRB financial accounts of the United States data on defined benefit pension plans for 2012–2014.
248.3 Revised PBGC data on defined benefit pension plans for 2012; new PBGC data for 2013; revised FRB financial accounts of the United States data on defined benefit pension plans for 2012–2014; revised FRB financial accounts of the United States data for 2012 and 2013; new FRB data for 2014; revised IRS tabulations of corporate tax return data for 2012; new IRS tabulations for 2013; new FDIC data for 2014.
288.2 8.8
–145.7 23.8 10.6 13.2
1,213.7 137.8 Revised FY 2014 OMB Budget data for 2013 and 2014; new preliminar y FY
2015 OMB Budget data for 2014; revised IRS data on federal excise taxes for 2013 and 2014; new Alcohol and Tobacco Tax and Trade Bureau data for 2013 and 2014.
1,075.9 Revised Census Bureau government finances FY 2012 tabulations for 2012; new FY 2013 tabulations for 2012 and 2013; revised FY 2012 and FY 2013 Census Bureau state government tax collections data for 2012 and 2013; new FY 2014 state government tax collections data for 2013 and 2014.
57.9 57.4 0.5
127.3 42.0 94.8 New federal receipts data from the IRS and the Department of the Treasury
for 2014; new FDIC data on deposit insurance premiums for 2014; revised USDA data on federal flood and crop insurance premiums for 2013; new USDA data for 2014.
–9.5 Revised international transactions accounts estimates for 2012–2014.
–18.3 –9.7 Revised FY 2014 OMB Budget data for 2013 and 2014; new preliminar y FY
2015 OMB Budget data for 2014; new annual financial repor ts of federal enterprises data for 2013 and 2014.
–8.6 Revised Census Bureau gover nment finances FY 2012 tabulations for 2012; new FY 2013 tabulations for 2012 and 2013.
17,611.2
3,266.8
See the footnotes and abbreviations at the end of the table.

25 August 2015 SURVEY OF CURRENT BUSINESS
Current-Dollar NIPA Measures
Table 13. Selected Components Detail and Major Source Data Incorporated—Table Ends
Line NIPA component
Billions of dollars Revised
2014 level
Major source data incorporated 1Revision in level
2012 2013 2014
272 Personal income ...................................................................... 27.4 –98.5 –39.7 14,694.2 See entries for components under National Income, line 194, and additional sources below.
273 Compensation of employees ................................................. 3.4 –5.1 21.3 9,248.9 274 Proprietors’ income with IVA and CCAdj................................ –18.8 –51.5 –33.5 1,346.7 275 Rental income of persons with CCAdj ................................... –7.6 –32.4 –29.4 610.8 276 Personal income receipts on assets ...................................... 35.2 –19.3 –7.8 2,117.5 277 Personal interest income .................................................... 32.9 16.2 37.3 1,302.0 Revised FRB financial accounts of the United States data for 2012 and 2013;
new FRB data for 2014; revised IRS tabulations of cor porate tax return data for 2012; new IRS tabulations of corporate and of sole proprietorship and par tnership tax return data for 2013; new trade source data on investment income of life insurance carriers for 2013; new FDIC data for 2014; new trade source data on credit unions and on investment companies for 2014.
278 Personal dividend income .................................................. 2.3 –35.5 –45.1 815.5 Revised IRS tabulations of corporate tax return data for 2012; new IRS tabulations for 2013; new and revised regulatory agency and public financial repor ts data on dividends for 2014; revised BEA international transactions accounts estimates for 2012–2014.
279 Personal current transfer receipts .......................................... 15.6 12.1 6.5 2,529.2 280 Government social benefits to persons .............................. 16.0 13.3 8.7 2,487.2 281 Federal ............................................................................ 16.6 16.4 13.9 1,877.3 Revised FY 2014 OMB Budget data for 2013 and 2014; new preliminary FY
2015 OMB Budget data for 2014; new and revised administrative data on other government social benefits programs for 2012–2014; revised Depar tment of Labor data on unemployment benefits for 2012–2014; revised IRS data on refundable tax credit programs for 2012 and 2013; revised Centers for Medicare and Medicaid Ser vices (CMS) data on incurred Medicare benefits for 2012 and 2013; new CMS data for 2014.
282 State and local ................................................................ –0.6 –3.1 –5.2 609.9 Revised Census Bureau government finances FY 2012 tabulations for 2012; new FY 2013 tabulations for 2012 and 2013; revised CMS data on Medicaid benefits for 2014.
283 Other current transfer receipts, from business (net) .................. –0.4 –1.2 –2.2 42.0 284 Less: Contributions for government social insurance, domestic 0.4 2.3 –3.2 1,159.0 285 Federal ................................................................................... 0.1 1.1 –4.9 1,145.2 Revised Social Security Administration (SSA) data on taxable earnings for
2013; new SSA data for 2014; revised MTS data for 2014; new QCEW data on wages for 2014.
286 State and local ....................................................................... 0.3 0.9 1.3 18.9 287 Less: Personal current taxes ..................................................... 7.7 11.0 36.3 1,780.2 288 Federal ................................................................................... 15.7 13.8 21.7 1,396.9 Revised SSA data on taxable earnings for 2013; new SSA data for 2014;
revised MTS data for 2014; new QCEW data on wages for 2014; new IRS data on refundable tax credit programs for 2012–2014.
289 State and local ....................................................................... –8.0 –2.8 14.6 383.3 Revised Census Bureau government finances FY 2012 tabulations for 2012; new FY 2013 tabulations for 2012 and 2013; revised FY 2012 and FY 2013 Census Bureau state government tax collections data for 2012 and 2013; new FY 2014 state government tax collections data for 2013 and 2014.
290 Equals: Disposable personal income ........................................ 19.7 –109.5 –76.1 12,913.9 291 Less: Personal outlays .............................................................. –30.8 –91.4 –63.7 12,293.7 292 Personal consumption expenditures ...................................... –32.5 –92.1 –64.4 11,865.9 293 Personal interest payments.................................................... –1.0 –2.9 –2.6 254.2 Revised FRB interest rate data for 2012–2014; revised FRB consumer credit
outstanding data for 2012–2014; revised FRB financial accounts of the United States data for 2012 and 2013; new FRB data for 2014.
294 Personal current transfer payments ....................................... 2.7 3.6 3.2 173.6 295 To government .................................................................... 1.1 1.3 0.5 95.3 296 To the rest of the world (net) 2 ............................................ 1.5 2.3 2.7 78.3 297 Equals: Personal saving ............................................................ 50.5 –18.1 –12.4 620.2
BEA Bureau of Economic Analysis BLS Bureau of Labor Statistics CCAdj Capital consumption adjustment FDIC Federal Deposit Insurance Corporation FRB Federal Reser ve Board FY Fiscal year IRS Internal Revenue Ser vice IVA Inventor y valuation adjustment NIPAs National income and product accounts NPISHs Nonprofit institutions serving households OMB Office of Management and Budget USDA United States Department of Agriculture 1. In these descriptions, “new” indicates that this is the first time that data from a specific source
are being incor porated into the component estimate for the given year, and “revised” indicates that
data from the source were incor porated previously, and now revised data from that source are being incorporated.
2. Revisions reflect the annual revision of BEA's international transactions accounts (ITAs). For more information, see Jeffrey R. Bogen, “Annual Revision of the U.S. International Transactions Accounts,” SUR VEY OF CURRENT BUSINESS 95 (July 2015): 1–11. Additionally, revisions may reflect changes previously incorporated into the ITAs but not into the NIPAs because they affected years outside of the periods open for revision.
3. Revisions are not shown because this component was not previously published. 4. The statistical discrepancy is gross domestic product (GDP) less gross domestic income
(GDI); it is also the difference between gross national product (GNP) and gross national income (GNI), which is GDI plus net income receipts from the rest of the world. The statistical discrepancy arises because the product-side measures of GDP and GNP are estimated independently from the income-side measures of GDI and GNI.
5. CCAdj is calculated as capital consumption allowances less consumption of fixed capital.

26 Annual NIPA Revision August 2015
Data Availability
Annual NIPA estimates for 1929 forward and quarterly estimates for 1947 forward are available on BEA’s Web site in more than 350 interactive tables that are arranged in roughly the same order as the seven summary accounts. The tables can be downloaded in a variety of formats, customized by date and by frequency, and displayed in charts.1
Selected revised NIPA tables will be released later this fall: ● Table 2.9 (personal income by households and by non
profit institutions serving households (NPISHs)) ● Tables 3.15–3.17 (government spending by function) ● Tables 3.18 and 3.19 (reconciliation of federal govern
ment and of state and local government spending estimates with related source data)
● Tables 3.20 and 3.21 (state government and local government current receipts and expenditures)
● Tables 3.22 and 3.23 (not seasonally adjusted estimates
1. For a detailed description of the NIPA table numbering system, see the FAQ “How are the NIPA tables organized?”
of federal government and of state and local government current receipts and expenditures)
● Table 7.15 (reconciliation of NIPA farm income estimates with USDA farm income forecast data)
● Table 7.19 (reconciliation of NIPA income and outlays of NPISH with IRS revenue and expenses)
In addition, several other BEA estimates will be updated later this year to reflect the results of this year’s NIPA revision: ● The fixed assets accounts, which present estimates of
capital investment by legal form and by type, for 2012–2014
● The integrated macroeconomic accounts jointly published by BEA and the Federal Reserve Board, which relate production, income and spending, capital formation, financial transactions, and asset revaluations to changes in net worth for the major sectors of the U.S. economy
● State personal income ● The GDP by industry and input-output accounts

27 August 2015 SURVEY OF CURRENT BUSINESS
Acknowledgments
Nicole M. Mayerhauser, Chief of the National Income and Wealth Division, supervised the preparation of this year’s annual revision of the national income and product accounts. Pamela A. Kelly, Chief of the Government Division, directed major parts of the revision. Brent R. Moulton, Associate Director for National Economic Accounts, provided overall supervision.
The following BEA staff members significantly contributed to the revision.
Estimate coordination and review: David F. Sullivan, Marissa J. Crawford, Alyssa E. Holdren, Pamela A. Kelly, Robert J. Kornfeld, Brendan J. Leary, Shelly Smith, Jiemin Guo.
Personal consumption expenditures: Kyle J. Brown. Goods: Harvey L. Davis, Jr., Yukun Fung, Everette P. Johnson, Andrea Julca, Yuri A. Katrinic, Brian K. Sliker. Services: Jason W. Chute, Robert N. Ganz III, Mahmoud Raya, Teresita D. Teensma.
Investment and foreign transactions: Michael Armah. Inventories, foreign transactions, and prices: Michael M. Cortez, Matthew L. Kopp, Ivan K. Mogensen, Rebecca E. Pocase. Private fixed investment in structures, in equipment, and in intellectual property products: Christina D. Hovland, Benjamin W. Bloschock, Kyle A. Cisco, Velma P. Henry, Bethany A. McDonough.
Federal government: Mark S. Ludwick, Peter G. Beall, Stan J. Bellotti, Andrea L. Cook, Greg R. Linder, Benjamin A. Mandel, Ann W. Miller, Kyle D. Mulgrew, Farah
Naz, Michelle D. Robinson, Mary L. Roy, Benyam Tsehaye, Andrew E. Vargo, Bryan Williams, Takashi Yamashita.
State and local government: Jeffrey L. Barnett, Steven J. Andrews, Kenneth R. Beatty, Melissa J. Braybrooks, Michelle S. Grier, David G. Lenze.
Income estimates: Kurt Kunze. Compensation, housing, and insurance: Janet H. Kmitch, Kevin M. Curran, Brad G. Fowler, Denise A. McBride, James E. Rankin, Brian J. Smith. Business and interest income: Howard I. Krakower, Julia E. Creighton, Elizabeth M. Driscoll, Kate L. Pinard, Martin L. Simmons, Dennis R. Weikel.
Consumption of fixed capital: Private: Robert J. Kornfeld, Marlyn Rodriguez, Michael T. Cusick. Government: Jennifer A. Bennett, Mark A. Bailey, Christopher B. Mbu.
Computer systems and operations: Brendan J. Leary, Michael J. Boehm, Wanda Y. Chambers, Benjamin D. Cowan, Duane G. Hackmann, Sung H. Lee, Maksim Lichko, Ethan C. Lincoln, Nimesh Mehta, Sandip Mehta, Ross F. Metzger, Andrew J. Pinard, James J. Raley III, Michael D. Randall.
Supplemental review materials: Esther M. Carter, Tameka R. L. Harris, Bethany A. McDonough, Kristina L. Maze, Stephanie H. McCulla, Bonnie A. Retus, Karl V. Rohrer.
NIPA information: Jeannine Aversa, Thomas B. Dail, Gianna M. Maronne, Lisa S. Mataloni.
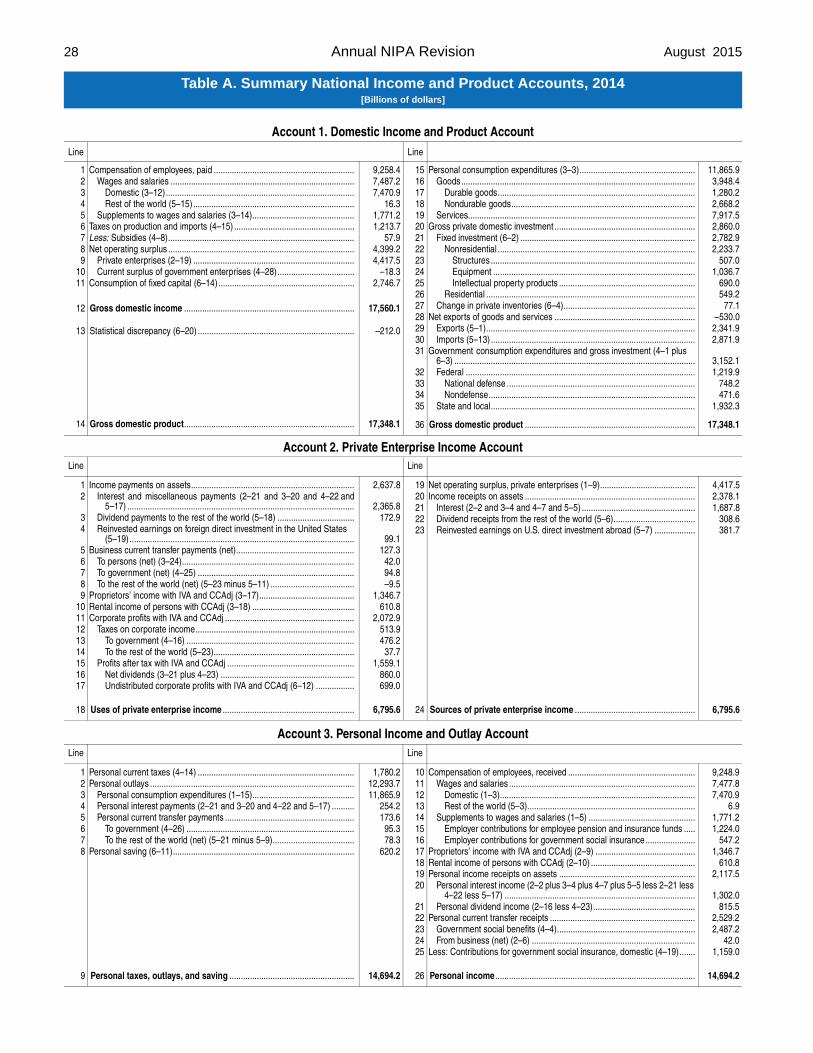
28 Annual NIPA Revision August 2015
Table A. Summary National Income and Product Accounts, 2014 [Billions of dollars]
Account 1. Domestic Income and Product Account Line Line
1 Compensation of employees, paid .............................................................. 9,258.4 15 Personal consumption expenditures (3–3) ................................................... 11,865.9 2 Wages and salaries ................................................................................. 7,487.2 16 Goods ....................................................................................................... 3,948.4 3 Domestic (3–12) ................................................................................... 7,470.9 17 Durable goods ....................................................................................... 1,280.2 4 Rest of the world (5–15) ....................................................................... 16.3 18 Nondurable goods ................................................................................. 2,668.2 5 Supplements to wages and salaries (3–14)............................................. 1,771.2 19 Services.................................................................................................... 7,917.5 6 Taxes on production and impor ts (4–15) ..................................................... 1,213.7 20 Gross private domestic investment .............................................................. 2,860.0 7 Less: Subsidies (4–8).................................................................................. 57.9 21 Fixed investment (6–2) ............................................................................. 2,782.9 8 Net operating sur plus .................................................................................. 4,399.2 22 Nonresidential ....................................................................................... 2,233.7 9 Private enterprises (2–19) ....................................................................... 4,417.5 23 Structures .......................................................................................... 507.0
10 Current sur plus of government enter prises (4–28) .................................. –18.3 24 Equipment ......................................................................................... 1,036.7 11 Consumption of fixed capital (6–14) ............................................................ 2,746.7 25 Intellectual property products ............................................................ 690.0
26 Residential ............................................................................................ 549.2 12 Gross domestic income ........................................................................... 17,560.1 27 Change in private inventories (6–4).......................................................... 77.1
28 Net expor ts of goods and services .............................................................. –530.0 13 Statistical discrepancy (6–20) ..................................................................... –212.0 29 Exports (5–1)............................................................................................ 2,341.9
30 Imports (5–13) .......................................................................................... 2,871.9 31 Government consumption expenditures and gross investment (4–1 plus
6–3) .......................................................................................................... 3,152.1 32 Federal ..................................................................................................... 1,219.9 33 National defense ................................................................................... 748.2 34 Nondefense ........................................................................................... 471.6 35 State and local.......................................................................................... 1,932.3
14 Gross domestic product........................................................................... 17,348.1 36 Gross domestic product ........................................................................... 17,348.1
Account 2. Private Enterprise Income Account Line Line
1 Income payments on assets........................................................................ 2,637.8 19 Net operating surplus, private enterprises (1–9).......................................... 4,417.5 2 Interest and miscellaneous payments (2–21 and 3–20 and 4–22 and 20 Income receipts on assets ........................................................................... 2,378.1
5–17) .................................................................................................... 2,365.8 21 Interest (2–2 and 3–4 and 4–7 and 5–5) .................................................. 1,687.8 3 Dividend payments to the rest of the world (5–18) .................................. 172.9 22 Dividend receipts from the rest of the world (5–6) .................................... 308.6 4 Reinvested earnings on foreign direct investment in the United States 23 Reinvested earnings on U.S. direct investment abroad (5–7) .................. 381.7
(5–19) ................................................................................................... 99.1 5 Business current transfer payments (net).................................................... 127.3 6 To persons (net) (3–24)............................................................................ 42.0 7 To government (net) (4–25) ..................................................................... 94.8 8 To the rest of the world (net) (5–23 minus 5–11) ..................................... –9.5 9 Proprietors’ income with IVA and CCAdj (3–17) .......................................... 1,346.7
10 Rental income of persons with CCAdj (3–18) ............................................. 610.8 11 Corporate profits with IVA and CCAdj ......................................................... 2,072.9 12 Taxes on cor porate income ...................................................................... 513.9 13 To government (4–16) .......................................................................... 476.2 14 To the rest of the world (5–23).............................................................. 37.7 15 Profits after tax with IVA and CCAdj ........................................................ 1,559.1 16 Net dividends (3–21 plus 4–23) ........................................................... 860.0 17 Undistributed corporate profits with IVA and CCAdj (6–12) ................. 699.0
18 Uses of private enterprise income .......................................................... 6,795.6 24 Sources of private enterprise income ..................................................... 6,795.6
Account 3. Personal Income and Outlay Account Line Line
1 Personal current taxes (4–14) ..................................................................... 1,780.2 10 Compensation of employees, received ........................................................ 9,248.9 2 Personal outlays .......................................................................................... 12,293.7 11 Wages and salaries .................................................................................. 7,477.8 3 Personal consumption expenditures (1–15)............................................. 11,865.9 12 Domestic (1–3)...................................................................................... 7,470.9 4 Personal interest payments (2–21 and 3–20 and 4–22 and 5–17) .......... 254.2 13 Rest of the world (5–3).......................................................................... 6.9 5 Personal current transfer payments ......................................................... 173.6 14 Supplements to wages and salaries (1–5) ............................................... 1,771.2 6 To gover nment (4–26) .......................................................................... 95.3 15 Employer contributions for employee pension and insurance funds ..... 1,224.0 7 To the rest of the world (net) (5–21 minus 5–9) .................................... 78.3 16 Employer contributions for government social insurance ...................... 547.2 8 Personal saving (6–11)................................................................................ 620.2 17 Proprietors’ income with IVA and CCAdj (2–9) ............................................ 1,346.7
18 Rental income of persons with CCAdj (2–10) .............................................. 610.8 19 Personal income receipts on assets ............................................................ 2,117.5 20 Personal interest income (2–2 plus 3–4 plus 4–7 plus 5–5 less 2–21 less
4–22 less 5–17) .................................................................................... 1,302.0 21 Personal dividend income (2–16 less 4–23) ............................................. 815.5 22 Personal current transfer receipts ................................................................ 2,529.2 23 Government social benefits (4–4)............................................................. 2,487.2 24 From business (net) (2–6) ........................................................................ 42.0 25 Less: Contributions for government social insurance, domestic (4–19) ....... 1,159.0
9 Personal taxes, outlays, and saving ....................................................... 14,694.2 26 Personal income ........................................................................................ 14,694.2

29 August 2015 SURVEY OF CURRENT BUSINESS
Table A. Summary National Income and Product Accounts, 2014 [Billions of dollars]
Account 4. Government Receipts and Expenditures Account Line Line
1 Consumption expenditures (1–31) ............................................................... 2,556.3 13 Current tax receipts ..................................................................................... 3,491.9 2 Current transfer payments ........................................................................... 2,559.0 14 Personal current taxes (3–1) .................................................................... 1,780.2 3 Government social benefits ...................................................................... 2,506.6 15 Taxes on production and imports (1–6).................................................... 1,213.7 4 To persons (3–23) ................................................................................. 2,487.2 16 Taxes on corporate income (2–13) .......................................................... 476.2 5 To the rest of the world (5–22) .............................................................. 19.5 17 Taxes from the rest of the world (5–10).................................................... 21.7 6 Other current transfer payments to the rest of the world (5–22)............... 52.3 18 Contributions for government social insurance............................................ 1,164.1 7 Interest payments (2–21 and 3–20 and 4–22 and 5–17) ............................. 621.4 19 From persons (3–25)................................................................................ 1,159.0 8 Subsidies (1–7) ............................................................................................ 57.9 20 From the rest of the world (5–10) ............................................................. 5.1 9 Net government saving (6–13)..................................................................... –799.2 21 Income receipts on assets ........................................................................... 150.5
10 Federal ..................................................................................................... –631.5 22 Interest and miscellaneous receipts (2–2 and 3–4 and 4–7 and 5–5) ..... 105.9 11 State and local ......................................................................................... –167.7 23 Dividends (2–16 less 3–21) ..................................................................... 44.6
24 Current transfer receipts .............................................................................. 207.3 25 From business (net) (2–7) ........................................................................ 94.8 26 From persons (3–6).................................................................................. 95.3 27 From the rest of the world (5–10) ............................................................. 17.2 28 Current sur plus of government enterprises (1–10) ..................................... –18.3
12 Government current expenditures and net saving ................................. 4,995.4 29 Government current receipts ................................................................... 4,995.4
Account 5. Foreign Transactions Current Account Line Line
1 Exports of goods and ser vices (1–29) ......................................................... 2,341.9 13 Imports of goods and services (1–30) ......................................................... 2,871.9 2 Income receipts from the rest of the world................................................... 854.3 14 Income payments to the rest of the world .................................................... 591.2 3 Wage and salar y receipts (3–13) ............................................................. 6.9 15 Wage and salary payments (1–4) ............................................................ 16.3 4 Income receipts on assets ....................................................................... 847.4 16 Income payments on assets .................................................................... 574.8 5 Interest (2–21 and 3–20 and 4–20) ...................................................... 157.1 17 Interest (2–2 and 3–4 and 4–7) ............................................................ 302.8 6 Dividends (2–22)................................................................................... 308.6 18 Dividends (2–3) .................................................................................... 172.9 7 Reinvested earnings on U.S. direct investment abroad (2–23) ............. 381.7 19 Reinvested earnings on foreign direct investment in the United States 8 Current taxes, contributions for gover nment social insurance, and transfer (2–4) .................................................................................................. 99.1
receipts from the rest of the world ............................................................ 145.1 20 Current taxes and transfer payments to the rest of the world ...................... 279.4 9 To persons (3–7) ................................................................................... 99.7 21 From persons (3–7).................................................................................. 177.9
10 To government (4–17 plus 4–20 plus 4–27).......................................... 44.0 22 From gover nment (4–5 plus 4–6) ............................................................. 71.8 11 To business (2–8).................................................................................. 1.5 23 From business (2–8 and 2–14) ................................................................ 29.6
24 Balance on current account, NIPAs (7–1) .................................................... –401.1
25 Current payments to the rest of the world and balance on current 12 Current receipts from the rest of the world ............................................. 3,341.3 account, NIPAs ....................................................................................... 3,341.3
Account 6. Domestic Capital Account Line Line
1 Gross domestic investment.......................................................................... 3,455.9 10 Net saving .................................................................................................... 520.1 2 Private fixed investment (1–21) ................................................................ 2,782.9 11 Personal saving (3–8) .............................................................................. 620.2 3 Government fixed investment (1–31) ....................................................... 595.8 12 Undistributed cor porate profits with IVA and CCAdj (2–17) ..................... 699.0 4 Change in private inventories (1–27) ....................................................... 77.1 13 Net government saving (4–9) ................................................................... –799.2 5 Capital account transactions (net) ............................................................... 0.5 14 Plus: Consumption of fixed capital (1–11) ................................................... 2,746.7 6 Transfer payments for catastrophic losses (7–3) ...................................... 0.0 15 Private ...................................................................................................... 2,229.9 7 Other capital account transactions (7–4).................................................. 0.4 16 Government ............................................................................................. 516.8 8 Net lending or net borrowing (–), NIPAs (7–5) ............................................. –401.6 17 General government ............................................................................. 452.6
18 Government enterprises ....................................................................... 64.2 19 Equals: Gross saving................................................................................... 3,266.8 20 Statistical discrepancy (1–13)...................................................................... –212.0
9 Gross domestic investment, capital account transactions (net), and net lending, NIPAs .................................................................................. 3,054.7 21 Gross saving and statistical discrepancy ............................................... 3,054.7
Account 7. Foreign Transactions Capital Account Line Line
1 Balance on current account, NIPAs (5–24) .............................................. –401.1
2 3 4 5
6
Capital account transactions (net) ............................................................... Transfer payments for catastrophic losses (6–6) ...................................... Other capital account transactions (6–7) .................................................
Net lending or net borrowing (–), NIPAs (6–8) .............................................
Capital account transactions (net) and net lending, NIPAs ...................
0.5 0.0 0.4
–401.6
–401.1
CCAdj Capital consumption adjustment salaries appears in account 1, line 5, and in account 3, line 14. In other cases, an entry may be IVA Inventory valuation adjustment equal to a combination of other entries (or of par ts of other entries). For example, for private enter-NIPAs National income and product accounts prise interest payments (account 2, line 2), the counterentry includes par ts of private enterprise NOTE. The seven summary accounts constitute a double-entry accounting system in which each interest receipts (account 2, line 21), of personal interest income (account 3, line 20), of govern-
of the entries in a summary account appears again in that account or in one of the other summary ment interest receipts (account 4, line 22), and of interest payments to the rest of the world accounts. The numbers in parentheses indicate these “counterentries.” In some cases, an entr y (account 5, line 17). may be equal to another entry in the summary accounts. For example, supplements to wages and
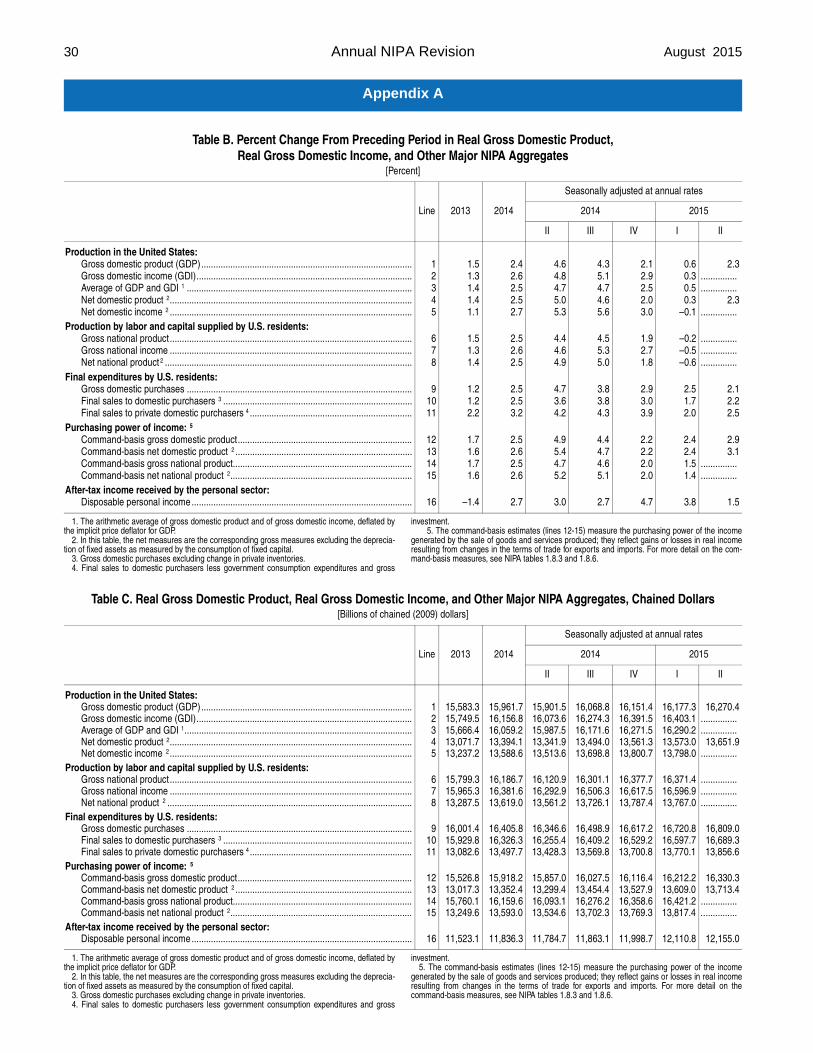
30 Annual NIPA Revision August 2015
Appendix A
Table B. Percent Change From Preceding Period in Real Gross Domestic Product, Real Gross Domestic Income, and Other Major NIPA Aggregates
[Percent]
Line 2013 2014
Seasonally adjusted at annual rates
2014 2015
II III IV I II
Production in the United States: Gross domestic product (GDP) ....................................................................................... 1 1.5 2.4 4.6 4.3 2.1 0.6 2.3 Gross domestic income (GDI)......................................................................................... 2 1.3 2.6 4.8 5.1 2.9 0.3 ............... Average of GDP and GDI 1 ............................................................................................. 3 1.4 2.5 4.7 4.7 2.5 0.5 ............... Net domestic product 2.................................................................................................... 4 1.4 2.5 5.0 4.6 2.0 0.3 2.3 Net domestic income 2 ....................................................................................................
Production by labor and capital supplied by U.S. residents: 5 1.1 2.7 5.3 5.6 3.0 –0.1 ...............
Gross national product .................................................................................................... 6 1.5 2.5 4.4 4.5 1.9 –0.2 ............... Gross national income .................................................................................................... 7 1.3 2.6 4.6 5.3 2.7 –0.5 ............... Net national product 2 ......................................................................................................
Final expenditures by U.S. residents: 8 1.4 2.5 4.9 5.0 1.8 –0.6 ...............
Gross domestic purchases ............................................................................................. 9 1.2 2.5 4.7 3.8 2.9 2.5 2.1 Final sales to domestic purchasers 3 .............................................................................. 10 1.2 2.5 3.6 3.8 3.0 1.7 2.2 Final sales to private domestic purchasers 4 ...................................................................
Purchasing power of income: 5
11 2.2 3.2 4.2 4.3 3.9 2.0 2.5
Command-basis gross domestic product ........................................................................ 12 1.7 2.5 4.9 4.4 2.2 2.4 2.9 Command-basis net domestic product 2 ......................................................................... 13 1.6 2.6 5.4 4.7 2.2 2.4 3.1 Command-basis gross national product.......................................................................... 14 1.7 2.5 4.7 4.6 2.0 1.5 ............... Command-basis net national product 2...........................................................................
After-tax income received by the personal sector: 15 1.6 2.6 5.2 5.1 2.0 1.4 ...............
Disposable personal income ........................................................................................... 16 –1.4 2.7 3.0 2.7 4.7 3.8 1.5
1. The arithmetic average of gross domestic product and of gross domestic income, deflated by investment. the implicit price deflator for GDP. 5. The command-basis estimates (lines 12-15) measure the purchasing power of the income
2. In this table, the net measures are the corresponding gross measures excluding the deprecia- generated by the sale of goods and ser vices produced; they reflect gains or losses in real income tion of fixed assets as measured by the consumption of fixed capital. resulting from changes in the terms of trade for expor ts and impor ts. For more detail on the com
3. Gross domestic purchases excluding change in private inventories. mand-basis measures, see NIPA tables 1.8.3 and 1.8.6. 4. Final sales to domestic purchasers less government consumption expenditures and gross
Table C. Real Gross Domestic Product, Real Gross Domestic Income, and Other Major NIPA Aggregates, Chained Dollars [Billions of chained (2009) dollars]
Line 2013 2014
Seasonally adjusted at annual rates
2014 2015
II III IV I II
Production in the United States: Gross domestic product (GDP) ....................................................................................... 1 15,583.3 15,961.7 15,901.5 16,068.8 16,151.4 16,177.3 16,270.4 Gross domestic income (GDI)......................................................................................... 2 15,749.5 16,156.8 16,073.6 16,274.3 16,391.5 16,403.1 ............... Average of GDP and GDI 1.............................................................................................. 3 15,666.4 16,059.2 15,987.5 16,171.6 16,271.5 16,290.2 ............... Net domestic product 2.................................................................................................... 4 13,071.7 13,394.1 13,341.9 13,494.0 13,561.3 13,573.0 13,651.9 Net domestic income 2 ....................................................................................................
Production by labor and capital supplied by U.S. residents: 5 13,237.2 13,588.6 13,513.6 13,698.8 13,800.7 13,798.0 ...............
Gross national product .................................................................................................... 6 15,799.3 16,186.7 16,120.9 16,301.1 16,377.7 16,371.4 ............... Gross national income .................................................................................................... 7 15,965.3 16,381.6 16,292.9 16,506.3 16,617.5 16,596.9 ............... Net national product 2 .....................................................................................................
Final expenditures by U.S. residents: 8 13,287.5 13,619.0 13,561.2 13,726.1 13,787.4 13,767.0 ...............
Gross domestic purchases ............................................................................................. 9 16,001.4 16,405.8 16,346.6 16,498.9 16,617.2 16,720.8 16,809.0 Final sales to domestic purchasers 3 .............................................................................. 10 15,929.8 16,326.3 16,255.4 16,409.2 16,529.2 16,597.7 16,689.3 Final sales to private domestic purchasers 4 ...................................................................
Purchasing power of income: 5
11 13,082.6 13,497.7 13,428.3 13,569.8 13,700.8 13,770.1 13,856.6
Command-basis gross domestic product ........................................................................ 12 15,526.8 15,918.2 15,857.0 16,027.5 16,116.4 16,212.2 16,330.3 Command-basis net domestic product 2 ......................................................................... 13 13,017.3 13,352.4 13,299.4 13,454.4 13,527.9 13,609.0 13,713.4 Command-basis gross national product.......................................................................... 14 15,760.1 16,159.6 16,093.1 16,276.2 16,358.6 16,421.2 ............... Command-basis net national product 2...........................................................................
After-tax income received by the personal sector: 15 13,249.6 13,593.0 13,534.6 13,702.3 13,769.3 13,817.4 ...............
Disposable personal income ........................................................................................... 16 11,523.1 11,836.3 11,784.7 11,863.1 11,998.7 12,110.8 12,155.0
1. The arithmetic average of gross domestic product and of gross domestic income, deflated by investment. the implicit price deflator for GDP. 5. The command-basis estimates (lines 12-15) measure the purchasing power of the income
2. In this table, the net measures are the corresponding gross measures excluding the deprecia- generated by the sale of goods and ser vices produced; they reflect gains or losses in real income tion of fixed assets as measured by the consumption of fixed capital. resulting from changes in the terms of trade for expor ts and impor ts. For more detail on the
3. Gross domestic purchases excluding change in private inventories. command-basis measures, see NIPA tables 1.8.3 and 1.8.6. 4. Final sales to domestic purchasers less government consumption expenditures and gross

31 August 2015 SURVEY OF CURRENT BUSINESS
Appendix A
Table D. Gross Domestic Product, Gross Domestic Income, and Other Major NIPA Aggregates [Billions of dollars]
Line 2013 2014
Seasonally adjusted at annual rates
2014 2015
II III IV I II
Production in the United States: Gross domestic product (GDP)....................................................................................... 1 16,663.2 17,348.1 17,270.0 17,522.1 17,615.9 17,649.3 17,840.5 Gross domestic income (GDI) ........................................................................................ 2 16,840.8 17,560.1 17,457.0 17,746.1 17,877.8 17,895.6 ............... Average of GDP and GDI 1.............................................................................................. 3 16,752.0 17,454.1 17,363.5 17,634.1 17,746.8 17,772.4 ............... Net domestic product 2 ................................................................................................... 4 14,030.3 14,601.4 14,537.2 14,760.6 14,831.7 14,856.6 15,037.6 Net domestic income 2.................................................................................................... 5 14,208.0 14,813.4 14,724.2 14,984.6 15,093.5 15,102.9 ...............
Production by labor and capital supplied by U.S. residents: Gross national product.................................................................................................... 6 16,913.5 17,611.2 17,527.0 17,794.0 17,880.6 17,876.8 ............... Gross national income .................................................................................................... 7 17,091.2 17,823.2 17,714.0 18,018.0 18,142.4 18,123.1 ............... Net national product 2 ..................................................................................................... 8 14,280.7 14,864.5 14,794.3 15,032.5 15,096.3 15,084.1 ............... National income 3............................................................................................................ 9 14,458.3 15,076.5 14,981.3 15,256.5 15,358.2 15,330.4 ...............
Final expenditures by U.S. residents: Gross domestic purchases ............................................................................................. 10 17,171.6 17,878.1 17,800.9 18,036.6 18,161.1 18,200.9 18,362.0 Final sales to domestic purchasers 4 .............................................................................. 11 17,099.8 17,800.9 17,711.9 17,948.3 18,072.6 18,073.6 18,238.1 Final sales to private domestic purchasers 5 .................................................................. 12 13,985.5 14,648.8 14,565.7 14,770.9 14,910.1 14,924.1 15,073.9
After-tax income received by the personal sector: Disposable personal income........................................................................................... 13 12,395.6 12,913.9 12,858.7 12,982.7 13,116.8 13,175.5 13,294.2
1. The arithmetic average of gross domestic product and of gross domestic income. consumption of fixed capital. 2. In this table, the net measures are the corresponding gross measures excluding the deprecia- 4. Equals gross domestic purchases less change in private inventories.
tion of fixed assets as measured by the consumption of fixed capital. 5. Final sales to domestic purchasers less government consumption expenditures and gross 3. Equals gross national income less the depreciation of fixed assets as measured by the investment.