Embed Size (px)
Citation preview

NOT TO BE CITED WITHOUT PRIORREFERENCE TO THE AUTHOR(S)
Northwest Atlantic Fisheries Organization
Serial No N808 NAFO SCR Doc. 84/VI/27
SCIENTIFIC COUNCIL MEETING - JUNE 1984
The 1983 Fishery for Illex illecebrosus in SA4 andBiological Characteristics of the Stock
by
T. W. Rowell and F. Budden
Invertebrates Division, Department of Fisheries and OceansP. O. Box 550, Halifax, Nova Scotia B3J 2S7
INTRODUCTION
The SA4 fishery for Illex illecebrosus has been summarized for previous years by Waldron (1979a,
1979b), Amaratunga and Roberge (1981), Amaratunga et al. (1982) and Rowell and Budden (1983). This paper.
describes the 1983 fishery as well as the biological characteristics of Illex as derived from both the
international observer program and research survey data.
MATERIALS AND METHODS
The. FLASH information system provided statistical information on the international offshore fishery,
including for each participating country, area fished, squid by-catch, directed squid catch, and directed
effort days. Information on the Canadian offshore fishery and the inshore fishery were obtained from
quota management reports and sales slip data summaries respectively.
Biological data from the international offshore fishery were obtained from random samples by inter-
national observers. Research cruises also provided biological and hydrographic data for the offshore
areas. Morphometric measurements were taken at sea by international observers on samples of 100 squid as
described by Amaratunga and Durward (1979). Measurements on research survey samples and on samples from
the IOP processed in the lab were taken on 50 squid. These data were used to describe size and weight
composition, growth, and the progression of maturity stages throughout the on-shelf residency sampling
period.
International Offshore Fishery
Four countries (Cuba, Italy, Japan, & USSR) reported catches of Illex in 1983 although only Italy,
with 4 days, and Japan, with 57 days, participated in the directed international offshore fishery (Table 1).
The distribution of fishing effort in the years 1980-1983, based on the locations from which inter-
national observer samples were taken, are presented in Fig. 1. In 1983, the fishery operated largely
between 62° and 64°w along the small mesh gear line with most of the effort between 62° and 63°w; the same
area in which fishing effort was concentrated in 1982.
A total of 408.6 tons were landed in the 1983 international offshore fishery; all from SA4 (Table 1,
Fig. 2). This amounts to 81% of the previous years catch and marks the fourth year of successive decline
in squid landings since the 1979 peak. Although the total catch was less than that of 1982, 'directed squid
catches were up from 1982 and non-directed catches were much reduced. The directed fishery accounted for
332.6 tons (81%) of the total in 1983 compared with 210.9 tons (42%) of the total in 1982. The remaining
75.7 tons of the 1983 fishery were taken as by-catch in the silver hake fishery. Squid landings as by-
catch in 1983 were only 26% the level of 1982.
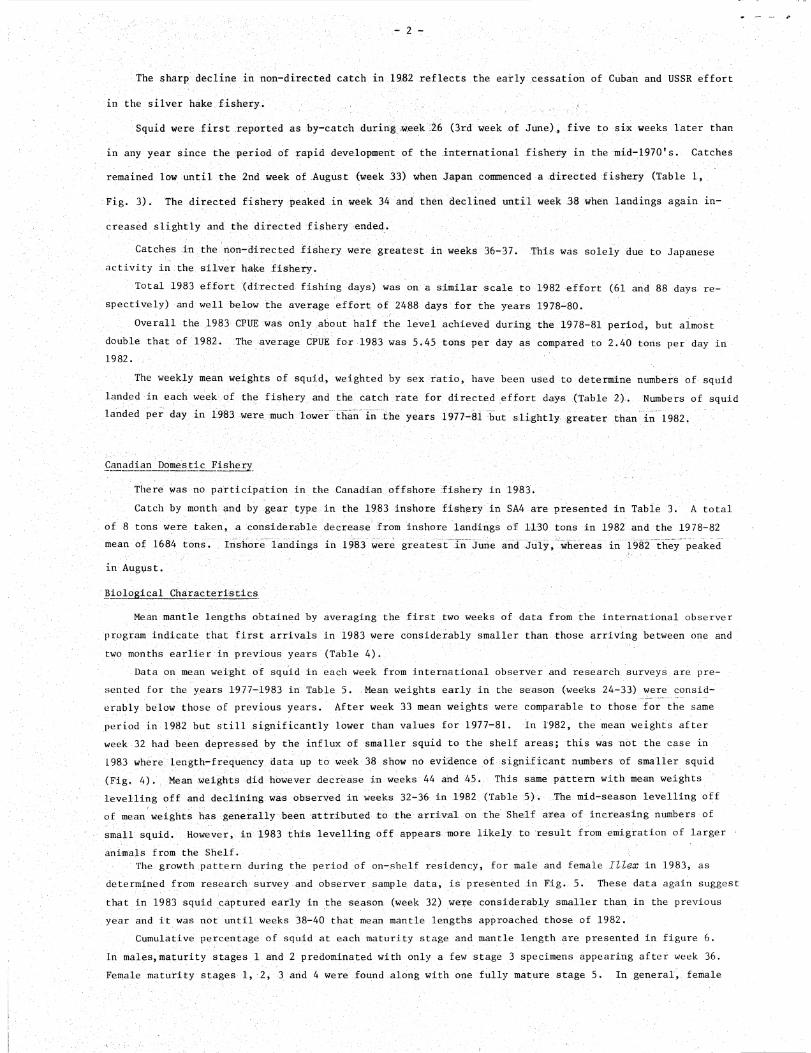
The sharp decline in non-directed catch in 1982 reflects the early cessation of Cuban and USSR effort
June), five to sixrePorted as by-catch during ,week .26 (3rd week ofSquid were first weeks later than
in the silver
The average CPUE fo r 1983 was 5.45 tons per day as compared to 2.40 tons per day indouble1982.
The weekly mean weights of squid, weighted by sex ratio, have been used to determine numbers of squidlanded in each week of the fishery and the catch ra te for di rected effort
day in 1983 were much lower than in thelanded per Years 1977-81 but slightlY greater
daYs (Table 2). Numbers of squidin 1982.than
mals from the Shelf.The growth pattern during the period of on-shelf residency, male and female Mex in 1983, as
in any year since the period of rapid development of the international fishery in the mid-1970's. Catches
remained law until the 2nd week of August (week 33) when Japan commenced a directed fishery (Table 1,
Fig. 3). The directed fishery peaked in week 34 and then declined until week 38 when landings again in
creased slightly and the directed fisher Y ended.
Catches in the non-directed fishery were greatest in weeks 36-37. This was solely due to Japaneseactivity in the silver hake fisherY.
Total 1983 effort (directed fishing days) was on a similar scale to 1982 effort (61 and 88 days re-spectively) and well below the average effort of 2488 days for the years 1978-80.
Overall the 1983 CPUE was only about half the level achieved during the 1978-81 period, but almost
Canadian Domestic Fishery
There was no par t i cipation in the Canadian offshore fishery in 1983.Catch by month and by gear type in the 1983 inshore fisherY in SA4 are Presented in Table 3. A total
of 8 tons were taken, a considerable decrease from inshore landings of 1130 tons in 1982 and the 1978-82mean of 1684 tons. Inshore landings in 1983 were greatest in June and July, whereas in 1982 they peaked
in August.
Bi°122LQLCharacteristics
lengths obtained by averaging the first two weeks of data from the international observerprogram indicate that first arrivals in 1983 were considerably smaller than those arriving between one andtwo months earlier in p revious years (Table
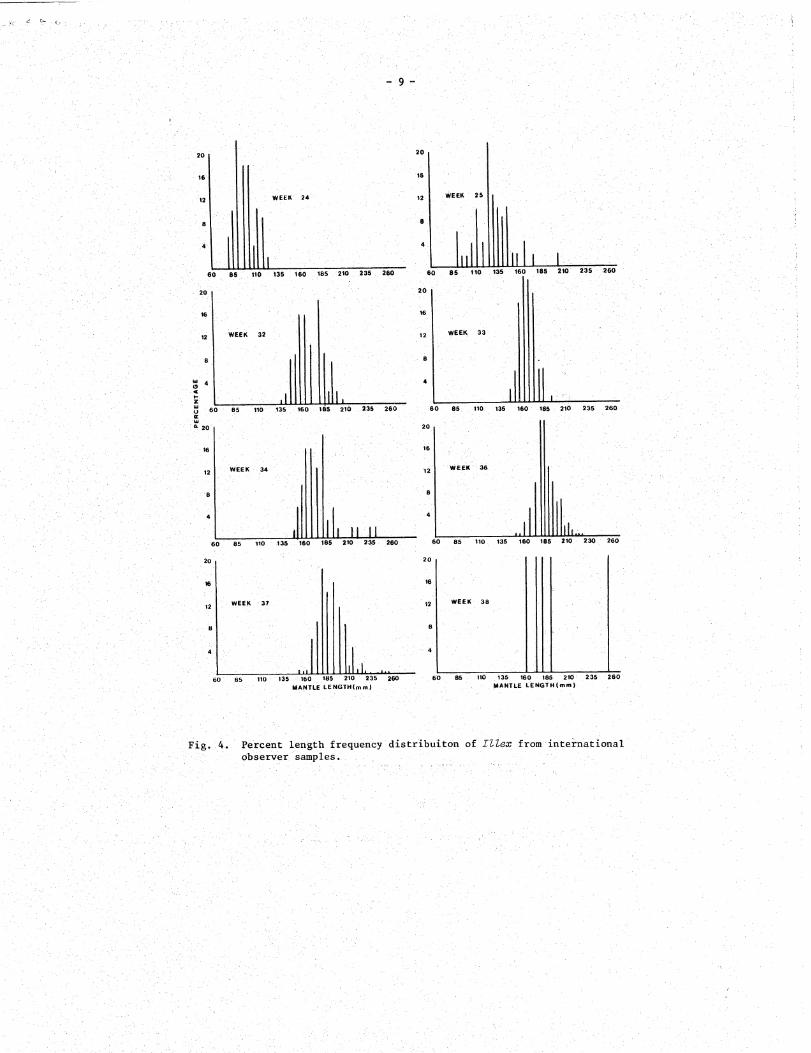
Data on mean weight of squid in each week from international observer and research surveys are pre-seated for the years 1977-1983 in Table 5. Mean weights early in the season (weeks 24-33) were consid -erably below those of previous years. After week 33 mean weights were comparable to those for the sameperiod in 1982 but still significantly lower than values for 1977-81. In 1982, the mean weights after
Mean mantle
week 32 had been depressed by the influx of smaller squid to the shelf areas; this was not the case in1983 where length-frequency data .up to week 38 show no evidence significant numbers smaller squid(Fig. 4). Mean weights did however decrease in weeks 44 and 45. This same pattern with mean weightslevelling off and declining was observed in weeks 32-36 in 1982 (Table 5) . The mid-season levelling offof mean weights has generally been attributed to the arrival on the Shelf area of increasing numbers ofsmall sq uid. Homever, 1983 this levelling off appears more likely to result from emigration of larger
data, is presented in Fig. 5. These data again suggestthat in 1983 squid captured early in the season (week 32) were consideralY smaller than in the previousyear and it was not until weeks 38-40 that mean mantle lengths approached those of 1982.
Cumulative percentage of squid at each maturity stage and mantle length are presented in figure 6.In males,maturity stages 1 and 2 predominated with only a few stage 3 specimens appearing after week 36.Female maturity stages 1, 2, 3 and 4 were found along with one fully mature stage 5. In general, female
determined from research survey and observer sample

maturity stages 1 and 2 predominated until week 36, after which small nuMbers of stage 3 animals were
regularly observed.
The maturation process in 1983 appears to have been very similar to that of 1982 and considerably
ROWELL, T. W. and F. BUDDEN. 1983. The 1982 Fishery for Illex illecebrosus in SA4 and Biologicalcharacteristics of the Stock. NAFO SCR Doc. 83/VI/40, Ser. No N694.
WALDRON, D. E. 1979a. Catch and Effort Statistics from the 1978 International Squid (Illex illecebrosus)Fishery in Subarea 4. ICNAF Res. Doc. 79 / 11 / 18 , Ser. No. 5344.
WALDRON, D. E. 1979b. Assessment of the 1978 4VWX Squid79/11/19, Ser. No. 5345.
(Illex illecebrosus) Fishery. ICNAF Res Doc.
slower than that .observed in 1981 (Amaratunga et al., 1982). , The percentage of males having reached
stage 2 was particularly low and may be a reflection of the small proportion of males (31% at week 38)
having achieved a mantle length >200 mm. Fifty percent maturity has not generally been observed for males
under.roughly 200 mm mantle-length.
REFERENCES
AMARATUNGA, T. 1981. Preliminary update of Illex inecebrosus m rphometrics in Subarea 4 for 1980.NAFO SCR Doc. 81/VI/84, Ser. No N377.
AMARATUNGA, T., and R.D. DURWARD. 1978. Standardization of data collection for the short-finned squidIllex illecebrosus. ICNAF Sel. Papers, No 5, 37-41 p.
AMARATUNGA, T. and M. ROBERGE. 1981. Summary of 1980 Illex illecebrosus fishery in SA4 in relation to1977-1979 data NAFO SCR Doc. 81/VI/35, Ser. No N317.
AMARATUNGA, T., J. YOUNG, and F. BUDDEN. 1982. Update for 1981 of the squid Illex illecebrosus fisheryin Subarea 4. NAFO SCR Doc. 82/VI/29, Ser. No N517.

C:) I!) IX)Lc)
•t-4 CO
o in O r,.I kt) (31I • • •
(:) if)
RI. LC) 01 CNJ C')CNJ CNJ
1.
0
CD (:) CiD I 0 (:)(:) (I) el- I CAN C)1
o • o a • • •lC) r-4 C\I •• (.1 r-4CO r-4 r-4
CV 11
0 . 000 I (:) (:) (:)r,4 , (NJ I el (NJ r,-4.
• • o • o, ••••0 " t0 (X) in I (t) t,, (:)
I c\J r-4 0-1 •
1.•••
••
•••••;•••••••••••
O000 I 000• I C:) c,) r,. 0 CX) CNJ C))• • • • •
10 r-4 r-1 0 CI r-4 r,.1. oo go'1
1000 0 00001 I c\J r-4 I Ch C\J r-4
•
11
1.
0 IC-, 10 1
111•B.
0 0cole CNJ
...I • • •kCI CO It) I CD P., CD(NJ r-4 r-4
r)
t.
M0()N
'0
'1 • ••••■■CV (') 'CI' in 1 kC, c,,• co al (D• ro co MM I re.) co. co co etr
Lc) C') (3► in I •(\j 0-1 .kC) .(:).0' r'1 CNJ 0 .(:) 010) • en cr. 0) I 0 0 _d0 Q. •
M CL)r. W • W (/) (1). .< ,c1C• < Ir LI) (/)
tDC)
•■■••••■
0
OL)
0
0/1'0
.IC
r
L>1
(1.1
C0r•.•
CL
C
C
e••••
COr-0
.c:
C,9.—
4Joto0U4
▪
)L
, a)
0U
0
a)
U4-)
(1)
w::Y
C_)
-VCots
,C)
4.)L04-
"T4)a)
U4.)
co
L1 V')
0 Lt...
.---. 04,,
-CU 4-)4-) S..n3 0
(..)
r--
.C3

Table 2 Estimate of number of Illex removed in the International Directed Fishery in 1983.
Di rectedcatch (t)
MeanWGT (g)
5No Squid x 10Landed per week
No. Squid x 104landed per day
IN Squifl(Squid x 110j1dy)
Week Effort
42523
423
Aug 12 (33)Aug 19 (34)Aug 26 (35)Sept 2 (36)Sept 9 (37)Sept 16 (38)
6.00211.3082.4013.801.20
17.90
86.0121.3121.3*120.9131.6189.4
0.70 1.74 2.86
17.41 6.97 4.24
6.79 2.95 3.38
1.14
2.85 3.35
0.09
0.45
1.52
0.95 3.15 3.45
Where mean weights were not available,previous week s mean was used` to calculatenumber of squid landed per week.
Table
•
Catch of Il 1 ex i n the 1983 Canadian Fishery in SA4
Gear
Month Catch ( t)
Inshore
a ) By month May < 1June 5July 2August < 1September < 1October <November < 1
b) By Gear Type TrapSet Gil 1 NetWeirsHandl i nesUnspeci fled
113
< 1
No Canadian offshore landings in 1983

Tab e, ean. Squid Length arrival on Shelf
19.A8 0
MFanl e,
145 . 29 (17'-19 )
15'5. 56, ( 2'0=2214 .0„. 55 ( 20-2 2)145.8:1 - (22-24')108-.22'' (2,4-25 )
Fern a::1 e,
14 ,8,. ( 17 -191(19=-211
164. 4,0 ( 20-221149.68 (20-22)151'4. 53 ( 22- 24)113'.78 (24=25)*'
Numbers -- in brackets., refer- to consecutive:_ week' within, ' yea Means are- obt a i ned-b averagingg first threeweeks of data from-, the observer' program. (Data from- first two weeks , only was avail able for 1983 )
Table Mean we (g) of Ill ex from ihternational observersamples and researcurveys. Survey means are,presented ih pa rentfres i s.
Year'
We ek 1'977 19'78 1979' 1980 1981- 1982. 1983
16 37171,8 56,1920 702122 1012324 1232526 16:527 137 . 928 189' ,134.829 138'. 430 197 189 . 631 15'9. 932 2,13 171 .133 17 9 . 834 2 ,40 18'9.:83536 2:51 9 .437 21938 26,5 229.2'39 239 .1,40 27 8' 2 48'. a,41 2'58 . 7'4'2 289 2641.743 309. 044 30 5 112,03--45 114 . 546 - 286 277 . 547 292 .
67 . 5( 31 .1 )
15'0'.:. 0.:„.. (9,7,'.91E', .7:6,2'..90:'.1::;:: ' 54%13 ..1 ' (51;. 0:'..).. 5'7 . 9':,9-7 . 8 :. '" - . ( ...91'...91 58 T̀ : . 6:
10.3.,'..9', (96'. 3..)::: (63,-. 3 ') :: 8'0',.. 7-1.'..5. fr'11,2 . i ( 86,....51 1201:,..1:, T4t',..5.' . 38.4:::
8 1 5 ..,9' :- ( TO, 9:) rt...a. 6: ,. 6'8'00;
137',..1:.' 1.36... .5110 i'..3 )1: 1'.50...5:
,1 : 347..0 '14:1.55' . 17 :Zs:. 8' . (.42...1 .).-
1 -3;8'''.. 1....1.':.92'. 5: 192..8'.‘ 94::..,.4,;
149.,..4.,' L:04'. . 3.. 1745.;..5. 112..:;..5... . -139 .31
154. 8:'.:' 1,30 . 3 .. 7,-- •
1,16-:9::-..7' 1111..:7„' 2:0..:3-. 5'E . 13.2 ,̀.. 8:- 8:6-...1-
171 5.E.' 20.5. 7' Z0.6:. Z 816...0,
1:8:9.4 f 215 .31.., Zag... 8 i.''•.: 1.3.a...0, 12.1. ..3'. .
'..„19',9%.3. 1,..38-.'4- 2.31 . 4,-,-,'11.09.',•,,S.,
• 201',.2.Z :14,62. :5:- 2.48'•....8:' 1:17.,..5 1.20'..9,. (124...9 )
21.9.-.'..1'.''. 18.3. 6:, - 237 ''.',.2,.' 1-.27:, 27 1-31. ..6 ,. (.1.37....81-
228,9? 303 -1‘. ,:..234'..,8'., . - I:57 .',2 1:" .1S42:.4'..' (4.5.6 .; Z.)
238:U1,.,22.17 . ..r: . (1 -5.8.. 5) ..
27413....7' 2:3.3...'.5' f 179..41258'.. 6_ 2,49 . 226-8.„5 225. 730802 264.2311 . 5 292 . 1313.8 240.027 5. 5 243'. 4291 . 8- 285.1
(113.56)( 108 . 38 )

ern
Ni0000-)
000-)
(I)LIJ_Ja_
u-)
z
.0..r4
0a)H
cnFA
C)
tri
CO
04J
CO
CD
4J
bO
ri
0cn
0
CCCC0
•
03
0
-a
CD
CCCCC)
CC
rrsa)
CCCi0
bO
•
rl
CO
Z
— 7 —
000-)
(f)LU
a_
CT)
z
z z
z
•
•
•

63 65 67' 69 71 73 75 77 79, 81 83
YEAR
Fig . 2. Annual catches of IIlex illecebrosus by the international fisheryin SA 4.
Fig. 3. Directed-and-non-directed •squid catches and effort as reported toFLASH'fOr 1983 for e Subarea 4.
WEEK 24 WEEK 25
20
16
12
20
16
12
60 85
20
16
12 WEEK 33
160 185 210 235 26060
20
16
'WEEK 3212
110 135 160 185 290 235 260
4H.z
60 85 110
W.cr
20
16
12 WEEK 34
60 185 210 235 260
I 11
1I135
20
16
12
60 85 110 135 160 185 210 235 260
60 85 110 135 160 185 210 235 260 60 85 110 135 160 185 210 230 260
WEEK 36
60 85 110 135 160 185 210 235 260MANTLE LENGTH(mm)
60 85 110 135 160 185 210 235 260MANTLE LENGT ( rem )
20
16
12
8
20
12 WEEK • 37 WEEK 38
Percent length frequency distribuiton of Illex from internationalobserver samples.
Fig.

MALE,
215'
200,
FEMALE
Fig. 5 . Mean mantle lengths of Illex in 1983 from research and internationalobserver data.
1'2 16' 20 24 28. 32 36 40 44.
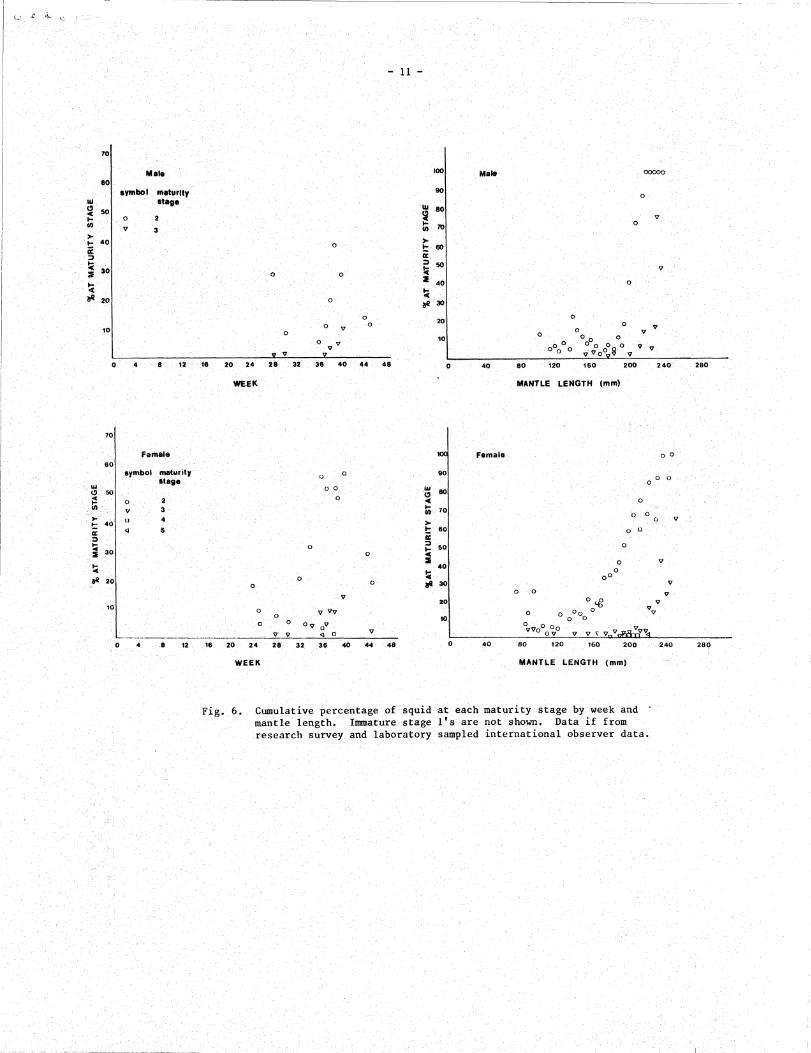
Cumulative percentage of squid at each maturity stage by week andmantle length. Immature stage l's are not shown. Data if fromresearch survey, and laboratory sampled international observer data.
Fig.

k. • .