Embed Size (px)
Citation preview


The 1st Warmadewa University International Conference on Architecture and Civil Engineering
SUSTAINABILITY, DESIGN AND CULTURE
20th October 2017, Faculty of Engineering, Warmadewa University, Bali
i
Scientific Committee :
1. Prof. Tasuku Tanaka, Ph.D. (Graduate School of Science and Engineering
Yamaguchi University, Japan).
2. Prof. Dr. Ir. Agus Taufik Mulyono, M.T., ATU., IPU. (Department of Civil
Engineering and Environment, Gajah Mada University, Indonesia).
3. Prof. Wimpy Santosa, Ph.D (Faculty of Engineering Parahyangan Catholic
University, Bandung, Indonesia).
4. Dr. Takahiro Ozawa (Center for Remote Sensing and Ocean Sciences
(CReSOS) Udayana University, Denpasar, Bali).
5. Dr. Ir. Ahmad Rifa’i, MT. (Department of Civil Engineering and
Environment, Gajah Mada University, Indonesia).
6. Dr. Ngakan Ketut Acwin Dwijendra, ST., MA. (Campus of Bali Design
School (STD Bali)).
7. Prof. Dr. Ir. I Wayan Runa, MT. (Faculty of Engineering Warmadewa
University, Denpasar, Bali).
8. Dr. Ir. I Gusti Agung Putu Eryani, MT. (Faculty of Engineering Warmadewa
University, Denpasar, Bali).
9. Dr. Ir. I Wayan Parwata, MT. (Faculty of Engineering Warmadewa
University, Denpasar, Bali).
Katalog dalam Terbitan : Perpustakaan Nasional Republik Indonesia
The 1st Warmadewa University International
Conference on Architecture and Civil Engineering
SUSTAINABILITY, DESIGN AND CULTURE
Denpasar, 2017, ix, 324 pages, 21.0 x 29.7 Cm
Hak Cipta Dilindungi Undang-undang
UU RI No. 19 Tahun 2002
Editor
:
1. I Kadek Merta Wijaya, S.T., M.Sc.
2. Putu Aryastana, S.T., M.Eng., M.Si.
3. Made Suryanatha Prabawa, S.T., M.Ars.
Cover Design : Ni Putu Ratih Pradnyaswari Anasta Putri, S.T., M.Sc.
First Published : October 2017
Copyright : Warmadewa University Press
Editor Address :
Jalan Terompong No. 24, Gedung D Lantai 2,
Tanjung Bungkak, Denpasar 80234, Bali
Telp. (0361) 223858; Fax. (0361) 225073
Web: www.warmadewa.ac.id
E-mail: [email protected]

The 1st Warmadewa University International Conference on Architecture and Civil Engineering
SUSTAINABILITY, DESIGN AND CULTURE
20th October 2017, Faculty of Engineering, Warmadewa University, Bali
ii
Committee
The 1st Warmadewa University International Conference on Architecture
and Civil Engineering
SUSTAINABILITY, DESIGN AND CULTURE
Board of Committee: Dr. Drs. A. A. Gede Wisnumurti, M.Si.
Prof. dr. Dewa Putu Widjana, DAP&E.Sp.Park.
Person in Charge: Prof. Dr. Ir. I Wayan Runa, M.T.
Chairman: Putu Aryastana, S.T., M.Eng., M.Si.
Members of Committee:
I Wayan Widanan, S.T., M.P.M.
Ni Komang Armaeni, S.T., M.T.
I Gede Surya Darmawan, S.T., M.T.
I Kadek Merta Wijaya, S.T., M.Sc.
Ir. I Nyoman Surayasa, M.Si.
A. A. Gede Raka Gunawarman, S.T., M.T.
Putu Ika Wahyuni, S.T., M.Si., M.T.
Ir. I Wayan Jawat, M.T.

The 1st Warmadewa University International Conference on Architecture and Civil Engineering
SUSTAINABILITY, DESIGN AND CULTURE
20th October 2017, Faculty of Engineering, Warmadewa University, Bali
vii
TABLE OF CONTENTS
Introduction
iii
Welcoming Speech by Rector of Warmadewa University
iv
Chairman Report
v – vi
Table of Contents
vii – ix
A. Keynote Speaker
1. Indonesian Sea Observed By Satellites 1 – 2
Prof. Tasuku Tanaka, Ph.D.
2. Hope To The Future:
Indicators For Sustainable Transportation Management In Indonesia
3 – 13
Prof. Dr. Ir. Agus Taufik Mulyono, M.T., ATU., IPU.
3. Sustainbility Viz –A-Viz Architecture & Culture: Case Of Diverse India 14 – 15
Anoop Kumar Sharma
B. Theme I : Sustainability
1 A Sustainable Agriculture Development in Kedungu Resort Project, Tabanan
Bali
16 – 21
Ngakan Ketut Acwin Dwijendra, I Wayan Yogik Adnyana Putra
2. Arrangement Model of Saba River Estuary Area Based on Tourism
Enviroment for Water Conservation in Buleleng Regency
22 – 29
I Gusti Agung Putu Eryani
3. Identification of Physical Changes of Pre- and Post-Reclamation Land in
Serangan Island
30 – 36
I Gede Surya Darmawan, I Wayan Wirya Sastrawan
4. Impact Resistance of High Strength Self Compacting Concrete With Steel
Fiber
37 – 44
Gabriella Agnes Luvena S., M. Fauzie Siswanto, Ashar Saputra
5. Mix Design of High Strength SCC with Polypropylene Fiber based on Flow
Mortar Mix
45 – 52
Kristyan Hari Subangkit, Imam Satyarno, Andreas Triwiyono
6. Modelling as an Approach to Understand Resilience of Urban Kampung 53 – 61
Imelda Irmawati Damanik, Bakti Setiawan, Sani Roychansyah, Sunyoto Usman
7. Performance Based Contract Risk Relationship Analysis in Bojonegoro-
Padangan Road Project
62 – 68
Eko Prihartanto, M.Djaya Bakri
8. Priority of ICT Implematation at The Largest Bus Terminal in Bandung,
Indonesia
69 – 79
A. Caroline Sutandi, Wimpy Santosa, Y. Frans Winanto
9. Sustainable Tourism and Fire Safety of Accommodation Facilities in Tourism
Villages
80 – 84
I Dewa Gede Agung Diasana Putra, Anak Agung Gde Agung Yana, Ngakan Ketut Acwin
Dwijendra
10. Thermal Performance of Wide Span Middle-Rise Building in Surabaya (Case
Study: Gedung G ITATS)
85 – 90
Dian P. E. Laksmiyanti, Poppy F. Nilasari

The 1st Warmadewa University International Conference on Architecture and Civil Engineering
SUSTAINABILITY, DESIGN AND CULTURE
20th October 2017, Faculty of Engineering, Warmadewa University, Bali
viii
C.
Theme II : Design
1. Behavior of Nailed-Slab System on Peat Soil Under Loading 91 – 97
Aazokhi Waruwu, Hary Christady Hardiyatmo, Ahmad Rifa’i
2. Changes of Geotechnical Properties of Waste Embankment for Stability
Analysis at Piyungan Disposal Site
98 – 105
I Wayan Ariyana Basoka, Ahmad Rifa’i, Fikri Faris
3. Coastline Change Analysis in Buleleng Regency by Using Satelite Data 106 – 113
Putu Aryastana, I Made Ardantha, Adrianto Eka Nugraha, Kadek Windy Candrayana
4. Comparative Analysis of Effectiveness of "Yellow Box Junction" in The City
of Jakarta and Denpasar
114 – 119
Cokorda Putra Wirasutama, Tjokorda Istri Praganingrum
5. Comparison of Single Bored Pile Bearing Capacity Based on CPT and SPT 120 – 126
I Gusti Ngurah Putu Dharmayasa
6. Development Taman Prestasi Surabaya as Tematic Park Reviewed from The
User Behavior and The Nature of Space
127 – 131
Sigit Hadi Laksno, Felicia Trua Nuciferani
7. Durability of Asphalt Concrete Mixture Using Lompoto‟o Tras as Fine
Aggregate
132 – 138
Frice L. Desei, Ayuddin
8. Geotechnical Characteristics of Pumice for Reduce Liquefaction Potential 139 – 146
Muhajirah, Ahmad Rifa’i, Agus Darmawan Adi
9. Geotechnical Properties and Characteristics of Metamorphic Rock Mass on
Poboya Gold Mine
147 – 154
Sriyati Ramadhani, Ahmad Rifa’i, Kabul Basah Suryolelono, Wahyu Wilopo
10. Influence of Volcanic Ash and Lime on Resilient Modulus for Subgrade 155 – 159
Devi Oktaviana Latif, Ahmad Rifa’i, Latif Budi Suparma
11. Landslide Hazards Due to Rainfall Intensity in The Caldera of Mount Batur,
Bali
160 – 167
I Nengah Sinarta, Ahmad Rifa’I, Teuku Faisal Fathani, Wahyu Wilopo
12. Optimization of Thermal Comfort in I Gusti Ngurah Made Agung City Park
Design in Denpasar
168 – 175
I Wayan Wirya Sastrawan, I Gede Surya Darmawan
13. Spatial Distribution of Mercury Concentration in Traditional Gold Mining of
Buladu
176 – 182
Marike Mahmud, Beby Banteng, Frice Desei, Fitryane Lihawa, Yanti Saleh
14. Steel Brace Damper with Progressive Failure Mechanism 183 – 187
I. P. Ellsa Sarassantika, H.L. Hsu
15. Strength and Stiffness Behavior of Concrete Modular House 188 – 192
Yosafat Aji Pranata, Anang Kristianto, Kumbara Kamajaya Cahya Hermawan, Azka
Rysdianto
16. The Behavior of Steel Structure Exposed to Fire : A Review 193 – 197
Ni Komang Ayu Agustini, Andreas Triwiyono, Djoko Sulistyo, Suyitno
17. The Effect of Water Content Change in Pluto-Volcanic Subsurface Slope
Stability Based on Limit Equilibrium and Finite Element Method
198 – 205
Indriati Martha Patuti, Ahmad Rifa’I, Kabul Basah Suryolelono, Suprapto Siswosukarto
18. The Influence of Capital Composition to Real Estate Investment Risk in
Gianyar by Using @Risk Program
206 – 214
Ni Komang Armaeni, Ni Wayan Meidayanti Mustika, Anak Agung Sagung Dewi Rahadiani

The 1st Warmadewa University International Conference on Architecture and Civil Engineering
SUSTAINABILITY, DESIGN AND CULTURE
20th October 2017, Faculty of Engineering, Warmadewa University, Bali
ix
19. The Key Success of Commercial Building Construction : A Case Study on
Charcara Restaurant Bali
215 – 220
I Wayan Widanan
20. Risk Variables in Collaboration of Private Government (PPP) for Toll Road
Contacts
221 – 228
Putu Ika Wahyuni, Wateno Oetomo, Sarwono Hardjomuljadi, Koespiadi
21. Triplet Confinement Induced High Efficiency in Single Layer Doping of
Phosphorescent Organic Light-Emitting Diode
229 – 235
Agus Putu Abiyasa, I Wayan Sukadana, I Wayan Sutama, I Wayan Sugrayasa, Yoga
Divayana
D. Theme III : Culture
1. Architecture Knowledge in Manuscript of Lontar Asta Kosala Kosali (In the
Perspective of Architecture is a Contruction Process)
236 – 241
I Nyoman Nuri Arthana, Josef Prijotomo, Murni Rachmawati, I Made Suwirya
2. Cultural Landscape and Conservation of Balinese Cemetery, Meaning and
Threatening
242 – 246
Ni Made Yudantini
3. Cultural Practice of Traditional Security Officers (Pecalang), Tourism and
The Meaning of the Local Wisdom Value in Bali
247 – 251
I Wayan Wesna Astara
4. Form and Meaning of Aesthetic Elements on Architecture of Traditional
House (Case Study of Traditional House in Bayung Gede, Bangli)
252 – 259
Siluh Putu Natha Primadewi, I Gede Ngurah Sunatha, Ni Putu Suda Nurjani
5. Local Wisdom in Environmental Management in Tenganan Pegringsingan,
Karangasem, Bali
260 – 267
I Gusti Bagus Suryawan, Ni Made Jaya Senastri
6. Proportion Identification of Candi Tebing Gunung Kawi in Tampaksiring,
Gianyar - Bali
268 – 274
A.A. Gede Raka Gunawarman, I Kadek Merta Wijaya
7. Soundscape Mapping in Heritage Area (Case study : „Legi‟ Market,
Kotagede, Yogyakarta, Indonesia)
275– 282
Patricia P. Noviandri
8. The Influence of Cultural Life on Spatial System in Tenganan Pagringsingan,
Karangasem - Bali.
283 – 293
I Wayan Runa, I Nyoman Warnata
9. The Execution of Bali Architecture in Public Buildings as A Cultural
Tourism Potential of The City of Denpasar in The Era of Globalization
294 – 303
Made Novia Indriani, Cornelia Hildegardis
10. The Roles of Market Orientation and Knowledge Competency on The
Relationship Between Innovation and Business Performance
304 – 308
Ni Made Wahyuni, I Made Wardana, Gusti Ayu Ketut Giantari
11. Traditional Concept of Space and Building in Puri Agung Karangasem, Bali 309 – 316
Agus Kurniawan, I Wayan Diksa
12. Typology of Angkul-Angkul Forms at Balinese Ethnic Houses in Denpasar 317 – 324
I Kadek Merta Wijaya

The 1st Warmadewa University International Conference on Architecture and Civil Engineering
SUSTAINABILITY, DESIGN AND CULTURE
20th October 2017, Faculty of Engineering, Warmadewa University, Bali
Design | 106
COASTLINE CHANGES ANALYSIS IN BULELENG
REGENCY BY USING SATELLITE DATA
Putu Aryastana1, I Made Ardantha
2, Adrianto Eka Nugraha
3, Kadek Windy Candrayana
4
1, 2Department of Civil Engineering, Warmadewa University, Jl. Terompong No. 24, Denpasar, Indonesia 3Alumnus of Departmentof Water Resources Engineering, Brawijaya University, Jl. MT. Haryono No.167.
Malang, Indonesia 4Master Student Department of Civil Engineering, Udayana University, Jl. PB Sudirman, Denpasar, Indonesia
ABSTRACT
The study of monitoring and analysis of coastline changes has been widely used satellite imagery. Satellite data that is often used in monitoring studies and analysis of coastline changes are Landsat, Quickbird, Allos dan IKONOS. The aim of study is to determine an average of coastline change in Buleleng regency by using two kind satellite are SPOT 5 in 2009 has a spatial resolution of 10 m (multispectral) and SPOT 6/7 in 2015 has a spatial resolution 1.5 m. This research contributes to local government and central government as a database in decision making for coastal area management. The result of analysis shows the average of coastline change in Buleleng Regency is 8.64 m.
Keywords: buleleng; coastline; satellite.
A. INTRODUCTION
The coastline is defined as the boundary
between land and surface water. In the dynamic
process there are several factors that influence the
shoreline changes: hydrology, geology, climate and
vegetation. Therefore it is necessary to update the
map of shoreline change that is done continuously.
This renewal is needed to find out the information
on coastal resource management, coastal protection
and also for sustainable development planning in
the coastal area(Guariglia, et al., 2006).
Coastline mapping can be defined by direct
field measurement, aerial photography analysis and
remote sensing analysis by using satellite imagery
(Guariglia, et al., 2006). Technological
developments have led to the use of satellite
imagery in coastline change analysis.
Satellite data were utilized for coastline
change analysis in many researches. For example
Kuleli, Guneroglu, Karsli, & Dihkan(2011) used
multi-temporal Landsat images and Digital
Shoreline Analysis System (DSAS) to analys
shorelinechangealong the coastal Ramsar wetlands
of Turkey. Landsat MMS, Landsat TM and SPOT-4
were utilised to estimate the spatio-temporal
changes that occurred in the coastal zone between
Damietta Nile branch and Port-Said between 1973
and 2007 (El-Asmar & Hereher, 2011). Landsat
MSS image of 1979, Landsat TM and
ETM+images of 1990 and 2000, SPOT image of
2003 and the topographic map 1:100,000 of 1966
and a nautical map scale 1:150,000 of 2003 were
utilized to analysis coastline change detection of the
Pearl River Estuary, China(Li & Damen, 2010).
SPOT image was used to evaluate shoreline in
Progreso, Yucatán, México(Rubio, Huntley, &
Russell, 2015). Landsat imagery between 2000 and
2014 were utilized to evaluate of annual mean
shoreline position at El Saler Valencia, Spain
(Caballer, García, Pascual, Beser, & Vázquez,
2016). Combination aerial photographs and sattelite
imagery (IKONOS, Quickbird, Worldview2 and
Geoeye-1) were used to interpreted shoreline
change at Wotje Atoll, Marshall Islands (Ford,
2013). Aryastana, Eryani, & Candrayana (2016)
were used SPOT 5 and SPOT 6/7 to analysis the
averege of coastline changes and average of erosion
rate from 2009 and 2015 at Gianyar Regency, Bali
Province, Indonesia. Post-processing result of
Envisat satellite altimetry data was evaluated in this
study to generate precise sea level height and sea
level rise as the bases for the coastal area potential
flood mapping, with case study of Buleleng
Regency, Bali, Indonesia. In the post-processing
stage, three types of geophysical corrections that
greatly affect the accuracy of altimetry data in
coastal areas were used, namely: tide, tropospheric
and ionospheric corrections (Heliani, Putra, &
Subaryono, 2014).

The 1st Warmadewa University International Conference on Architecture and Civil Engineering
SUSTAINABILITY, DESIGN AND CULTURE
20th October 2017, Faculty of Engineering, Warmadewa University, Bali
Design | 107
The use of remote sensing imagery such as
Landsat and Geographic Information System (GIS)
plays a very important role as a cheap and easy
method of provide data on coastal area coverage
and dynamics therein(Kasim, 2012).The objective
of this research is to analysis the average of
coastline changes in Buleleng Regency based on
SPOT 5 and SPOT 6/7 image.
B. STUDY AREA
The research sites were conducted along the
coast in Buleleng Regency (Figure 1). Buleleng
Regency is located in the northern part of Bali,
geographically located at 8º03’40”-8º23’00” LS
and 114º25’55”-115º27’28” BT. It has a coastal
length of about 144 km stretching from west to the
east of Bali island (BPS, 2015). It is the one of the
regency in the Bali Province with the longest
coastline.
Figure 1. Study Area (Anonim, 2016)
C. DATA AND METHODS
1. Satellite Data
Satellite imagery wasutilized areSPOT 5
image in 2009 has a spatial resolution of 10 m
(multispectral) and SPOT 6/7 image in 2015 with
resolution up to 1.5 m, which in detail can be seen
in Table 1.
Table 1. Image Data Specification
No Satellite
Imagery
Resolution
(m) Acquired Date Image
1 SPOT 5 10 04/12/2009
time 02:32:45
2 SPOT 5 10 06/14/2009
time 02:22:45
3 SPOT 5 10 06/15/2008
time 02:20:59
4 SPOT 6 1.5 03/19/2015
time 09:18:35

The 1st Warmadewa University International Conference on Architecture and Civil Engineering
SUSTAINABILITY, DESIGN AND CULTURE
20th October 2017, Faculty of Engineering, Warmadewa University, Bali
Design | 108
No Satellite
Imagery
Resolution
(m) Acquired Date Image
5 SPOT 6 1.5 02/16/2015
time 09:08:32
6 SPOT 7 1.5 07/02/2015
time 09:11:00
2. Image Processing
Image processing consists of image cropping,
radiometric correction, geometric correction, band
combination andcoastline digitization (Figure 2).
Figure 2. Flowchart of Image Processing
a. Image cropping
The image cropping was needed to get the
Area of Interest (AOI). It aims to decrease the
file size, so that the process will be fast
comparing with image without cropping
(Figure 3).
b. Radiometric correction
Radiometric correction of remotely sensed
data normally involves the processing of
digital images to improve the fidelity of the
brightness value magnitudes. The main
purpose for applying radiometric corrections is
to reduce the influence of errors or
inconsistencies in image brightness values that
may limit one's ability to interpret or
quantitatively process and analyze digital
remotely sensed images (Stow, 2017). Raw
data processed using ER-Mapper (Figure 4).
c. Geometric correction
Geometric corrections are made to correct
the inconsistency between the location
coordinates of the raw image data, and the
actual location coordinates on the ground or
base image. Several types of geometric
corrections include system, precision, and
terrain corrections. Geometric correction is
necessary to preprocess remotely sensed data
and remove geometric distortion (Dave, Joshi,
& Srivastava, 2015).The actual coordinates on
the ground were using Bench Mark (BM)
spread in Buleleng Regency (Table 2).
Start
SPOT 5 and SPOT
6/7 imagery
Image
cropping
Radiometric and
geometric correction
Band
combination
Coastline
digitization
Coastline
mapping
End

The 1st Warmadewa University International Conference on Architecture and Civil Engineering
SUSTAINABILITY, DESIGN AND CULTURE
20th October 2017, Faculty of Engineering, Warmadewa University, Bali
Design | 109
Figure 3. Result of Image Cropping
Figure 4. Result of Radiometric Correction
Table 2. BM Coordinates in Buleleng Regency
Coastal Area BM Code Coordinates
X Y Z
Gondol-Celukan Bawang BM1-TK 246962.00 9098244.00 3.520
Gondol-Celukan Bawang BM2-TK 247024.31 9098203.33 3.520
Gondol-Celukan Bawang BM3-TK 248087.17 9097875.17 2.850
Gondol-Celukan Bawang BM7-TK 251770.41 9096436.74 2.680
Gondol-Celukan Bawang BM14-TK 258823.15 9094445.08 2.250
Celukan Bawang-Pengastulan PCB-11 262629.88 9093707.97 3.626
Celukan Bawang-Pengastulan PCB-06 267123.55 9093959.40 3.156
Celukan Bawang-Pengastulan PCB-03 269437.04 9094875.98 2.289
Celukan Bawang-Pengastulan PCB-01 271882.09 9095087.64 2.809
Kubutambahan KT-1 302534.00 9107015.00 4.113
Kubutambahan KT-3 300758.01 9107997.78 4.212
Kubutambahan KT-4 299205.46 9108357.64 3.874
Kubutambahan KT-6 296856.32 9108068.34 3.125
Seririt-Kaliasem SKA-10 272938.98 9094830.69 3.487
Seririt-Kaliasem SKA-7 276471.52 9095013.42 3.238
Seririt-Kaliasem SKA-4 279407.63 9095623.57 2.611
Seririt-Kaliasem SKA-1 282033.75 9097051.88 3.053
Tembok-Tianyar BMT-1 330053.79 9096859.57 3.911
Tembok-Tianyar BMT-3 331531.53 9095518.69 3.943
Tembok-Tianyar BMT-5 333109.79 9095121.99 3.421
Tembok-Tianyar BMT-7 335277.93 9093320.71 3.391
Tembok-Tianyar BMT-11 337731.80 9091562.00 3.725
Kalisada KS-6 265372.17 9093414.77 2.953
Kalisada KS-1 267673.59 9094183.88 2.683
Source: Balai Wilayah Sungai Bali Penida

The 1st Warmadewa University International Conference on Architecture and Civil Engineering
SUSTAINABILITY, DESIGN AND CULTURE
20th October 2017, Faculty of Engineering, Warmadewa University, Bali
Design | 110
d. Band Combination
Multispectral data are composed of
several different bandwidths of image data
taken at the same time. Using these either
alone or combined enables discrimination
between many different cover and target types
(Belliss, 2017). SPOT has two band
combinations: RGB-123 and RGB-321. Band
combination RGB-321 was utilized to process
image data.
e. Coastline digitization
Coastline is obtained by manual
digitization of image that has the MNDWI
(Modified Normalized Difference Water
Index) transformation process. Digitization
process is done by using ArcGIS (Figure 5).
Figure 5. Coastline Digitization of SPOT Image of 2015
3. Waterline Correction
The 1985 national tidal height datum was used
as the local tidal datum (h) that can be estimated
from the hydrodynamic model. It was assumed that
the beach moves offshore or onshore with the same
bottom profile (Huang et al., 1994 in Liu, Huang,
Qiu, & Fan, 2013). Thus, the waterlines were
shifted to the tidal datum-based shoreline position
based on the equiangular triangle theory. The
shifting process and the bottom slope calculation
were carried out by sectional calculation (Thieler et
al., 2009 in Liu, Huang, Qiu, & Fan, 2013). The
shifted distance, Y, was estimated by
equation(Aryastana, Eryani, & Candrayana, 2016):
( (
) ) (1)
Where:
Y : The shifted distance
Tk : Sectional HWL (High Water Level)
Tb : Benoa Harbor HWL
Tx : Tidal datum where the image was
acquired
TanØ : coastal slope
The tidal datum was utilized to analysis the
waterline shifting process is from Benoa harbor and
the data when satellite was acquired time (Table 3).
The sectional of coastal slope in Buleleng Regency
can be seen in Figure 6.
Figure 6. Sectional of Coastal Slope
Table 3. Section of Coastal Slope Value
Section Slope Section Slope
01 1:20 07 1:12
02 1:23 08 1:12
03 1:18 09 1:11
04 1:27 10 1:11
05 1:20 11 1:13
06 1:13
Source: Balai Wilayah Sungai Bali-Penida
01
0203
04
05
0607 08
09
10
11

The 1st Warmadewa University International Conference on Architecture and Civil Engineering
SUSTAINABILITY, DESIGN AND CULTURE
20th October 2017, Faculty of Engineering, Warmadewa University, Bali
Design | 111
Table 4. The Shifted Distance for Satellite Imageryof 2009
Section Acquired
Image Date
Acquired
Image Time Tk(m) Tb(m) Tx(m) Slope Y(m)
01 12-04-2009 02:32:45 2.2 2.6 1.4 20 20.31
02 12-04-2009 02:32:45 2.2 2.6 1.4 23 23.35
03 12-04-2009 02:32:45 2.2 2.6 1.4 18 18.28
04 12-04-2009 02:32:45 2.2 2.6 1.4 27 27.42
05 14-06-2009 02:22:45 2.2 2.6 1.9 20 11.85
06 14-06-2009 02:22:45 2.2 2.6 1.9 13 7.70
07 14-06-2009 02:22:45 2.2 2.6 1.9 12 7.11
08 14-06-2009 02:22:45 2.2 2.6 1.9 12 7.11
09 14-06-2009 02:22:45 2.2 2.6 1.9 11 6.52
10 14-06-2009 02:22:45 2.2 2.6 1.9 11 6.52
11 14-06-2009 02:22:45 2.2 2.6 1.9 13 7.70
Table 5. The Shifted Distance for Satellite Imagery of 2015
Section Acquired
Image Date
Acquired
Image Time Tk (m) Tb (m) Tx (m) Slope Y (m)
01 03-02-2015 09:09:27 2.2 2.6 1.7 20 15.23
02 03-02-2015 09:09:27 2.2 2.6 1.7 23 17.52
03 02-07-2015 09:11:00 2.2 2.6 2.4 18 3.05
04 02-07-2015 09:11:00 2.2 2.6 2.4 27 4.57
05 02-07-2015 09:11:00 2.2 2.6 2.4 20 3.38
06 02-07-2015 09:11:00 2.2 2.6 2.4 13 2.20
07 02-07-2015 09:11:00 2.2 2.6 2.4 12 2.03
08 02-07-2015 09:11:00 2.2 2.6 2.4 12 2.03
09 19-03-2015 09:18:35 2.2 2.6 2.1 11 4.65
10 19-03-2015 09:18:35 2.2 2.6 2.1 11 4.65
11 19-03-2015 09:18:35 2.2 2.6 2.1 13 5.50
Figure 7. Coastline Map of 2009 and 2015
4. Coastline Changes Analysis
Coastline changes analysis was calculated
based on overlapping method from 2009 and 2015
(Figure 6). Based on Figure 6, the length of
coastline changes is indicated by A, B, C, D and E.
The average of coastline changes (CR) in one area
of coastal was estimated by:
CR = (A+B+C+D+E)/5 (2)
Based on data from public work office,
Buleleng Regency has 52 coastal areas stretching
from west to the east of Bali islands. The average of
coastal changes in each area can be seen on Table
6.
: Coastline of 2015
: Coastline of 2009
The 1st Warmadewa University International Conference on Architecture and Civil Engineering
SUSTAINABILITY, DESIGN AND CULTURE
20th October 2017, Faculty of Engineering, Warmadewa University, Bali
Design | 112
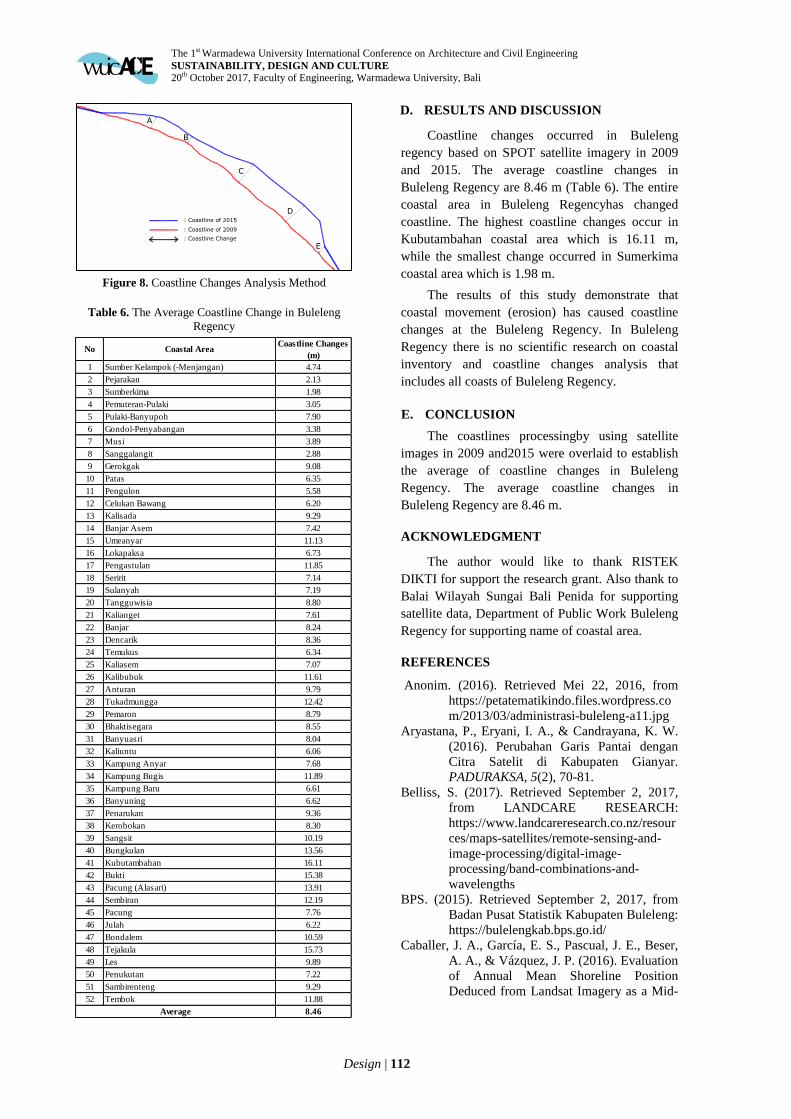
Figure 8. Coastline Changes Analysis Method
Table 6. The Average Coastline Change in Buleleng
Regency
D. RESULTS AND DISCUSSION
Coastline changes occurred in Buleleng
regency based on SPOT satellite imagery in 2009
and 2015. The average coastline changes in
Buleleng Regency are 8.46 m (Table 6). The entire
coastal area in Buleleng Regencyhas changed
coastline. The highest coastline changes occur in
Kubutambahan coastal area which is 16.11 m,
while the smallest change occurred in Sumerkima
coastal area which is 1.98 m.
The results of this study demonstrate that
coastal movement (erosion) has caused coastline
changes at the Buleleng Regency. In Buleleng
Regency there is no scientific research on coastal
inventory and coastline changes analysis that
includes all coasts of Buleleng Regency.
E. CONCLUSION
The coastlines processingby using satellite
images in 2009 and2015 were overlaid to establish
the average of coastline changes in Buleleng
Regency. The average coastline changes in
Buleleng Regency are 8.46 m.
ACKNOWLEDGMENT
The author would like to thank RISTEK
DIKTI for support the research grant. Also thank to
Balai Wilayah Sungai Bali Penida for supporting
satellite data, Department of Public Work Buleleng
Regency for supporting name of coastal area.
REFERENCES
Anonim. (2016). Retrieved Mei 22, 2016, from
https://petatematikindo.files.wordpress.co
m/2013/03/administrasi-buleleng-a11.jpg
Aryastana, P., Eryani, I. A., & Candrayana, K. W.
(2016). Perubahan Garis Pantai dengan
Citra Satelit di Kabupaten Gianyar.
PADURAKSA, 5(2), 70-81.
Belliss, S. (2017). Retrieved September 2, 2017,
from LANDCARE RESEARCH:
https://www.landcareresearch.co.nz/resour
ces/maps-satellites/remote-sensing-and-
image-processing/digital-image-
processing/band-combinations-and-
wavelengths
BPS. (2015). Retrieved September 2, 2017, from
Badan Pusat Statistik Kabupaten Buleleng:
https://bulelengkab.bps.go.id/
Caballer, J. A., García, E. S., Pascual, J. E., Beser,
A. A., & Vázquez, J. P. (2016). Evaluation
of Annual Mean Shoreline Position
Deduced from Landsat Imagery as a Mid-
A
B
C
D
E
: Coastline of 2015
: Coastline of 2009
: Coastline Change
No Coastal AreaCoastline Changes
(m)
1 Sumber Kelampok (-Menjangan) 4.74
2 Pejarakan 2.13
3 Sumberkima 1.98
4 Pemuteran-Pulaki 3.05
5 Pulaki-Banyupoh 7.90
6 Gondol-Penyabangan 3.38
7 Musi 3.89
8 Sanggalangit 2.88
9 Gerokgak 9.08
10 Patas 6.35
11 Pengulon 5.58
12 Celukan Bawang 6.20
13 Kalisada 9.29
14 Banjar Asem 7.42
15 Umeanyar 11.13
16 Lokapaksa 6.73
17 Pengastulan 11.85
18 Seririt 7.14
19 Sulanyah 7.19
20 Tangguwisia 8.80
21 Kalianget 7.61
22 Banjar 8.24
23 Dencarik 8.36
24 Temukus 6.34
25 Kaliasem 7.07
26 Kalibubuk 11.61
27 Anturan 9.79
28 Tukadmungga 12.42
29 Pemaron 8.79
30 Bhaktisegara 8.55
31 Banyuasri 8.04
32 Kaliuntu 6.06
33 Kampung Anyar 7.68
34 Kampung Bugis 11.89
35 Kampung Baru 6.61
36 Banyuning 6.62
37 Penarukan 9.36
38 Kerobokan 8.30
39 Sangsit 10.19
40 Bungkulan 13.56
41 Kubutambahan 16.11
42 Bukti 15.38
43 Pacung (Alasari) 13.91
44 Sembiran 12.19
45 Pacung 7.76
46 Julah 6.22
47 Bondalem 10.59
48 Tejakula 15.73
49 Les 9.89
50 Penukutan 7.22
51 Sambirenteng 9.29
52 Tembok 11.88
8.46Average

The 1st Warmadewa University International Conference on Architecture and Civil Engineering
SUSTAINABILITY, DESIGN AND CULTURE
20th October 2017, Faculty of Engineering, Warmadewa University, Bali
Design | 113
term Coastal Evolution Indicator. Marine
Geology(372), 79-88.
Dave, C. P., Joshi, R., & Srivastava, S. (2015). A
Survey on Geometric Correction of
Satellite Imagery. International Journal of
Computer Applications, 116(12), 24-27.
El-Asmar, H., & Hereher, M. (2011). Change
Detection of The Coastal Zone East of The
Nile Delta. Environ Earth Sci(62), 769–
777.
Ford, M. (2013). Shoreline Changes Interpreted
from Multi-temporal Aerial Photographs
and High Resolution Satellite Images:
Wotje Atoll, Marshall Islands. Remote
Sensing of Environment(135), 130-140.
Guariglia, A., Buonamassa, A., Losurdo, A.,
Saladino, R., Trivigno, M. L., Zaccagnino,
A., et al. (2006). A Multisource Approach
for Coastline Mapping and Identification
of Shoreline Changes. ANNALS OF
GEOPHYSICS, 49(1), 295-304.
Heliani, L. S., Putra, I. K., & Subaryono. (2014).
The Evaluation of the Result of Post-
Processing Envisat Satellite Altimetry
Data Used for Coastal Area Potential
Flood Mapping(Case Study: Coastal Area
of Buleleng Regency, Bali, Indonesia).
The 4th International Conference on
Sustainable Future for Human Security,
SUSTAIN 2013 (pp. 651-657). Kyoto:
Procedia Environmental Sciences.
Kasim, F. (2012). Some Approaching Methods in
Coastline Change Monitoring Using
Remote Sensing Dataset of Landsat and
GIS. Jurnal Ilmiah Agropolitan, 5(1), 620-
635.
Kuleli, T., Guneroglu, A., Karsli, F., & Dihkan, M.
(2011). Automatic Detection of Shoreline
Change on Coastal Ramsar Wetlands of
Turkey. Ocean Engineering(38), 1141-
1149.
Li, X., & Damen, M. C. (2010). Coastline Change
Detection with Satellite Remote Sensing
for Environmental Management of the
Pearl River Estuary, China. Journal of
Marine Systems(82), S54–S61.
Liu, Y., Huang, H., Qiu, Z., & Fan, J. (2013).
Detecting Coastline Change from Satellite
Images based on Beach Slope Estimation
in a Tidal Flat. International Journal of
Applied Earth Observation and
Geoinformation(23), 165-176.
Rubio, G. G., Huntley, D., & Russell, P. (2015).
Evaluating Shoreline Identification Using
Optical Satellite Images. Marine
Geology(359), 96-105.
Stow, D. A. (2017). Radiometric Correction of
Remotely Sensed Data. San Diego: San
Diego State University.