Embed Size (px)
Citation preview
New Nuclear Power and Climate Change:
Issues and Opportunities
Alan Nogee, Director
Clean Energy Program
Union of Concerned Scientists
Is Nuclear Power a Viable Climate
Solution? Alan Nogee
Clean Energy Program DirectorUnion of Concerned Scientists
AWMA-NES Fall 2006 Conference and EBC-NE Seminar
November 3, 2006Doubletree HotelWestborough, MA
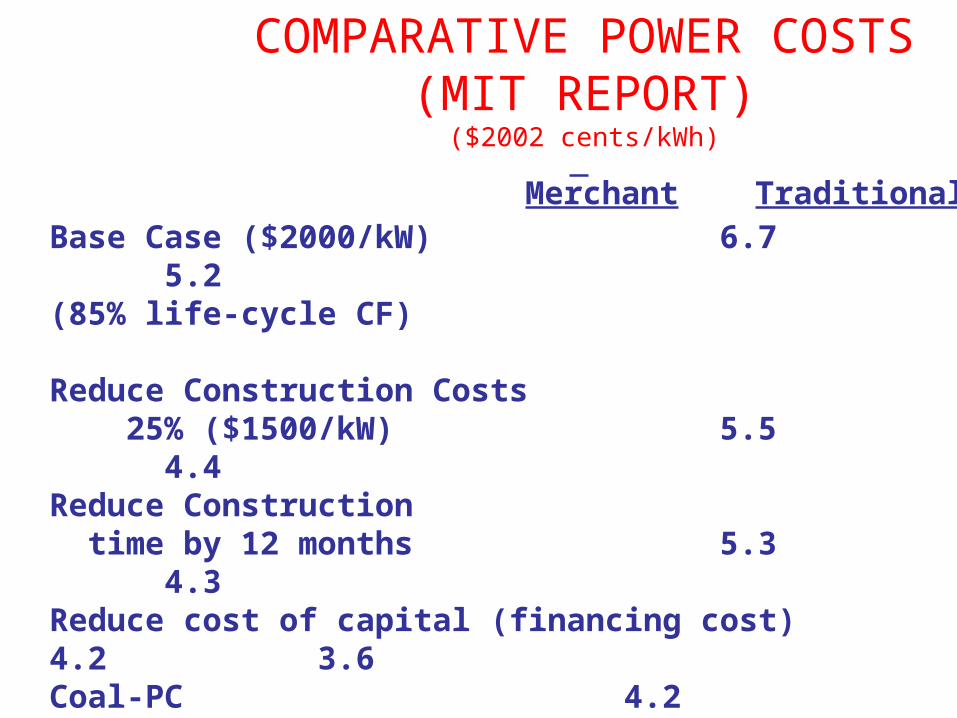
COMPARATIVE POWER COSTS(MIT REPORT)
($2002 cents/kWh)
Base Case ($2000/kW) 6.7 5.2(85% life-cycle CF)
Reduce Construction Costs 25% ($1500/kW) 5.5 4.4Reduce Construction time by 12 months 5.3 4.3Reduce cost of capital (financing cost) 4.2 3.6
Coal-PC 4.2 3.5Gas-Low ($3.77/MCF) 3.8 3.6Gas-Moderate ($4.42/MCF) 4.1 4.0Gas-High ($6.72/MCF) 5.6 5.7
Merchant Traditional
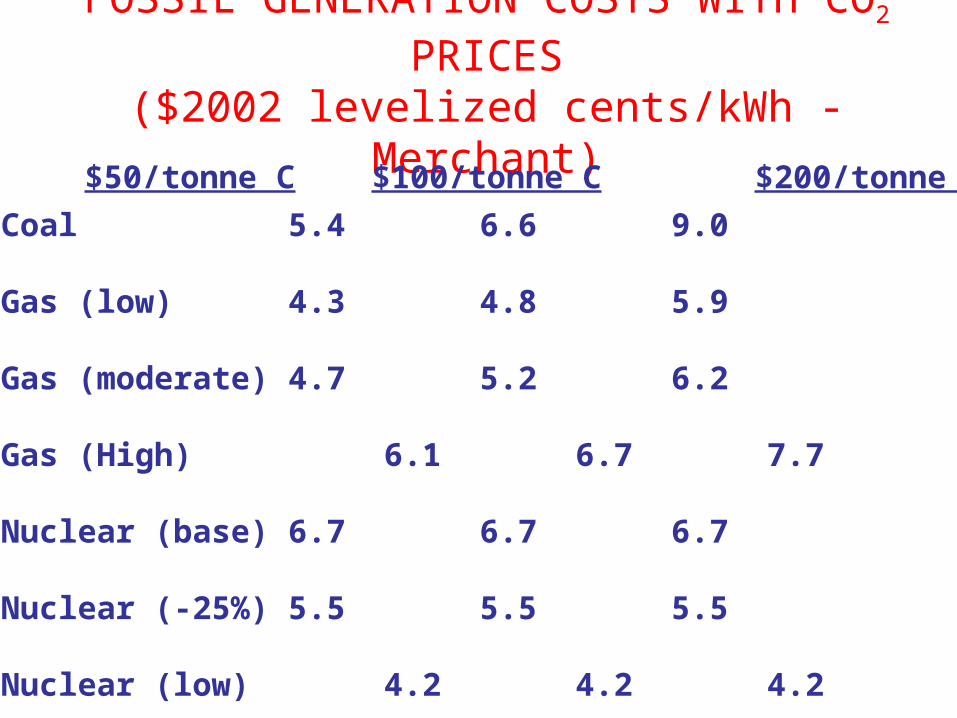
FOSSIL GENERATION COSTS WITH CO2 PRICES
($2002 levelized cents/kWh - Merchant)$50/tonne C $100/tonne C $200/tonne C
Coal 5.4 6.6 9.0
Gas (low) 4.3 4.8 5.9
Gas (moderate) 4.7 5.2 6.2
Gas (High) 6.1 6.7 7.7
Nuclear (base) 6.7 6.7 6.7
Nuclear (-25%) 5.5 5.5 5.5
Nuclear (low) 4.2 4.2 4.2
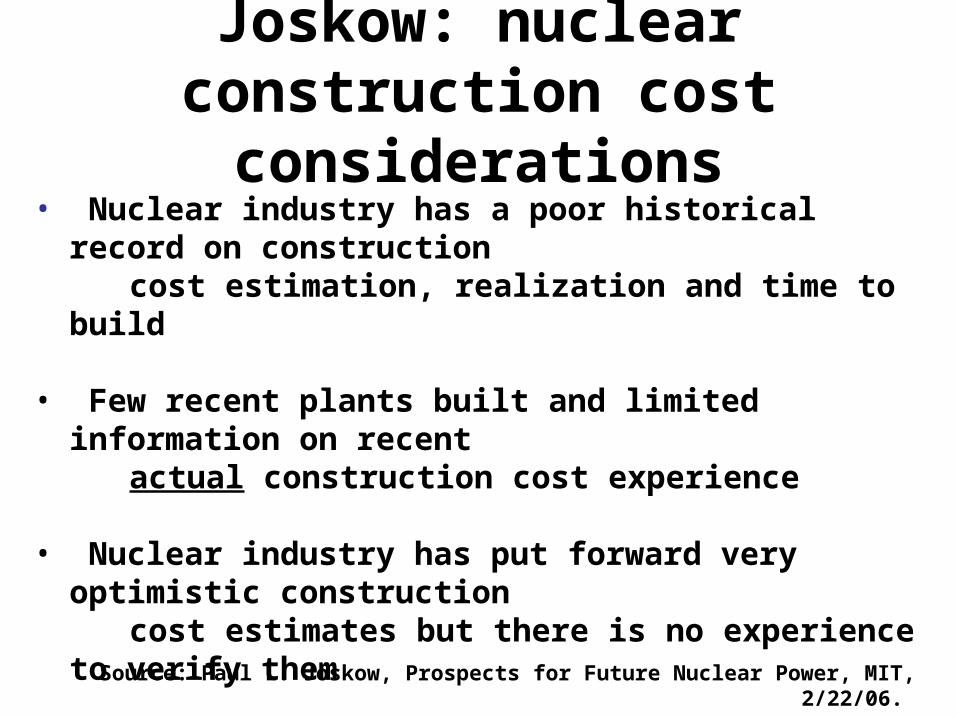
Joskow: nuclear construction cost considerations
• Nuclear industry has a poor historical record on construction cost estimation, realization and time to build
• Few recent plants built and limited information on recent actual construction cost experience
• Nuclear industry has put forward very optimistic construction cost estimates but there is no experience to verify them
• Nobody has ever underestimated the construction cost of a nuclear power plant at the pre-construction stage
Source: Paul L. Joskow, Prospects for Future Nuclear Power, MIT, 2/22/06.
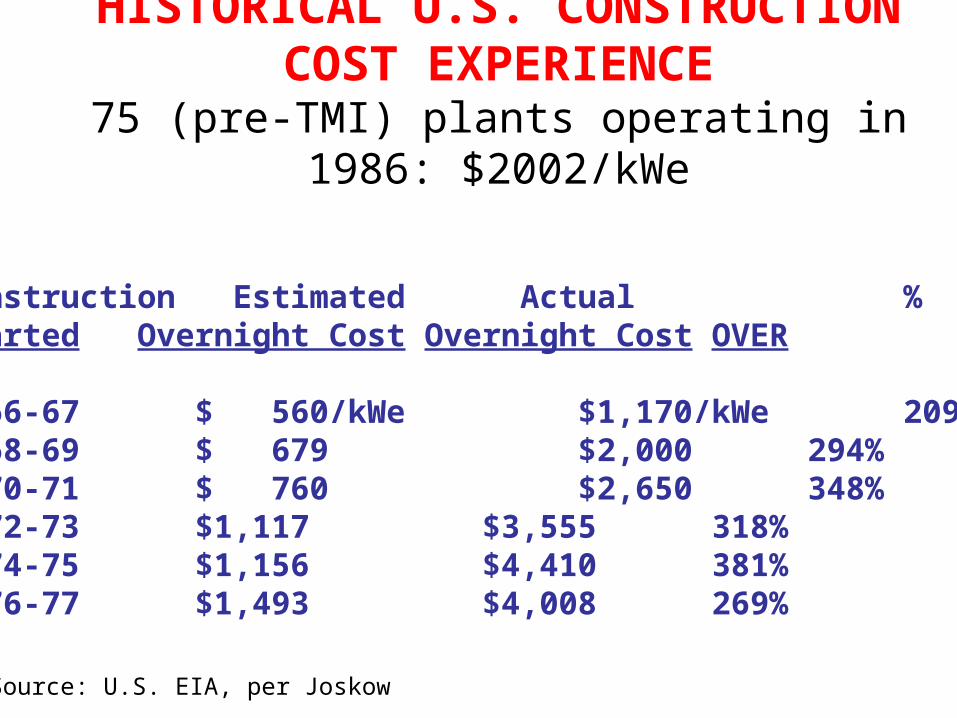
HISTORICAL U.S. CONSTRUCTION COST EXPERIENCE
75 (pre-TMI) plants operating in 1986: $2002/kWe
Construction Estimated Actual %Started Overnight Cost Overnight Cost OVER
1966-67 $ 560/kWe $1,170/kWe 209%1968-69 $ 679 $2,000 294%1970-71 $ 760 $2,650 348%1972-73 $1,117 $3,555 318%1974-75 $1,156 $4,410 381%1976-77 $1,493 $4,008 269%
Source: U.S. EIA, per Joskow
But cost overruns, quality assurance problems surely
now a thing of the pastAfter all, the same company that built most current
nuclear plants—and will probably also build most of the next generation—also built…
…the Big Dig.
(They’re also building the Yucca Mountain nuclear waste repository, so we can have confidence it will be leak-free for a few hundred thousand years or so.)
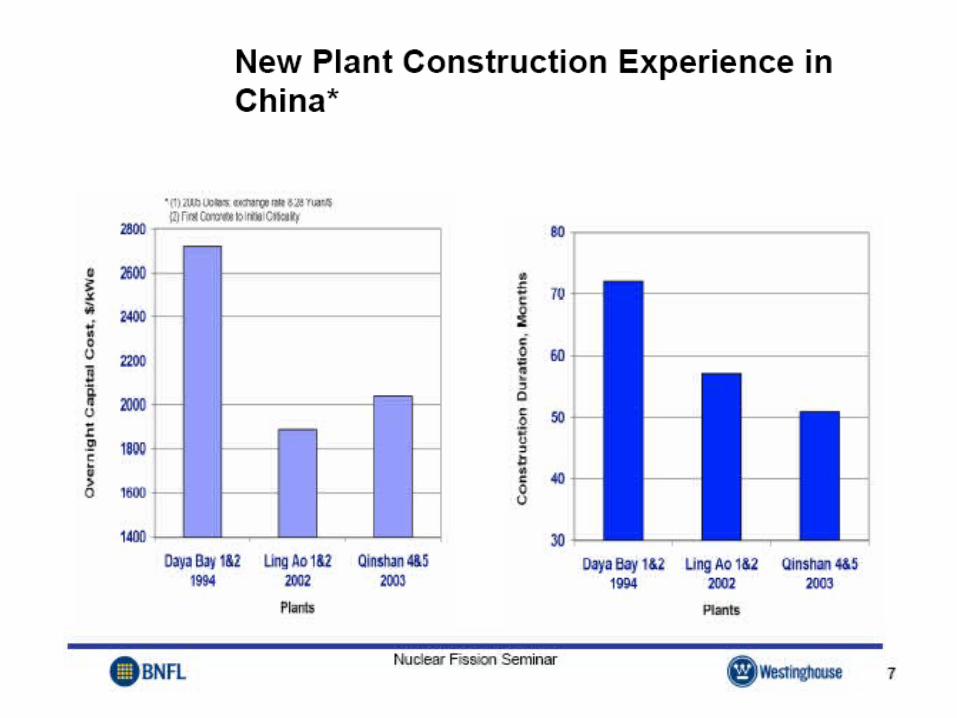
EIA: $2,000/kW (overnight costs) reference case
basis• Average of the construction costs incurred
in completed advanced reactor builds in Asia, adjusting for expected learning from other units still under construction. (emphasis added)
• How realistic a predictor of US costs?
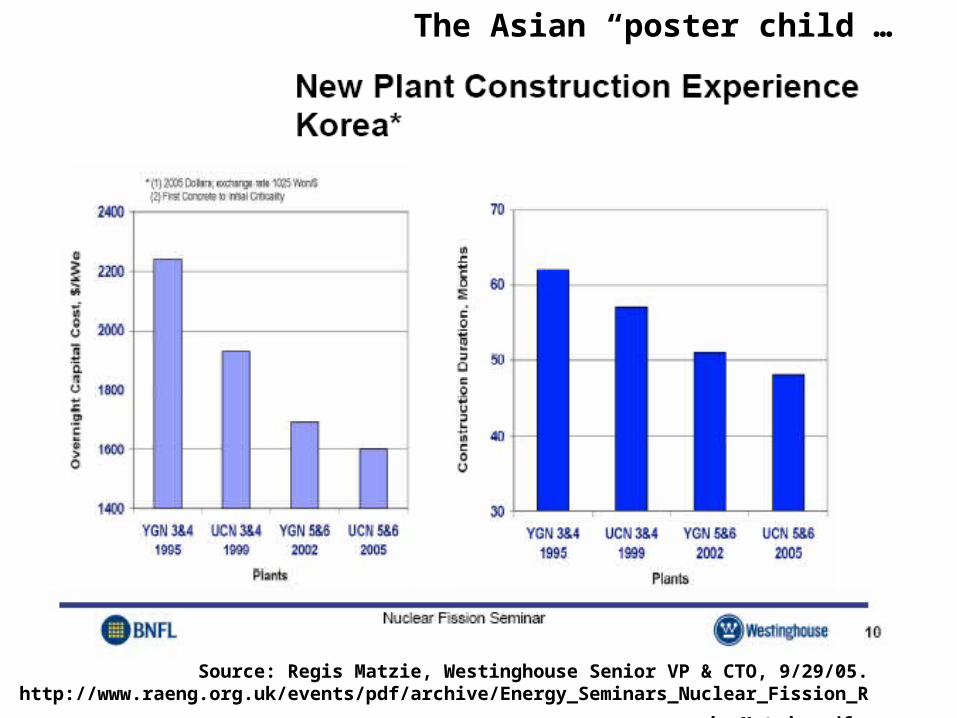
Source: Regis Matzie, Westinghouse Senior VP & CTO, 9/29/05. http://www.raeng.org.uk/events/pdf/archive/Energy_Seminars_Nuclear_Fission_Regis_Matzie.pd
f
The Asian “poster child”…
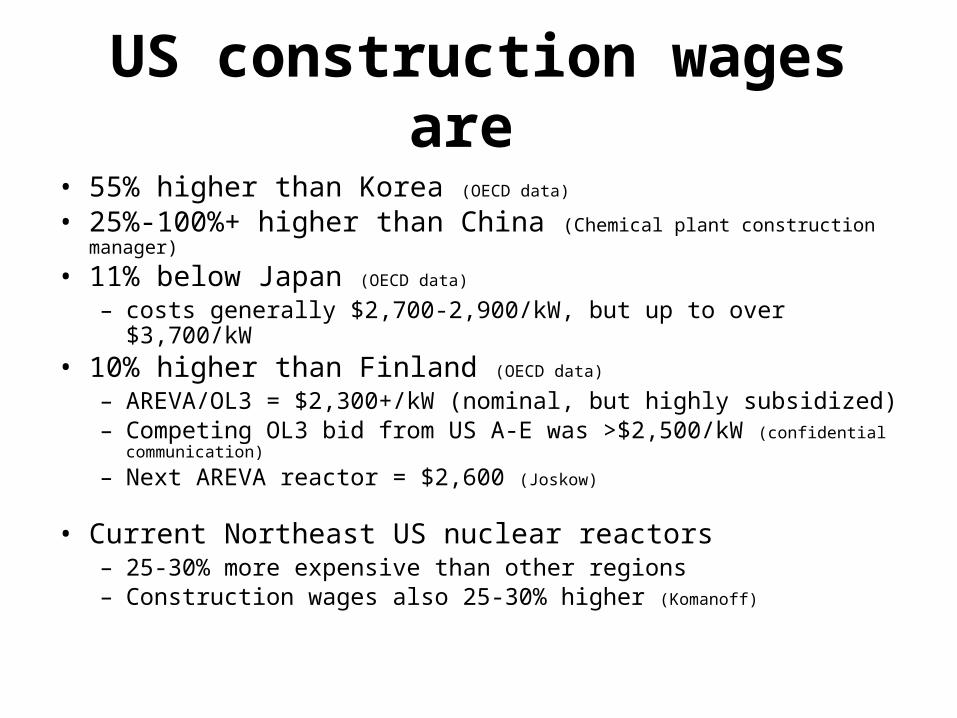
US construction wages are
• 55% higher than Korea (OECD data)
• 25%-100%+ higher than China (Chemical plant construction manager)
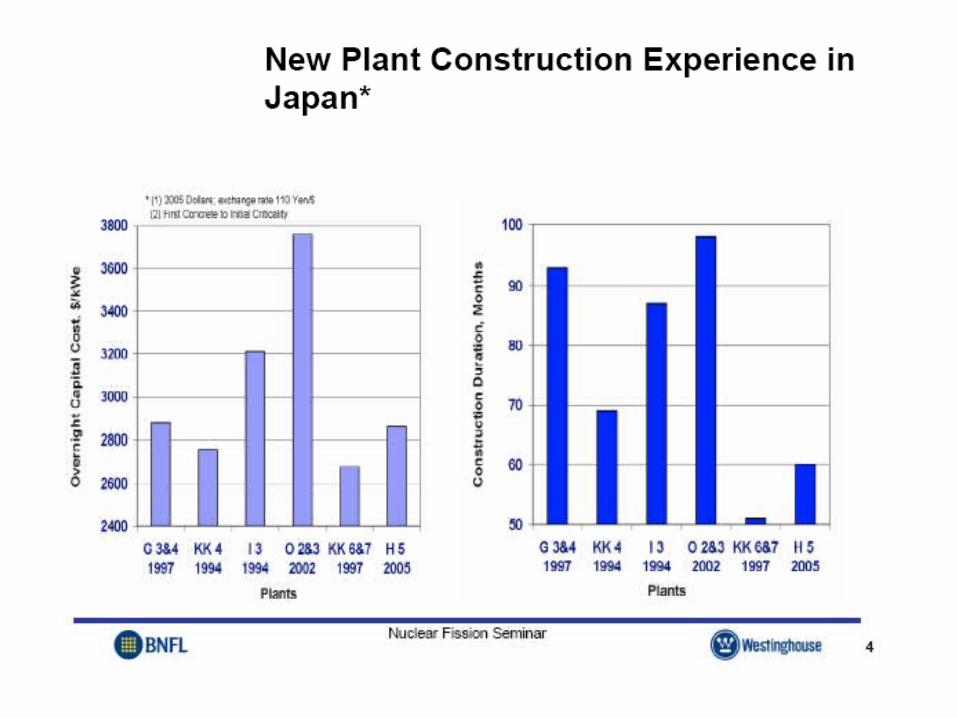
• 11% below Japan (OECD data)
– costs generally $2,700-2,900/kW, but up to over $3,700/kW• 10% higher than Finland (OECD data)
– AREVA/OL3 = $2,300+/kW (nominal, but highly subsidized)– Competing OL3 bid from US A-E was >$2,500/kW (confidential
communication)
– Next AREVA reactor = $2,600 (Joskow)
• Current Northeast US nuclear reactors – 25-30% more expensive than other regions– Construction wages also 25-30% higher (Komanoff)
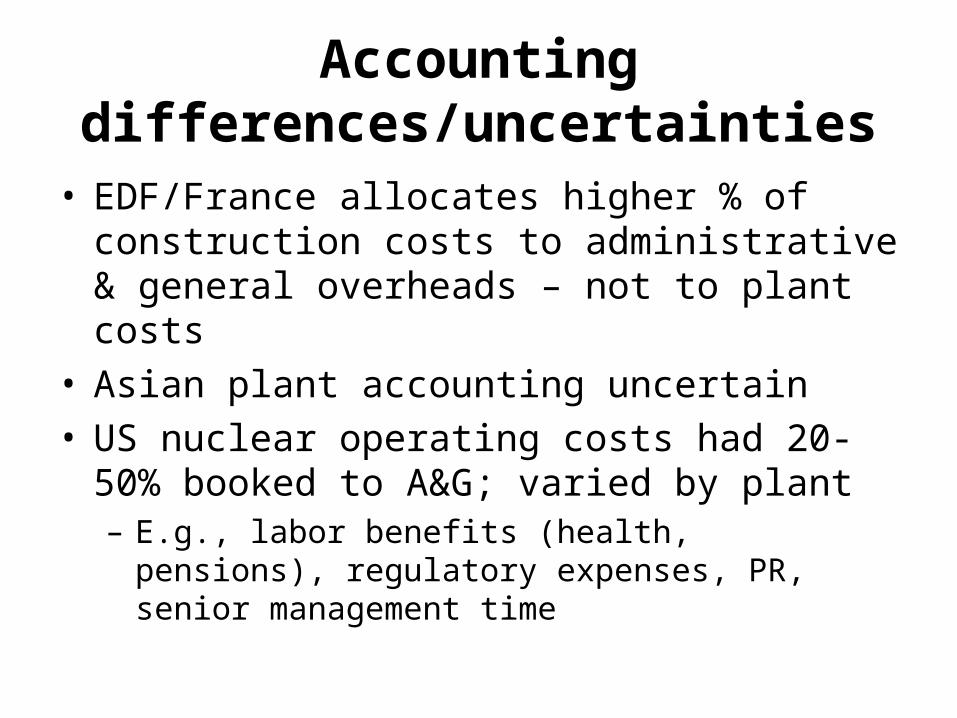
Accounting differences/uncertainties
• EDF/France allocates higher % of construction costs to administrative & general overheads – not to plant costs
• Asian plant accounting uncertain• US nuclear operating costs had 20-50% booked
to A&G; varied by plant– E.g., labor benefits (health, pensions), regulatory
expenses, PR, senior management time
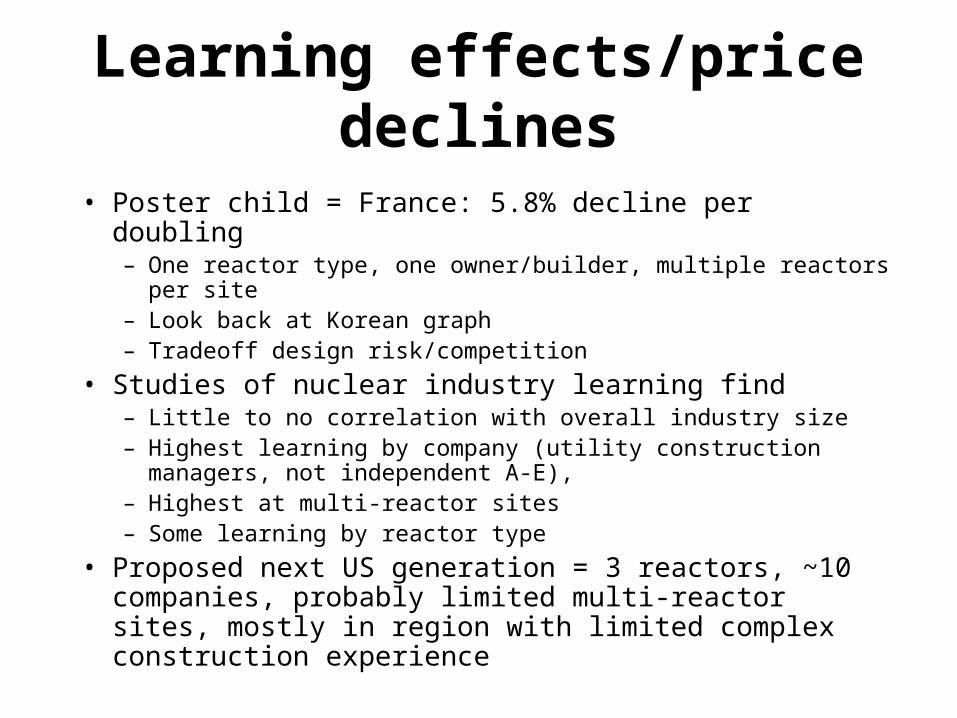
Learning effects/price declines
• Poster child = France: 5.8% decline per doubling – One reactor type, one owner/builder, multiple reactors per site– Look back at Korean graph– Tradeoff design risk/competition
• Studies of nuclear industry learning find– Little to no correlation with overall industry size– Highest learning by company (utility construction managers,
not independent A-E), – Highest at multi-reactor sites– Some learning by reactor type
• Proposed next US generation = 3 reactors, ~10 companies, probably limited multi-reactor sites, mostly in region with limited complex construction experience
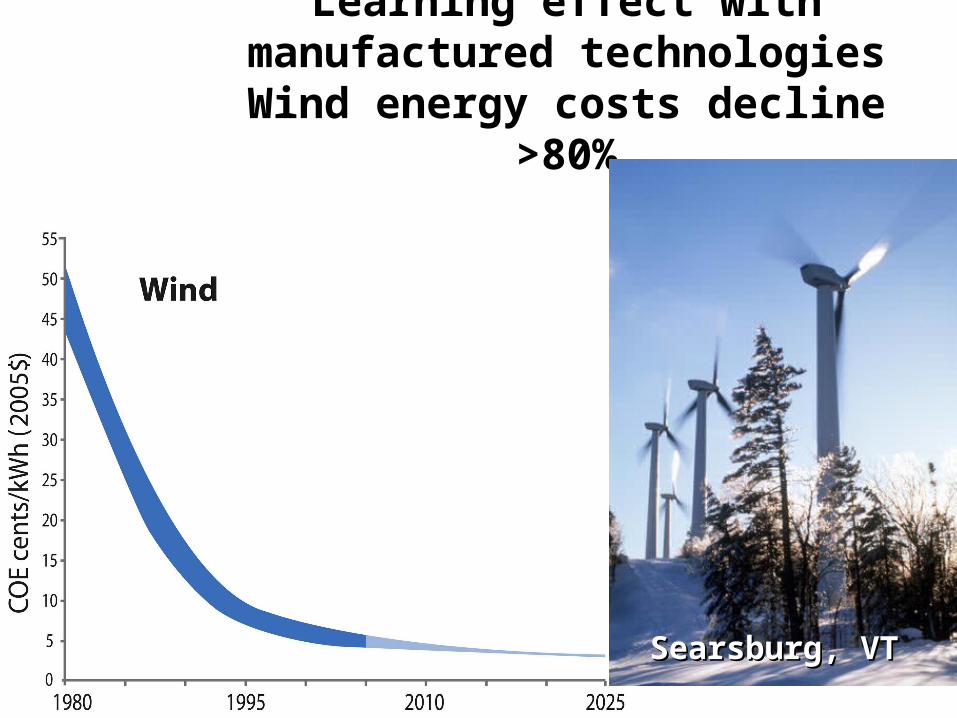
Learning effect with manufactured technologies
Wind energy costs decline >80%
Searsburg, VTSearsburg, VT
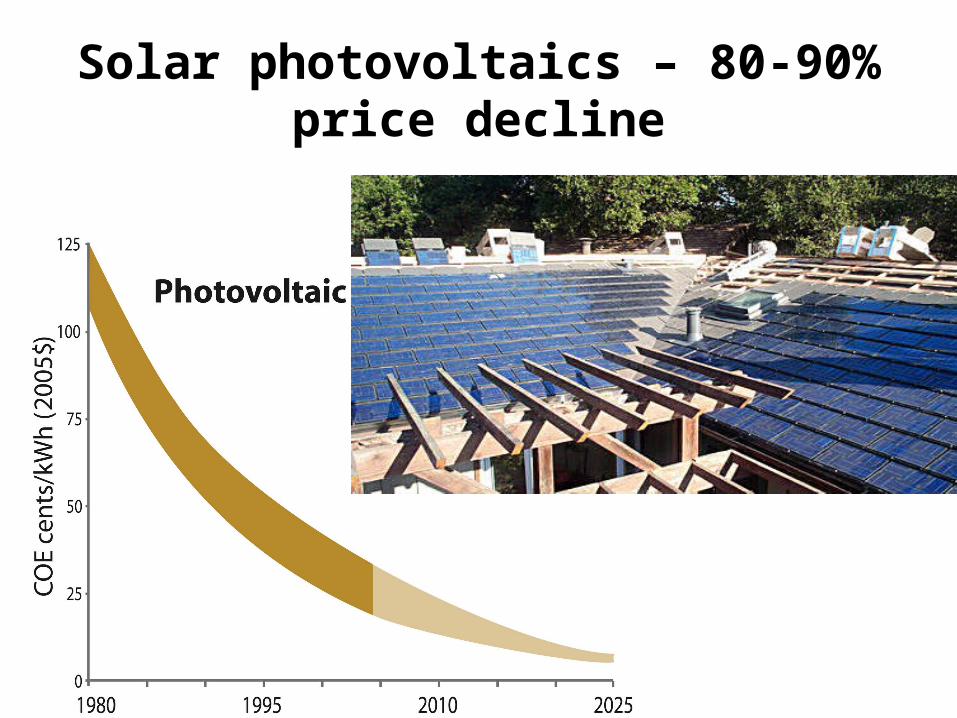
Solar photovoltaics – 80-90% price decline
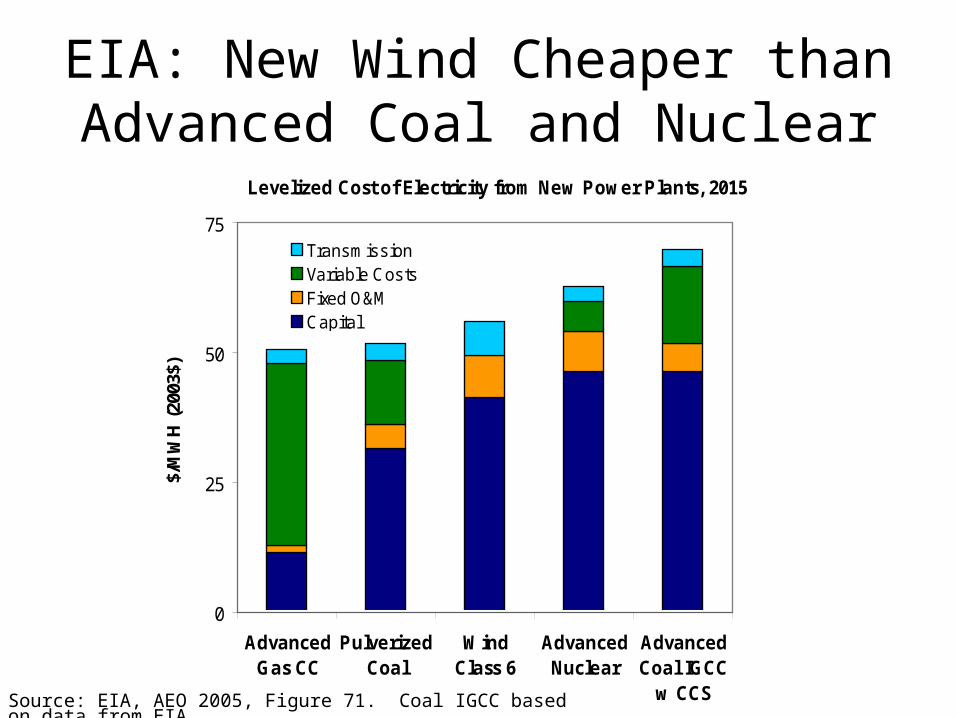
EIA: New Wind Cheaper thanAdvanced Coal and Nuclear
0
25
50
75
AdvancedGas CC
PulverizedCoal
WindClass 6
AdvancedNuclear
AdvancedCoal IGCC
w CCS
Levelized Cost of Electricity from New Power Plants, 2015$/
MW
H (
2003
$)
TransmissionVariable CostsFixed O&MCapital
Source: EIA, AEO 2005, Figure 71. Coal IGCC based on data from EIA.
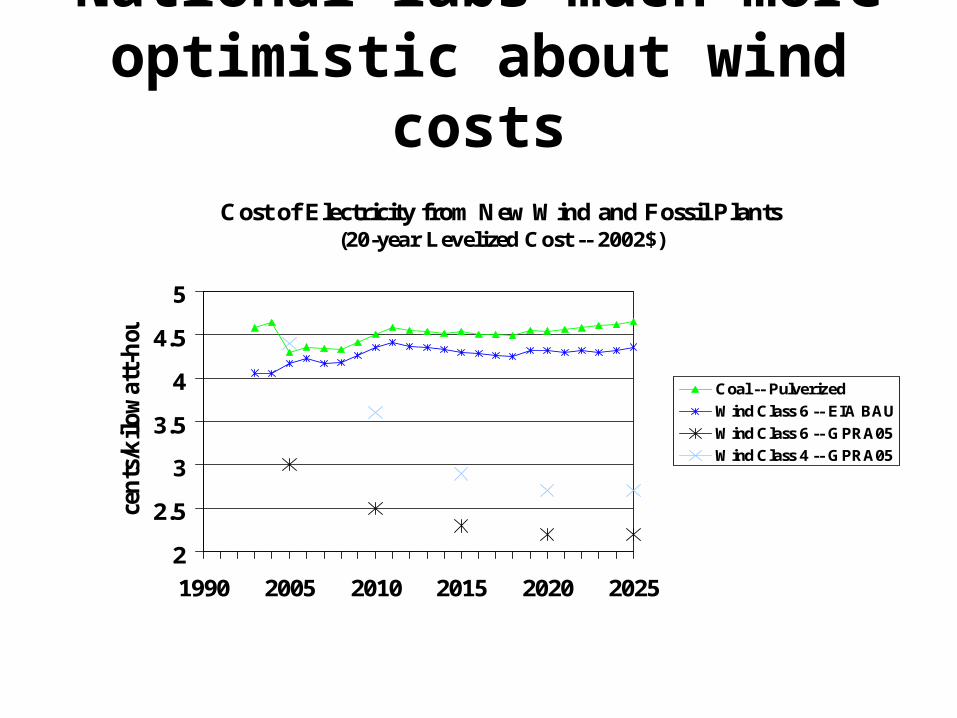
National labs much more optimistic about wind costs
Cost of Electricity from New Wind and Fossil Plants(20-year Levelized Cost -- 2002$)
2
2.5
3
3.5
4
4.5
5
1990 2005 2010 2015 2020 2025
cen
ts/k
ilow
att-
hou
r
Coal -- Pulverized
Wind Class 6 -- EIA BAU
Wind Class 6 -- GPRA05
Wind Class 4 -- GPRA05
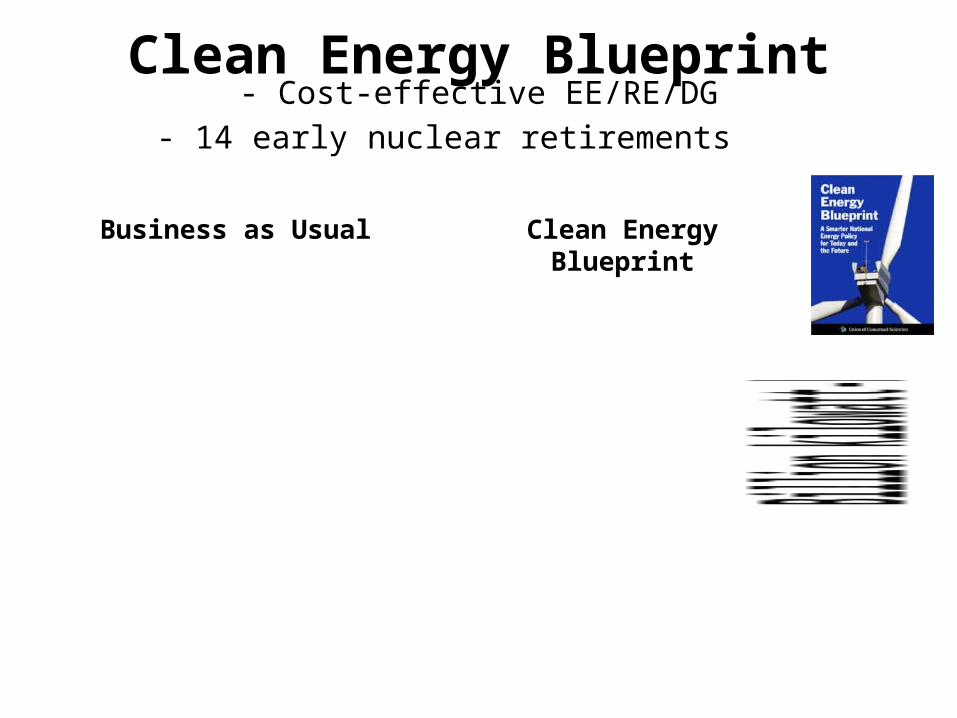
Clean Energy Blueprint- Cost-effective EE/RE/DG
- 14 early nuclear retirements
Business as Usual Clean Energy Blueprint
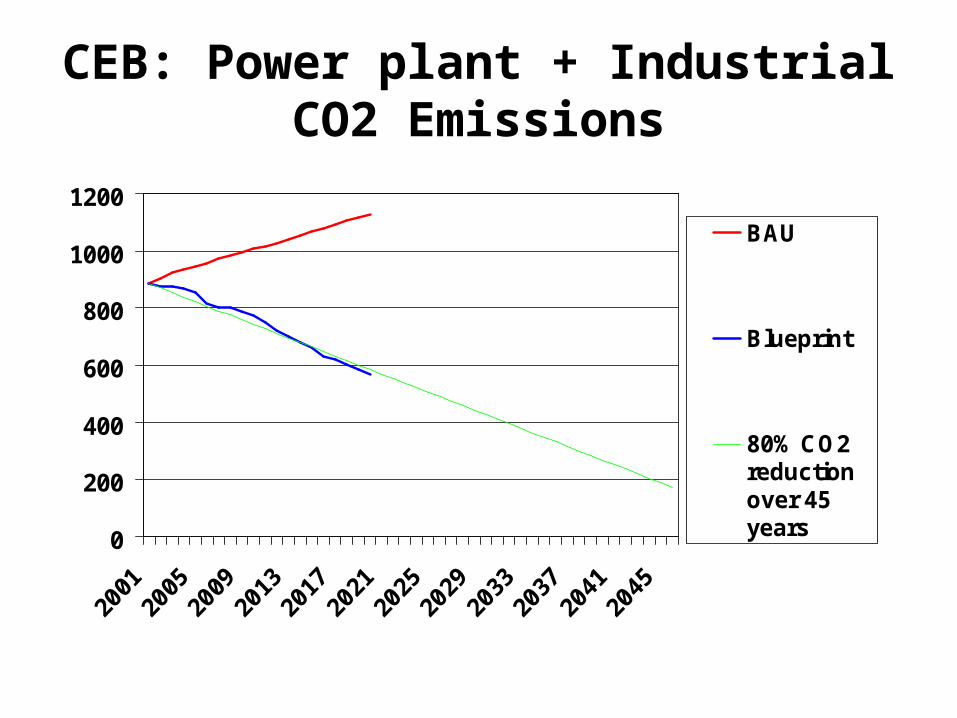
CEB: Power plant + Industrial CO2 Emissions
0
200
400
600
800
1000
1200
BAU
Blueprint
80% CO2reductionover 45years
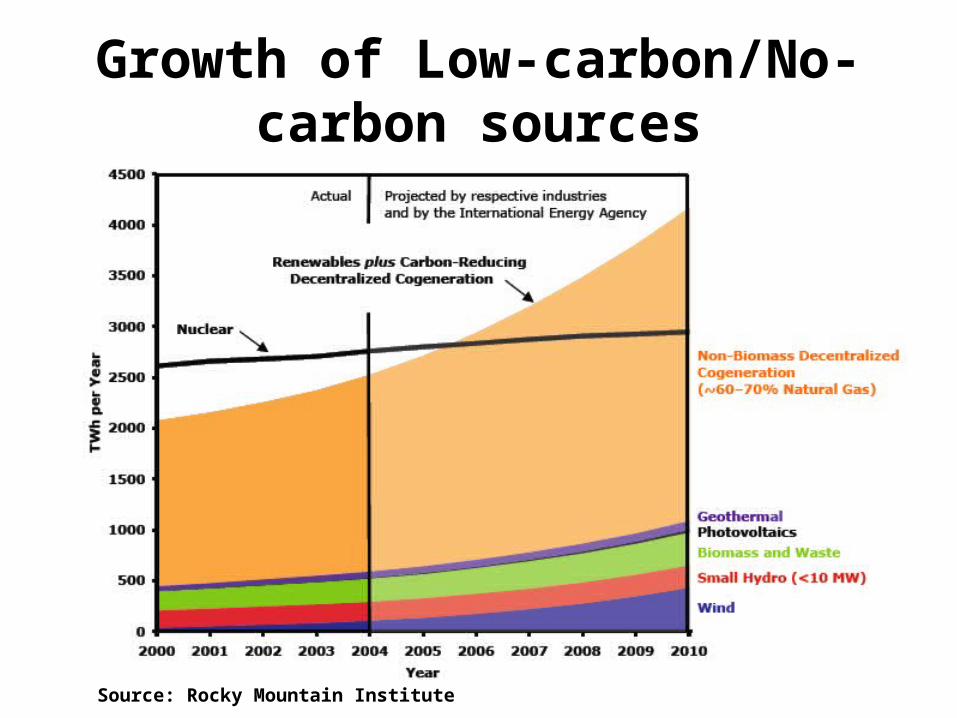
Growth of Low-carbon/No-carbon sources
Source: Rocky Mountain Institute
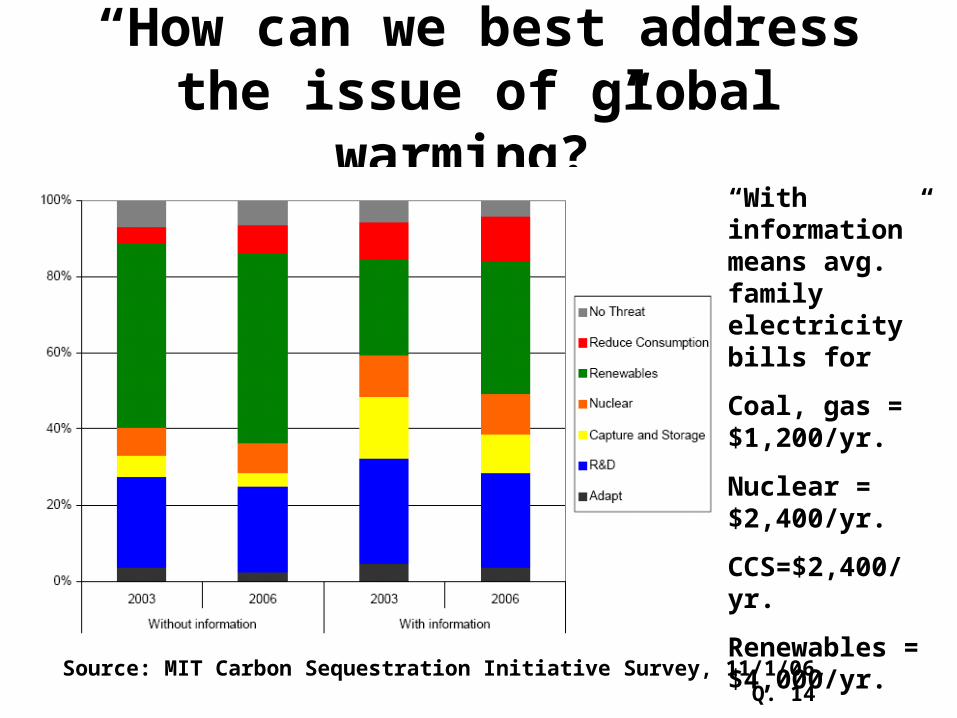
“How can we best address the issue of global warming?”
“With information” means avg. family electricity bills for
Coal, gas = $1,200/yr.
Nuclear = $2,400/yr.
CCS=$2,400/yr.
Renewables = $4,000/yr.
Source: MIT Carbon Sequestration Initiative Survey, 11/1/06, Q. 14
http://sequestration.mit.edu/pdf/2006_Graphic_Summary_Appendix.pdf
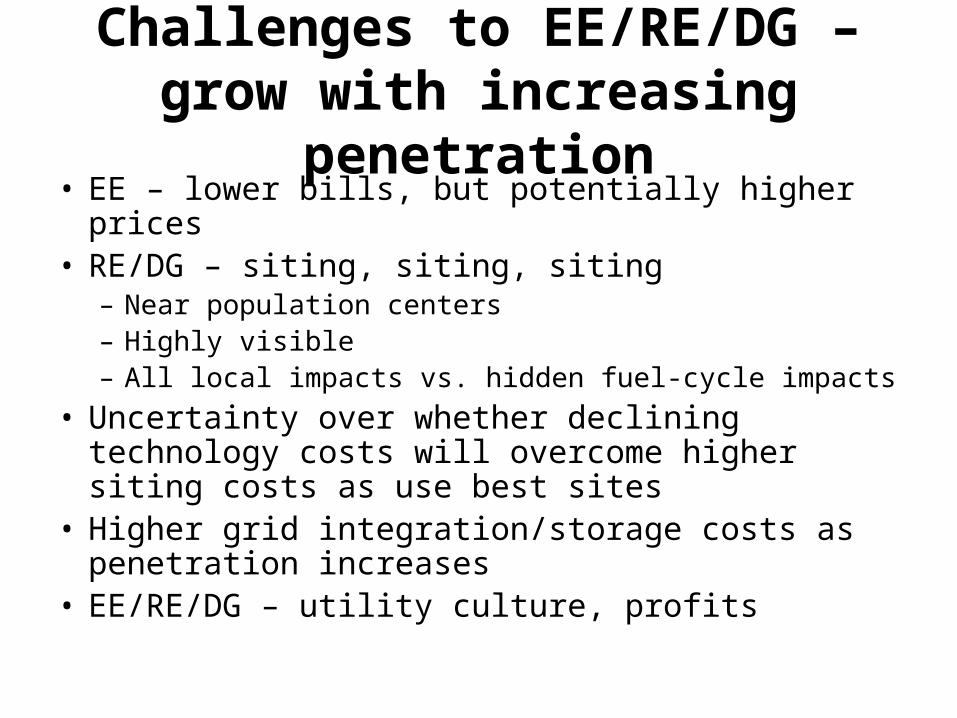
Challenges to EE/RE/DG – grow with increasing penetration
• EE – lower bills, but potentially higher prices• RE/DG – siting, siting, siting
– Near population centers– Highly visible– All local impacts vs. hidden fuel-cycle impacts
• Uncertainty over whether declining technology costs will overcome higher siting costs as use best sites
• Higher grid integration/storage costs as penetration increases
• EE/RE/DG – utility culture, profits
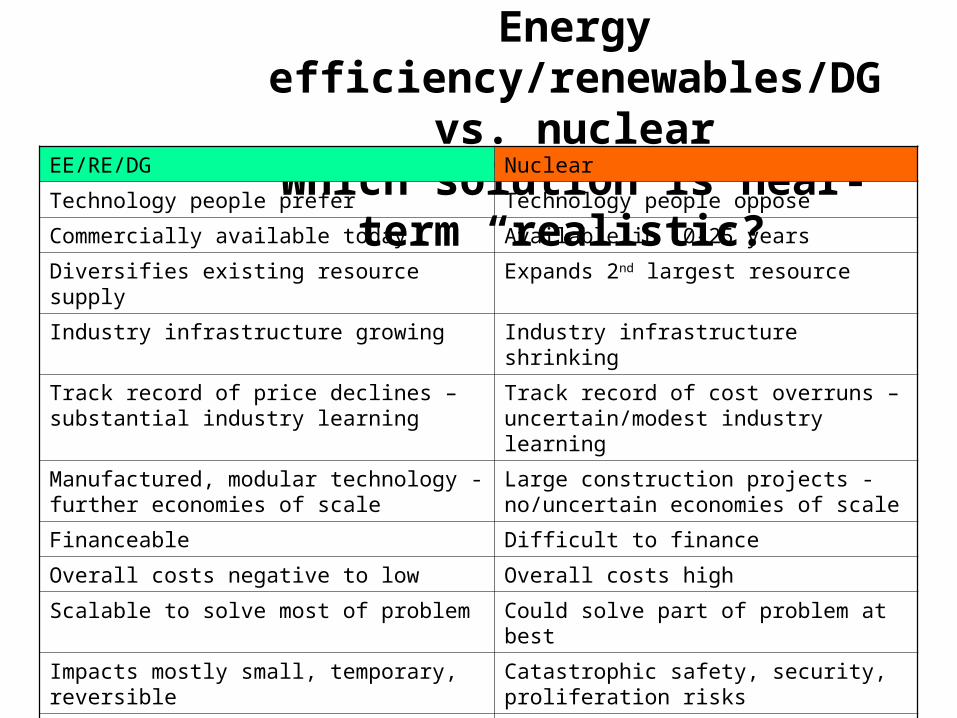
Political/economic realism: Energy efficiency/renewables/DG
vs. nuclearWhich solution is near-term
“realistic?”EE/RE/DG Nuclear
Technology people prefer Technology people oppose
Commercially available today Available in 10-25 years
Diversifies existing resource supply Expands 2nd largest resource
Industry infrastructure growing Industry infrastructure shrinking
Track record of price declines – substantial industry learning
Track record of cost overruns – uncertain/modest industry learning
Manufactured, modular technology - further economies of scale
Large construction projects - no/uncertain economies of scale
Financeable Difficult to finance
Overall costs negative to low Overall costs high
Scalable to solve most of problem Could solve part of problem at best
Impacts mostly small, temporary, reversible Catastrophic safety, security, proliferation risks
Uses little to no fuel Non-renewable resource
Uses little to no water Consumes great quantities of water
Virtually no wastes Storage needed for thousands of years
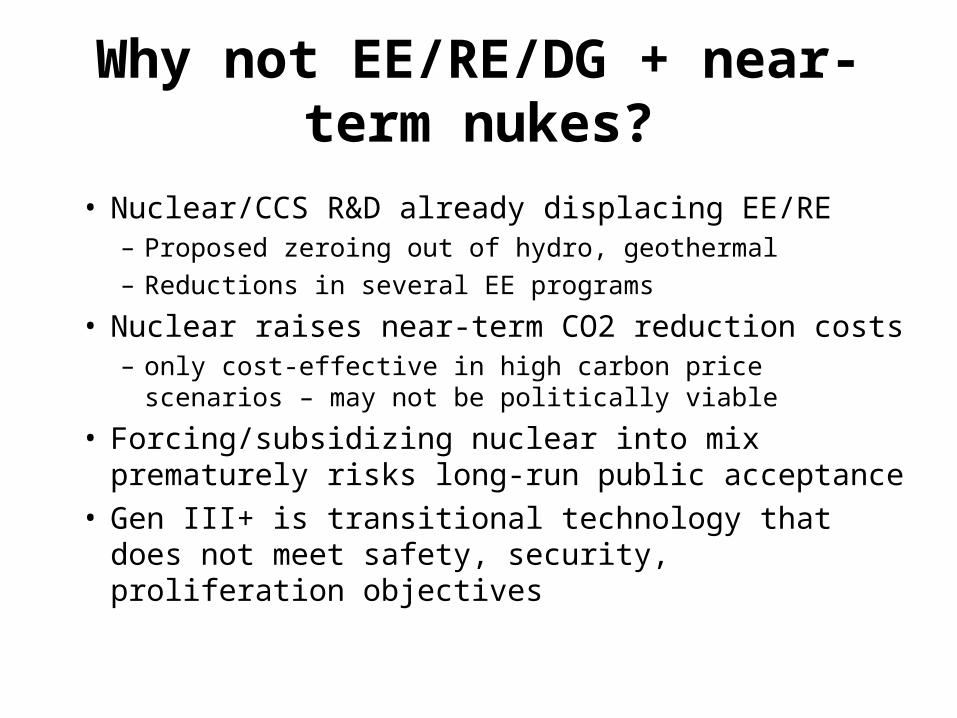
Why not EE/RE/DG + near-term nukes?
• Nuclear/CCS R&D already displacing EE/RE– Proposed zeroing out of hydro, geothermal– Reductions in several EE programs
• Nuclear raises near-term CO2 reduction costs– only cost-effective in high carbon price scenarios –
may not be politically viable
• Forcing/subsidizing nuclear into mix prematurely risks long-run public acceptance
• Gen III+ is transitional technology that does not meet safety, security, proliferation objectives
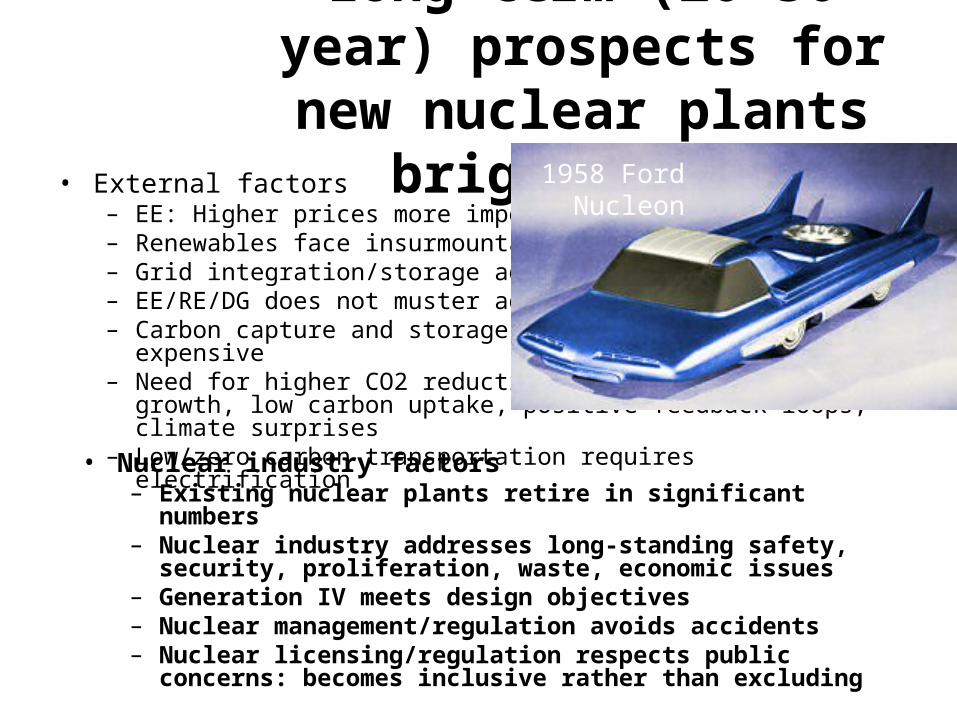
Long-term (20-30 year) prospects for new nuclear
plants brighten if…• External factors
– EE: Higher prices more important than lower bills– Renewables face insurmountable siting opposition– Grid integration/storage adds significant costs– EE/RE/DG does not muster adequate political support– Carbon capture and storage not feasible or very expensive– Need for higher CO2 reductions – high economic growth, low carbon
uptake, positive feedback loops, climate surprises– Low/zero carbon transportation requires electrification
1958 Ford Nucleon
• Nuclear industry factors– Existing nuclear plants retire in significant numbers– Nuclear industry addresses long-standing safety, security,
proliferation, waste, economic issues– Generation IV meets design objectives– Nuclear management/regulation avoids accidents– Nuclear licensing/regulation respects public concerns: becomes
inclusive rather than excluding

www.ucsusa.org

Extra slides
Existing nuclear plants are extremely profitable
• Consumers pay twice– First to original owners for “stranded
construction costs”– Second to new owners – single-price auction
pays everyone the price of the most expensive power plant in every hour
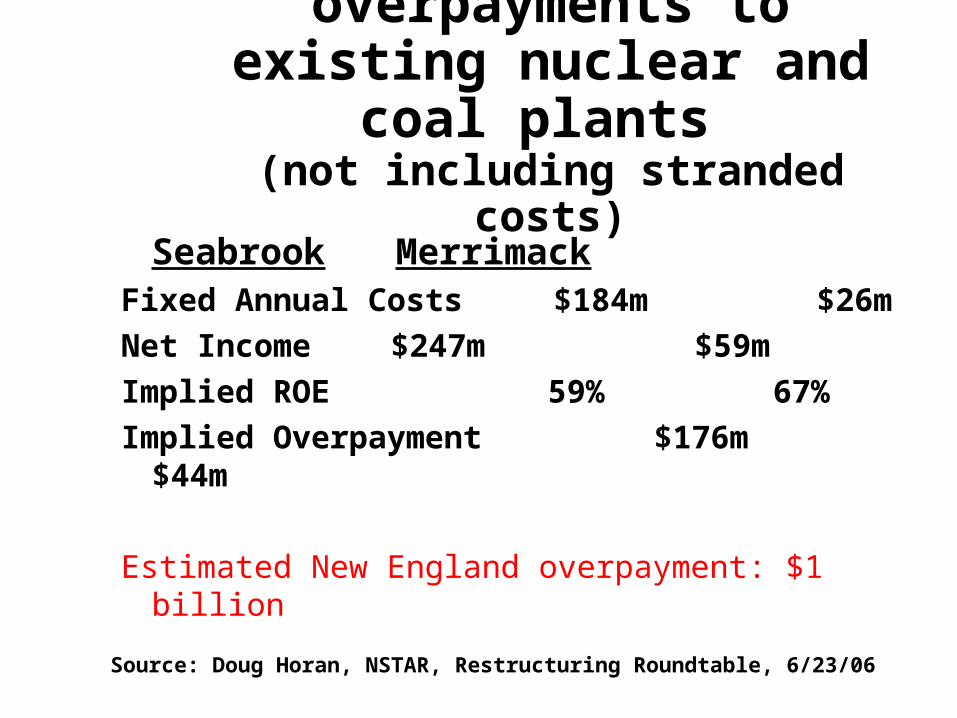
NSTAR estimates of overpayments to existing nuclear and coal plants (not including stranded costs)
Seabrook MerrimackFixed Annual Costs $184m $26m
Net Income $247m $59m
Implied ROE 59% 67%
Implied Overpayment $176m $44m
Estimated New England overpayment: $1 billion
Source: Doug Horan, NSTAR, Restructuring Roundtable, 6/23/06
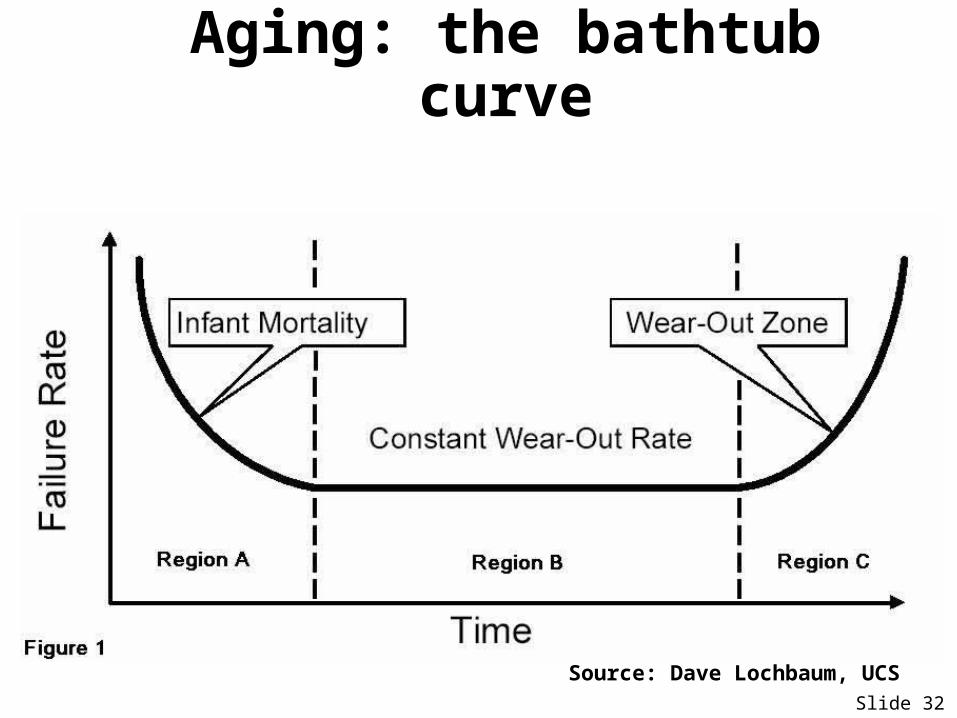
Aging: the bathtub curve
Slide 32
Source: Dave Lochbaum, UCS
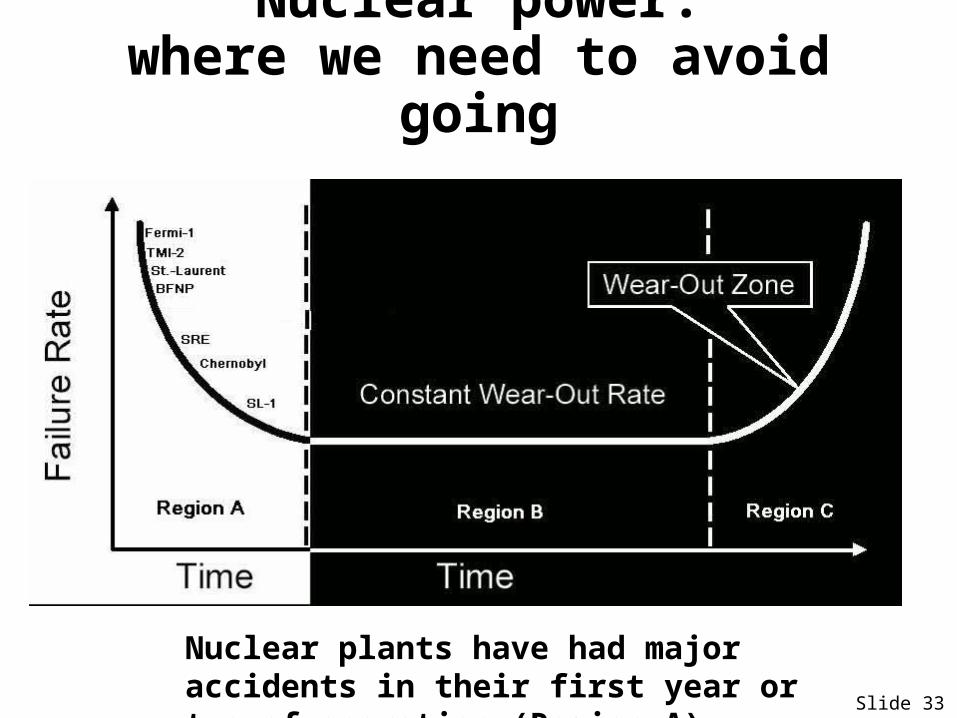
Nuclear power:where we need to avoid going
Slide 33
Nuclear plants have had major accidents in their first year or two of operation (Region A).
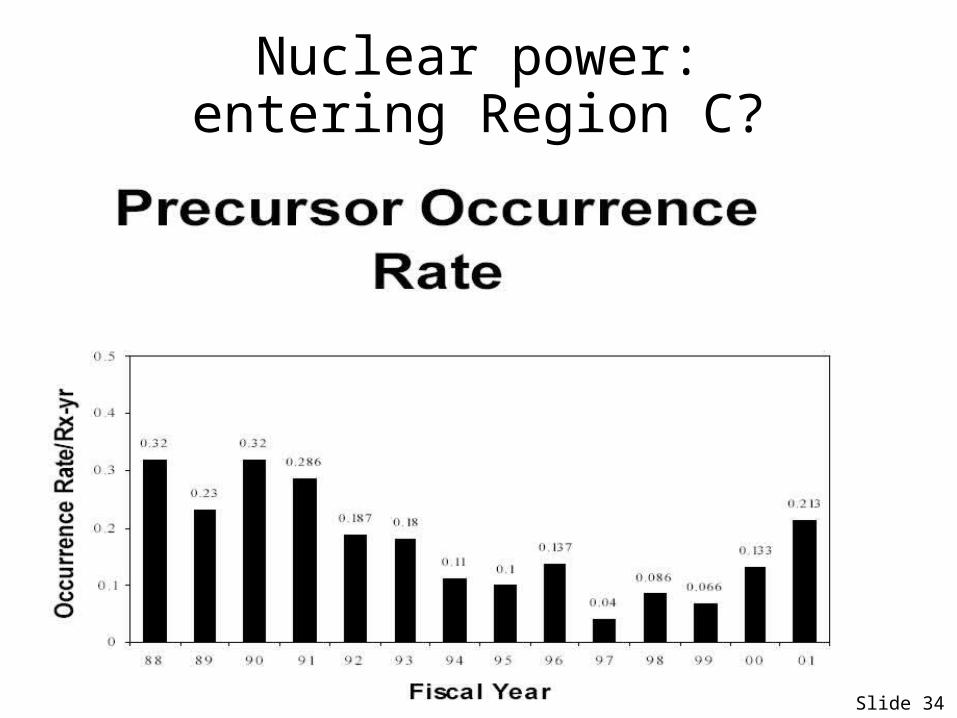
Nuclear power:entering Region C?
Slide 34
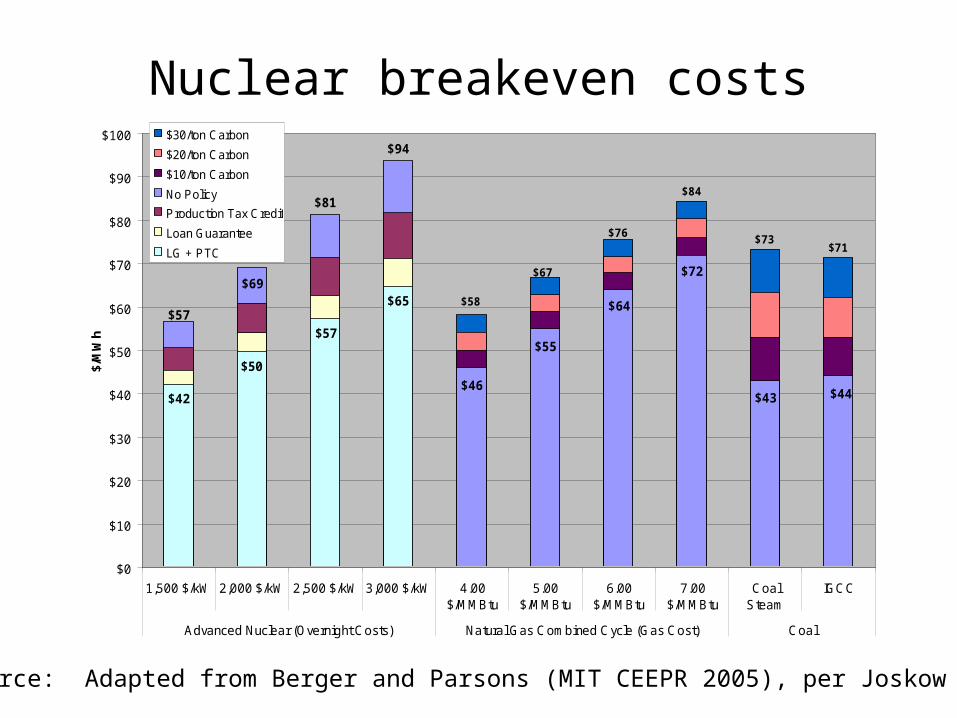
Nuclear breakeven costs
$84
$73$71
$81
$94
$76
$67
$58
$69
$57
$44$43
$72
$64
$55
$46
$65
$57
$50
$42
$0
$10
$20
$30
$40
$50
$60
$70
$80
$90
$100
1,500 $/kW 2,000 $/kW 2,500 $/kW 3,000 $/kW 4.00$/MMBtu
5.00$/MMBtu
6.00$/MMBtu
7.00$/MMBtu
CoalSteam
IGCC
Advanced Nuclear (Overnight Costs) Natural Gas Combined Cycle (Gas Cost) Coal
$/M
Wh
$30/ton Carbon
$20/ton Carbon
$10/ton Carbon
No Policy
Production Tax Credit
Loan Guarantee
LG + PTC
Source: Adapted from Berger and Parsons (MIT CEEPR 2005), per Joskow
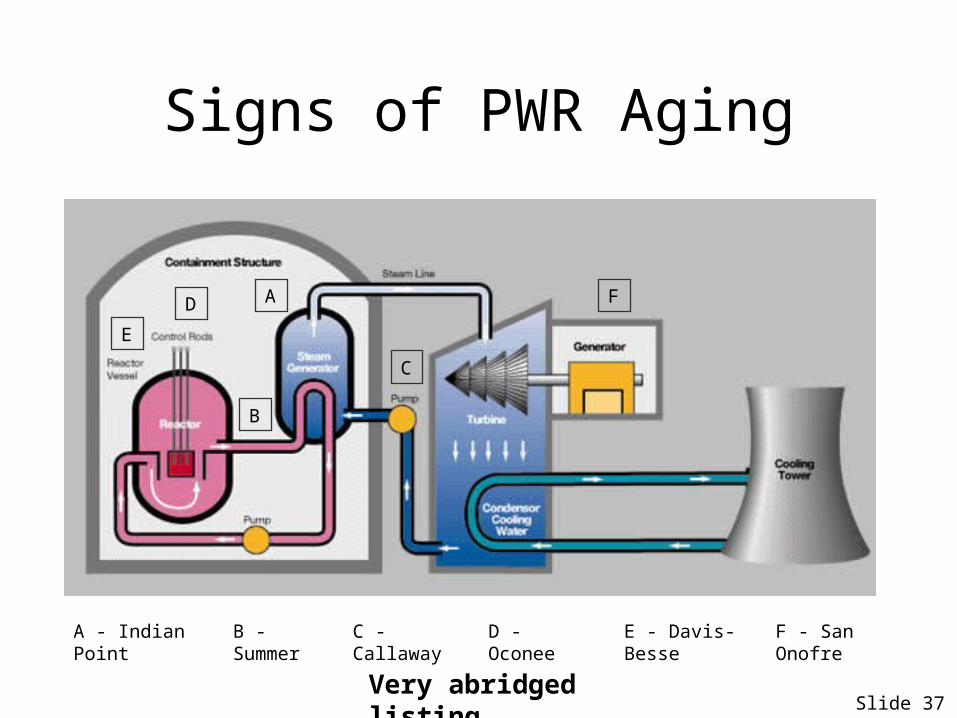
Signs of PWR Aging
Slide 37
A - Indian Point
A
B
C
D
E
B - Summer C - Callaway D - Oconee E - Davis-Besse
F
F - San Onofre
Very abridged listing
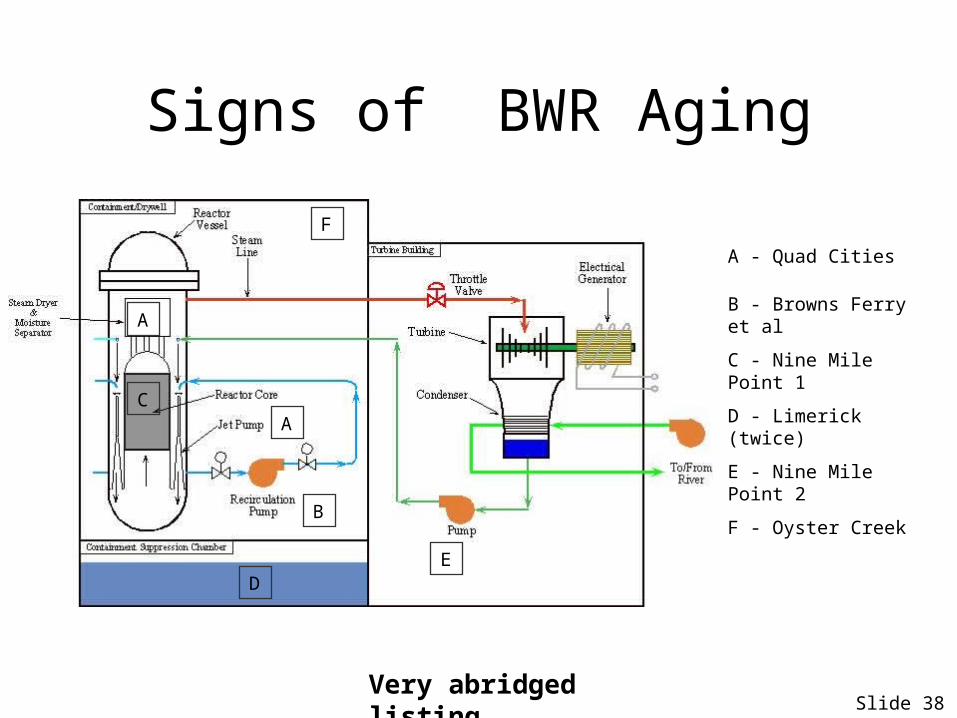
Signs of BWR Aging
Slide 38
A
B
C
DE
A - Quad Cities
B - Browns Ferry et al
C - Nine Mile Point 1
D - Limerick (twice)
E - Nine Mile Point 2
F
F - Oyster Creek
Very abridged listing
A
I. Fix the nuclear regulatory process:
risk management, generic safety issues
A. Risk Management• Plant owners should implement state-of-the-art methods to find and
fix errors of design, construction and operation at reactors and the NRC provide consistently effective oversight of those methods and their implementation.
• Risk-informed regulatory decision-making should be suspended until flaws in the plant risk studies they are based on are corrected.
B. Generic Safety Issues• Generic safety issues must be resolved in a timely manner and
accounted for as potential risk factors until resolved.
Slide 39
I. Fix the nuclear regulatory process: inspections
C. Inspections• Inspections of equipment outside the normal inspection scope must
be performed periodically to verify proper definition of the scope or to identify and correct definition errors before safety margins are compromised.
• Multiple inspection techniques of aging high-risk equipment must be used to provide better assurance that degradation will be detected and corrected.
• Reactors under construction must be subjected to extensive inspections to verify full compliance with safety regulations.
Slide 40
I. Fix the nuclear regulatory process: standards, safety
culture, security D. License extension standards• All of the differences between the regulatory requirements applicable to a
reactor and current regulatory requirements should be formally reviewed before any reactor is granted a 20-year license extension to verify that public health will be adequately protected.
E. Safety culture• The safety culture within the NRC must be monitored and restored to at
least the level the NRC, itself, deems minimally acceptable for operating nuclear plants.
F. Security• Adequate physical protection of nuclear plants against sabotage on both
sides of the Design Basis Threat level must be periodically demonstrated as well as the emergency response capability in event of a successful attack.
Slide 41
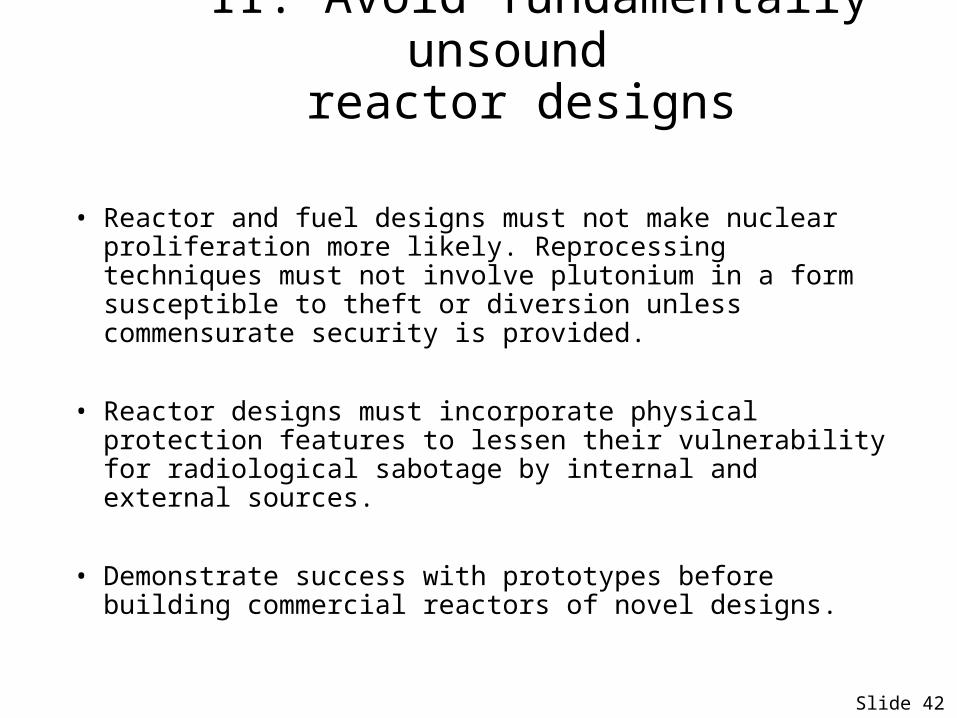
II. Avoid fundamentally unsound reactor designs
• Reactor and fuel designs must not make nuclear proliferation more likely. Reprocessing techniques must not involve plutonium in a form susceptible to theft or diversion unless commensurate security is provided.
• Reactor designs must incorporate physical protection features to lessen their vulnerability for radiological sabotage by internal and external sources.
• Demonstrate success with prototypes before building commercial reactors of novel designs.
Slide 42
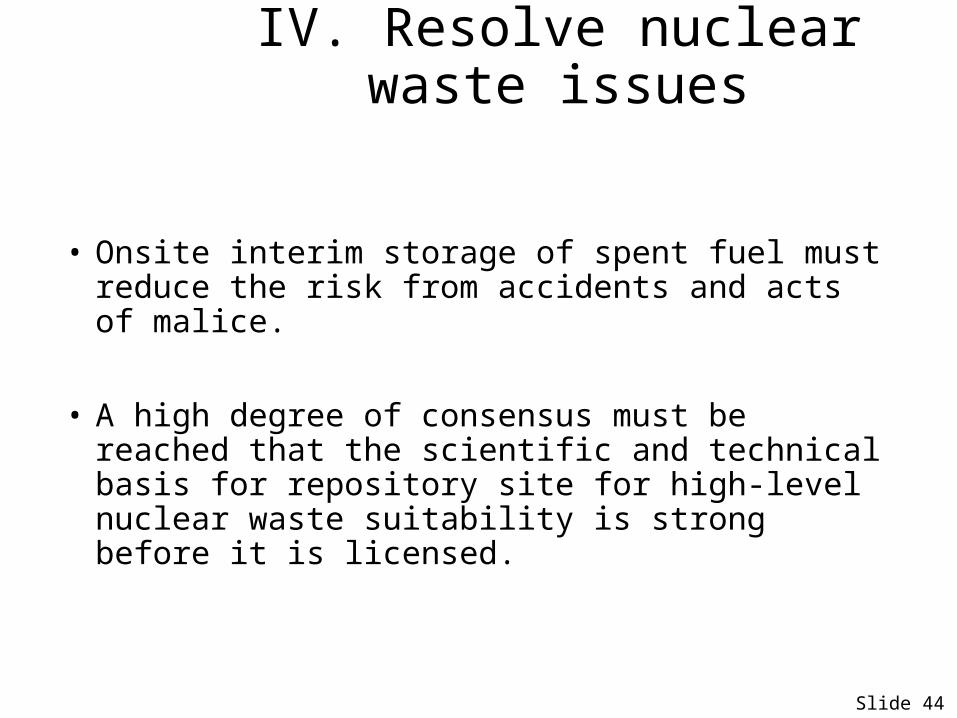
IV. Resolve nuclear waste issues
• Onsite interim storage of spent fuel must reduce the risk from accidents and acts of malice.
• A high degree of consensus must be reached that the scientific and technical basis for repository site for high-level nuclear waste suitability is strong before it is licensed.
Slide 44
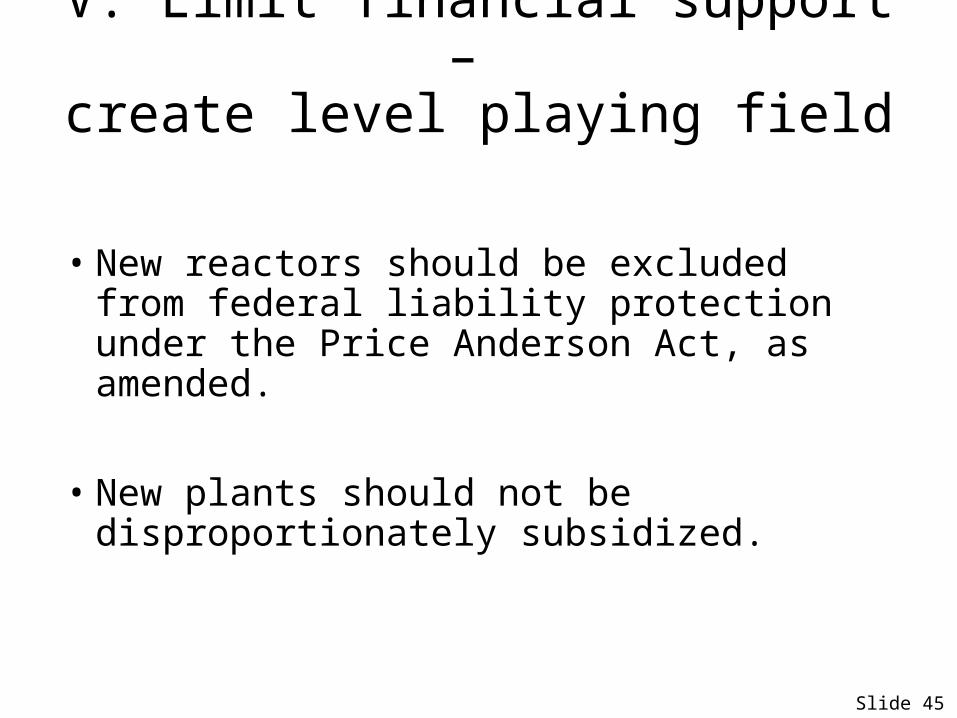
V. Limit financial support – create level playing field
• New reactors should be excluded from federal liability protection under the Price Anderson Act, as amended.
• New plants should not be disproportionately subsidized.
Slide 45
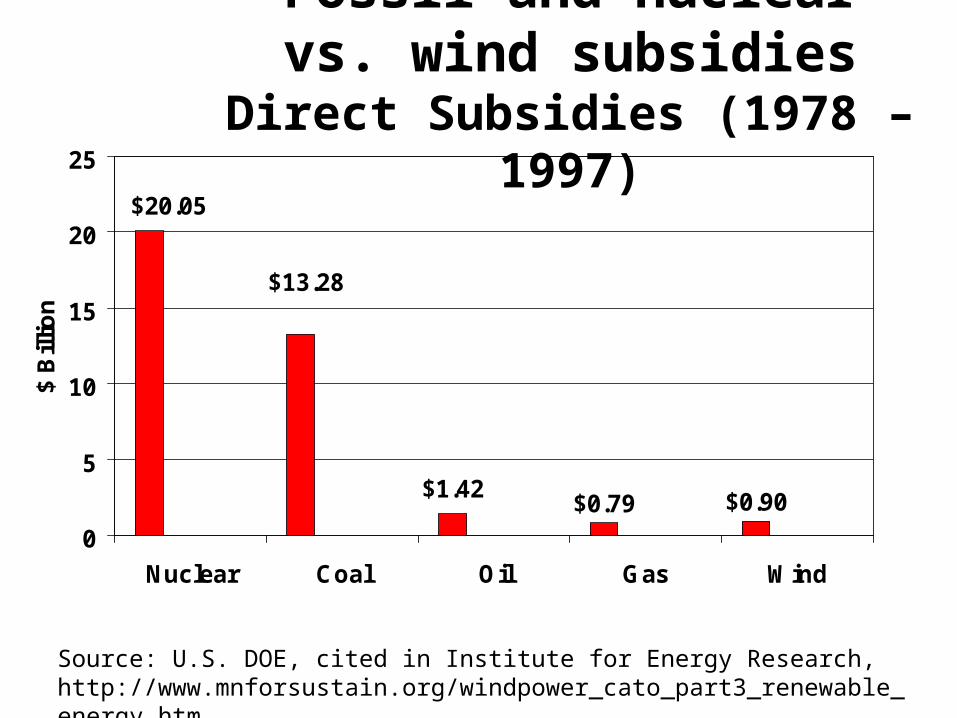
Fossil and nuclear vs. wind subsidies
Direct Subsidies (1978 – 1997)
$0.79 $0.90
$20.05
$13.28
$1.42
0
5
10
15
20
25
Nuclear Coal Oil Gas Wind
$ B
illio
n
Source: U.S. DOE, cited in Institute for Energy Research, http://www.mnforsustain.org/windpower_cato_part3_renewable_energy.htm
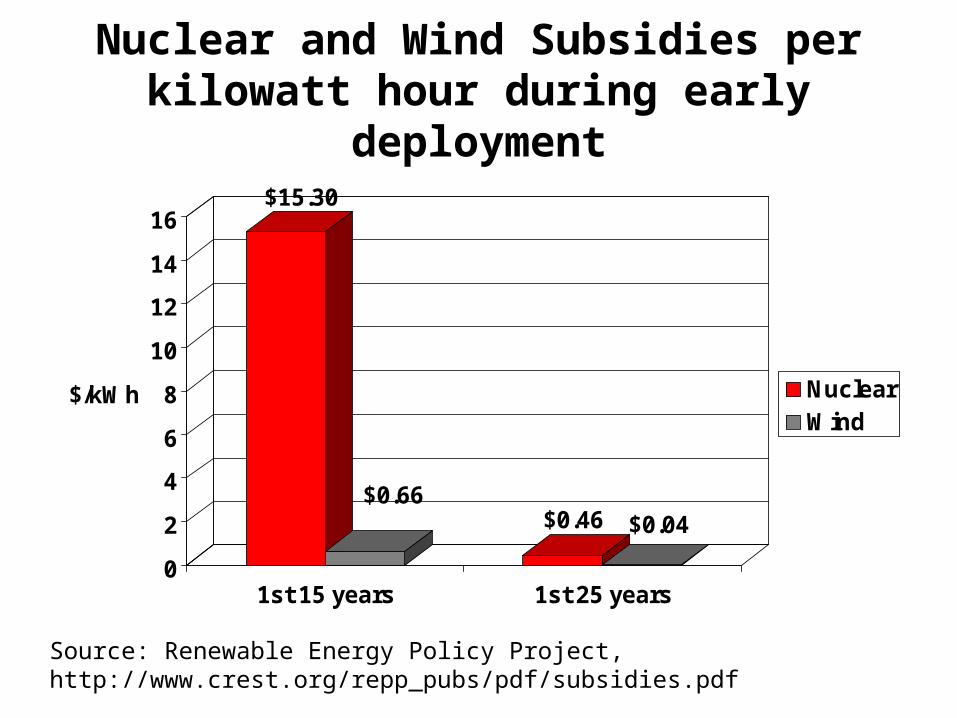
Nuclear and Wind Subsidies per kilowatt hour during early deployment
$15.30
$0.66$0.46 $0.04
0
2
4
6
8
10
12
14
16
$/kWh
1st 15 years 1st 25 years
NuclearWind
Source: Renewable Energy Policy Project, http://www.crest.org/repp_pubs/pdf/subsidies.pdf
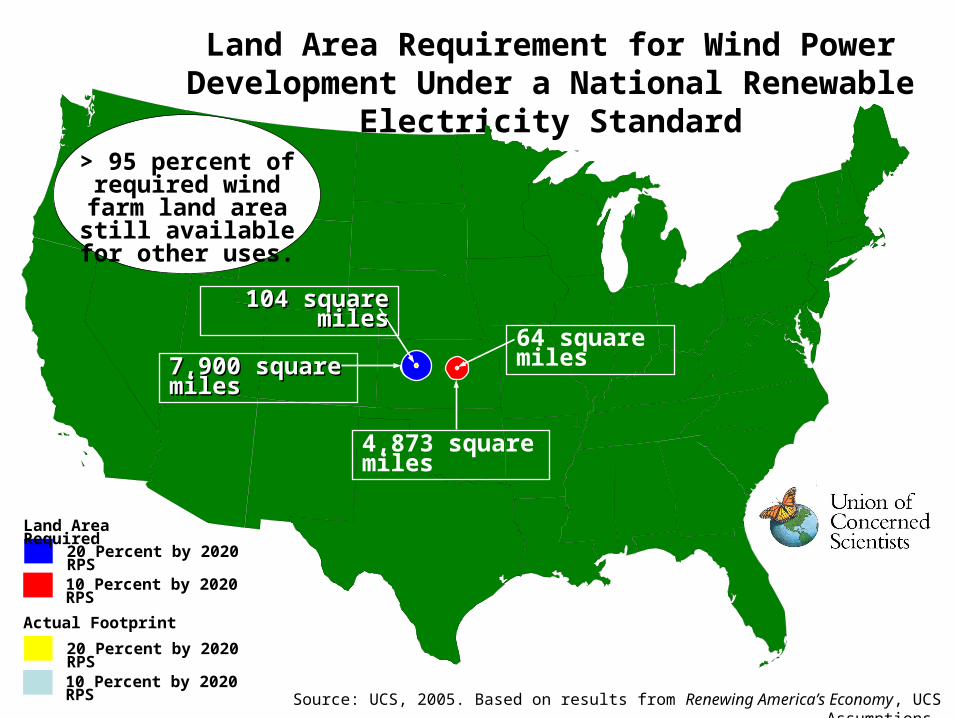
Land Area Requirement for Wind Power Development Under a National Renewable
Electricity Standard
20 Percent by 2020 RPS
10 Percent by 2020 RPS
Land Area Required
7,900 square 7,900 square milesmiles
104 square 104 square milesmiles
4,873 square miles
64 square miles
> 95 percent of required wind farm
land area still available for other
uses.
20 Percent by 2020 RPS
10 Percent by 2020 RPS
Actual Footprint
Source: UCS, 2005. Based on results from Renewing America’s Economy, UCS Assumptions.
New Nuclear Power and Climate Change:
Issues and Opportunities
Seth Kaplan
Clean Energy & Climate Change Director
Conservation Law Foundation
New Nuclear Power and Climate Change:
Issues and Opportunities
Ann Bisconti
President of Bisconti Research