Embed Size (px)
Citation preview
1Thailand CAON Presentation 07-03- 05 CK Copyright © 2005 Professor Michael E. Porter
Thailand’s Competitiveness:Where Does the Country Stand?
Professor Michael E. PorterInstitute for Strategy and Competitiveness
Harvard Business School
Bangkok, Thailand13 July 2005
This presentation draws on ideas from Professor Porter’s articles and books, in particular, The Competitive Advantage of Nations (The Free Press, 1990), “The Microeconomic Foundations of Economic Development,” in The Global Competitiveness Report 2004, (World Economic Forum, 2004), “Clusters and the New Competitive Agenda for Companies and Governments” in On Competition (Harvard Business School Press, 1998), and the Clusters of Innovation Initiative (www.compete.org), a joint effort of the Council on Competitiveness, Monitor Group, and Professor Porter. No part of this publication may be reproduced, stored in a retrieval system, or transmitted in any form or by any means - electronic, mechanical, photocopying, recording, or otherwise - without the permission of Michael E. Porter.Additional information may be found at the website of the Institute for Strategy and Competitiveness, www.isc.hbs.edu
2Thailand CAON Presentation 07-03- 05 CK Copyright © 2005 Professor Michael E. Porter
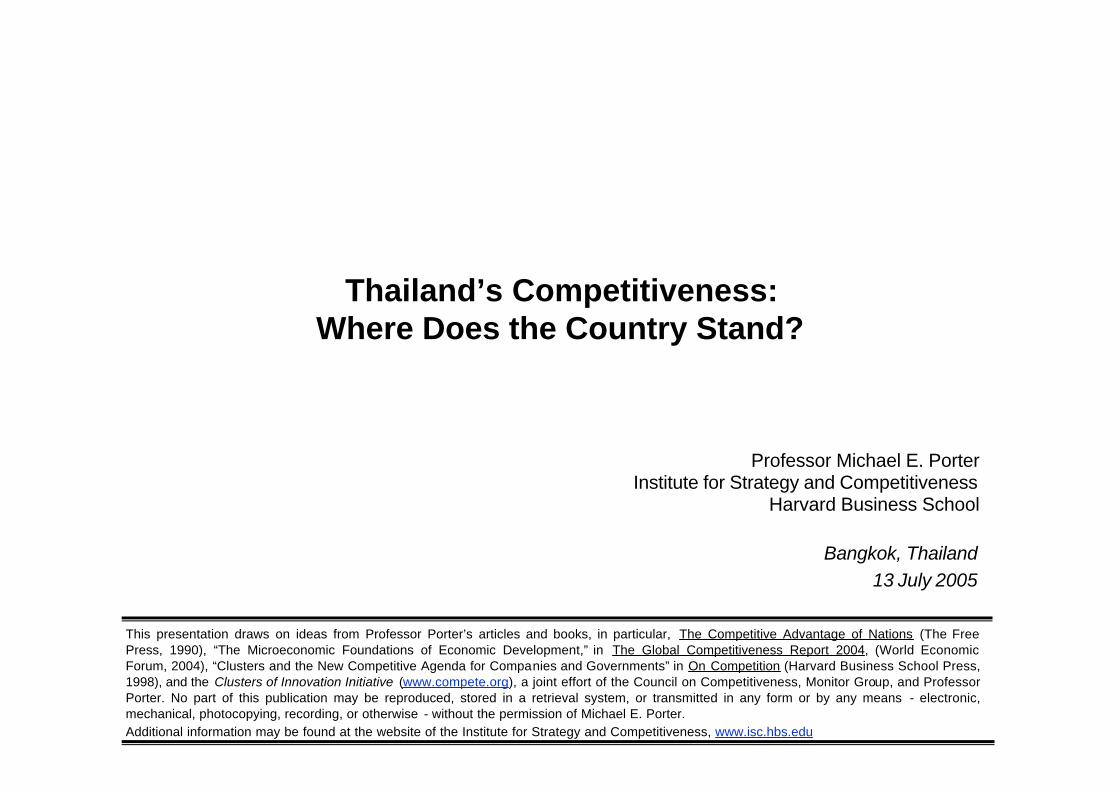
Perspectives on Firm Success
InternalInternalInternal ExternalExternalExternal
• Competitive advantage resides solely inside a company or in its industry
• Competitive success depends primarily on company choices
• Competitive advantage (or disadvantage) resides partly in the locations at which a company’s business units are based
• Cluster participation is an important contributor to competitiveness
3Thailand CAON Presentation 07-03- 05 CK Copyright © 2005 Professor Michael E. Porter
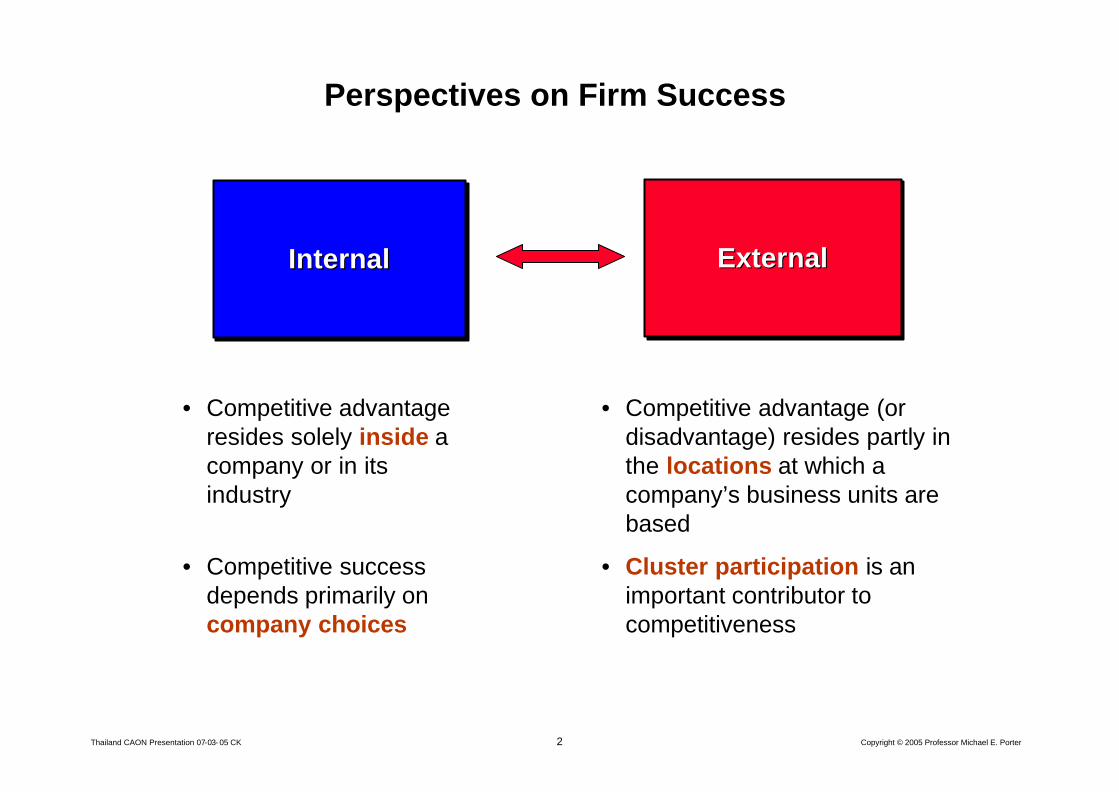
Comparative Economic PerformanceReal GDP Growth Rates
-15%
-10%
-5%
0%
5%
10%
15%
20%
1990 1991 1992 1993 1994 1995 1996 1997 1998 1999 2000 2001 2002 2003
CHINA
MYANMAR
VIETNAM
CAMBODIA
LAOS
INDIA
BANGLADESH
MALAYSIA
THAILAND
PHILIPPINES
PAKISTAN
HONG KONG
NEW ZEALAND
SRI LANKA
SINGAPORE
INDONESIA
TAIWAN
JAPAN
PAPUA NEW GUINEA
Source: EIU (2004)
Countries sorted by 1998-2003 annual real GDP growth rate (CAGR)
Annual growth rateof real GDP
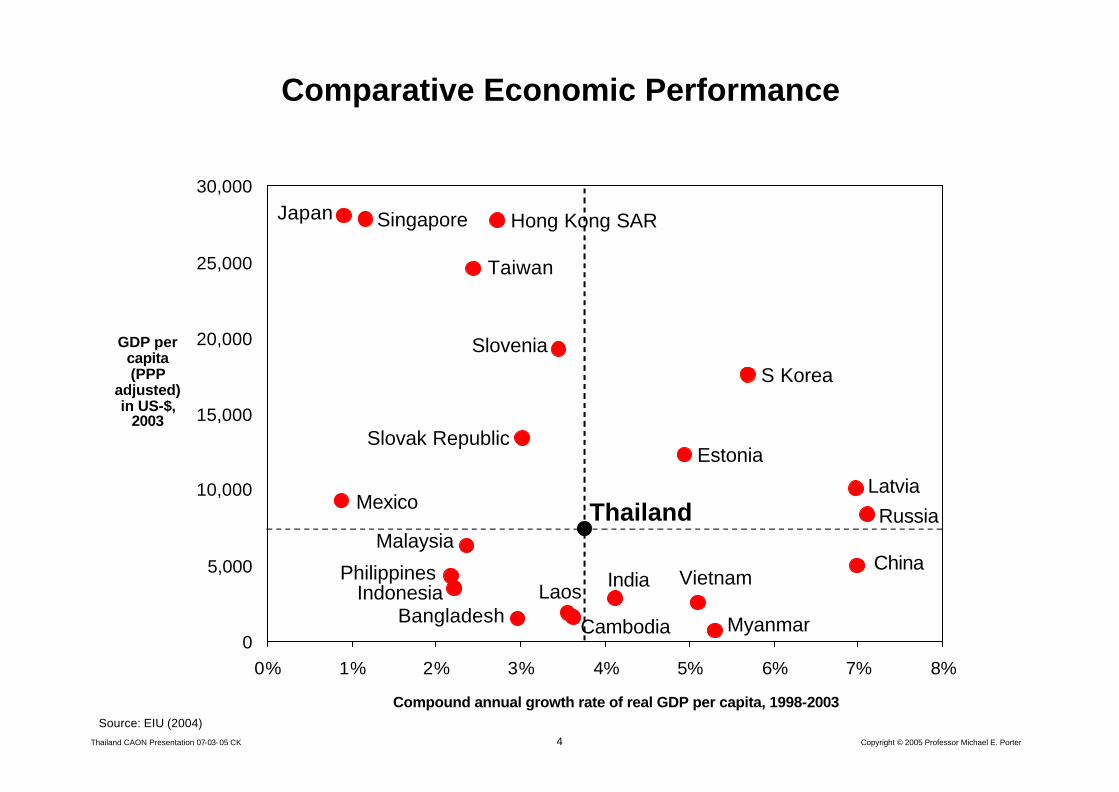
4Thailand CAON Presentation 07-03- 05 CK Copyright © 2005 Professor Michael E. Porter
0
5,000
10,000
15,000
20,000
25,000
30,000
0% 1% 2% 3% 4% 5% 6% 7% 8%
Comparative Economic Performance
Compound annual growth rate of real GDP per capita, 1998-2003
GDP per capita (PPP
adjusted) in US-$,
2003
Source: EIU (2004)
Vietnam
Japan
Thailand
S Korea
Indonesia
Malaysia
LaosPhilippines
Taiwan
Bangladesh
China
Hong Kong SAR
India
Myanmar
Singapore
Cambodia
Estonia
Latvia
Slovenia
Slovak Republic
RussiaMexico
5Thailand CAON Presentation 07-03- 05 CK Copyright © 2005 Professor Michael E. Porter
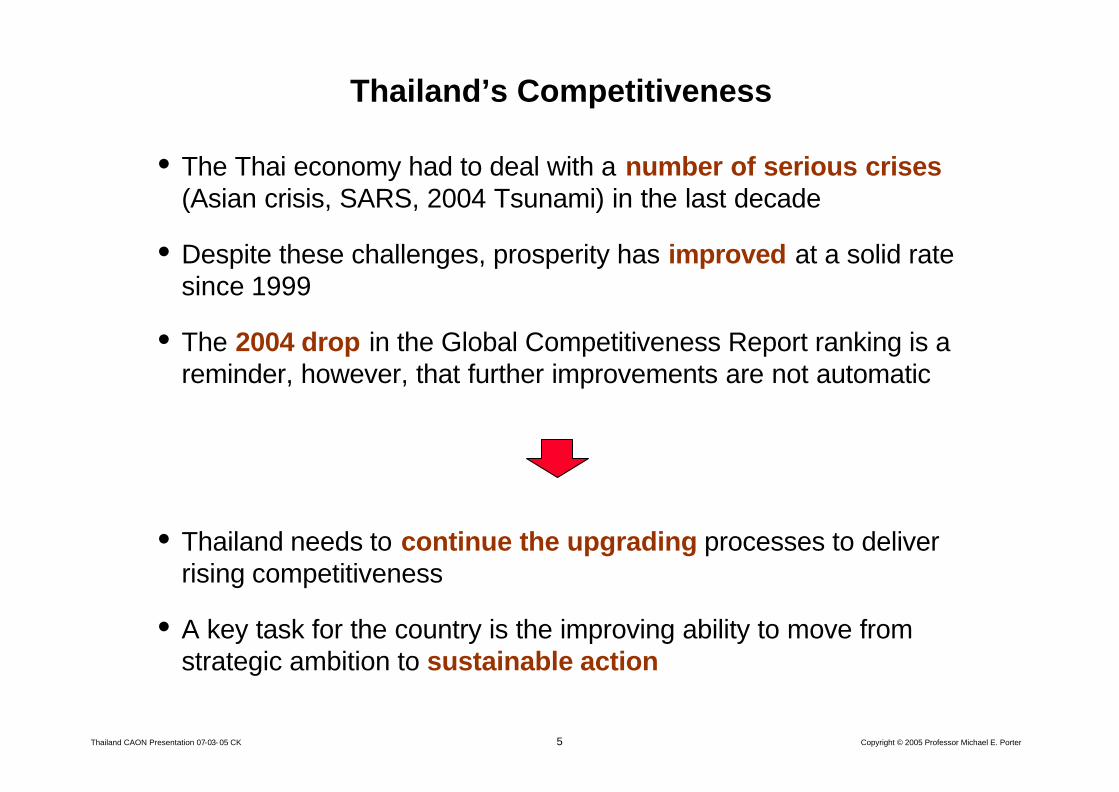
Thailand’s Competitiveness
• The Thai economy had to deal with a number of serious crises(Asian crisis, SARS, 2004 Tsunami) in the last decade
• Despite these challenges, prosperity has improved at a solid rate since 1999
• The 2004 drop in the Global Competitiveness Report ranking is a reminder, however, that further improvements are not automatic
• Thailand needs to continue the upgrading processes to deliver rising competitiveness
• A key task for the country is the improving ability to move fromstrategic ambition to sustainable action
6Thailand CAON Presentation 07-03- 05 CK Copyright © 2005 Professor Michael E. Porter
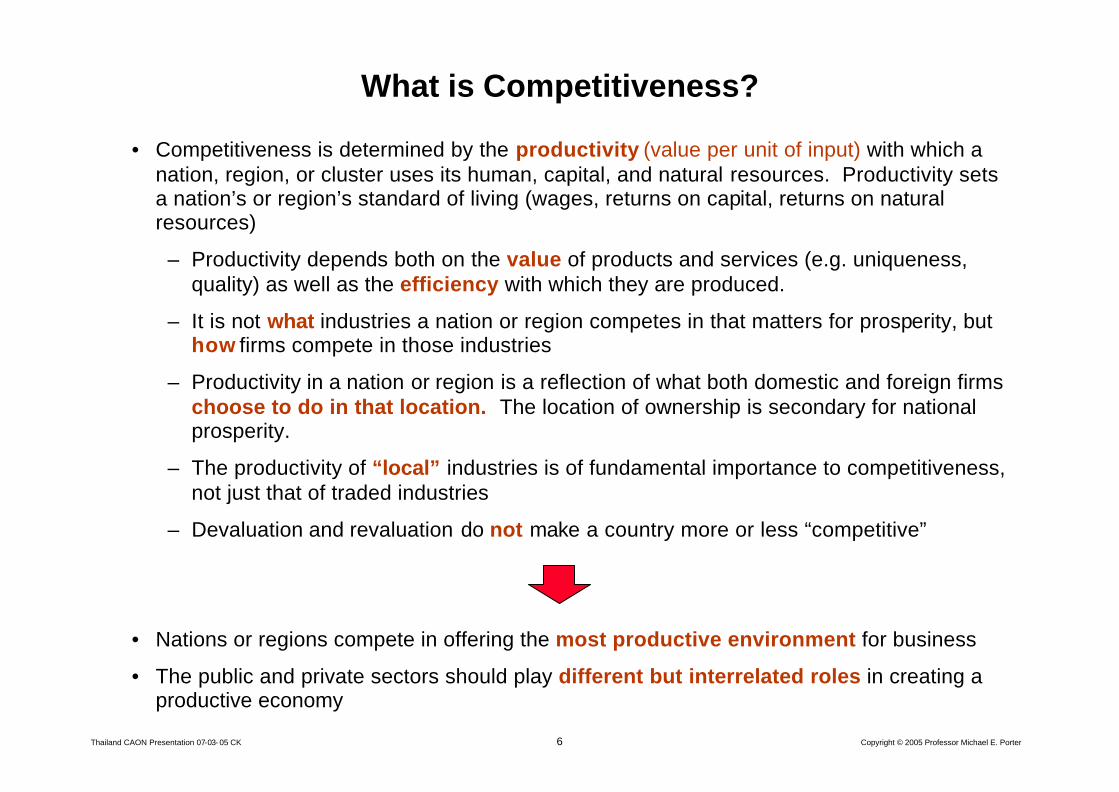
• Competitiveness is determined by the productivity (value per unit of input) with which a nation, region, or cluster uses its human, capital, and natural resources. Productivity sets a nation’s or region’s standard of living (wages, returns on capital, returns on natural resources)
– Productivity depends both on the value of products and services (e.g. uniqueness, quality) as well as the efficiency with which they are produced.
– It is not what industries a nation or region competes in that matters for prosperity, buthow firms compete in those industries
– Productivity in a nation or region is a reflection of what both domestic and foreign firms choose to do in that location. The location of ownership is secondary for national prosperity.
– The productivity of “local” industries is of fundamental importance to competitiveness, not just that of traded industries
– Devaluation and revaluation do not make a country more or less “competitive”
• Nations or regions compete in offering the most productive environment for business
• The public and private sectors should play different but interrelated roles in creating a productive economy
What is Competitiveness?
7Thailand CAON Presentation 07-03- 05 CK Copyright © 2005 Professor Michael E. Porter
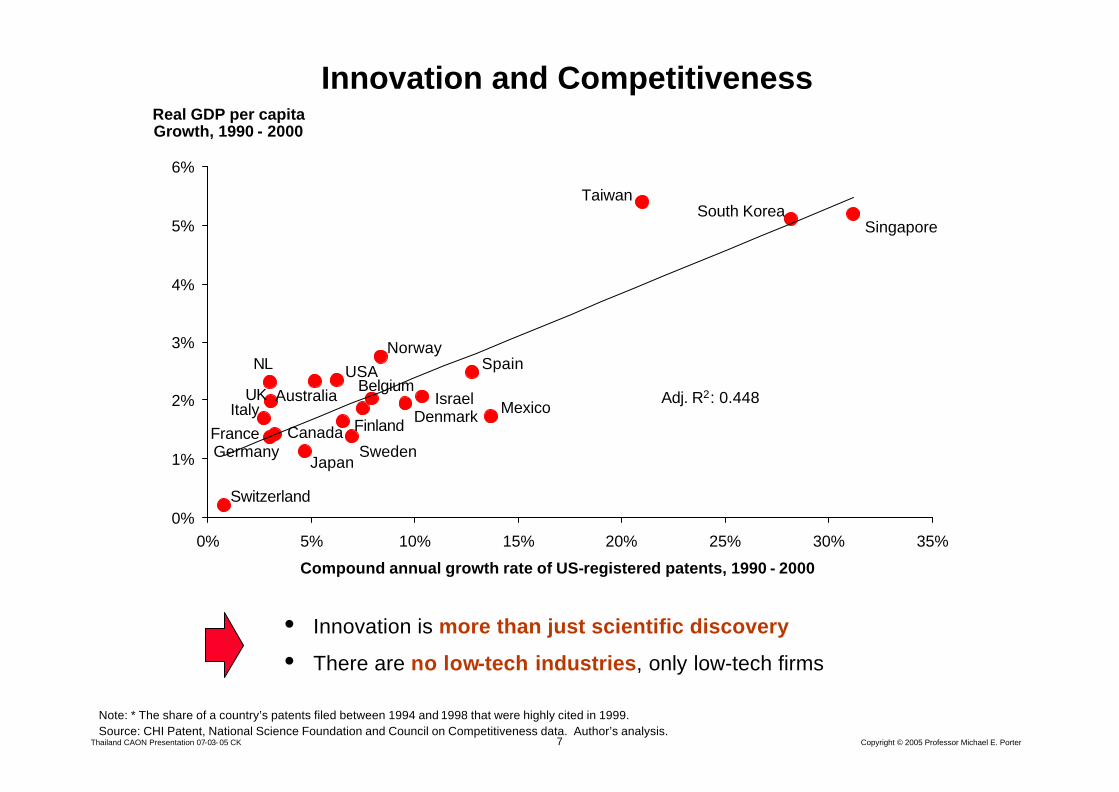
0%
1%
2%
3%
4%
5%
6%
0% 5% 10% 15% 20% 25% 30% 35%
USA
Germany SwedenCanada
Japan
Italy
South Korea
Israel
NL
Innovation and Competitiveness
Switzerland
Singapore
Norway
Finland Denmark
Real GDP per capita Growth, 1990 - 2000
Source: CHI Patent, National Science Foundation and Council on Competitiveness data. Author’s analysis.Note: * The share of a country’s patents filed between 1994 and 1998 that were highly cited in 1999.
Mexico
Spain
Taiwan
Compound annual growth rate of US-registered patents, 1990 - 2000
AustraliaBelgium
France
UK Adj. R2: 0.448
• Innovation is more than just scientific discovery
• There are no low-tech industries, only low-tech firms
8Thailand CAON Presentation 07-03- 05 CK Copyright © 2005 Professor Michael E. Porter
Microeconomic FoundationsMicroeconomic Foundations
The Quality of the Microeconomic
BusinessEnvironment
The Quality of the The Quality of the MicroeconomicMicroeconomic
BusinessBusinessEnvironmentEnvironment
The Sophisticationof Company
Operations andStrategy
The SophisticationThe Sophisticationof Companyof Company
Operations andOperations andStrategyStrategy
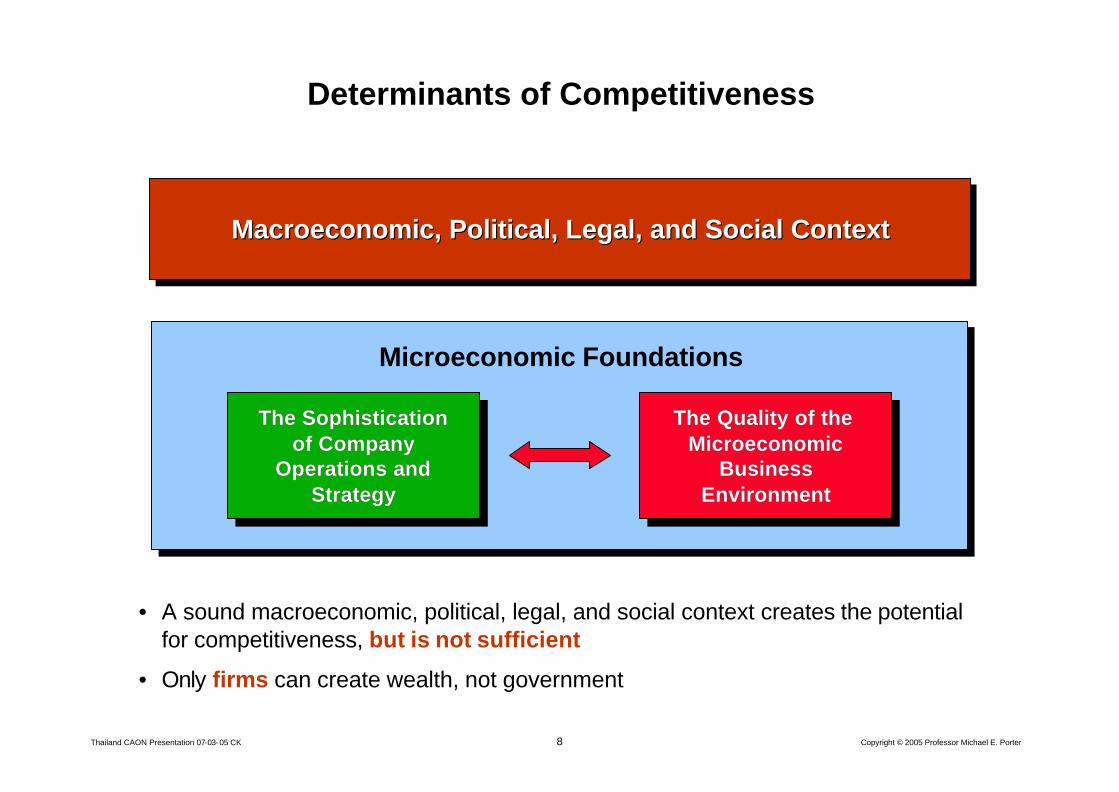
Determinants of Competitiveness
Macroeconomic, Political, Legal, and Social ContextMacroeconomic, Political, Legal, and Social ContextMacroeconomic, Political, Legal, and Social Context
• A sound macroeconomic, political, legal, and social context creates the potential for competitiveness, but is not sufficient
• Only firms can create wealth, not government
9Thailand CAON Presentation 07-03- 05 CK Copyright © 2005 Professor Michael E. Porter
0
5,000
10,000
15,000
20,000
25,000
30,000
35,000
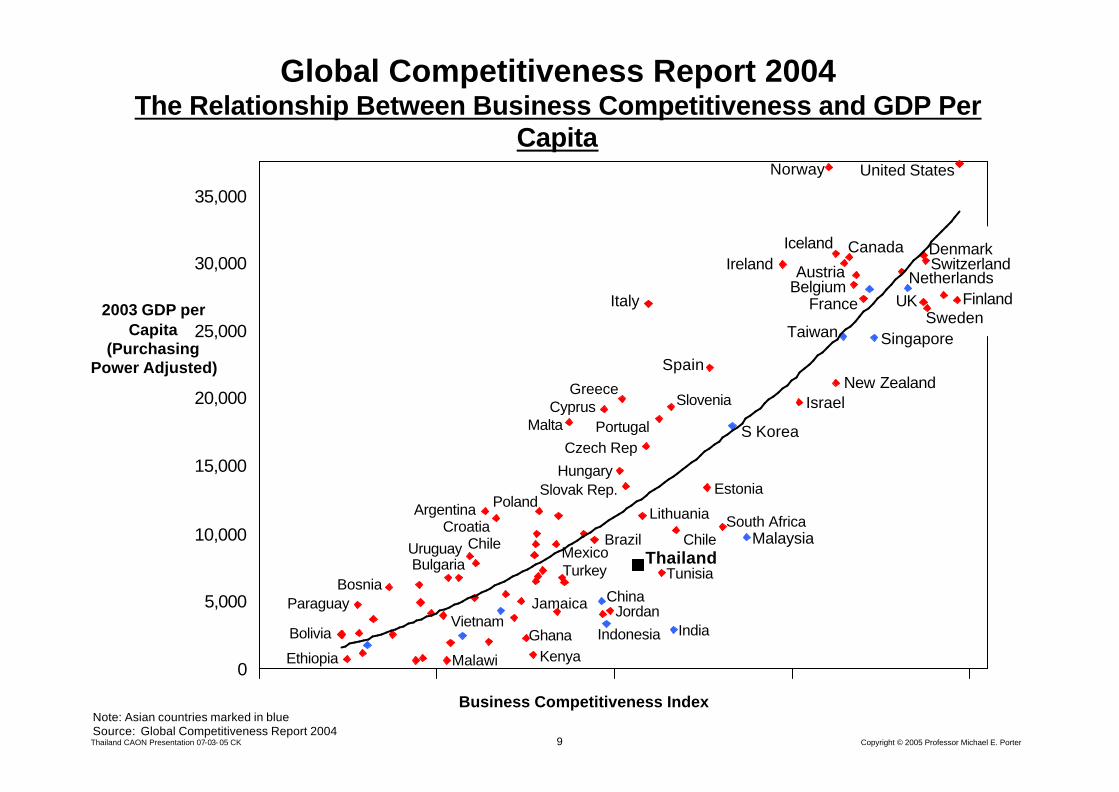
Global Competitiveness Report 2004The Relationship Between Business Competitiveness and GDP Per
CapitaUnited States
Switzerland
UK
Denmark
Singapore
New Zealand
Taiwan
Norway
IcelandIreland
GreeceIsrael
Italy
S Korea
Hungary
India
Netherlands
Spain
Czech RepPortugal
Business Competitiveness Index
2003 GDP per Capita
(Purchasing Power Adjusted)
Brazil Malaysia
China
Chile
VietnamJordan
Uruguay
ArgentinaSouth Africa
Note: Asian countries marked in blueSource: Global Competitiveness Report 2004
Estonia
Indonesia
Sweden
Malta
Kenya
Austria
Paraguay
Croatia
Slovak Rep.
Tunisia
PolandLithuania
Bulgaria
Canada
France FinlandBelgium
Cyprus Slovenia
Chile
Ghana
Ethiopia
Bolivia
Malawi
TurkeyMexico
JamaicaBosnia
Thailand
10Thailand CAON Presentation 07-03- 05 CK Copyright © 2005 Professor Michael E. Porter
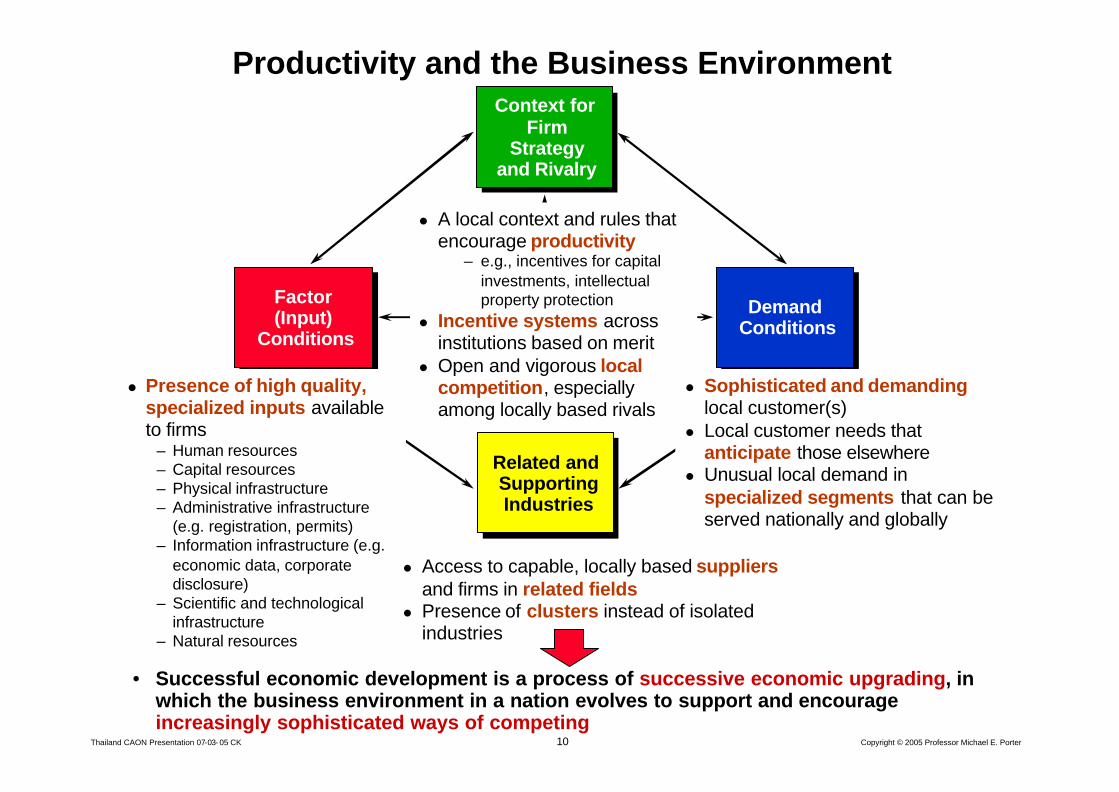
Context for Firm
Strategy and Rivalry
Context for Firm
Strategy and Rivalry
Related and Supporting Industries
Related and Supporting Industries
Factor(Input)
Conditions
Factor(Input)
ConditionsDemand
ConditionsDemand
Conditions
l Presence of high quality, specialized inputs available to firms
– Human resources– Capital resources– Physical infrastructure– Administrative infrastructure
(e.g. registration, permits)– Information infrastructure (e.g.
economic data, corporate disclosure)
– Scientific and technological infrastructure
– Natural resources
l Access to capable, locally based suppliersand firms in related fields
l Presence of clusters instead of isolated industries
l A local context and rules that encourage productivity
– e.g., incentives for capital investments, intellectual property protection
l Incentive systems across institutions based on merit
l Open and vigorous local competition, especially among locally based rivals
l Sophisticated and demandinglocal customer(s)
l Local customer needs that anticipate those elsewhere
l Unusual local demand in specialized segments that can be served nationally and globally
Productivity and the Business Environment
• Successful economic development is a process of successive economic upgrading, in which the business environment in a nation evolves to support and encourage increasingly sophisticated ways of competing
11Thailand CAON Presentation 07-03- 05 CK Copyright © 2005 Professor Michael E. Porter
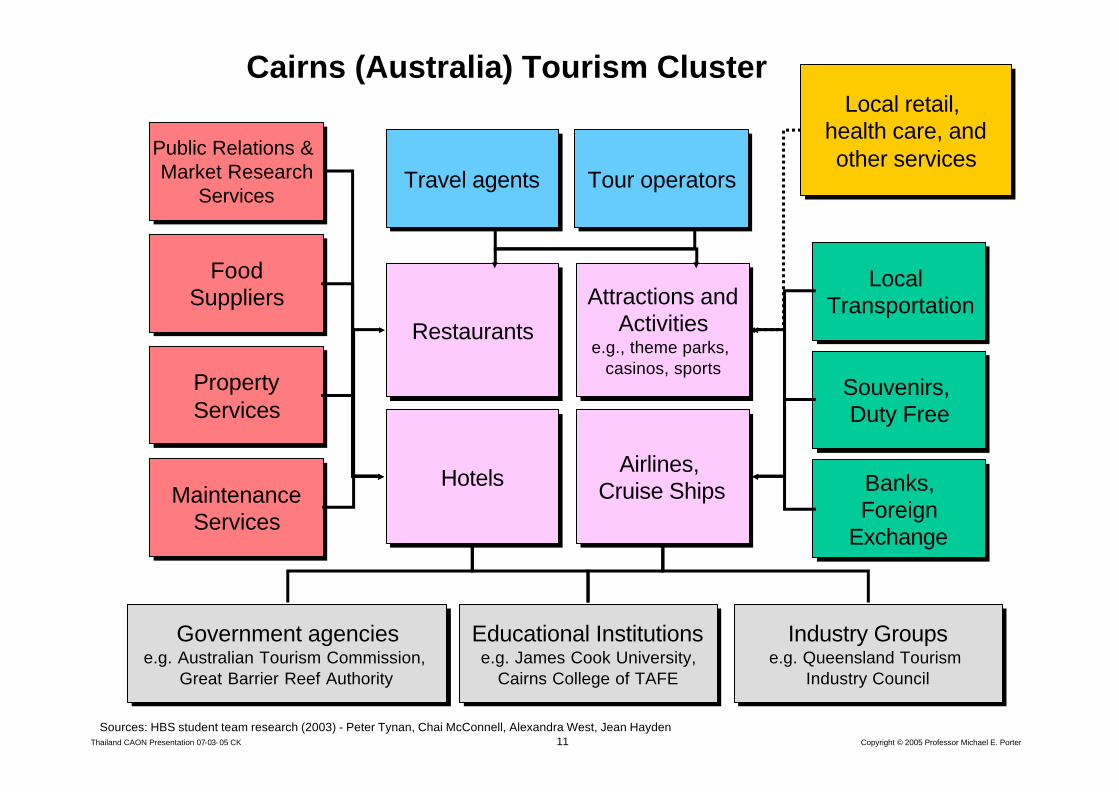
Cairns (Australia) Tourism Cluster
Sources: HBS student team research (2003) - Peter Tynan, Chai McConnell, Alexandra West, Jean Hayden
HotelsHotels
Attractions andActivities
e.g., theme parks, casinos, sports
Attractions andActivities
e.g., theme parks, casinos, sports
Airlines, Cruise Ships
Airlines, Cruise Ships
Travel agentsTravel agents Tour operatorsTour operators
RestaurantsRestaurants
PropertyServicesPropertyServices
Souvenirs, Duty Free
Souvenirs, Duty Free
Banks,Foreign
Exchange
Banks,Foreign
Exchange
Local Transportation
Local Transportation
MaintenanceServices
MaintenanceServices
Government agenciese.g. Australian Tourism Commission,
Great Barrier Reef Authority
Government agenciese.g. Australian Tourism Commission,
Great Barrier Reef Authority
Educational Institutionse.g. James Cook University,
Cairns College of TAFE
Educational Institutionse.g. James Cook University,
Cairns College of TAFE
Industry Groupse.g. Queensland Tourism
Industry Council
Industry Groupse.g. Queensland Tourism
Industry Council
FoodSuppliers
FoodSuppliers
Public Relations & Market Research
Services
Public Relations & Market Research
Services
Local retail, health care, andother services
Local retail, health care, andother services
12Thailand CAON Presentation 07-03- 05 CK Copyright © 2005 Professor Michael E. Porter
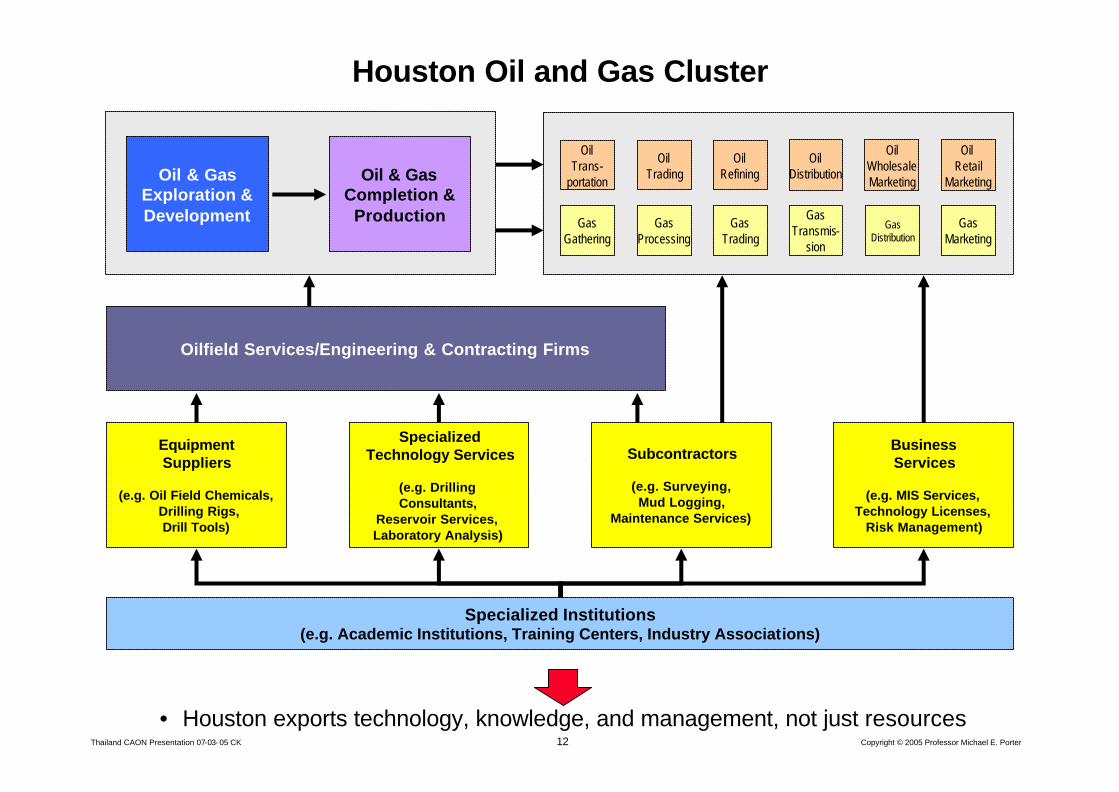
Houston Oil and Gas Cluster
• Houston exports technology, knowledge, and management, not just resources
Equipment Suppliers
(e.g. Oil Field Chemicals,Drilling Rigs, Drill Tools)
GasProcessing
GasTrading
GasTransmis-
sion
GasDistribution
GasMarketing
Oil & Gas Completion &
Production
Oil & GasExploration & Development
Oilfield Services/Engineering & Contracting Firms
OilRefining
OilDistribution
OilWholesaleMarketing
Oil Retail
Marketing
SpecializedTechnology Services
(e.g. Drilling Consultants,
Reservoir Services, Laboratory Analysis)
Subcontractors
(e.g. Surveying,Mud Logging,
Maintenance Services)
BusinessServices
(e.g. MIS Services,Technology Licenses,
Risk Management)
OilTrading
OilTrans-
portation
GasGathering
Specialized Institutions (e.g. Academic Institutions, Training Centers, Industry Associations)
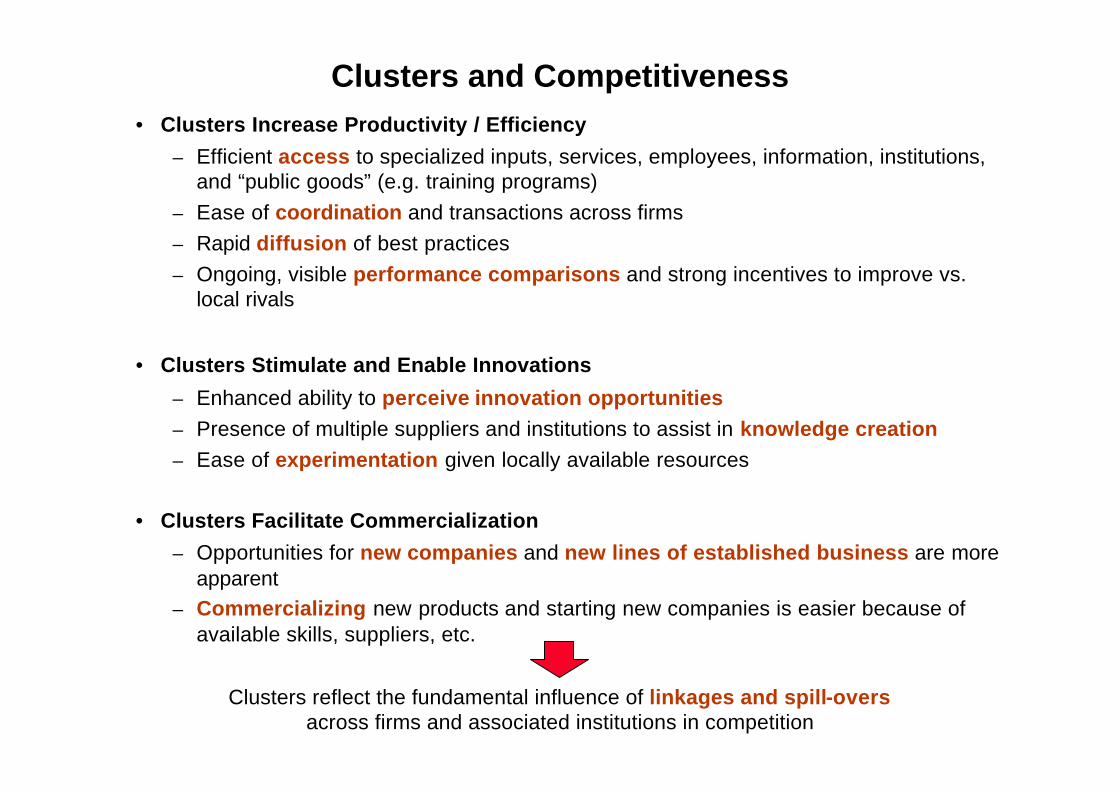
Clusters and Competitiveness• Clusters Increase Productivity / Efficiency
– Efficient access to specialized inputs, services, employees, information, institutions, and “public goods” (e.g. training programs)
– Ease of coordination and transactions across firms– Rapid diffusion of best practices– Ongoing, visible performance comparisons and strong incentives to improve vs.
local rivals
• Clusters Stimulate and Enable Innovations
– Enhanced ability to perceive innovation opportunities– Presence of multiple suppliers and institutions to assist in knowledge creation– Ease of experimentation given locally available resources
• Clusters Facilitate Commercialization
– Opportunities for new companies and new lines of established business are more apparent
– Commercializing new products and starting new companies is easier because of available skills, suppliers, etc.
Clusters reflect the fundamental influence of linkages and spill-oversacross firms and associated institutions in competition
14Thailand CAON Presentation 07-03- 05 CK Copyright © 2005 Professor Michael E. Porter
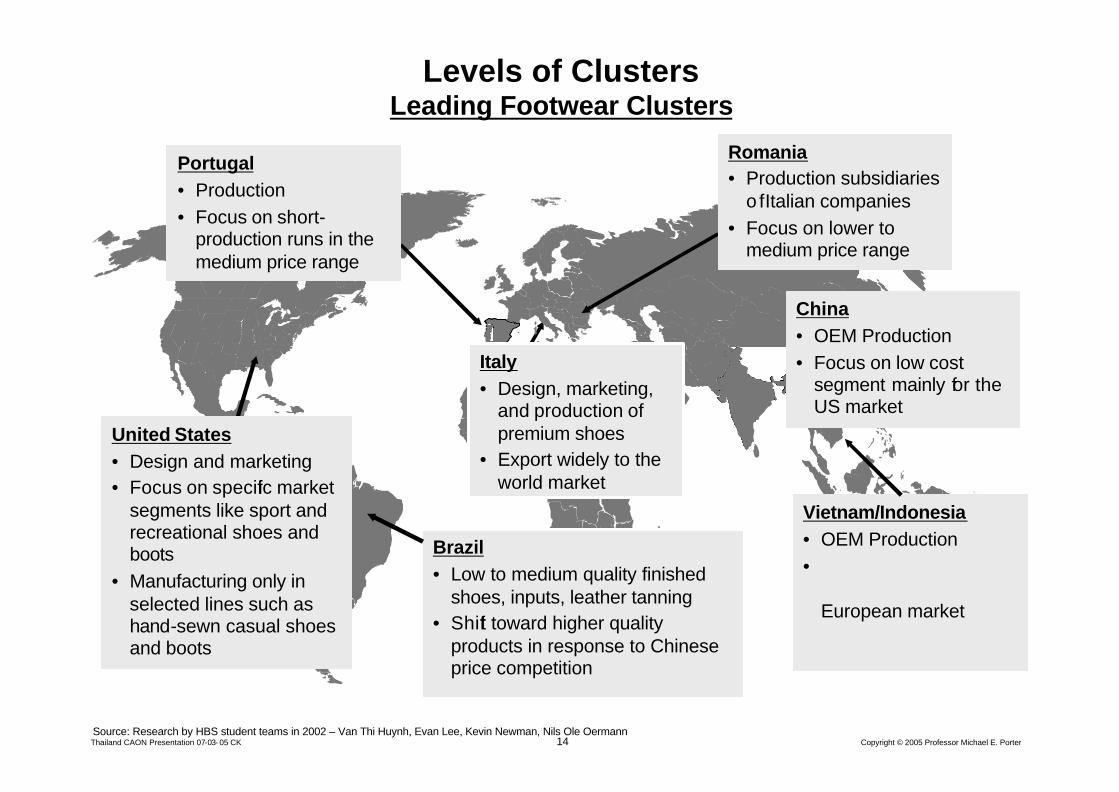
Levels of ClustersLeading Footwear Clusters
Vietnam/Indonesia• OEM Production •
European market
China• OEM Production• Focus on low cost
segment mainly for the US market
Portugal• Production • Focus on short-
production runs in the medium price range
Romania• Production subsidiaries
o f Italian companies• Focus on lower to
medium price range
United States• Design and marketing • Focus on specific market
segments like sport and recreational shoes and boots
• Manufacturing only in selected lines such as hand-sewn casual shoes and boots
Source: Research by HBS student teams in 2002 – Van Thi Huynh, Evan Lee, Kevin Newman, Nils Ole Oermann
Italy• Design, marketing,
and production of premium shoes
• Export widely to the world market
Brazil• Low to medium quality finished
shoes, inputs, leather tanning• Shift toward higher quality
products in response to Chinese price competition
15Thailand CAON Presentation 07-03- 05 CK Copyright © 2005 Professor Michael E. Porter
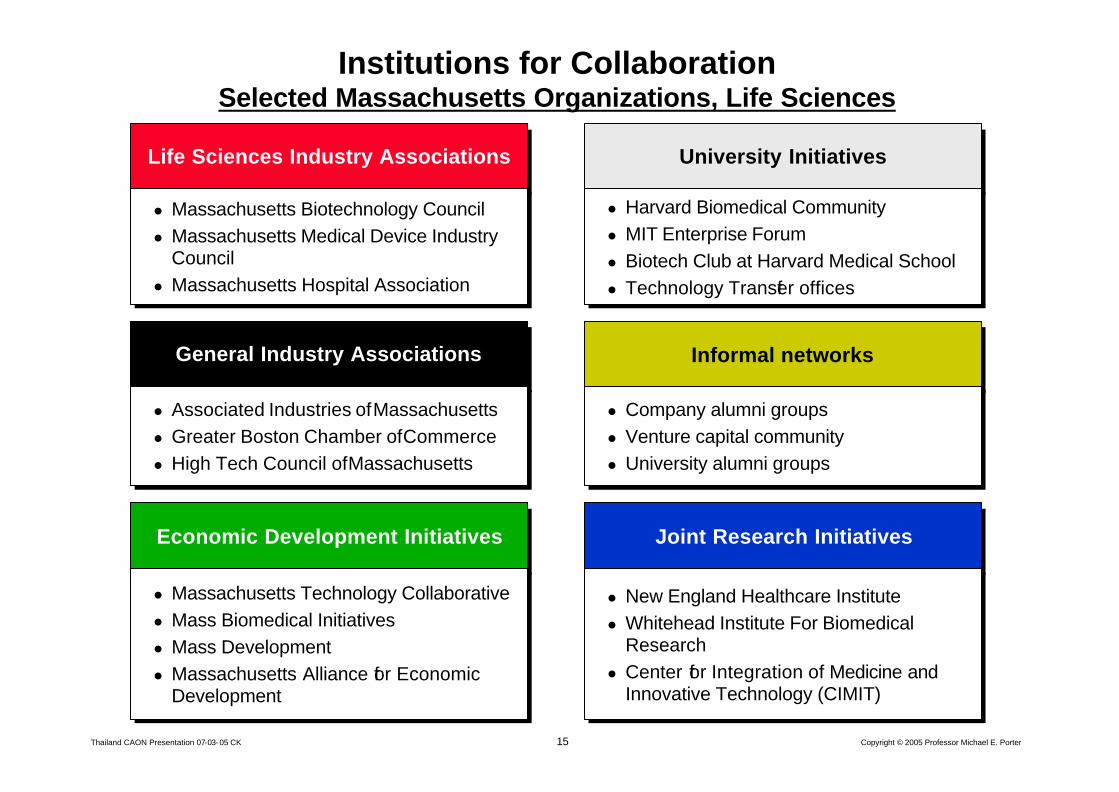
Institutions for CollaborationSelected Massachusetts Organizations, Life Sciences
Economic Development InitiativesEconomic Development Initiatives
l Massachusetts Technology Collaborativel Mass Biomedical Initiativesl Mass Developmentl Massachusetts Alliance for Economic
Development
l Massachusetts Technology Collaborativel Mass Biomedical Initiativesl Mass Developmentl Massachusetts Alliance for Economic
Development
Life Sciences Industry AssociationsLife Sciences Industry Associations
l Massachusetts Biotechnology Councill Massachusetts Medical Device Industry
Councill Massachusetts Hospital Association
l Massachusetts Biotechnology Councill Massachusetts Medical Device Industry
Councill Massachusetts Hospital Association
General Industry AssociationsGeneral Industry Associations
l Associated Industries of Massachusettsl Greater Boston Chamber of Commercel High Tech Council of Massachusetts
l Associated Industries of Massachusettsl Greater Boston Chamber of Commercel High Tech Council of Massachusetts
University InitiativesUniversity Initiatives
l Harvard Biomedical Communityl MIT Enterprise Foruml Biotech Club at Harvard Medical Schooll Technology Transfer offices
l Harvard Biomedical Communityl MIT Enterprise Foruml Biotech Club at Harvard Medical Schooll Technology Transfer offices
Informal networksInformal networks
l Company alumni groupsl Venture capital communityl University alumni groups
l Company alumni groupsl Venture capital communityl University alumni groups
Joint Research InitiativesJoint Research Initiatives
l New England Healthcare Institutel Whitehead Institute For Biomedical
Researchl Center for Integration of Medicine and
Innovative Technology (CIMIT)
l New England Healthcare Institutel Whitehead Institute For Biomedical
Researchl Center for Integration of Medicine and
Innovative Technology (CIMIT)
16Thailand CAON Presentation 07-03- 05 CK Copyright © 2005 Professor Michael E. Porter
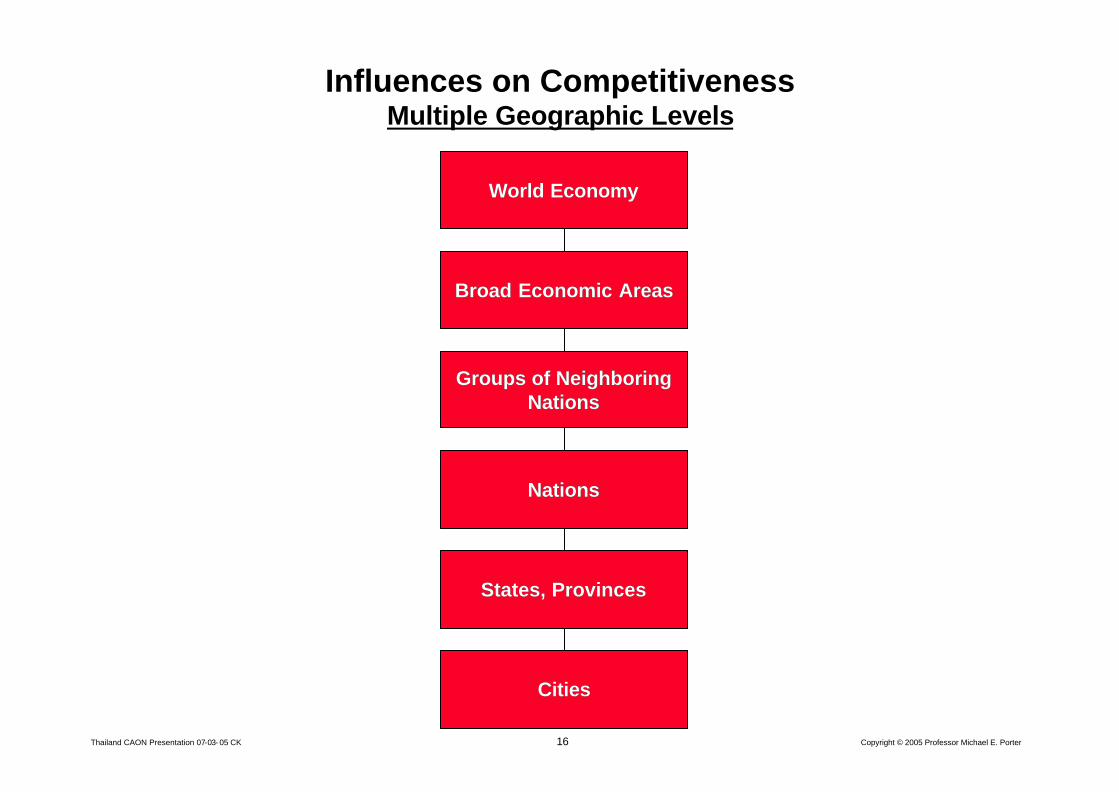
Influences on CompetitivenessMultiple Geographic Levels
Broad Economic AreasBroad Economic Areas
Groups of Neighboring Groups of Neighboring NationsNations
States, ProvincesStates, Provinces
CitiesCities
NationsNations
World EconomyWorld Economy
17Thailand CAON Presentation 07-03- 05 CK Copyright © 2005 Professor Michael E. Porter
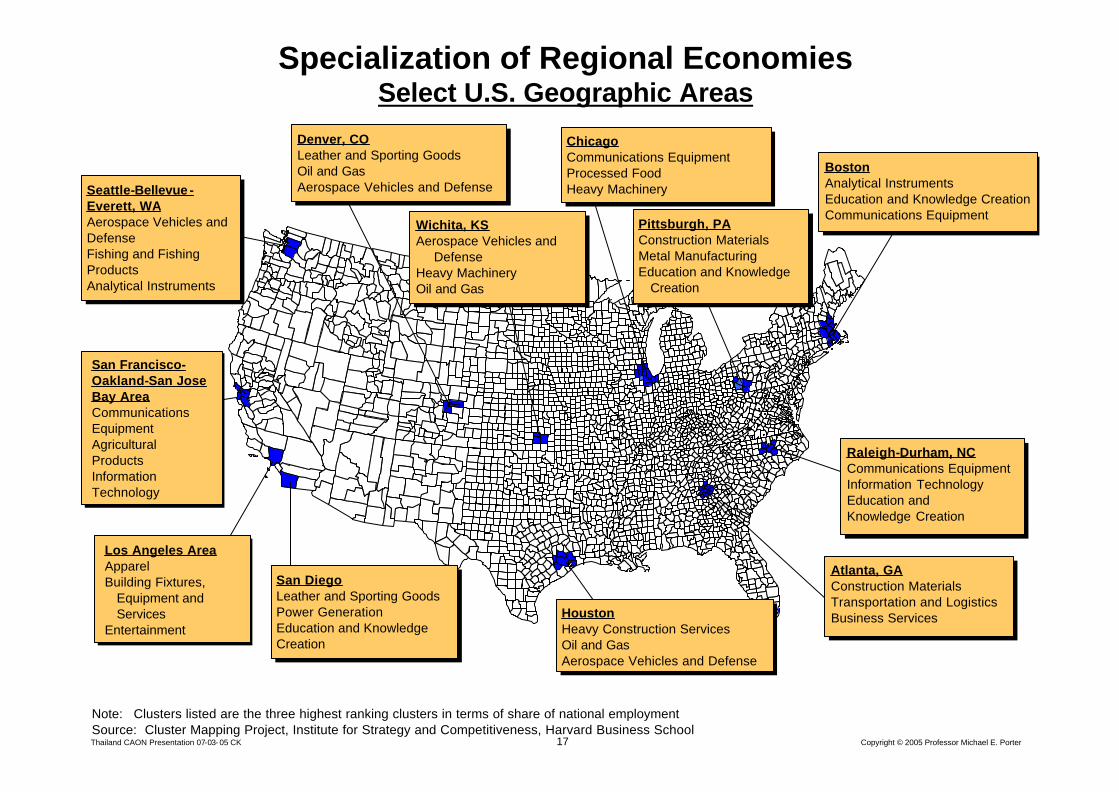
Specialization of Regional EconomiesSelect U.S. Geographic Areas
BostonAnalytical InstrumentsEducation and Knowledge CreationCommunications Equipment
BostonAnalytical InstrumentsEducation and Knowledge CreationCommunications Equipment
Los Angeles AreaApparelBuilding Fixtures,
Equipment and Services
Entertainment
Los Angeles AreaApparelBuilding Fixtures,
Equipment and Services
Entertainment
ChicagoCommunications EquipmentProcessed FoodHeavy Machinery
ChicagoCommunications EquipmentProcessed FoodHeavy Machinery
Denver, COLeather and Sporting GoodsOil and GasAerospace Vehicles and Defense
Denver, COLeather and Sporting GoodsOil and GasAerospace Vehicles and Defense
San DiegoLeather and Sporting GoodsPower GenerationEducation and Knowledge Creation
San DiegoLeather and Sporting GoodsPower GenerationEducation and Knowledge Creation
San Francisco-Oakland-San Jose Bay AreaCommunications EquipmentAgricultural ProductsInformation Technology
San Francisco-Oakland-San Jose Bay AreaCommunications EquipmentAgricultural ProductsInformation Technology
Seattle-Bellevue -Everett, WAAerospace Vehicles and DefenseFishing and Fishing ProductsAnalytical Instruments
Seattle-Bellevue -Everett, WAAerospace Vehicles and DefenseFishing and Fishing ProductsAnalytical Instruments
HoustonHeavy Construction ServicesOil and GasAerospace Vehicles and Defense
HoustonHeavy Construction ServicesOil and GasAerospace Vehicles and Defense
Pittsburgh, PAConstruction MaterialsMetal ManufacturingEducation and Knowledge
Creation
Pittsburgh, PAConstruction MaterialsMetal ManufacturingEducation and Knowledge
Creation
Atlanta, GAConstruction MaterialsTransportation and LogisticsBusiness Services
Atlanta, GAConstruction MaterialsTransportation and LogisticsBusiness Services
Raleigh-Durham, NCCommunications EquipmentInformation TechnologyEducation andKnowledge Creation
Raleigh-Durham, NCCommunications EquipmentInformation TechnologyEducation andKnowledge Creation
Wichita, KSAerospace Vehicles and
DefenseHeavy MachineryOil and Gas
Wichita, KSAerospace Vehicles and
DefenseHeavy MachineryOil and Gas
Note: Clusters listed are the three highest ranking clusters in terms of share of national employmentSource: Cluster Mapping Project, Institute for Strategy and Competitiveness, Harvard Business School
18Thailand CAON Presentation 07-03- 05 CK Copyright © 2005 Professor Michael E. Porter
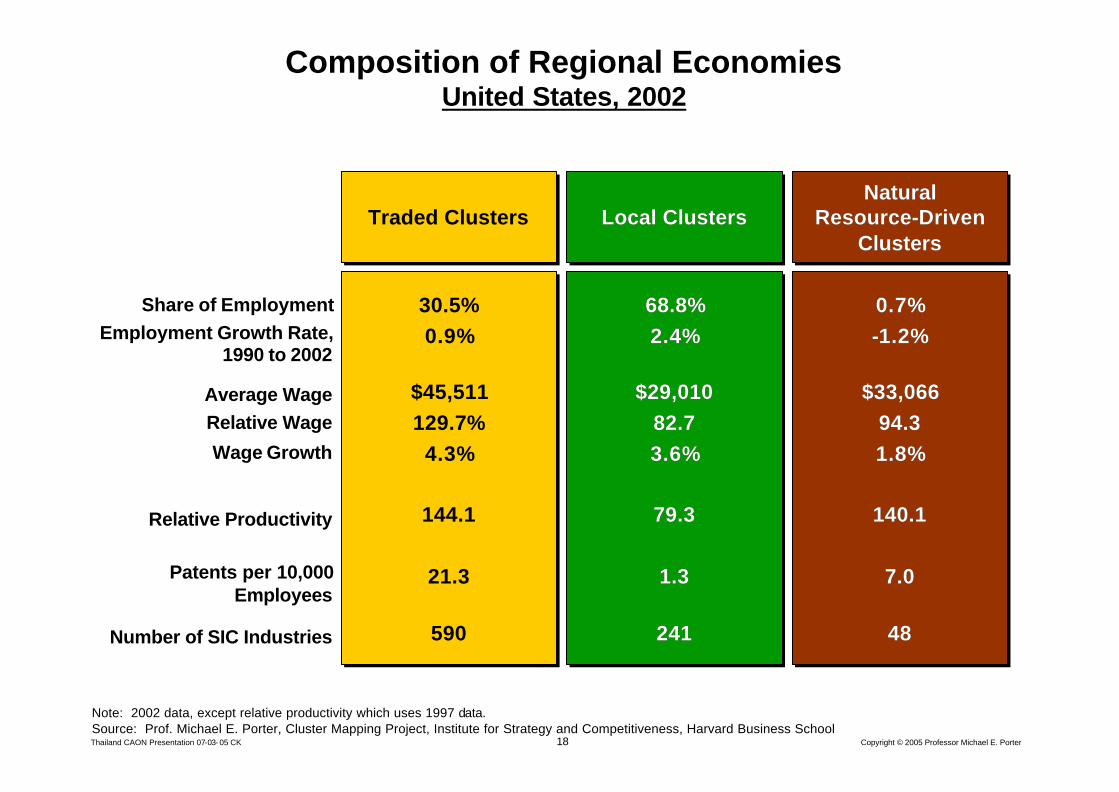
Traded ClustersTraded Clusters
30.5%0.9%
$45,511129.7%
4.3%
144.1
21.3
590
30.5%0.9%
$45,511129.7%
4.3%
144.1
21.3
590
Local ClustersLocal ClustersLocal Clusters
68.8%2.4%
$29,01082.73.6%
79.3
1.3
241
68.8%68.8%2.4%2.4%
$29,010$29,01082.782.73.6%3.6%
79.379.3
1.31.3
241241
NaturalResource-Driven
Clusters
NaturalNaturalResourceResource--Driven Driven
ClustersClusters
0.7%-1.2%
$33,06694.31.8%
140.1
7.0
48
0.7%0.7%--1.2%1.2%
$33,066$33,06694.394.31.8%1.8%
140.1140.1
7.07.0
4848
Share of EmploymentEmployment Growth Rate,
1990 to 2002
Average WageRelative Wage
Wage Growth
Relative Productivity
Patents per 10,000 Employees
Number of SIC Industries
Note: 2002 data, except relative productivity which uses 1997 data.Source: Prof. Michael E. Porter, Cluster Mapping Project, Institute for Strategy and Competitiveness, Harvard Business School
Composition of Regional EconomiesUnited States, 2002
19Thailand CAON Presentation 07-03- 05 CK Copyright © 2005 Professor Michael E. Porter
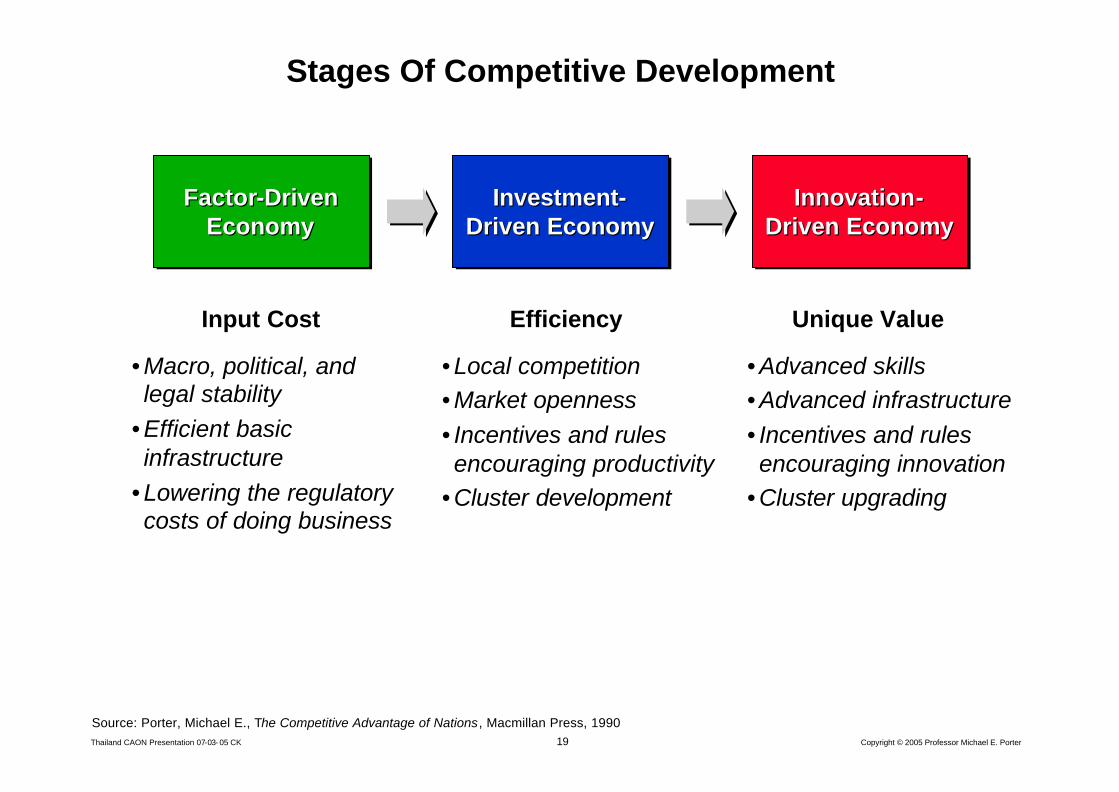
Stages Of Competitive Development
Factor-Driven Economy
FactorFactor--Driven Driven EconomyEconomy
Investment-Driven Economy
InvestmentInvestment--Driven EconomyDriven Economy
Innovation-Driven Economy
InnovationInnovation--Driven EconomyDriven Economy
Source: Porter, Michael E., The Competitive Advantage of Nations, Macmillan Press, 1990
Input Cost Efficiency Unique Value
• Macro, political, and legal stability
• Efficient basic infrastructure
• Lowering the regulatory costs of doing business
• Local competition• Market openness• Incentives and rulesencouraging productivity
• Cluster development
• Advanced skills• Advanced infrastructure• Incentives and rulesencouraging innovation
• Cluster upgrading
20Thailand CAON Presentation 07-03- 05 CK Copyright © 2005 Professor Michael E. Porter
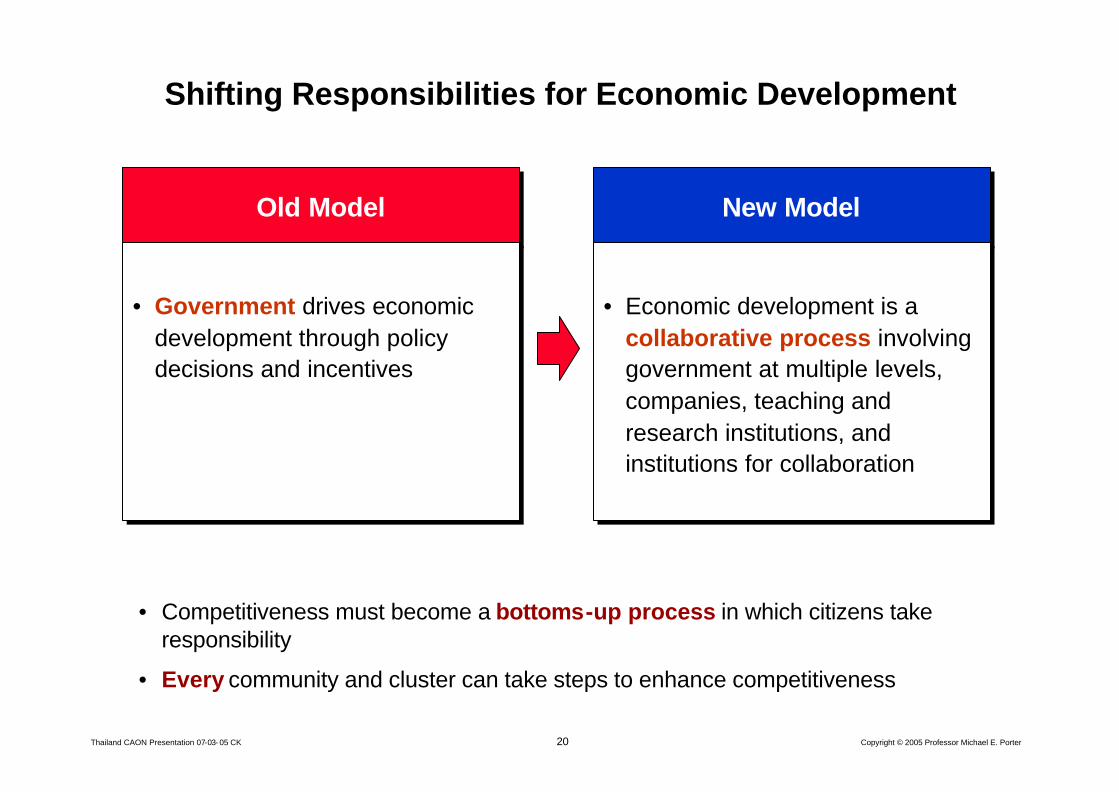
Shifting Responsibilities for Economic Development
Old ModelOld Model
• Government drives economic development through policy decisions and incentives
• Government drives economic development through policy decisions and incentives
New ModelNew Model
• Economic development is a collaborative process involving government at multiple levels, companies, teaching and research institutions, and institutions for collaboration
• Economic development is a collaborative process involving government at multiple levels, companies, teaching and research institutions, and institutions for collaboration
• Competitiveness must become a bottoms-up process in which citizens take responsibility
• Every community and cluster can take steps to enhance competitiveness
21Thailand CAON Presentation 07-03- 05 CK Copyright © 2005 Professor Michael E. Porter
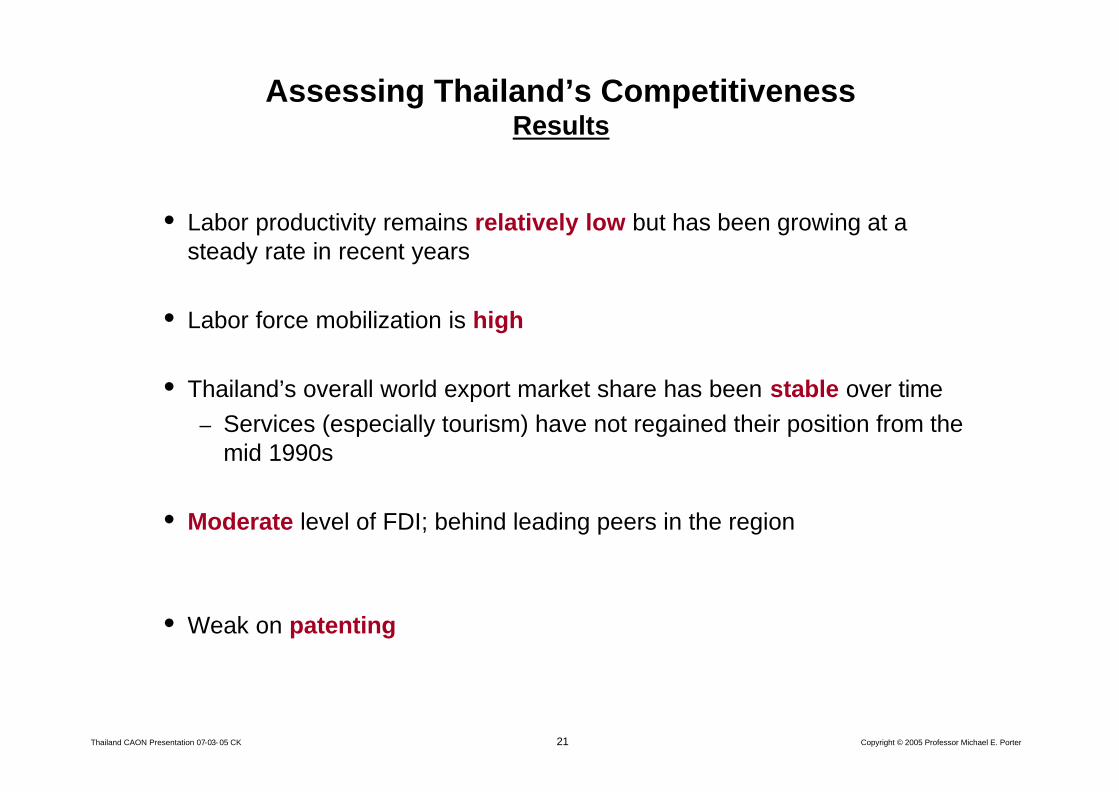
Assessing Thailand’s CompetitivenessResults
• Labor productivity remains relatively low but has been growing at a steady rate in recent years
• Labor force mobilization is high
• Thailand’s overall world export market share has been stable over time– Services (especially tourism) have not regained their position from the
mid 1990s
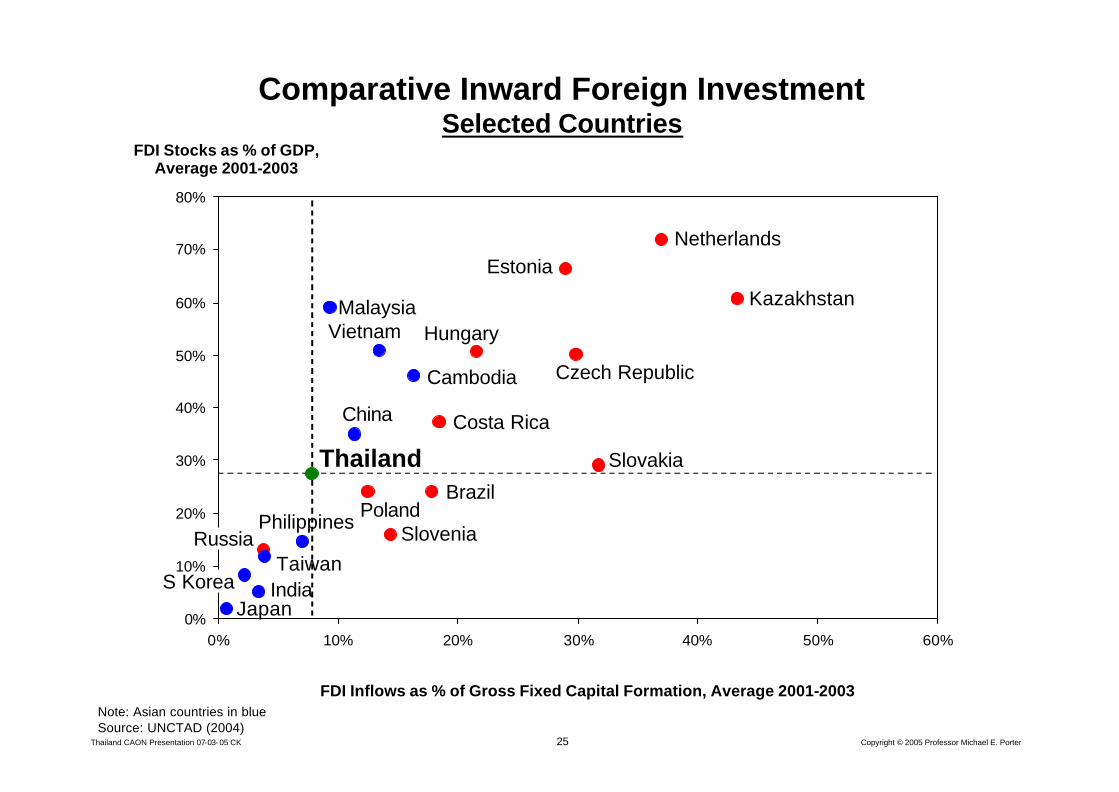
• Moderate level of FDI; behind leading peers in the region
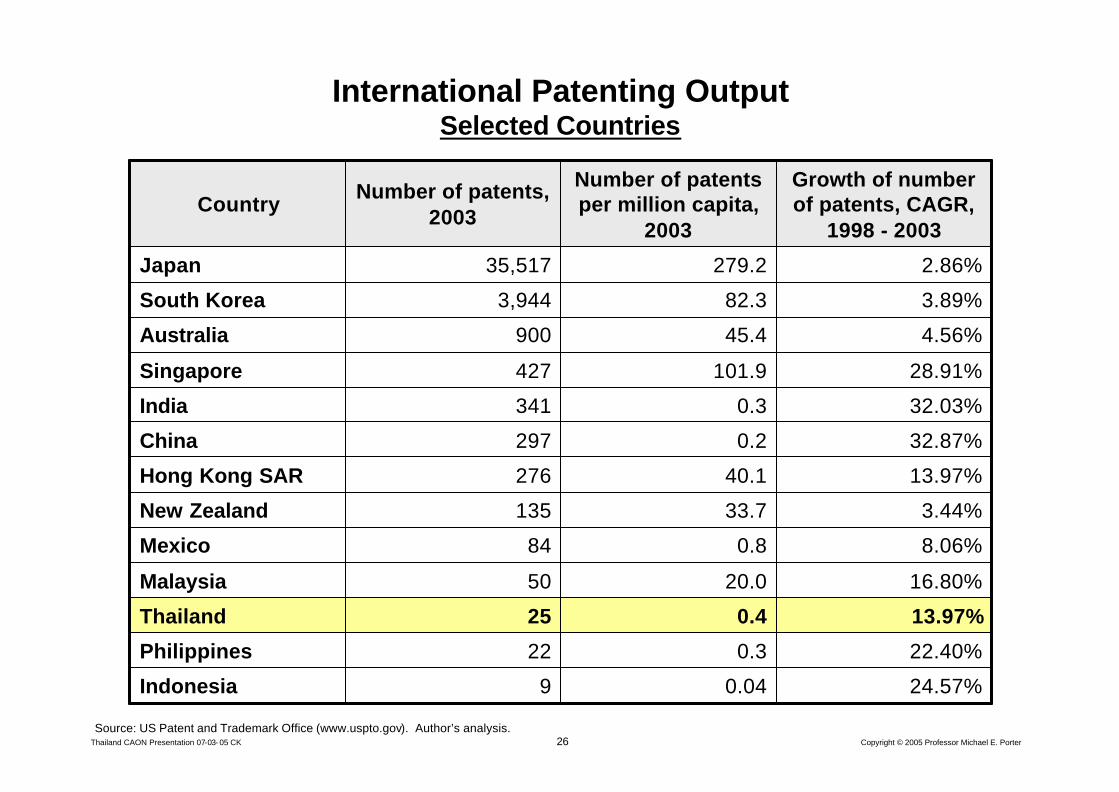
• Weak on patenting
22Thailand CAON Presentation 07-03- 05 CK Copyright © 2005 Professor Michael E. Porter
Taiwan
Singapore
0
5,000
10,000
15,000
20,000
25,000
30,000
35,000
40,000
45,000
50,000
-5% 0% 5% 10%
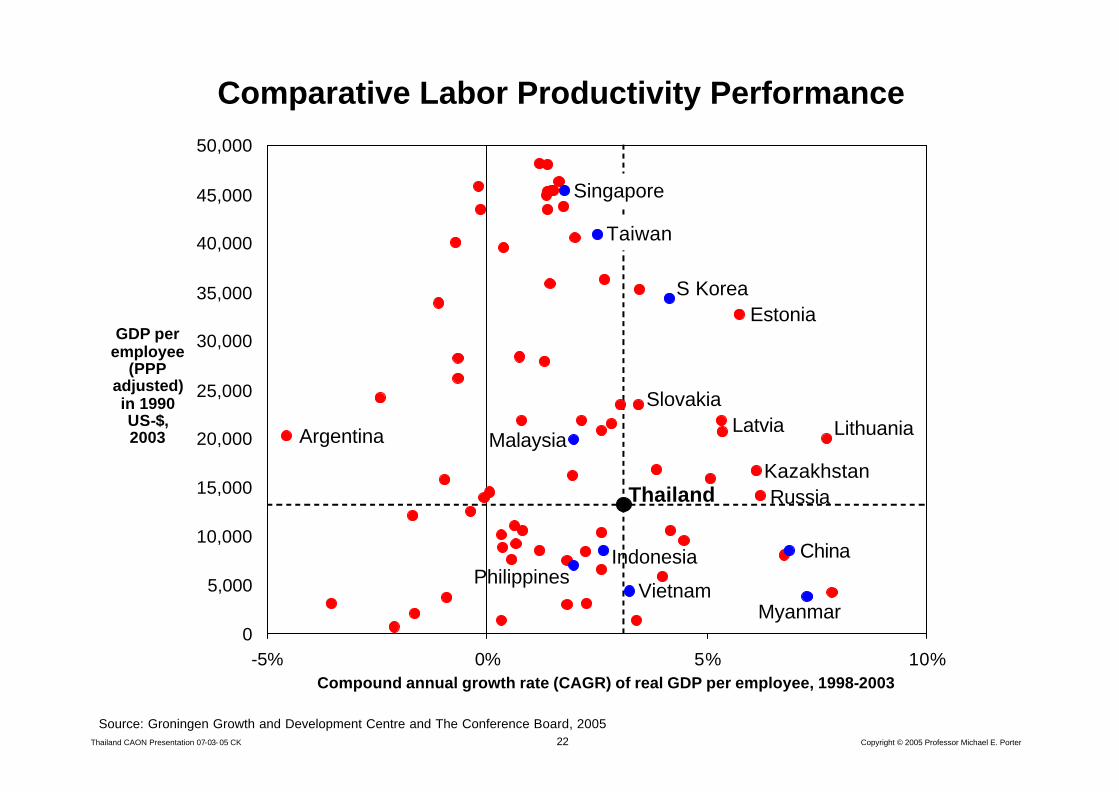
Comparative Labor Productivity Performance
Compound annual growth rate (CAGR) of real GDP per employee, 1998-2003
GDP per employee
(PPP adjusted) in 1990 US-$, 2003
Source: Groningen Growth and Development Centre and The Conference Board, 2005
Thailand
Latvia LithuaniaArgentina
China
MyanmarVietnam
PhilippinesIndonesia
KazakhstanRussia
S Korea
Slovakia
Malaysia
Estonia
23Thailand CAON Presentation 07-03- 05 CK Copyright © 2005 Professor Michael E. Porter
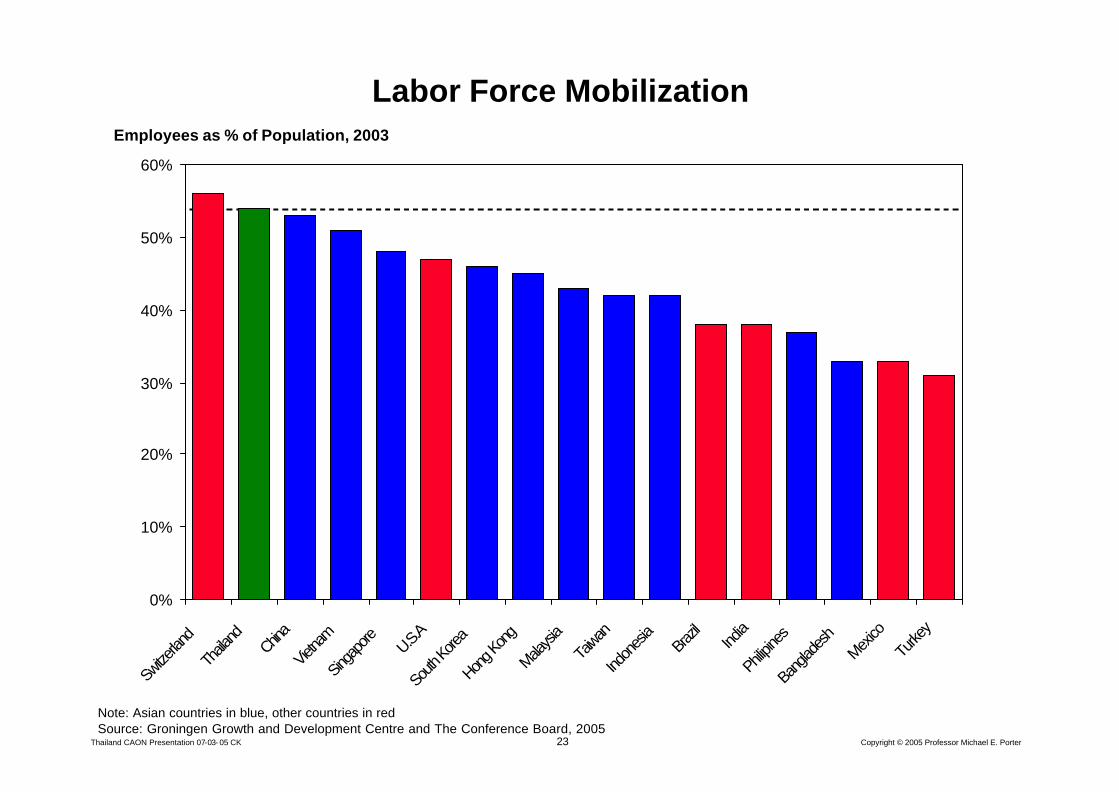
Labor Force Mobilization
0%
10%
20%
30%
40%
50%
60%
Switze
rland
Thaila
ndChin
a
Vietna
m
Singa
pore
U.S.A
South
Korea
Hong K
ong
Malaysi
aTa
iwan
Indon
esia
Brazil
India
Philipin
es
Bang
lades
hMex
icoTu
rkey
Employees as % of Population, 2003
Note: Asian countries in blue, other countries in red Source: Groningen Growth and Development Centre and The Conference Board, 2005
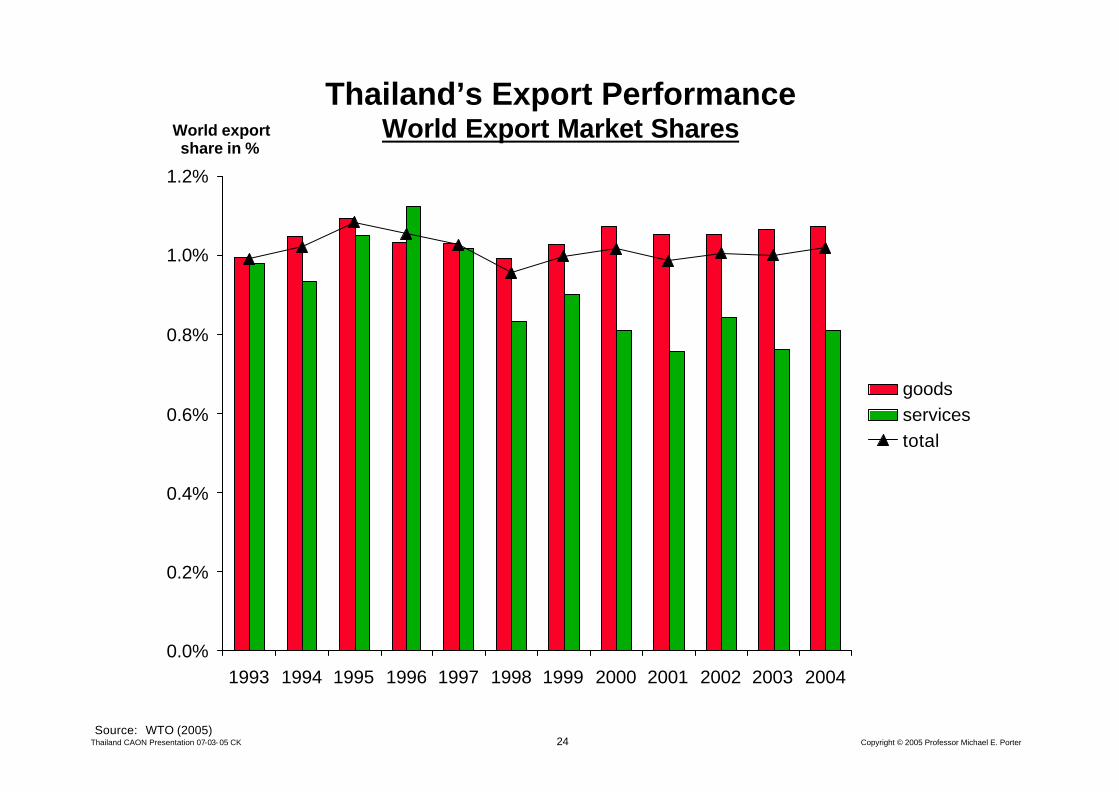
24Thailand CAON Presentation 07-03- 05 CK Copyright © 2005 Professor Michael E. Porter
Thailand’s Export PerformanceWorld Export Market Shares
0.0%
0.2%
0.4%
0.6%
0.8%
1.0%
1.2%
1993 1994 1995 1996 1997 1998 1999 2000 2001 2002 2003 2004
goodsservicestotal
Source: WTO (2005)
World export share in %
25Thailand CAON Presentation 07-03- 05 CK Copyright © 2005 Professor Michael E. Porter
0%
10%
20%
30%
40%
50%
60%
70%
80%
0% 10% 20% 30% 40% 50% 60%
Comparative Inward Foreign InvestmentSelected Countries
FDI Stocks as % of GDP, Average 2001-2003
FDI Inflows as % of Gross Fixed Capital Formation, Average 2001-2003Note: Asian countries in blueSource: UNCTAD (2004)
Vietnam
Japan
Netherlands
Brazil
Costa Rica
Kazakhstan
Cambodia
China
India
Malaysia
Philippines
Taiwan
Thailand
Czech Republic
Estonia
Hungary
Poland
S Korea
Russia
Slovakia
Slovenia
26Thailand CAON Presentation 07-03- 05 CK Copyright © 2005 Professor Michael E. Porter
International Patenting OutputSelected Countries
24.57%0.049Indonesia
22.40%0.322Philippines
13.97%0.425Thailand
16.80%20.050Malaysia
8.06%0.884Mexico
3.44%33.7135New Zealand
13.97%40.1276Hong Kong SAR
32.87%0.2297China
32.03%0.3341India
28.91%101.9427Singapore
4.56%45.4900Australia
3.89%82.33,944South Korea
2.86%279.235,517Japan
Growth of number of patents, CAGR,
1998 - 2003
Number of patents per million capita,
2003
Number of patents, 2003
Country
Source: US Patent and Trademark Office (www.uspto.gov). Author’s analysis.
27Thailand CAON Presentation 07-03- 05 CK Copyright © 2005 Professor Michael E. Porter
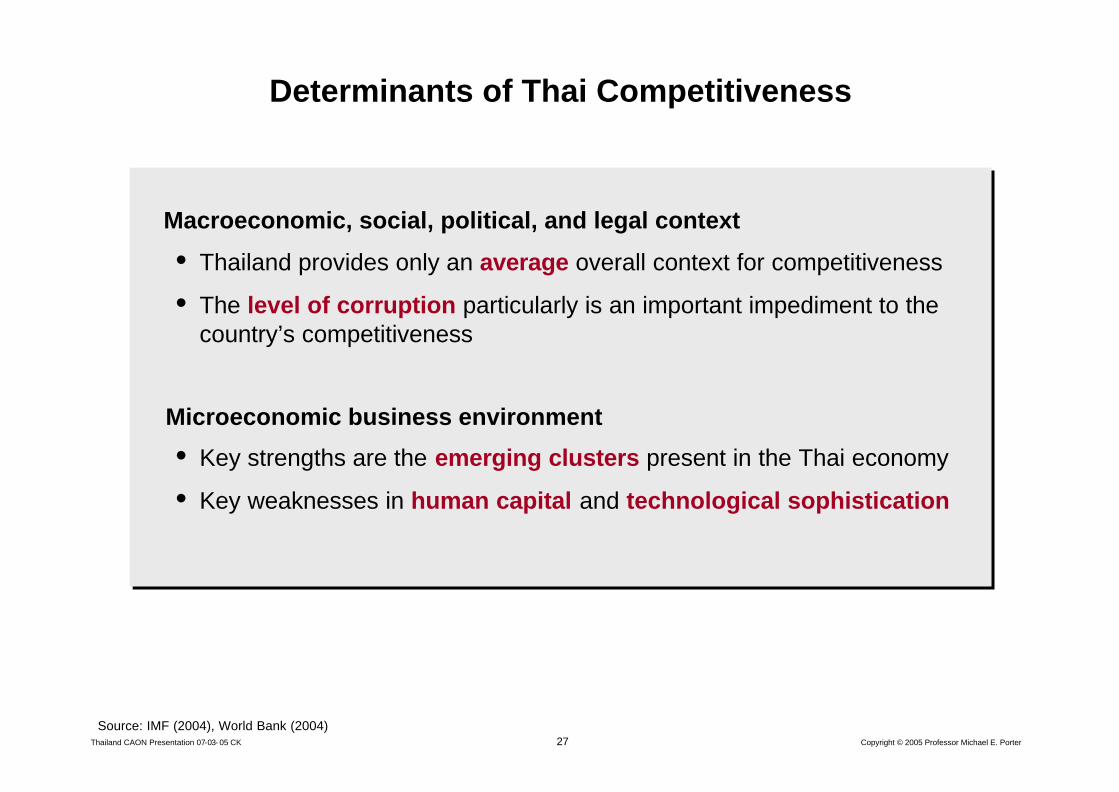
Determinants of Thai Competitiveness
Macroeconomic, social, political, and legal context
• Thailand provides only an average overall context for competitiveness
• The level of corruption particularly is an important impediment to the country’s competitiveness
Microeconomic business environment
• Key strengths are the emerging clusters present in the Thai economy
• Key weaknesses in human capital and technological sophistication
Source: IMF (2004), World Bank (2004)
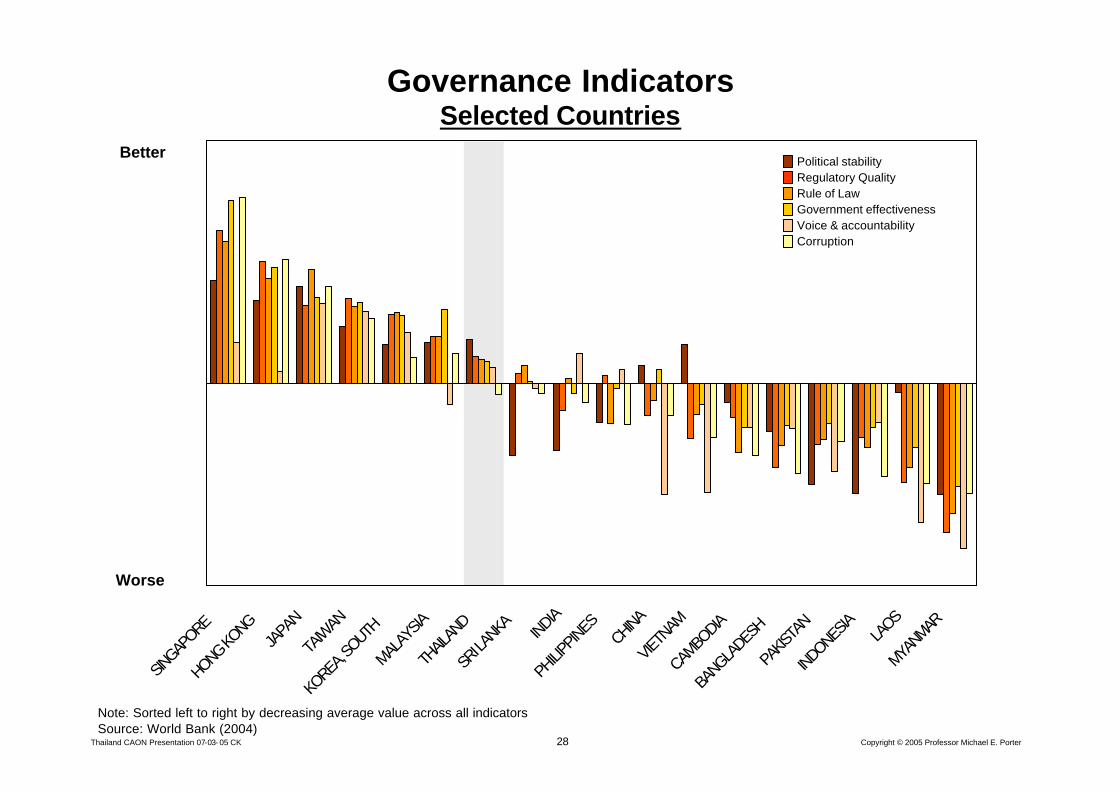
28Thailand CAON Presentation 07-03- 05 CK Copyright © 2005 Professor Michael E. Porter
Governance IndicatorsSelected Countries
SINGAP
ORE
HONG KONG
JAPA
N
TAIW
AN
KOREA
, SOUTH
MALAY
SIA
THAIL
AND
SRI LA
NKA INDIA
PHILIP
PINES
CHINA
VIETN
AM
CAMBO
DIA
BANGLA
DESH
PAKIS
TAN
INDONESIA
LAOS
MYANM
AR
Note: Sorted left to right by decreasing average value across all indicatorsSource: World Bank (2004)
Better
Worse
Corruption
Regulatory QualityRule of LawGovernment effectivenessVoice & accountability
Political stability
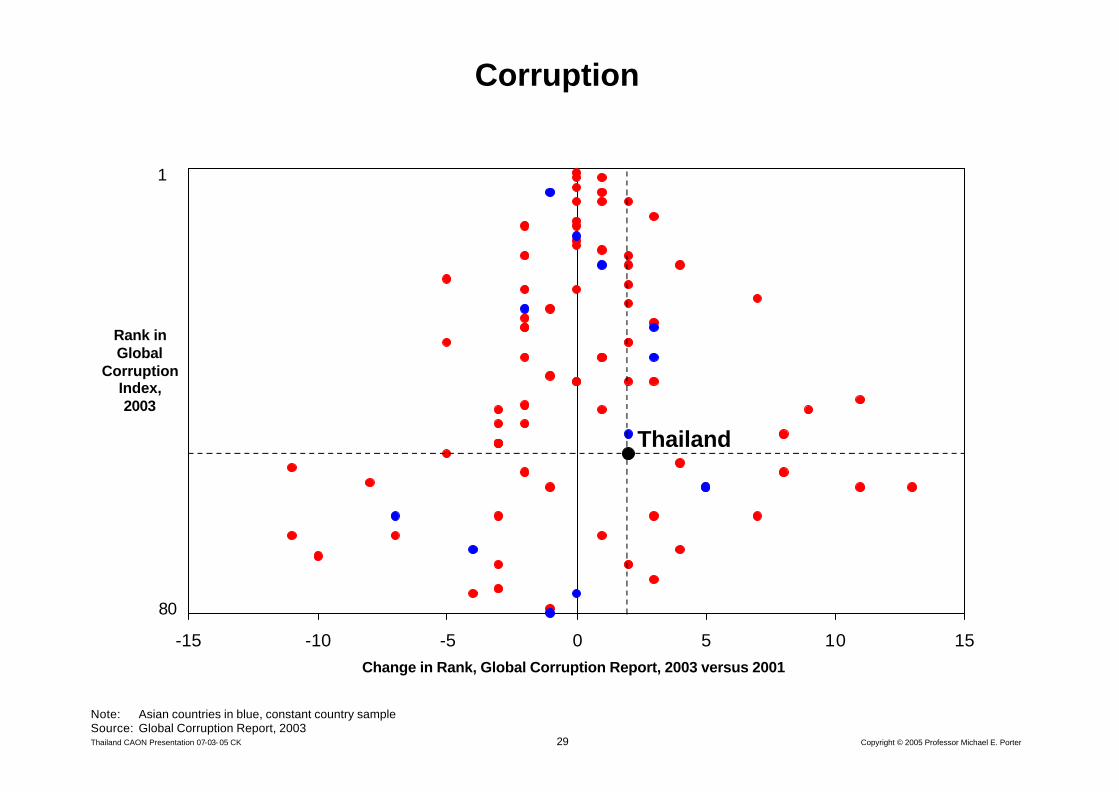
29Thailand CAON Presentation 07-03- 05 CK Copyright © 2005 Professor Michael E. Porter
-15 -10 -5 0 5 10 15
Corruption
Thailand
Note: Asian countries in blue, constant country sampleSource: Global Corruption Report, 2003
Change in Rank, Global Corruption Report, 2003 versus 2001
Rank in Global
CorruptionIndex,2003
80
1
30Thailand CAON Presentation 07-03- 05 CK Copyright © 2005 Professor Michael E. Porter
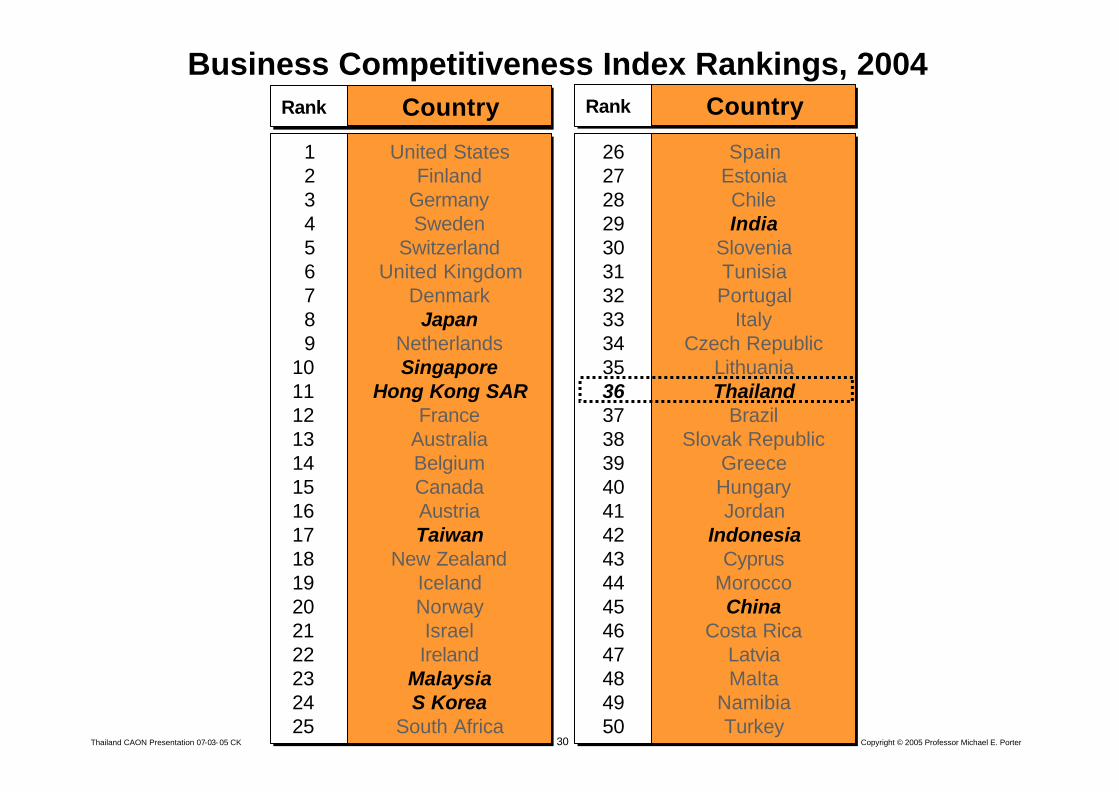
Business Competitiveness Index Rankings, 2004
123456789
10111213141516171819202122232425
123456789
10111213141516171819202122232425
RankRank Country
United StatesFinland
GermanySweden
SwitzerlandUnited Kingdom
DenmarkJapan
NetherlandsSingapore
Hong Kong SARFrance
AustraliaBelgiumCanadaAustriaTaiwan
New ZealandIcelandNorwayIsraelIreland
MalaysiaS Korea
South Africa
26272829303132333435363738394041424344454647484950
26272829303132333435363738394041424344454647484950
RankRank Country
SpainEstoniaChileIndia
SloveniaTunisiaPortugal
ItalyCzech Republic
LithuaniaThailand
BrazilSlovak Republic
GreeceHungaryJordan
IndonesiaCyprus
MoroccoChina
Costa RicaLatviaMalta
NamibiaTurkey
31Thailand CAON Presentation 07-03- 05 CK Copyright © 2005 Professor Michael E. Porter
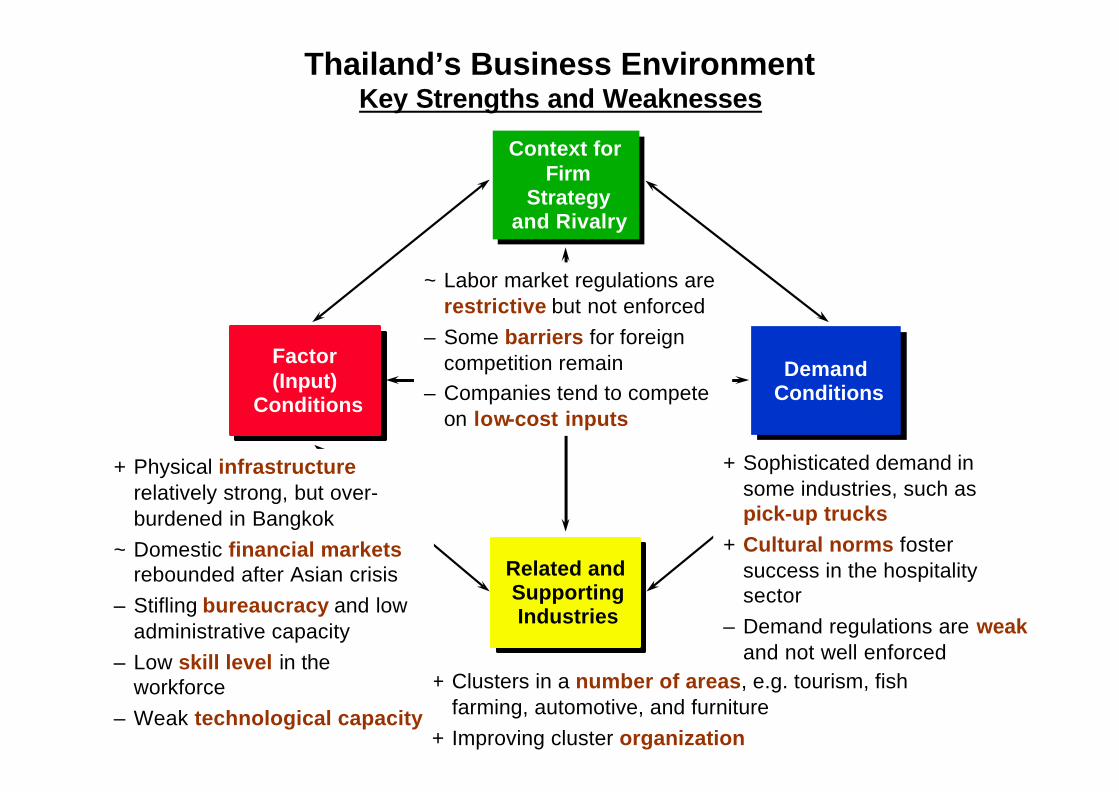
+ Clusters in a number of areas, e.g. tourism, fish farming, automotive, and furniture
+ Improving cluster organization
Thailand’s Business EnvironmentKey Strengths and Weaknesses
Context for Firm
Strategy and Rivalry
Context for Firm
Strategy and Rivalry
Related and Supporting Industries
Related and Supporting Industries
Factor(Input)
Conditions
Factor(Input)
ConditionsDemand
ConditionsDemand
Conditions
+ Physical infrastructurerelatively strong, but over-burdened in Bangkok
~ Domestic financial markets rebounded after Asian crisis
– Stifling bureaucracy and low administrative capacity
– Low skill level in the workforce
– Weak technological capacity
+ Sophisticated demand in some industries, such as pick-up trucks
+ Cultural norms foster success in the hospitality sector
– Demand regulations are weakand not well enforced
~ Labor market regulations are restrictive but not enforced
– Some barriers for foreign competition remain
– Companies tend to compete on low-cost inputs
32Thailand CAON Presentation 07-03- 05 CK Copyright © 2005 Professor Michael E. Porter
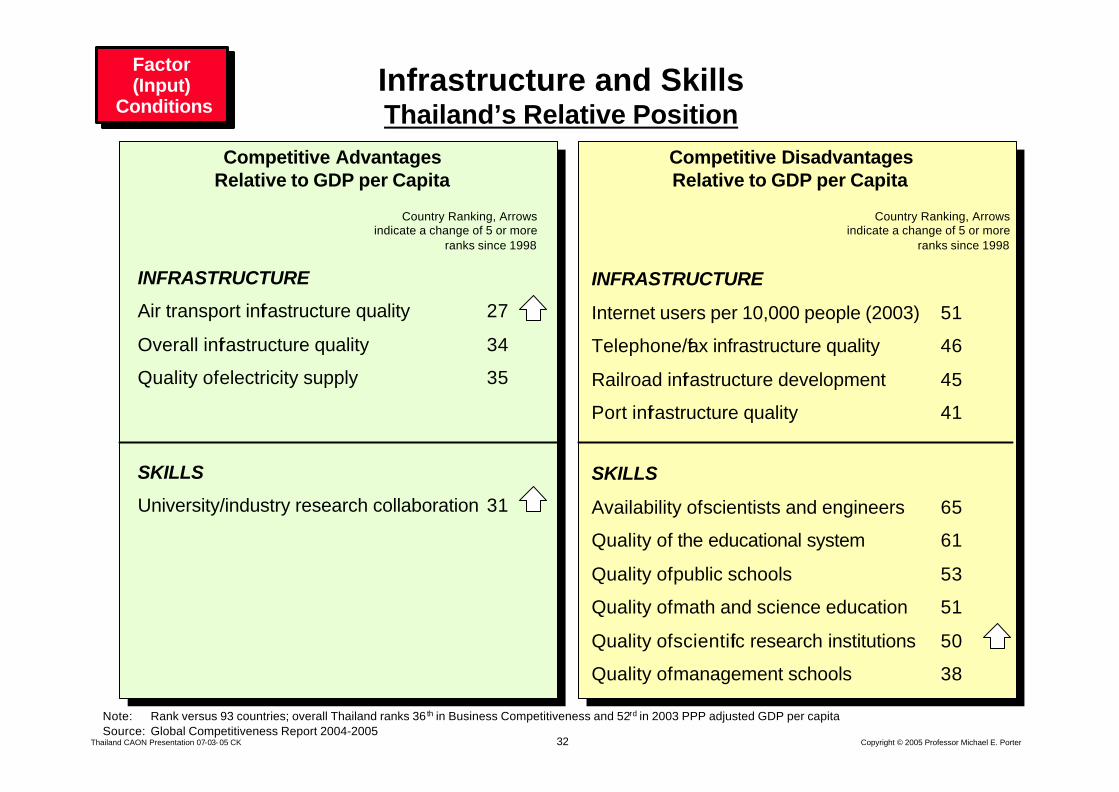
Infrastructure and SkillsThailand’s Relative Position
Factor(Input)
Conditions
Factor(Input)
Conditions
INFRASTRUCTURE
Air transport infrastructure quality 27
Overall infrastructure quality 34
Quality of electricity supply 35
Competitive Disadvantages Relative to GDP per Capita
Competitive Advantages Relative to GDP per Capita
INFRASTRUCTURE
Internet users per 10,000 people (2003) 51
Telephone/fax infrastructure quality 46
Railroad infrastructure development 45
Port infrastructure quality 41
Country Ranking, Arrows indicate a change of 5 or more
ranks since 1998
Country Ranking, Arrows indicate a change of 5 or more
ranks since 1998
Note: Rank versus 93 countries; overall Thailand ranks 36 th in Business Competitiveness and 52rd in 2003 PPP adjusted GDP per capitaSource: Global Competitiveness Report 2004-2005
SKILLS
University/industry research collaboration 31
SKILLS
Availability of scientists and engineers 65
Quality of the educational system 61
Quality of public schools 53
Quality of math and science education 51
Quality of scientific research institutions 50
Quality of management schools 38
33Thailand CAON Presentation 07-03- 05 CK Copyright © 2005 Professor Michael E. Porter
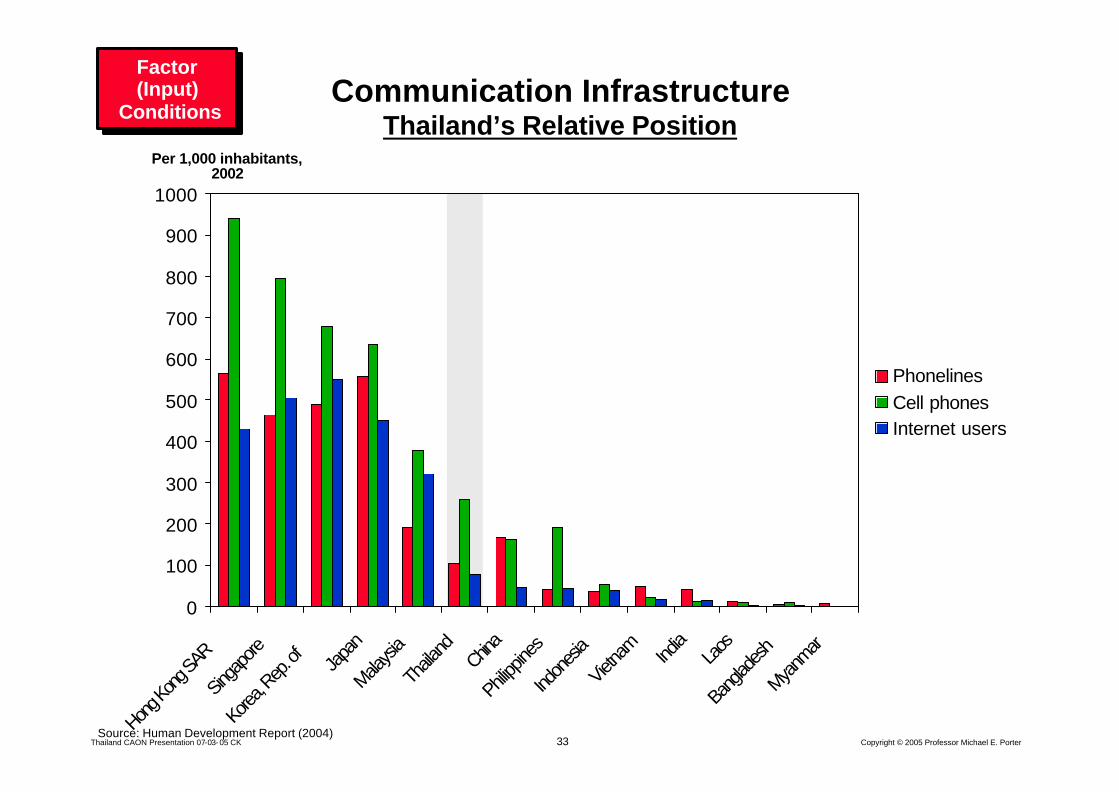
Communication InfrastructureThailand’s Relative Position
0
100
200
300
400
500
600
700
800
900
1000
Hong K
ong S
AR
Singa
pore
Korea
, Rep
. of Japa
n
Malaysi
a
Thaila
ndChin
a
Philipp
ines
Indon
esia
Vietna
mInd
iaLa
os
Bang
lades
h
Myanm
ar
PhonelinesCell phonesInternet users
Per 1,000 inhabitants, 2002
Source: Human Development Report (2004)
Factor(Input)
Conditions
Factor(Input)
Conditions
34Thailand CAON Presentation 07-03- 05 CK Copyright © 2005 Professor Michael E. Porter
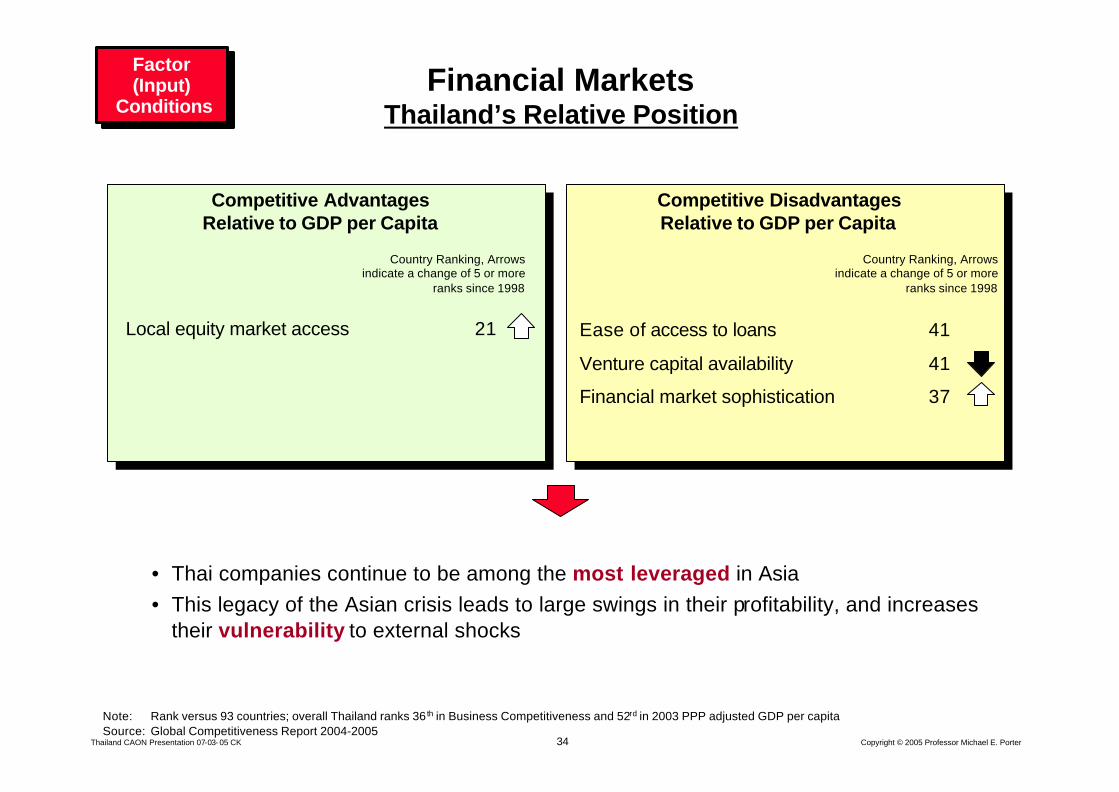
Financial MarketsThailand’s Relative Position
Factor(Input)
Conditions
Factor(Input)
Conditions
Local equity market access 21
Competitive Disadvantages Relative to GDP per Capita
Competitive Advantages Relative to GDP per Capita
Country Ranking, Arrows indicate a change of 5 or more
ranks since 1998
Country Ranking, Arrows indicate a change of 5 or more
ranks since 1998
Note: Rank versus 93 countries; overall Thailand ranks 36 th in Business Competitiveness and 52rd in 2003 PPP adjusted GDP per capitaSource: Global Competitiveness Report 2004-2005
Ease of access to loans 41
Venture capital availability 41
Financial market sophistication 37
• Thai companies continue to be among the most leveraged in Asia• This legacy of the Asian crisis leads to large swings in their profitability, and increases
their vulnerability to external shocks
35Thailand CAON Presentation 07-03- 05 CK Copyright © 2005 Professor Michael E. Porter
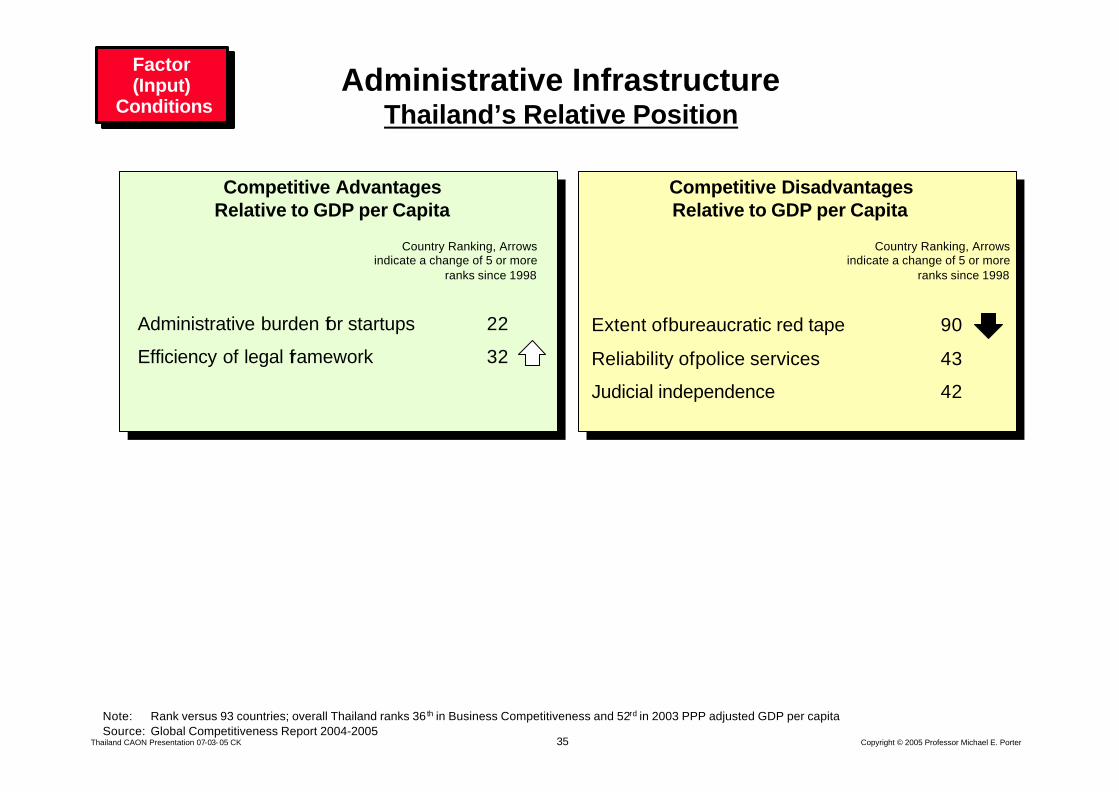
Administrative InfrastructureThailand’s Relative Position
Factor(Input)
Conditions
Factor(Input)
Conditions
Administrative burden for startups 22
Efficiency of legal framework 32
Competitive Disadvantages Relative to GDP per Capita
Competitive Advantages Relative to GDP per Capita
Extent of bureaucratic red tape 90
Reliability of police services 43
Judicial independence 42
Country Ranking, Arrows indicate a change of 5 or more
ranks since 1998
Country Ranking, Arrows indicate a change of 5 or more
ranks since 1998
Note: Rank versus 93 countries; overall Thailand ranks 36 th in Business Competitiveness and 52rd in 2003 PPP adjusted GDP per capitaSource: Global Competitiveness Report 2004-2005
36Thailand CAON Presentation 07-03- 05 CK Copyright © 2005 Professor Michael E. Porter
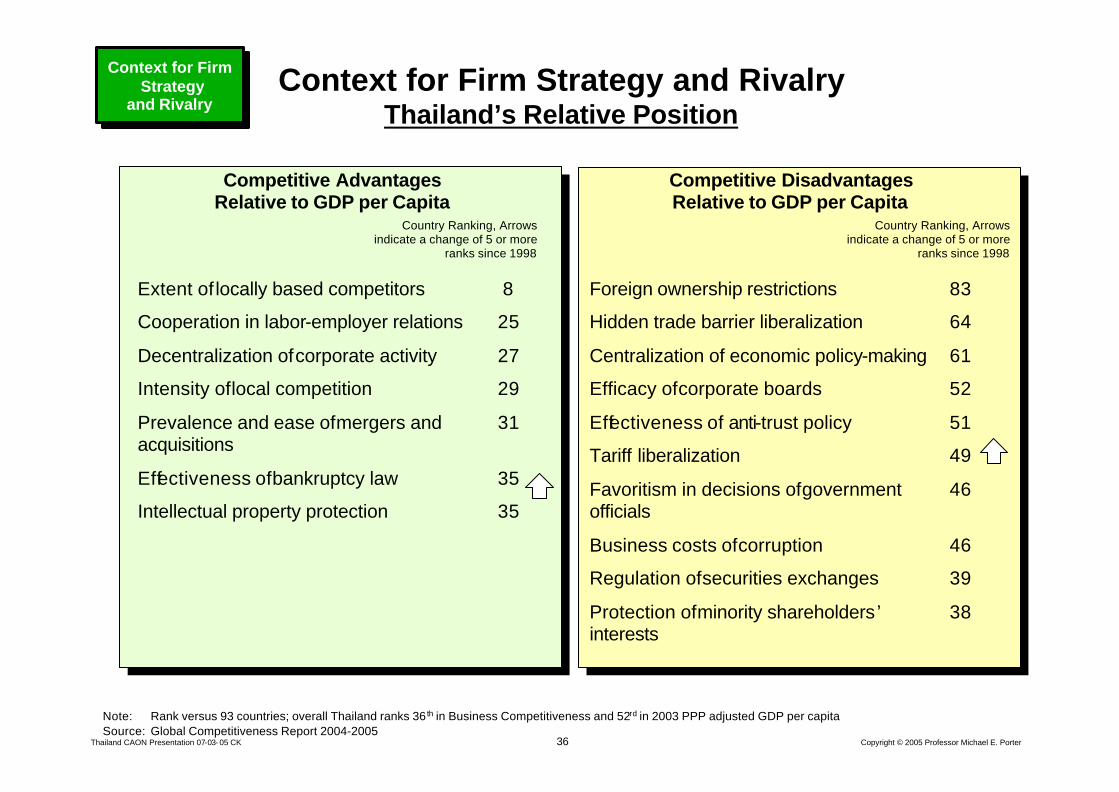
Context for Firm Strategy and RivalryThailand’s Relative Position
Extent of locally based competitors 8
Cooperation in labor-employer relations 25
Decentralization of corporate activity 27
Intensity of local competition 29
Prevalence and ease of mergers and 31 acquisitions
Effectiveness of bankruptcy law 35
Intellectual property protection 35
Competitive Disadvantages Relative to GDP per Capita
Competitive Advantages Relative to GDP per Capita
Context for Firm Strategy
and Rivalry
Context for Firm Strategy
and Rivalry
Country Ranking, Arrows indicate a change of 5 or more
ranks since 1998
Country Ranking, Arrows indicate a change of 5 or more
ranks since 1998
Foreign ownership restrictions 83
Hidden trade barrier liberalization 64
Centralization of economic policy-making 61
Efficacy of corporate boards 52
Effectiveness of anti-trust policy 51
Tariff liberalization 49
Favoritism in decisions of government 46 officials
Business costs of corruption 46
Regulation of securities exchanges 39
Protection of minority shareholders’ 38 interests
Note: Rank versus 93 countries; overall Thailand ranks 36 th in Business Competitiveness and 52rd in 2003 PPP adjusted GDP per capitaSource: Global Competitiveness Report 2004-2005
37Thailand CAON Presentation 07-03- 05 CK Copyright © 2005 Professor Michael E. Porter
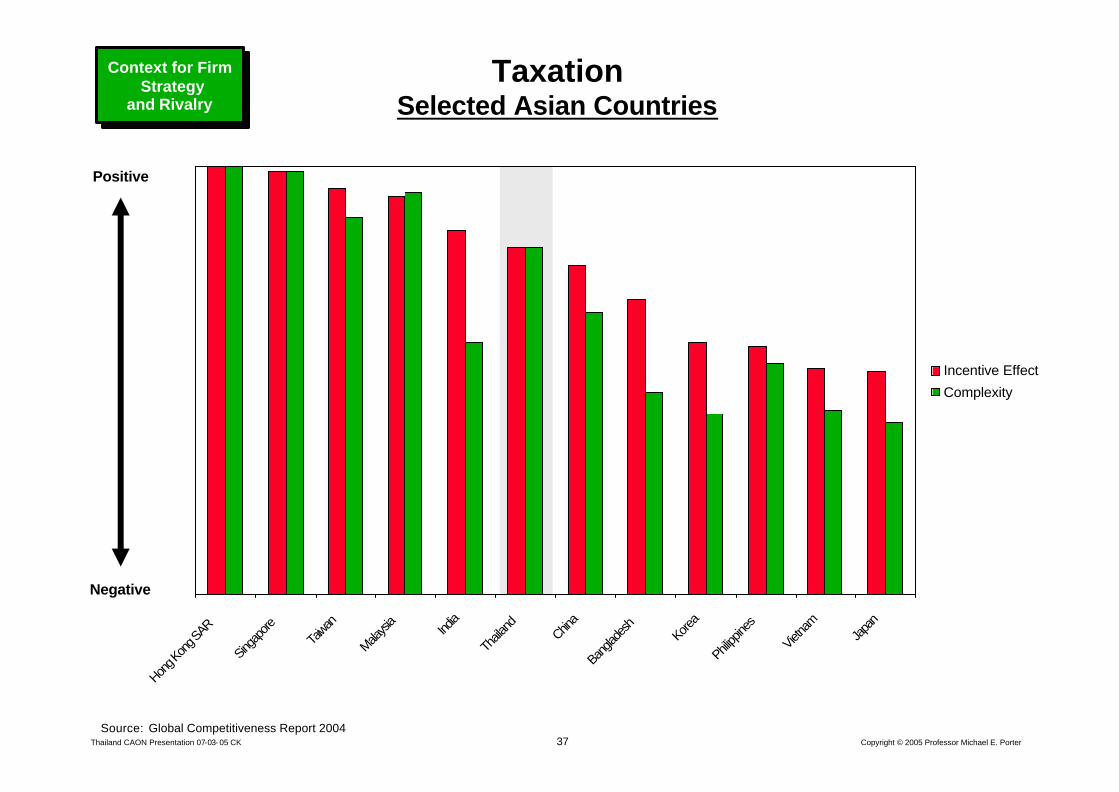
Hong K
ong S
AR
Singap
oreTa
iwan
Malaysi
aInd
ia
Thaila
ndChin
a
Bang
lades
hKore
a
Philipp
ines
Vietna
mJa
pan
Incentive Effect
Complexity
Positive
Negative
Source: Global Competitiveness Report 2004
TaxationSelected Asian Countries
Context for Firm Strategy
and Rivalry
Context for Firm Strategy
and Rivalry
38Thailand CAON Presentation 07-03- 05 CK Copyright © 2005 Professor Michael E. Porter
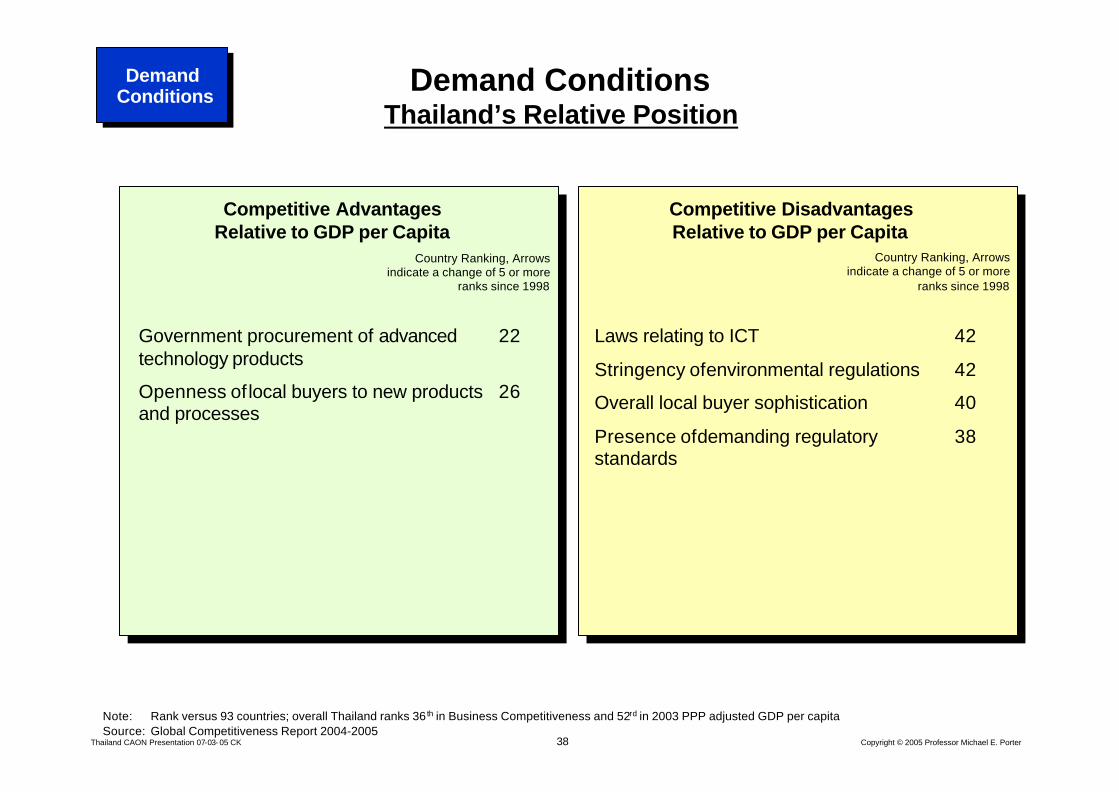
Demand ConditionsThailand’s Relative Position
Competitive Disadvantages Relative to GDP per Capita
Competitive Advantages Relative to GDP per Capita
Demand ConditionsDemand
Conditions
Country Ranking, Arrows indicate a change of 5 or more
ranks since 1998
Government procurement of advanced 22 technology products
Openness of local buyers to new products 26 and processes
Country Ranking, Arrows indicate a change of 5 or more
ranks since 1998
Laws relating to ICT 42
Stringency of environmental regulations 42
Overall local buyer sophistication 40
Presence of demanding regulatory 38 standards
Note: Rank versus 93 countries; overall Thailand ranks 36 th in Business Competitiveness and 52rd in 2003 PPP adjusted GDP per capitaSource: Global Competitiveness Report 2004-2005
39Thailand CAON Presentation 07-03- 05 CK Copyright © 2005 Professor Michael E. Porter
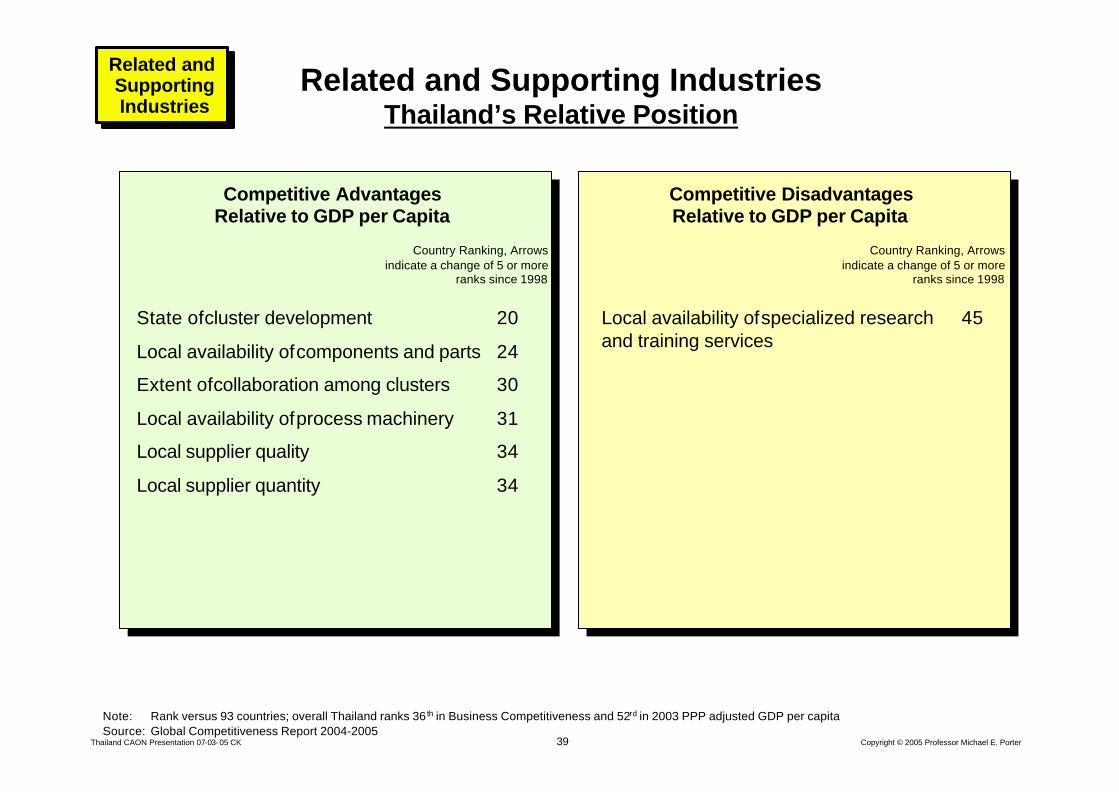
Related and Supporting IndustriesThailand’s Relative Position
Competitive Disadvantages Relative to GDP per Capita
Competitive Advantages Relative to GDP per Capita
Related and Supporting Industries
Related and Supporting Industries
State of cluster development 20
Local availability of components and parts 24
Extent of collaboration among clusters 30
Local availability of process machinery 31
Local supplier quality 34
Local supplier quantity 34
Country Ranking, Arrows indicate a change of 5 or more
ranks since 1998
Country Ranking, Arrows indicate a change of 5 or more
ranks since 1998
Local availability of specialized research 45 and training services
Note: Rank versus 93 countries; overall Thailand ranks 36 th in Business Competitiveness and 52rd in 2003 PPP adjusted GDP per capitaSource: Global Competitiveness Report 2004-2005
40Thailand CAON Presentation 07-03- 05 CK Copyright © 2005 Professor Michael E. Porter
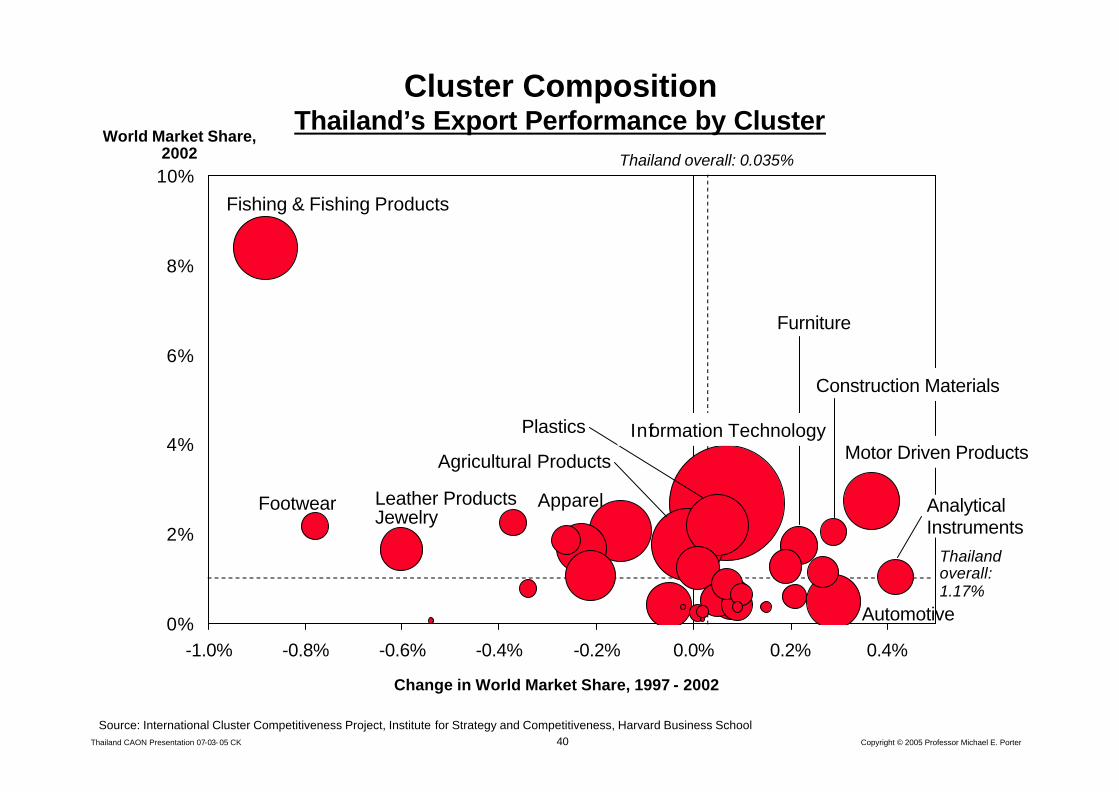
0%
2%
4%
6%
8%
10%
-1.0% -0.8% -0.6% -0.4% -0.2% 0.0% 0.2% 0.4%
Source: International Cluster Competitiveness Project, Institute for Strategy and Competitiveness, Harvard Business School
World Market Share, 2002
Change in World Market Share, 1997 - 2002
Cluster CompositionThailand’s Export Performance by Cluster
Thailand overall: 0.035%
Thailand overall:1.17%
Plastics
Agricultural Products Motor Driven Products
Apparel
Fishing & Fishing Products
Automotive
JewelryAnalytical Instruments
Leather ProductsFootwear
Construction Materials
Information Technology
Furniture
41Thailand CAON Presentation 07-03- 05 CK Copyright © 2005 Professor Michael E. Porter
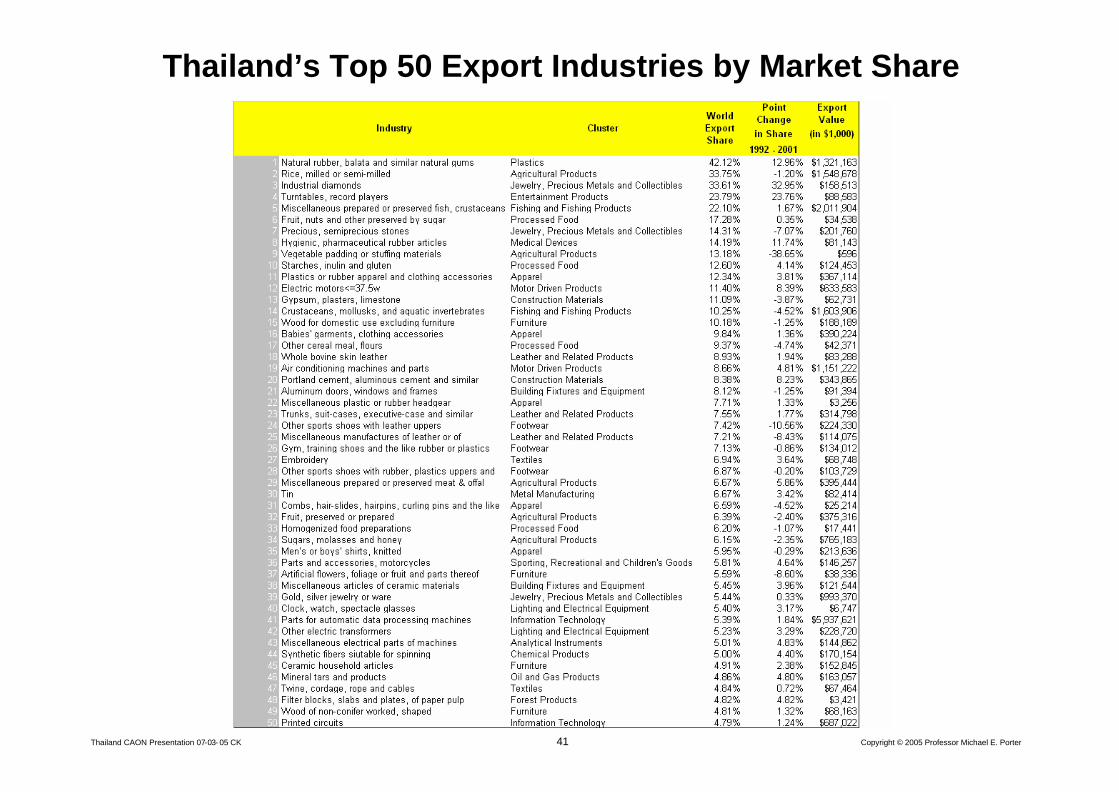
Thailand’s Top 50 Export Industries by Market Share
42Thailand CAON Presentation 07-03- 05 CK Copyright © 2005 Professor Michael E. Porter
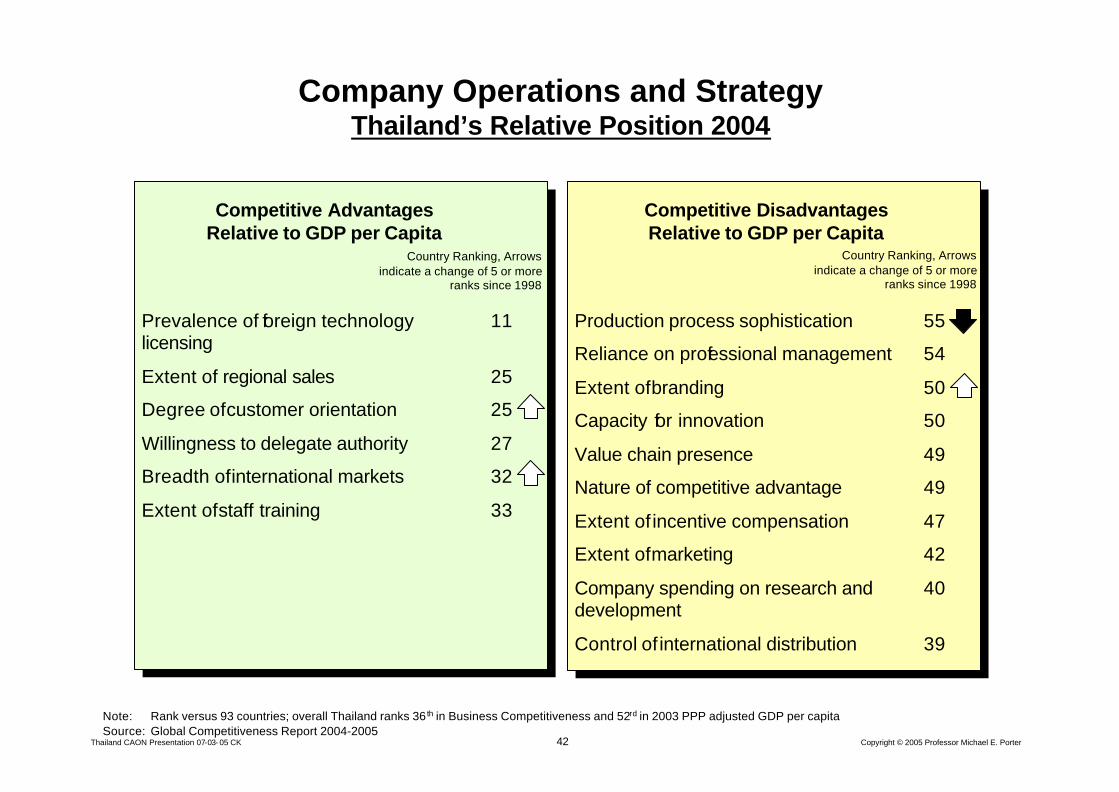
Company Operations and StrategyThailand’s Relative Position 2004
Production process sophistication 55
Reliance on professional management 54
Extent of branding 50
Capacity for innovation 50
Value chain presence 49
Nature of competitive advantage 49
Extent of incentive compensation 47
Extent of marketing 42
Company spending on research and 40 development
Control of international distribution 39
Competitive Disadvantages Relative to GDP per Capita
Competitive Advantages Relative to GDP per Capita
Country Ranking, Arrows indicate a change of 5 or more
ranks since 1998
Country Ranking, Arrows indicate a change of 5 or more
ranks since 1998
Prevalence of foreign technology 11 licensing
Extent of regional sales 25
Degree of customer orientation 25
Willingness to delegate authority 27
Breadth of international markets 32
Extent of staff training 33
Note: Rank versus 93 countries; overall Thailand ranks 36 th in Business Competitiveness and 52rd in 2003 PPP adjusted GDP per capitaSource: Global Competitiveness Report 2004-2005
43Thailand CAON Presentation 07-03- 05 CK Copyright © 2005 Professor Michael E. Porter
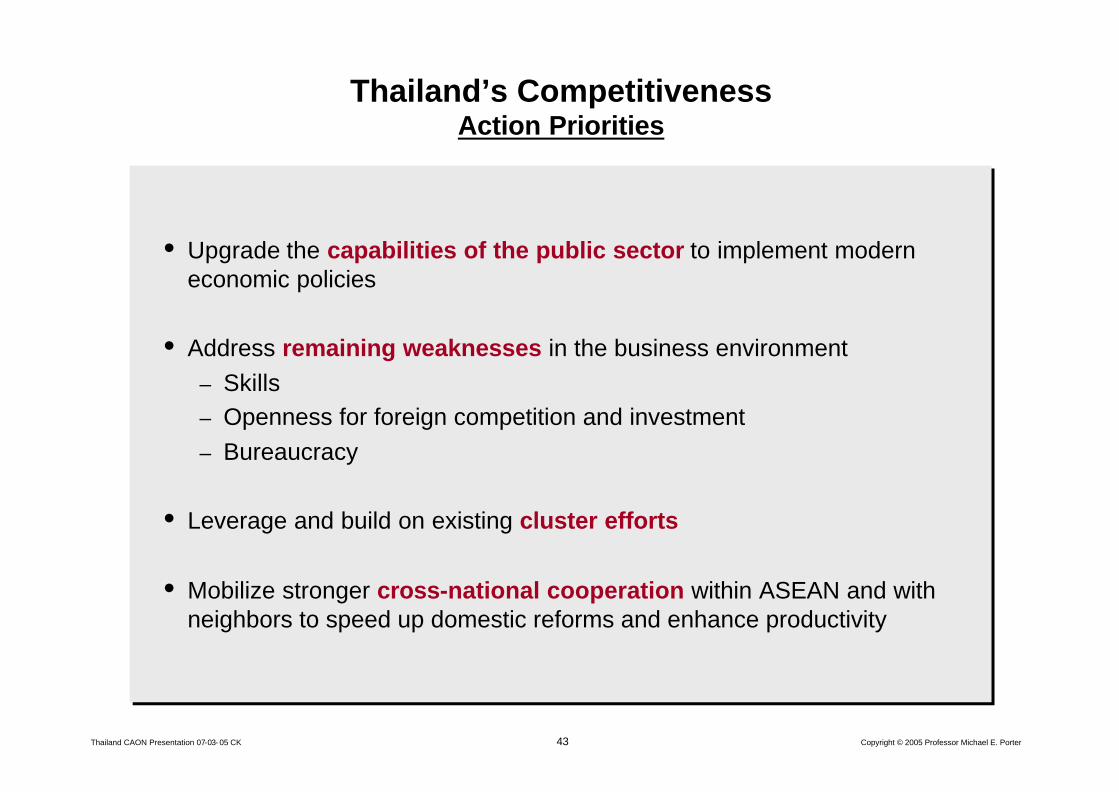
Thailand’s Competitiveness Action Priorities
• Upgrade the capabilities of the public sector to implement modern economic policies
• Address remaining weaknesses in the business environment– Skills – Openness for foreign competition and investment– Bureaucracy
• Leverage and build on existing cluster efforts
• Mobilize stronger cross-national cooperation within ASEAN and with neighbors to speed up domestic reforms and enhance productivity
44Thailand CAON Presentation 07-03- 05 CK Copyright © 2005 Professor Michael E. Porter
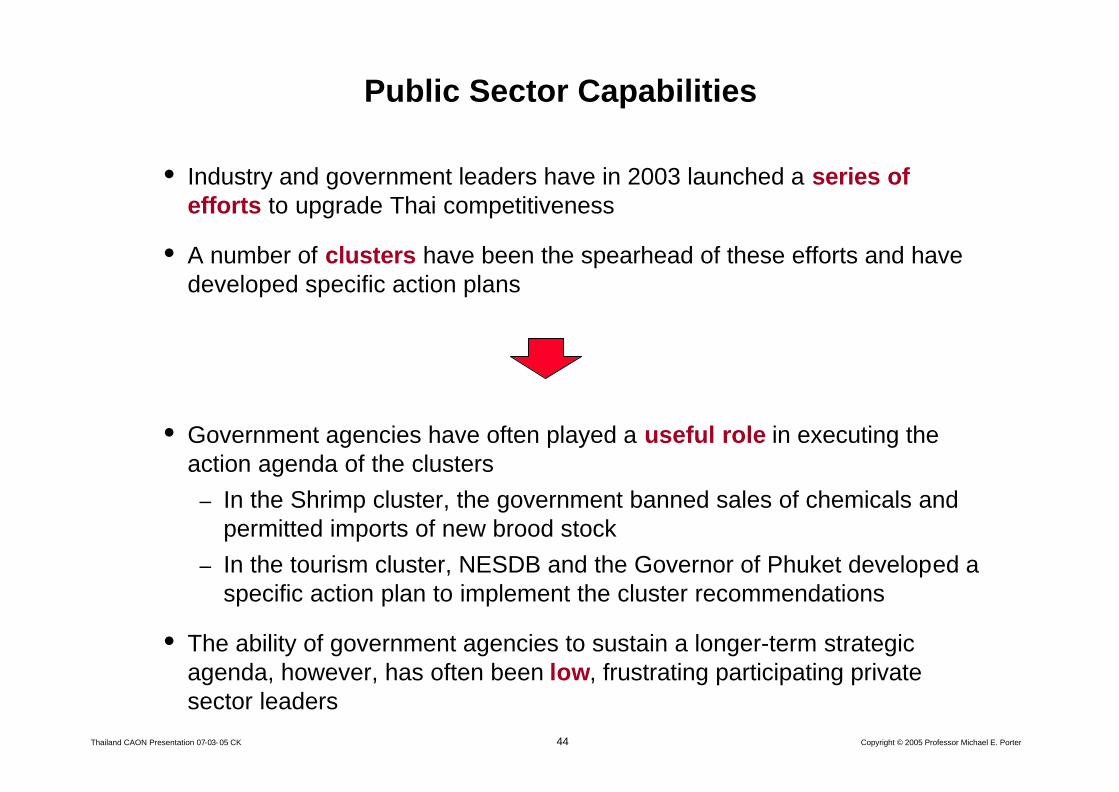
Public Sector Capabilities
• Industry and government leaders have in 2003 launched a series of efforts to upgrade Thai competitiveness
• A number of clusters have been the spearhead of these efforts and have developed specific action plans
• Government agencies have often played a useful role in executing the action agenda of the clusters
– In the Shrimp cluster, the government banned sales of chemicals and permitted imports of new brood stock
– In the tourism cluster, NESDB and the Governor of Phuket developed a specific action plan to implement the cluster recommendations
• The ability of government agencies to sustain a longer-term strategic agenda, however, has often been low, frustrating participating private sector leaders
45Thailand CAON Presentation 07-03- 05 CK Copyright © 2005 Professor Michael E. Porter
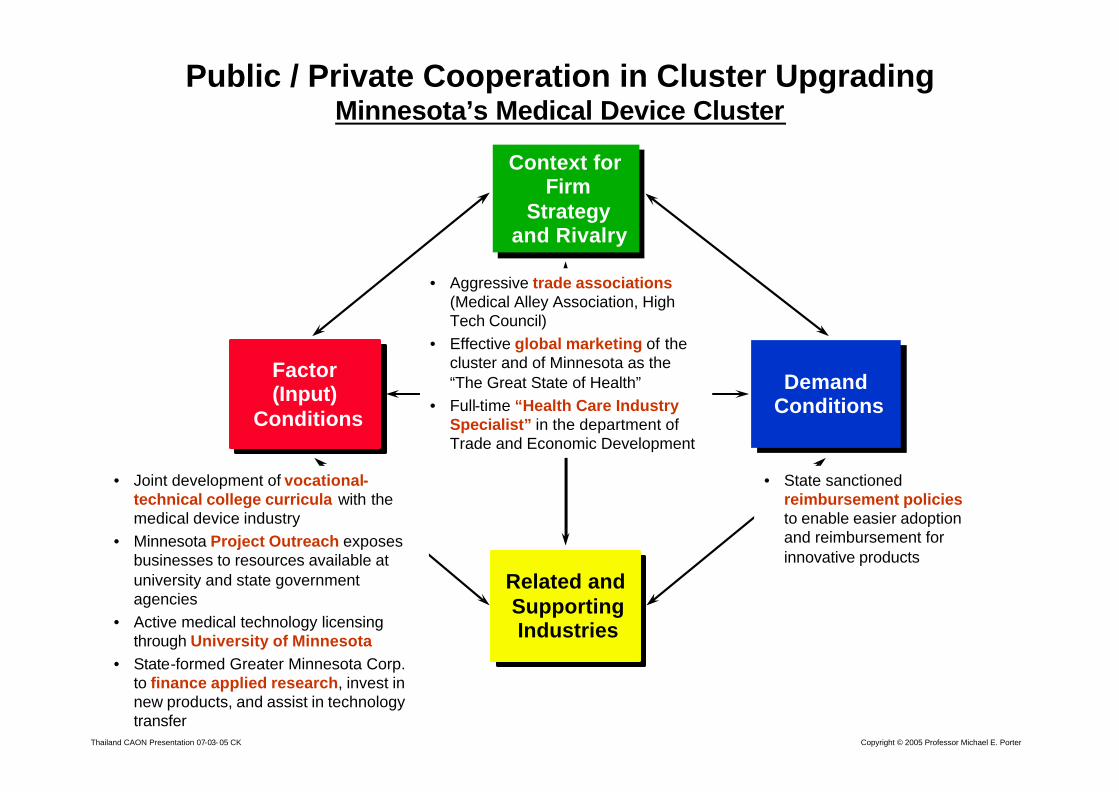
Public / Private Cooperation in Cluster UpgradingMinnesota’s Medical Device Cluster
Context for Firm
Strategy and Rivalry
Context for Firm
Strategy and Rivalry
Related and Supporting Industries
Related and Supporting Industries
Factor(Input)
Conditions
Factor(Input)
Conditions
Demand ConditionsDemand
Conditions
• Joint development of vocational-technical college curricula with the medical device industry
• Minnesota Project Outreach exposes businesses to resources available at university and state government agencies
• Active medical technology licensing through University of Minnesota
• State-formed Greater Minnesota Corp. to finance applied research, invest in new products, and assist in technology transfer
• State sanctioned reimbursement policiesto enable easier adoption and reimbursement for innovative products
• Aggressive trade associations(Medical Alley Association, High Tech Council)
• Effective global marketing of the cluster and of Minnesota as the “The Great State of Health”
• Full-time “Health Care Industry Specialist” in the department of Trade and Economic Development
46Thailand CAON Presentation 07-03- 05 CK Copyright © 2005 Professor Michael E. Porter
Clusters as a Tool For Economic PolicyOverview
• A new way of thinking about an economy and organizing economic development efforts
• Better aligned with the nature of competition and sources of competitive advantage. Clusters capture important linkages in terms of technology, skills, information, marketing and customer needs that cut across firms and industries. Such linkages are fundamental to competition and, especially, to the direction and pace of innovation
• Recast the role of the private sector, government, trade associations and educational or research institutions
• Brings together firms of all sizes
• Creates a forum for constructive business-government dialog
• A means to identify common opportunities, not just common problems
• Provides guidance for both economic and social policies
47Thailand CAON Presentation 07-03- 05 CK Copyright © 2005 Professor Michael E. Porter
Appropriate Roles of Government in Cluster Development
• A successful cluster policy builds on sound overall economic policies
• Government should support the development of all clusters, not pick winners among them
• Government policy should reinforce established and emerging clustersrather than attempt to create entirely new ones
• Government can seed new clusters through attracting foreign direct investment
• Government’s role in cluster initiatives is as facilitator and participant. The most successful cluster initiatives are public-private partnerships
• Government should NOT provide subsidies, set preferential tariffs, exempt companies from competition laws, give preferential tax exemptions, etc.
48Thailand CAON Presentation 07-03- 05 CK Copyright © 2005 Professor Michael E. Porter
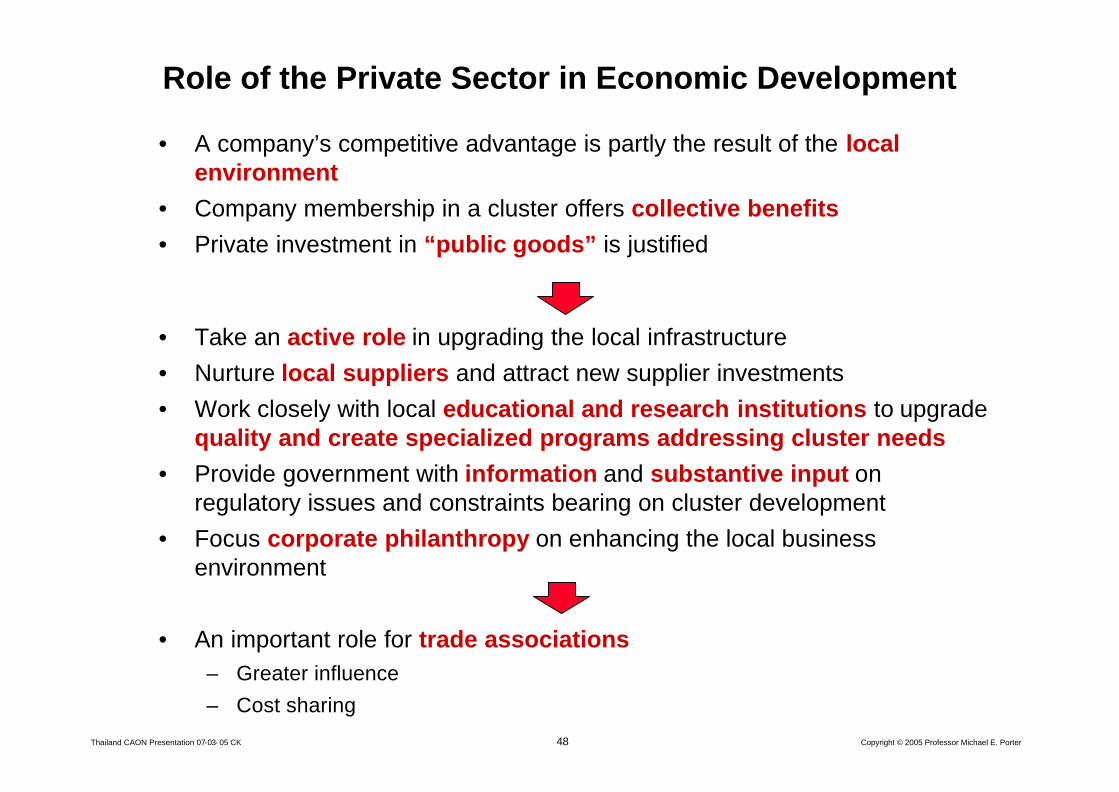
Role of the Private Sector in Economic Development
• A company’s competitive advantage is partly the result of the local environment
• Company membership in a cluster offers collective benefits• Private investment in “public goods” is justified
• Take an active role in upgrading the local infrastructure• Nurture local suppliers and attract new supplier investments • Work closely with local educational and research institutions to upgrade
quality and create specialized programs addressing cluster needs• Provide government with information and substantive input on
regulatory issues and constraints bearing on cluster development• Focus corporate philanthropy on enhancing the local business
environment
• An important role for trade associations– Greater influence
– Cost sharing
49Thailand CAON Presentation 07-03- 05 CK Copyright © 2005 Professor Michael E. Porter
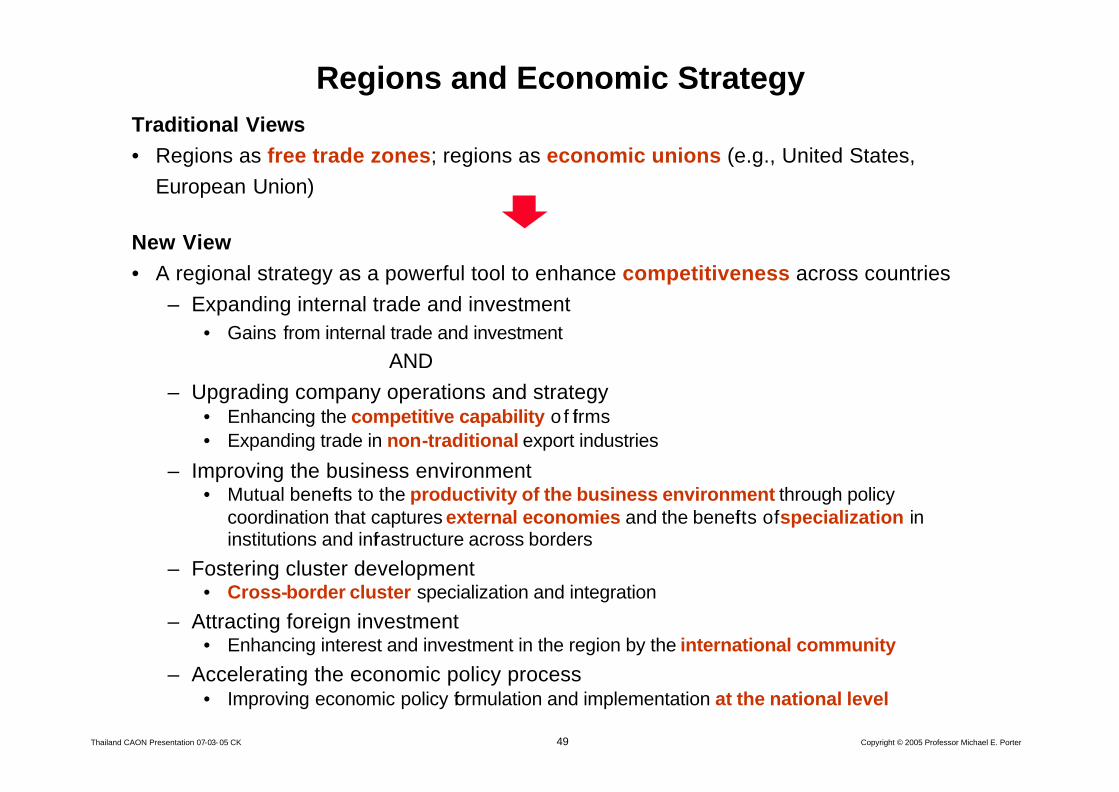
Regions and Economic StrategyTraditional Views• Regions as free trade zones; regions as economic unions (e.g., United States, European Union)
New View• A regional strategy as a powerful tool to enhance competitiveness across countries
– Expanding internal trade and investment• Gains from internal trade and investment
AND– Upgrading company operations and strategy
• Enhancing the competitive capability o f firms• Expanding trade in non-traditional export industries
– Improving the business environment• Mutual benefits to the productivity of the business environment through policy
coordination that captures external economies and the benefits of specialization in institutions and infrastructure across borders
– Fostering cluster development• Cross-border cluster specialization and integration
– Attracting foreign investment• Enhancing interest and investment in the region by the international community
– Accelerating the economic policy process• Improving economic policy formulation and implementation at the national level
50Thailand CAON Presentation 07-03- 05 CK Copyright © 2005 Professor Michael E. Porter
Roads
Airports
Ports
Logistic Corridor
Central American Logistical CorridorSchematic Design
51Thailand CAON Presentation 07-03- 05 CK Copyright © 2005 Professor Michael E. Porter
Thailand’s Competitiveness in 2005
• Thailand has made a number of right steps towards improving the foundations of its competitiveness
• The critical barriers to overcome – in public sector reform as well as in business environment upgrading – are political, not financial
• The government, based with a majority unique in the country’s history, has the opportunity and obligation to aggressively pursue further competitiveness upgrading