Embed Size (px)
Citation preview
THIS REPORT CONTAINS ASSESSMENTS OF COMMODITY AND TRADE ISSUES MADE BY
USDA STAFF AND NOT NECESSARILY STATEMENTS OF OFFICIAL U.S. GOVERNMENT
POLICY
Date:
GAIN Report Number:
Approved By:
Prepared By:
Report Highlights:
Growing feed demand driven by expanding livestock and poultry sectors is expected to generate
increased import demand for soybeans in MY2017/18 and soybean meal in MY2016/17 and 2017/18.
While many soybean oil crushing plants are profitable, most palm oil crushing plants are struggling due
to high supply costs and low capacity utilization causing many of them to operate at a loss.
Sakchai Preechajarn, Agricultural Specialist
Paul Welcher, Agricultural Attaché
2017
Oilseeds and Products Annual
Thailand
TH7040
3/31/2017
Required Report - public distribution
Executive Summary:
Thailand’s feed demand is expected to experience 6-7 percent growth in MY2016/17, followed by an
additional 3-4 percent growth in MY2017/18. This growth comes from favorable prospects for exports
of chicken meat and pork meat as well as increased domestic meat consumption.
Due to low domestic production, nearly all domestic consumption of soybeans and soybean meal in
Thailand is met by imported supplies. Domestic consumption of soybeans (and soybean imports) is
likely to decline in MY2016/17 because of reduced use of full fat soybeans in feed rations, given their
reduced price competitiveness against other feed ingredients such as soybean meal. Domestic
consumption of soybean meal, however, is expected to increase in MY2016/17. Thus, growing feed
demand means that in MY2017/18 domestic consumption (and imports) of full fat soybeans and
soybean meal, as a combined category, is expected to increase.
Soybean oil production is expected to increase in MY 2016/17 and MY 2017/18.
Fish meal production in Thailand is forecasted to continue to decline in 2017 and 2018 due to ongoing
fishing restrictions. Thailand is expected to import 80,000 MT of fish meal in 2017 and 100,000 MT in
2018 in response to reduced domestic supplies and growth in feed demand particularly for shrimp
production.
Due to improved weather conditions in the second half of 2016 and a favorable forecast for 2017, crude
palm oil (CPO) production is estimated to recover to 2.0 MMT in 2017 and should further grow to 2.2
MMT in 2018.
Thai palm oil crushing plants are struggling with higher supply costs causing many of them to operate at
a loss. In 2016, palm oil crushing plants are operating on average at only 30-35 percent of their
production capacity. Fierce competition for fresh supplies have caused prices for palm fresh fruit bunch
(FFB) supplies have pushed up prices the past couple years. In addition, irregular weather (drought)
and improper fruit handling during harvest and transport has led Thailand’s average oil extraction rates
(OER) to be much lower than other large producing countries in the region like Indonesia and
Malaysia. The low capacity utilization is expected to continue during 2017 and 2018 despite increased
supplies of FFB.
Thai import regulations for oilseeds and vegetable oil remain unchanged. Imports of soybeans, soybean
meal, fish meal, soybean oil, and palm oil are affected by tariff-rate quotas and ad hoc import controls.
SECTION I: SITUATION AND OUTLOOK
1.1. Soybeans
Soybean production in Thailand should remain below 60,000 metric tons (MT) in crop years (CY)
2016/17 and CY 2017/18 due to low yields and lower profitability compared to competing crops like
corn and off-season rice. The government still bans the domestic production of all transgenic or biotech
plant varieties, including soybeans.
Total soybean domestic consumption is forecast to drop by 8 percent in MY2016/17 after a surge in the
last two marketing years as changes in global prices for soybeans and soybean meal will cause the use
of full fat soybeans to be less attractive for feed manufacturing in Thailand. The relatively low global
prices for soybeans caused feed mills to heavily replace soybean meal with full fat soybeans in
MY2014/15 and MY2015/16. However, soybean domestic consumption should recover by 6 percent in
MY2017/18 as the growing livestock and poultry industries translate into increased demand for full fat
soybeans.
Soybean imports, after experiencing high growth in MY2014/15 (34 percent) and MY2015/16 (16
percent), are estimated to decline by 7 percent to 2.6 million metric tons (MMT) in MY2016/17 due to
lower use of full fat soybeans. Soybean imports are forecast to recover to 2.7 MMT in
MY2017/18. Soybeans for crushing, which constitute the largest portion of domestic use, are forecast
to increase to 1.9 MMT in MY 2017/18 from 1.85 MMT in MY2016/17. Typically, a few companies in
Thailand such as Thai Vegetable Oil (TVO), Thanakorn Vegetable Oil Products, and Porn Amnuay Sub
Vegetable Oil dominate the soybean oil crushing industry. According to sources, these three soybean
oil crushers are running at 50-55 percent of total capacity of 3.7 MMT per annum. Thailand does not
have any restrictions on the import of biotech soybeans for food, feed, or manufacturing purposes.
Since Thai soybean oil processors have come to believe that soybeans from Brazil have relatively higher
protein levels than those from the United States. Thus, the U.S. market share of Thailand’s soybean
imports fluctuates depending on the availability of supply from Brazil and Argentina and the difference
in relative prices. As U.S. soybeans are competitively priced compared to Brazilian and Argentinian
soybeans, the U.S. market share of soybean imports is forecast to increase to 31 percent in MY2016/17
from 17 percent in MY 2015/16. In MY2017/18, the U.S. market share is expected to be between 20-25
percent.
Industry sources estimate that food-grade soybean imports will continue to increase in MY2016/17 and
MY2017/18 to total 80,000-90,000 MT as demand from the Thai food industry, especially soy milk
producers, expands. Canada and the United States are the only two suppliers for this market segment.
The food industry prefers domestic soybeans over imported beans due to their freshness and “biotech-
free” status. However, with growing demand and a downward trend in domestic supplies, processors
are increasingly relying on imported soybeans to meet their needs.
Stock carryovers for soybeans in MY2016/17 and MY2017/18 will remain relatively unchanged and
stay set at one or two months of utilization.
According to its World Trade Organization (WTO) commitments, Thailand has a soybean tariff rate
quota (TRQ) of 10,922 MT, with an in-quota tariff of 20 percent and an out-of-quota tariff of 80
percent. In January 2017, the Ministry of Commerce announced the implementation of a new 3 year
soybean import policy to last from 2017 to 2019. In principle, the content of this policy remains
unchanged from the previous Thai soybean import policy which allowed unlimited imports at a zero
percent tariff for WTO member countries. However, under this policy, only 8 trade associations and 16
food processing companies qualify as importers. These importers are required to be members of the
associations and purchase domestic soybeans at the predetermined prices of 17.50 baht/kg ($500/MT)
for oil-crushing, 17.75 baht/kg ($507/MT) for feed, and 19.75 baht/kg ($564/MT) for human food
processing (i.e., soy sauce, tofu, soy milk, etc.).
1.2. Oil Meal
An Overview of Feed Demand in Thailand
Post forecasts that Thailand’s feed demand in MY2016/17 will be 6-7 percent higher than MY2015/16
due to the continued growth of chicken and pork exports as well as increased domestic consumption of
meat. Feed demand should continue to grow by 3-4 percent in MY2017/18.
The Thai Feed Mill Association (TFMA) also anticipates that Thailand’s total feed demand will grow
this year, forecasting 5.3 percent growth in 2017 to 19.6 MMT from 18.6 MMT in 2016.
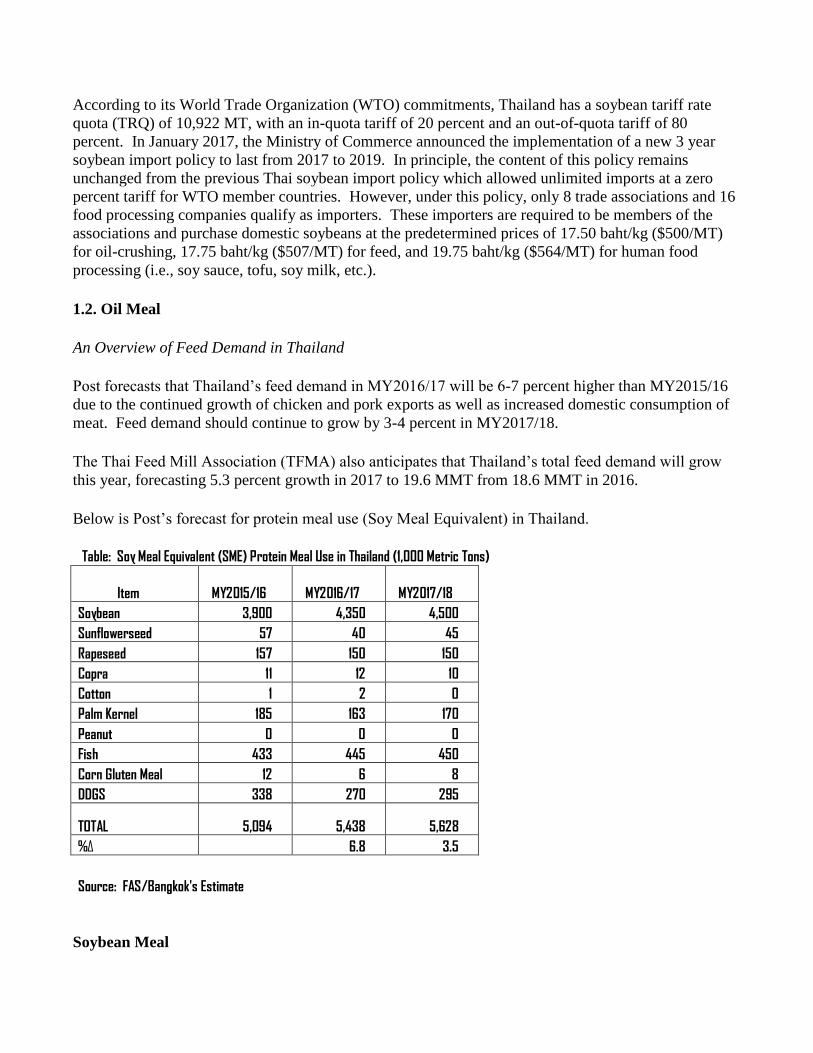
Below is Post’s forecast for protein meal use (Soy Meal Equivalent) in Thailand.
Table: Soy Meal Equivalent (SME) Protein Meal Use in Thailand (1,000 Metric Tons)
Item MY2015/16 MY2016/17 MY2017/18
Soybean 3,900 4,350 4,500
Sunflowerseed 57 40 45
Rapeseed 157 150 150
Copra 11 12 10
Cotton 1 2 0
Palm Kernel 185 163 170
Peanut 0 0 0
Fish 433 445 450
Corn Gluten Meal 12 6 8
DDGS 338 270 295
TOTAL 5,094 5,438 5,628
%Δ 6.8 3.5
Source: FAS/Bangkok's Estimate
Soybean Meal
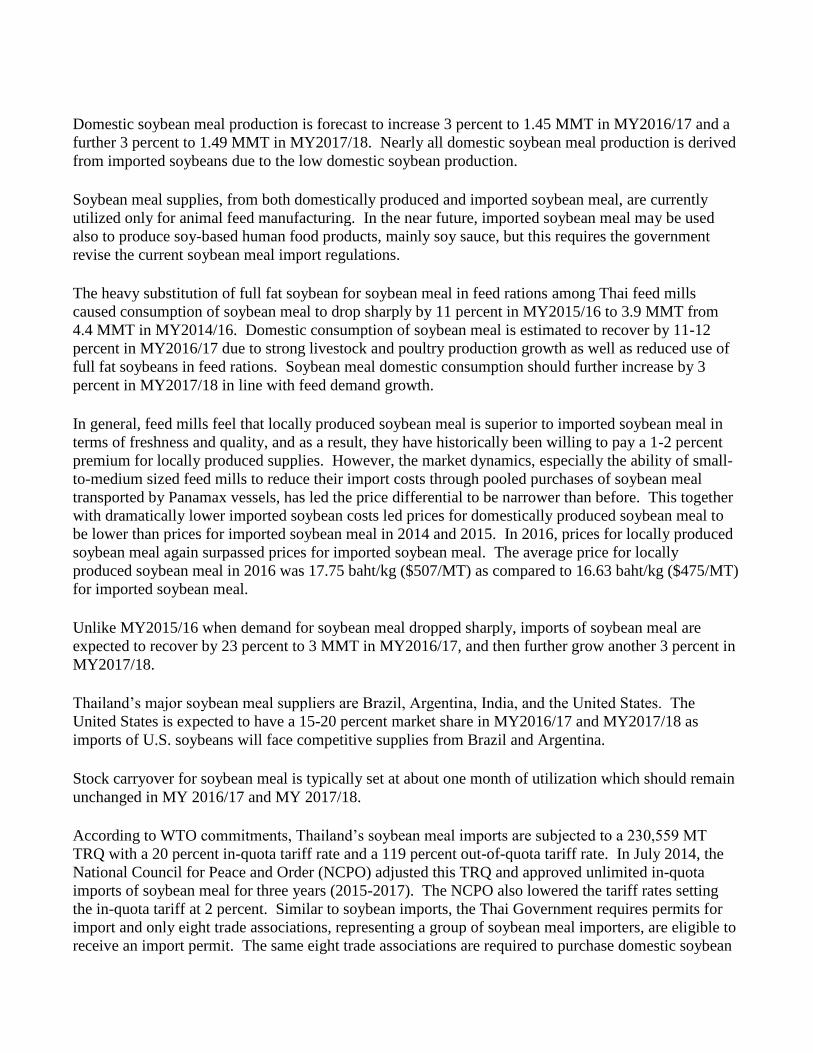
Domestic soybean meal production is forecast to increase 3 percent to 1.45 MMT in MY2016/17 and a
further 3 percent to 1.49 MMT in MY2017/18. Nearly all domestic soybean meal production is derived
from imported soybeans due to the low domestic soybean production.
Soybean meal supplies, from both domestically produced and imported soybean meal, are currently
utilized only for animal feed manufacturing. In the near future, imported soybean meal may be used
also to produce soy-based human food products, mainly soy sauce, but this requires the government
revise the current soybean meal import regulations.
The heavy substitution of full fat soybean for soybean meal in feed rations among Thai feed mills
caused consumption of soybean meal to drop sharply by 11 percent in MY2015/16 to 3.9 MMT from
4.4 MMT in MY2014/16. Domestic consumption of soybean meal is estimated to recover by 11-12
percent in MY2016/17 due to strong livestock and poultry production growth as well as reduced use of
full fat soybeans in feed rations. Soybean meal domestic consumption should further increase by 3
percent in MY2017/18 in line with feed demand growth.
In general, feed mills feel that locally produced soybean meal is superior to imported soybean meal in
terms of freshness and quality, and as a result, they have historically been willing to pay a 1-2 percent
premium for locally produced supplies. However, the market dynamics, especially the ability of small-
to-medium sized feed mills to reduce their import costs through pooled purchases of soybean meal
transported by Panamax vessels, has led the price differential to be narrower than before. This together
with dramatically lower imported soybean costs led prices for domestically produced soybean meal to
be lower than prices for imported soybean meal in 2014 and 2015. In 2016, prices for locally produced
soybean meal again surpassed prices for imported soybean meal. The average price for locally
produced soybean meal in 2016 was 17.75 baht/kg ($507/MT) as compared to 16.63 baht/kg ($475/MT)
for imported soybean meal.
Unlike MY2015/16 when demand for soybean meal dropped sharply, imports of soybean meal are
expected to recover by 23 percent to 3 MMT in MY2016/17, and then further grow another 3 percent in
MY2017/18.
Thailand’s major soybean meal suppliers are Brazil, Argentina, India, and the United States. The
United States is expected to have a 15-20 percent market share in MY2016/17 and MY2017/18 as
imports of U.S. soybeans will face competitive supplies from Brazil and Argentina.
Stock carryover for soybean meal is typically set at about one month of utilization which should remain
unchanged in MY 2016/17 and MY 2017/18.
According to WTO commitments, Thailand’s soybean meal imports are subjected to a 230,559 MT
TRQ with a 20 percent in-quota tariff rate and a 119 percent out-of-quota tariff rate. In July 2014, the
National Council for Peace and Order (NCPO) adjusted this TRQ and approved unlimited in-quota
imports of soybean meal for three years (2015-2017). The NCPO also lowered the tariff rates setting
the in-quota tariff at 2 percent. Similar to soybean imports, the Thai Government requires permits for
import and only eight trade associations, representing a group of soybean meal importers, are eligible to
receive an import permit. The same eight trade associations are required to purchase domestic soybean
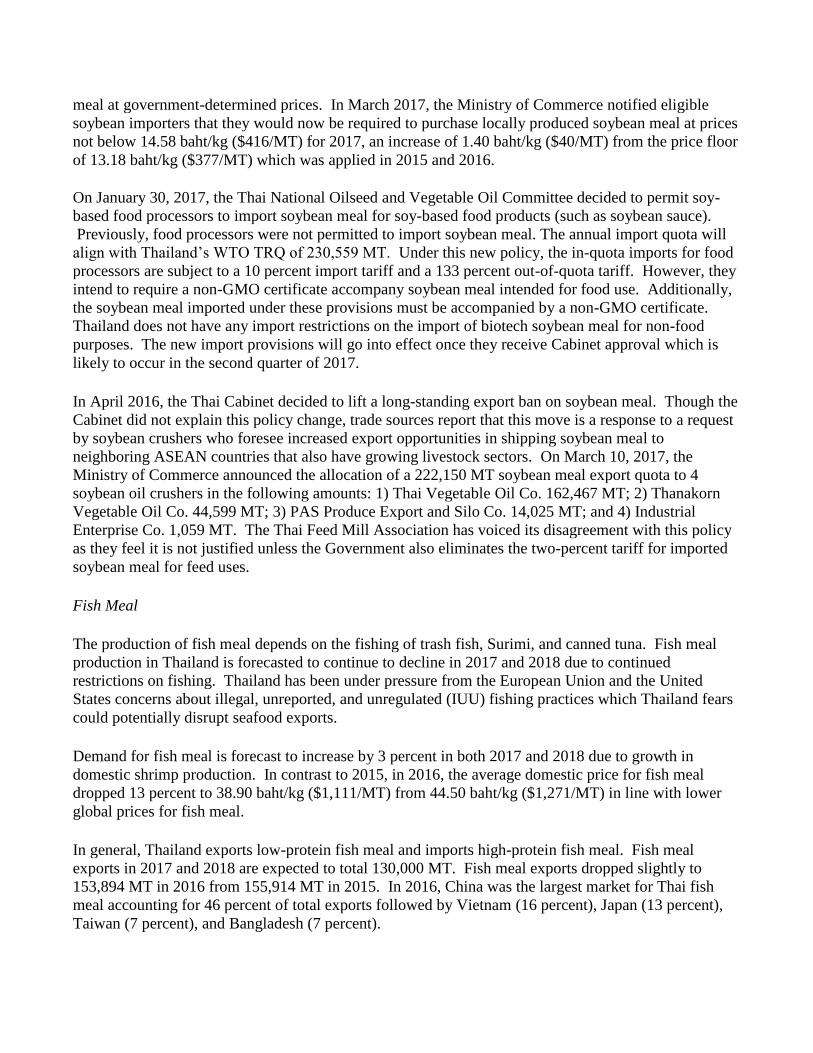
meal at government-determined prices. In March 2017, the Ministry of Commerce notified eligible
soybean importers that they would now be required to purchase locally produced soybean meal at prices
not below 14.58 baht/kg ($416/MT) for 2017, an increase of 1.40 baht/kg ($40/MT) from the price floor
of 13.18 baht/kg ($377/MT) which was applied in 2015 and 2016.
On January 30, 2017, the Thai National Oilseed and Vegetable Oil Committee decided to permit soy-
based food processors to import soybean meal for soy-based food products (such as soybean sauce).
Previously, food processors were not permitted to import soybean meal. The annual import quota will
align with Thailand’s WTO TRQ of 230,559 MT. Under this new policy, the in-quota imports for food
processors are subject to a 10 percent import tariff and a 133 percent out-of-quota tariff. However, they
intend to require a non-GMO certificate accompany soybean meal intended for food use. Additionally,
the soybean meal imported under these provisions must be accompanied by a non-GMO certificate.
Thailand does not have any import restrictions on the import of biotech soybean meal for non-food
purposes. The new import provisions will go into effect once they receive Cabinet approval which is
likely to occur in the second quarter of 2017.
In April 2016, the Thai Cabinet decided to lift a long-standing export ban on soybean meal. Though the
Cabinet did not explain this policy change, trade sources report that this move is a response to a request
by soybean crushers who foresee increased export opportunities in shipping soybean meal to
neighboring ASEAN countries that also have growing livestock sectors. On March 10, 2017, the
Ministry of Commerce announced the allocation of a 222,150 MT soybean meal export quota to 4
soybean oil crushers in the following amounts: 1) Thai Vegetable Oil Co. 162,467 MT; 2) Thanakorn
Vegetable Oil Co. 44,599 MT; 3) PAS Produce Export and Silo Co. 14,025 MT; and 4) Industrial
Enterprise Co. 1,059 MT. The Thai Feed Mill Association has voiced its disagreement with this policy
as they feel it is not justified unless the Government also eliminates the two-percent tariff for imported
soybean meal for feed uses.
Fish Meal
The production of fish meal depends on the fishing of trash fish, Surimi, and canned tuna. Fish meal
production in Thailand is forecasted to continue to decline in 2017 and 2018 due to continued
restrictions on fishing. Thailand has been under pressure from the European Union and the United
States concerns about illegal, unreported, and unregulated (IUU) fishing practices which Thailand fears
could potentially disrupt seafood exports.
Demand for fish meal is forecast to increase by 3 percent in both 2017 and 2018 due to growth in
domestic shrimp production. In contrast to 2015, in 2016, the average domestic price for fish meal
dropped 13 percent to 38.90 baht/kg ($1,111/MT) from 44.50 baht/kg ($1,271/MT) in line with lower
global prices for fish meal.
In general, Thailand exports low-protein fish meal and imports high-protein fish meal. Fish meal
exports in 2017 and 2018 are expected to total 130,000 MT. Fish meal exports dropped slightly to
153,894 MT in 2016 from 155,914 MT in 2015. In 2016, China was the largest market for Thai fish
meal accounting for 46 percent of total exports followed by Vietnam (16 percent), Japan (13 percent),
Taiwan (7 percent), and Bangladesh (7 percent).
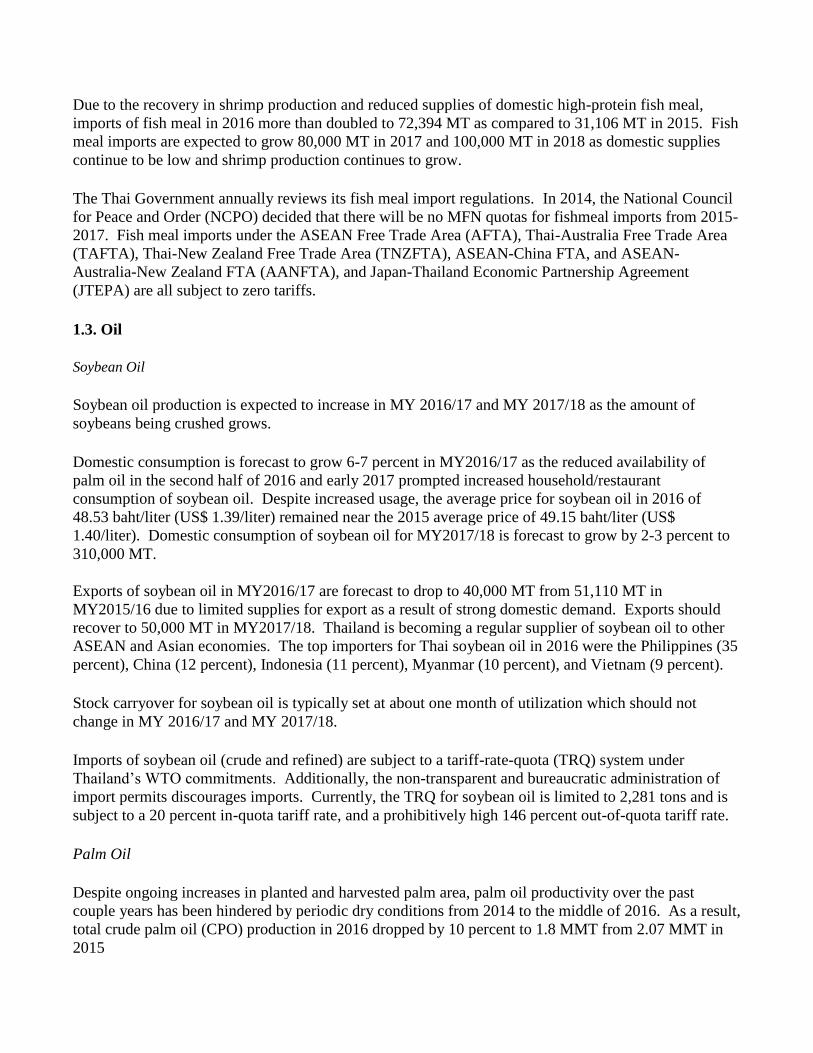
Due to the recovery in shrimp production and reduced supplies of domestic high-protein fish meal,
imports of fish meal in 2016 more than doubled to 72,394 MT as compared to 31,106 MT in 2015. Fish
meal imports are expected to grow 80,000 MT in 2017 and 100,000 MT in 2018 as domestic supplies
continue to be low and shrimp production continues to grow.
The Thai Government annually reviews its fish meal import regulations. In 2014, the National Council
for Peace and Order (NCPO) decided that there will be no MFN quotas for fishmeal imports from 2015-
2017. Fish meal imports under the ASEAN Free Trade Area (AFTA), Thai-Australia Free Trade Area
(TAFTA), Thai-New Zealand Free Trade Area (TNZFTA), ASEAN-China FTA, and ASEAN-
Australia-New Zealand FTA (AANFTA), and Japan-Thailand Economic Partnership Agreement
(JTEPA) are all subject to zero tariffs.
1.3. Oil
Soybean Oil
Soybean oil production is expected to increase in MY 2016/17 and MY 2017/18 as the amount of
soybeans being crushed grows.
Domestic consumption is forecast to grow 6-7 percent in MY2016/17 as the reduced availability of
palm oil in the second half of 2016 and early 2017 prompted increased household/restaurant
consumption of soybean oil. Despite increased usage, the average price for soybean oil in 2016 of
48.53 baht/liter (US$ 1.39/liter) remained near the 2015 average price of 49.15 baht/liter (US$
1.40/liter). Domestic consumption of soybean oil for MY2017/18 is forecast to grow by 2-3 percent to
310,000 MT.
Exports of soybean oil in MY2016/17 are forecast to drop to 40,000 MT from 51,110 MT in
MY2015/16 due to limited supplies for export as a result of strong domestic demand. Exports should
recover to 50,000 MT in MY2017/18. Thailand is becoming a regular supplier of soybean oil to other
ASEAN and Asian economies. The top importers for Thai soybean oil in 2016 were the Philippines (35
percent), China (12 percent), Indonesia (11 percent), Myanmar (10 percent), and Vietnam (9 percent).
Stock carryover for soybean oil is typically set at about one month of utilization which should not
change in MY 2016/17 and MY 2017/18.
Imports of soybean oil (crude and refined) are subject to a tariff-rate-quota (TRQ) system under
Thailand’s WTO commitments. Additionally, the non-transparent and bureaucratic administration of
import permits discourages imports. Currently, the TRQ for soybean oil is limited to 2,281 tons and is
subject to a 20 percent in-quota tariff rate, and a prohibitively high 146 percent out-of-quota tariff rate.
Palm Oil
Despite ongoing increases in planted and harvested palm area, palm oil productivity over the past
couple years has been hindered by periodic dry conditions from 2014 to the middle of 2016. As a result,
total crude palm oil (CPO) production in 2016 dropped by 10 percent to 1.8 MMT from 2.07 MMT in
2015
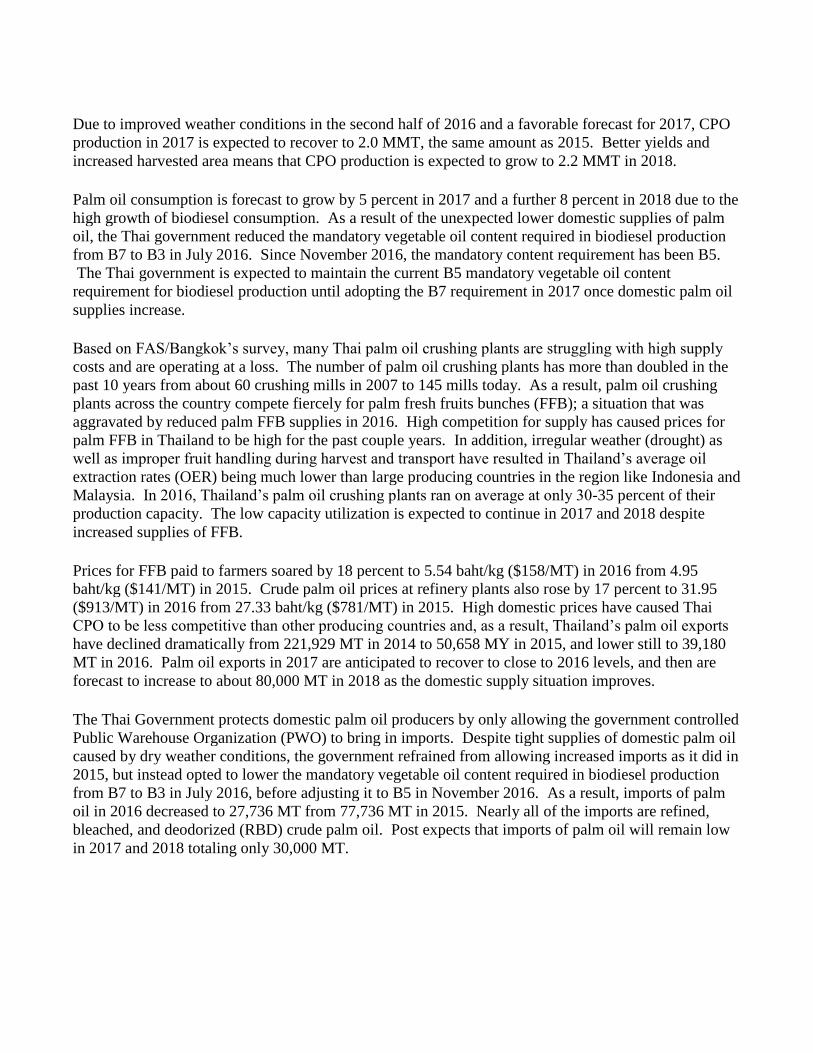
Due to improved weather conditions in the second half of 2016 and a favorable forecast for 2017, CPO
production in 2017 is expected to recover to 2.0 MMT, the same amount as 2015. Better yields and
increased harvested area means that CPO production is expected to grow to 2.2 MMT in 2018.
Palm oil consumption is forecast to grow by 5 percent in 2017 and a further 8 percent in 2018 due to the
high growth of biodiesel consumption. As a result of the unexpected lower domestic supplies of palm
oil, the Thai government reduced the mandatory vegetable oil content required in biodiesel production
from B7 to B3 in July 2016. Since November 2016, the mandatory content requirement has been B5.
The Thai government is expected to maintain the current B5 mandatory vegetable oil content
requirement for biodiesel production until adopting the B7 requirement in 2017 once domestic palm oil
supplies increase.
Based on FAS/Bangkok’s survey, many Thai palm oil crushing plants are struggling with high supply
costs and are operating at a loss. The number of palm oil crushing plants has more than doubled in the
past 10 years from about 60 crushing mills in 2007 to 145 mills today. As a result, palm oil crushing
plants across the country compete fiercely for palm fresh fruits bunches (FFB); a situation that was
aggravated by reduced palm FFB supplies in 2016. High competition for supply has caused prices for
palm FFB in Thailand to be high for the past couple years. In addition, irregular weather (drought) as
well as improper fruit handling during harvest and transport have resulted in Thailand’s average oil
extraction rates (OER) being much lower than large producing countries in the region like Indonesia and
Malaysia. In 2016, Thailand’s palm oil crushing plants ran on average at only 30-35 percent of their
production capacity. The low capacity utilization is expected to continue in 2017 and 2018 despite
increased supplies of FFB.
Prices for FFB paid to farmers soared by 18 percent to 5.54 baht/kg ($158/MT) in 2016 from 4.95
baht/kg ($141/MT) in 2015. Crude palm oil prices at refinery plants also rose by 17 percent to 31.95
($913/MT) in 2016 from 27.33 baht/kg ($781/MT) in 2015. High domestic prices have caused Thai
CPO to be less competitive than other producing countries and, as a result, Thailand’s palm oil exports
have declined dramatically from 221,929 MT in 2014 to 50,658 MY in 2015, and lower still to 39,180
MT in 2016. Palm oil exports in 2017 are anticipated to recover to close to 2016 levels, and then are
forecast to increase to about 80,000 MT in 2018 as the domestic supply situation improves.
The Thai Government protects domestic palm oil producers by only allowing the government controlled
Public Warehouse Organization (PWO) to bring in imports. Despite tight supplies of domestic palm oil
caused by dry weather conditions, the government refrained from allowing increased imports as it did in
2015, but instead opted to lower the mandatory vegetable oil content required in biodiesel production
from B7 to B3 in July 2016, before adjusting it to B5 in November 2016. As a result, imports of palm
oil in 2016 decreased to 27,736 MT from 77,736 MT in 2015. Nearly all of the imports are refined,
bleached, and deodorized (RBD) crude palm oil. Post expects that imports of palm oil will remain low
in 2017 and 2018 totaling only 30,000 MT.
SECTION II: STATISTICAL TABLES
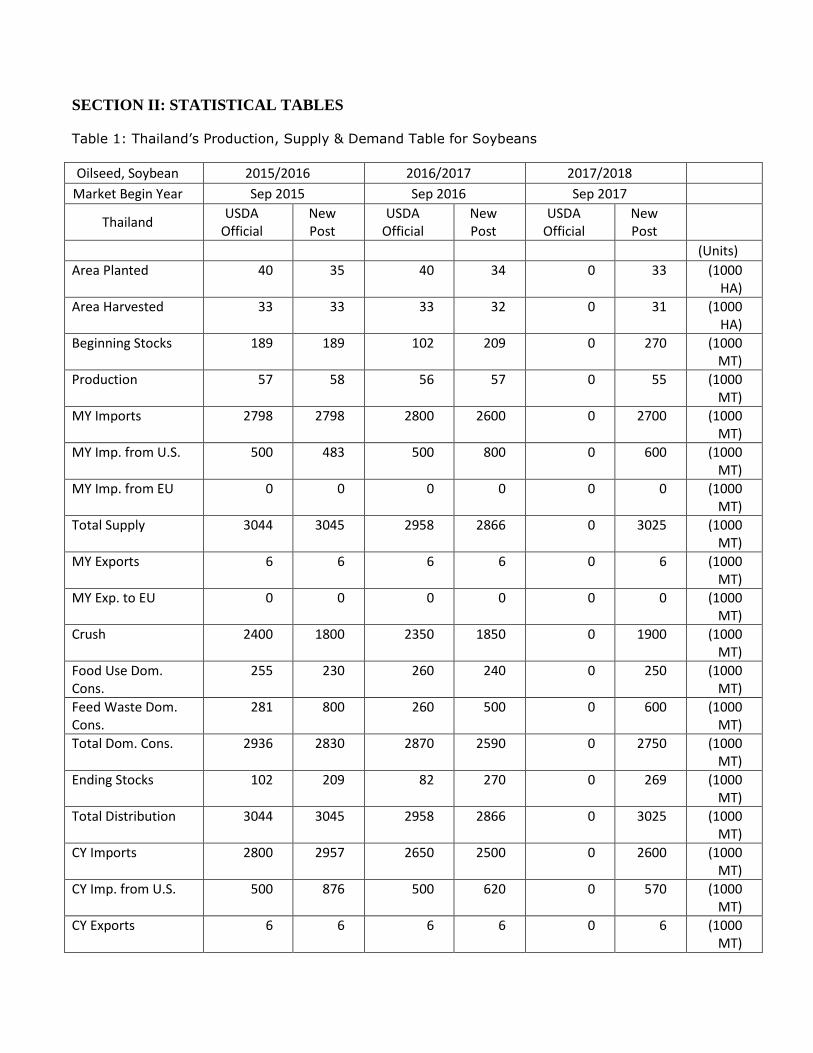
Table 1: Thailand’s Production, Supply & Demand Table for Soybeans
Oilseed, Soybean 2015/2016 2016/2017 2017/2018
Market Begin Year Sep 2015 Sep 2016 Sep 2017
Thailand USDA
Official New Post
USDA Official
New Post
USDA Official
New Post
(Units)
Area Planted 40 35 40 34 0 33 (1000 HA)
Area Harvested 33 33 33 32 0 31 (1000 HA)
Beginning Stocks 189 189 102 209 0 270 (1000 MT)
Production 57 58 56 57 0 55 (1000 MT)
MY Imports 2798 2798 2800 2600 0 2700 (1000 MT)
MY Imp. from U.S. 500 483 500 800 0 600 (1000 MT)
MY Imp. from EU 0 0 0 0 0 0 (1000 MT)
Total Supply 3044 3045 2958 2866 0 3025 (1000 MT)
MY Exports 6 6 6 6 0 6 (1000 MT)
MY Exp. to EU 0 0 0 0 0 0 (1000 MT)
Crush 2400 1800 2350 1850 0 1900 (1000 MT)
Food Use Dom. Cons.
255 230 260 240 0 250 (1000 MT)
Feed Waste Dom. Cons.
281 800 260 500 0 600 (1000 MT)
Total Dom. Cons. 2936 2830 2870 2590 0 2750 (1000 MT)
Ending Stocks 102 209 82 270 0 269 (1000 MT)
Total Distribution 3044 3045 2958 2866 0 3025 (1000 MT)
CY Imports 2800 2957 2650 2500 0 2600 (1000 MT)
CY Imp. from U.S. 500 876 500 620 0 570 (1000 MT)
CY Exports 6 6 6 6 0 6 (1000 MT)

CY Exp. to U.S. 0 0 0 0 0 0 (1000 MT)
Yield 1.7273 1.7576 1.697 1.7813 0 1.7742 (MT/HA)
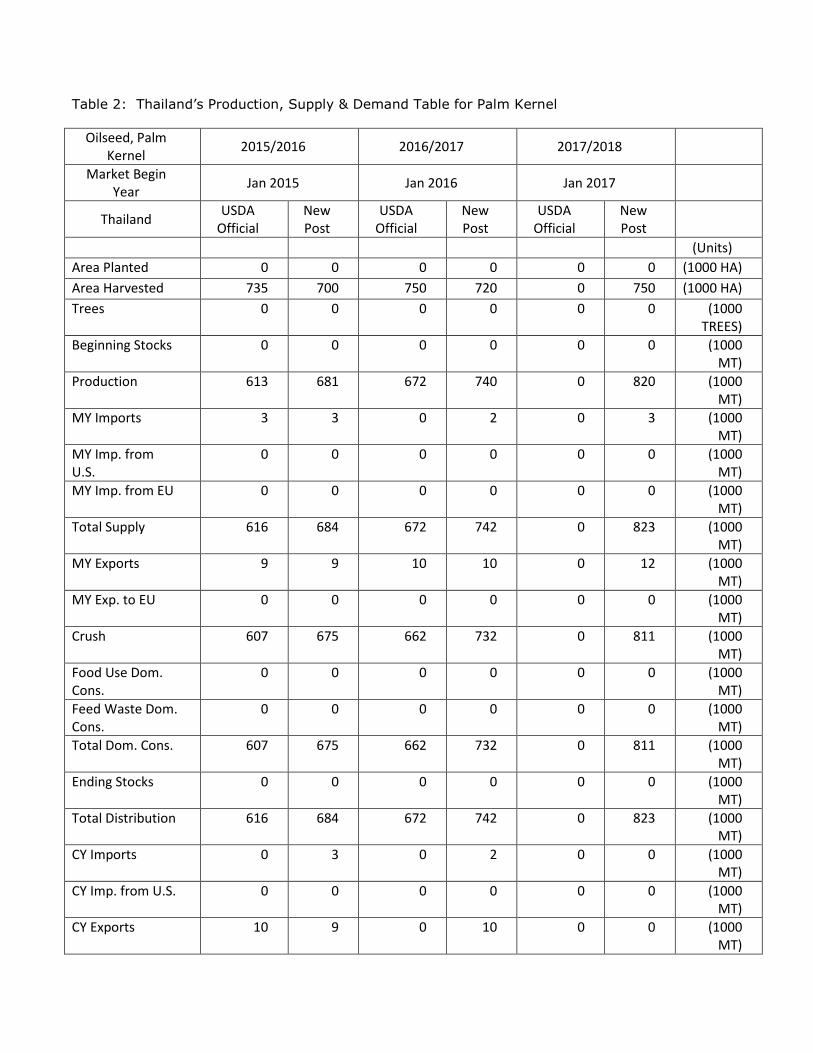
Table 2: Thailand’s Production, Supply & Demand Table for Palm Kernel
Oilseed, Palm Kernel
2015/2016 2016/2017 2017/2018
Market Begin Year
Jan 2015 Jan 2016 Jan 2017
Thailand USDA
Official New Post
USDA Official
New Post
USDA Official
New Post
(Units)
Area Planted 0 0 0 0 0 0 (1000 HA)
Area Harvested 735 700 750 720 0 750 (1000 HA)
Trees 0 0 0 0 0 0 (1000 TREES)
Beginning Stocks 0 0 0 0 0 0 (1000 MT)
Production 613 681 672 740 0 820 (1000 MT)
MY Imports 3 3 0 2 0 3 (1000 MT)
MY Imp. from U.S.
0 0 0 0 0 0 (1000 MT)
MY Imp. from EU 0 0 0 0 0 0 (1000 MT)
Total Supply 616 684 672 742 0 823 (1000 MT)
MY Exports 9 9 10 10 0 12 (1000 MT)
MY Exp. to EU 0 0 0 0 0 0 (1000 MT)
Crush 607 675 662 732 0 811 (1000 MT)
Food Use Dom. Cons.
0 0 0 0 0 0 (1000 MT)
Feed Waste Dom. Cons.
0 0 0 0 0 0 (1000 MT)
Total Dom. Cons. 607 675 662 732 0 811 (1000 MT)
Ending Stocks 0 0 0 0 0 0 (1000 MT)
Total Distribution 616 684 672 742 0 823 (1000 MT)
CY Imports 0 3 0 2 0 0 (1000 MT)
CY Imp. from U.S. 0 0 0 0 0 0 (1000 MT)
CY Exports 10 9 0 10 0 0 (1000 MT)

CY Exp. to U.S. 0 0 0 0 0 0 (1000 MT)
Yield 0.834 0.9729 0.896 1.0278 0 1.0933 (MT/HA)
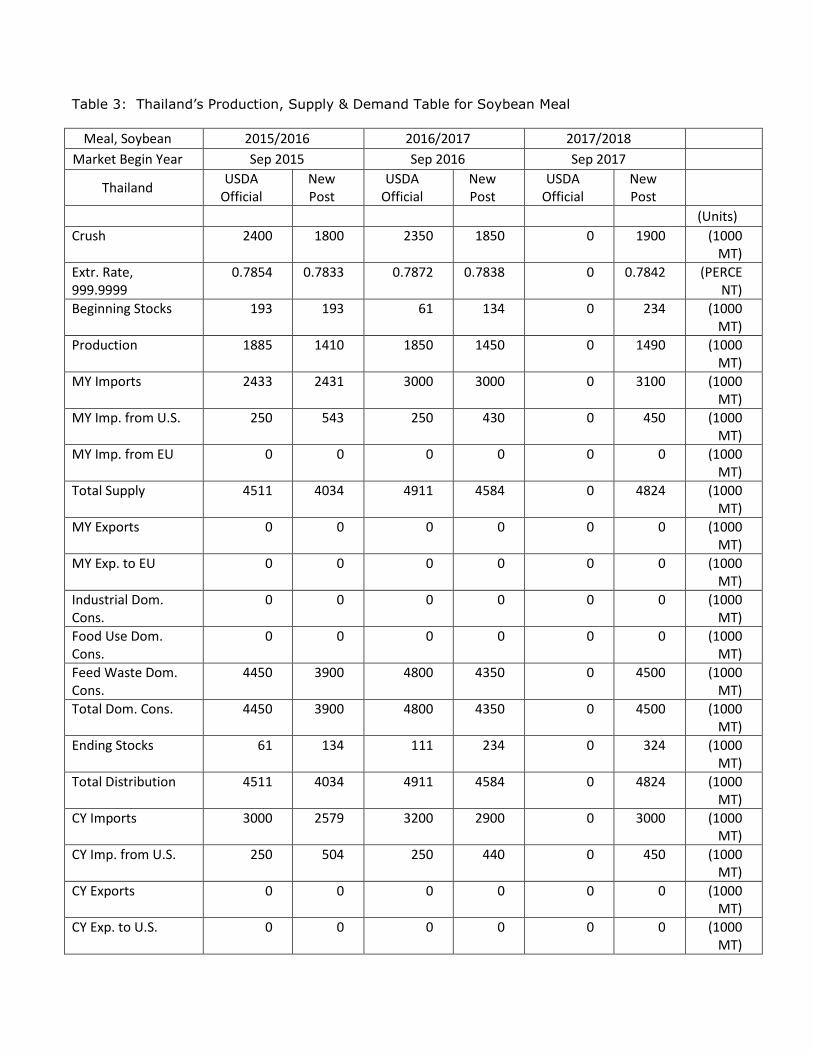
Table 3: Thailand’s Production, Supply & Demand Table for Soybean Meal
Meal, Soybean 2015/2016 2016/2017 2017/2018
Market Begin Year Sep 2015 Sep 2016 Sep 2017
Thailand USDA
Official New Post
USDA Official
New Post
USDA Official
New Post
(Units)
Crush 2400 1800 2350 1850 0 1900 (1000 MT)
Extr. Rate, 999.9999
0.7854 0.7833 0.7872 0.7838 0 0.7842 (PERCENT)
Beginning Stocks 193 193 61 134 0 234 (1000 MT)
Production 1885 1410 1850 1450 0 1490 (1000 MT)
MY Imports 2433 2431 3000 3000 0 3100 (1000 MT)
MY Imp. from U.S. 250 543 250 430 0 450 (1000 MT)
MY Imp. from EU 0 0 0 0 0 0 (1000 MT)
Total Supply 4511 4034 4911 4584 0 4824 (1000 MT)
MY Exports 0 0 0 0 0 0 (1000 MT)
MY Exp. to EU 0 0 0 0 0 0 (1000 MT)
Industrial Dom. Cons.
0 0 0 0 0 0 (1000 MT)
Food Use Dom. Cons.
0 0 0 0 0 0 (1000 MT)
Feed Waste Dom. Cons.
4450 3900 4800 4350 0 4500 (1000 MT)
Total Dom. Cons. 4450 3900 4800 4350 0 4500 (1000 MT)
Ending Stocks 61 134 111 234 0 324 (1000 MT)
Total Distribution 4511 4034 4911 4584 0 4824 (1000 MT)
CY Imports 3000 2579 3200 2900 0 3000 (1000 MT)
CY Imp. from U.S. 250 504 250 440 0 450 (1000 MT)
CY Exports 0 0 0 0 0 0 (1000 MT)
CY Exp. to U.S. 0 0 0 0 0 0 (1000 MT)
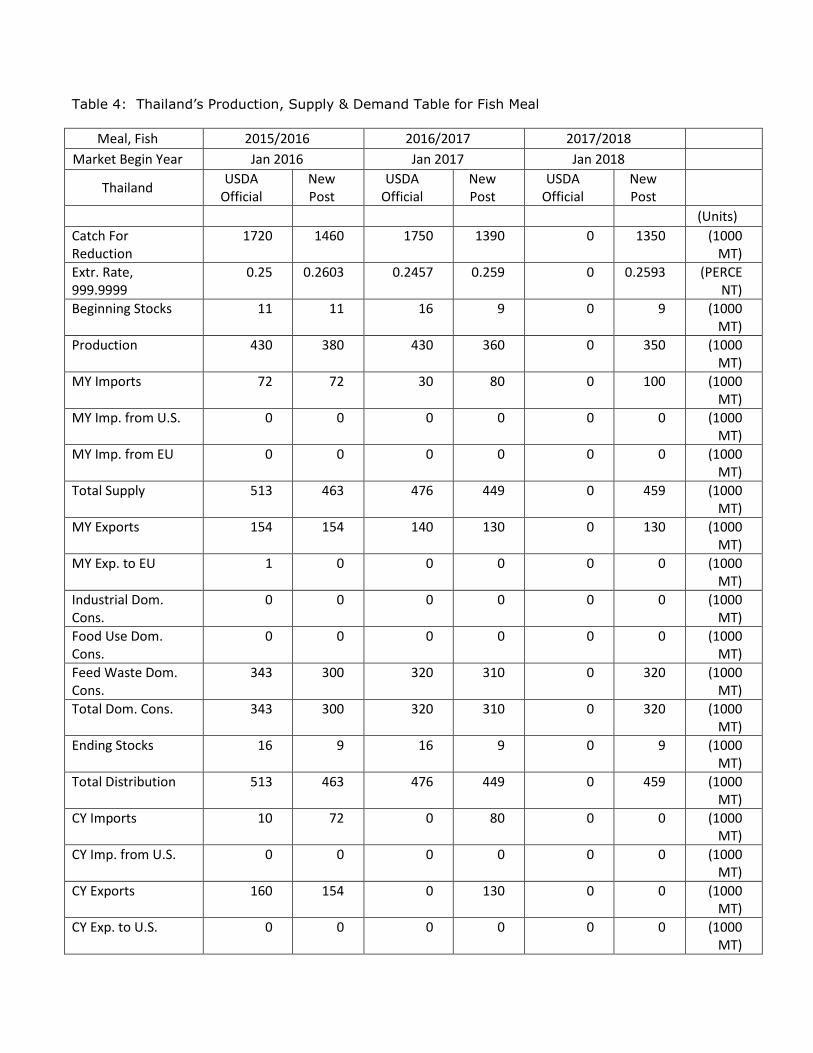
Table 4: Thailand’s Production, Supply & Demand Table for Fish Meal
Meal, Fish 2015/2016 2016/2017 2017/2018
Market Begin Year Jan 2016 Jan 2017 Jan 2018
Thailand USDA
Official New Post
USDA Official
New Post
USDA Official
New Post
(Units)
Catch For Reduction
1720 1460 1750 1390 0 1350 (1000 MT)
Extr. Rate, 999.9999
0.25 0.2603 0.2457 0.259 0 0.2593 (PERCENT)
Beginning Stocks 11 11 16 9 0 9 (1000 MT)
Production 430 380 430 360 0 350 (1000 MT)
MY Imports 72 72 30 80 0 100 (1000 MT)
MY Imp. from U.S. 0 0 0 0 0 0 (1000 MT)
MY Imp. from EU 0 0 0 0 0 0 (1000 MT)
Total Supply 513 463 476 449 0 459 (1000 MT)
MY Exports 154 154 140 130 0 130 (1000 MT)
MY Exp. to EU 1 0 0 0 0 0 (1000 MT)
Industrial Dom. Cons.
0 0 0 0 0 0 (1000 MT)
Food Use Dom. Cons.
0 0 0 0 0 0 (1000 MT)
Feed Waste Dom. Cons.
343 300 320 310 0 320 (1000 MT)
Total Dom. Cons. 343 300 320 310 0 320 (1000 MT)
Ending Stocks 16 9 16 9 0 9 (1000 MT)
Total Distribution 513 463 476 449 0 459 (1000 MT)
CY Imports 10 72 0 80 0 0 (1000 MT)
CY Imp. from U.S. 0 0 0 0 0 0 (1000 MT)
CY Exports 160 154 0 130 0 0 (1000 MT)
CY Exp. to U.S. 0 0 0 0 0 0 (1000 MT)
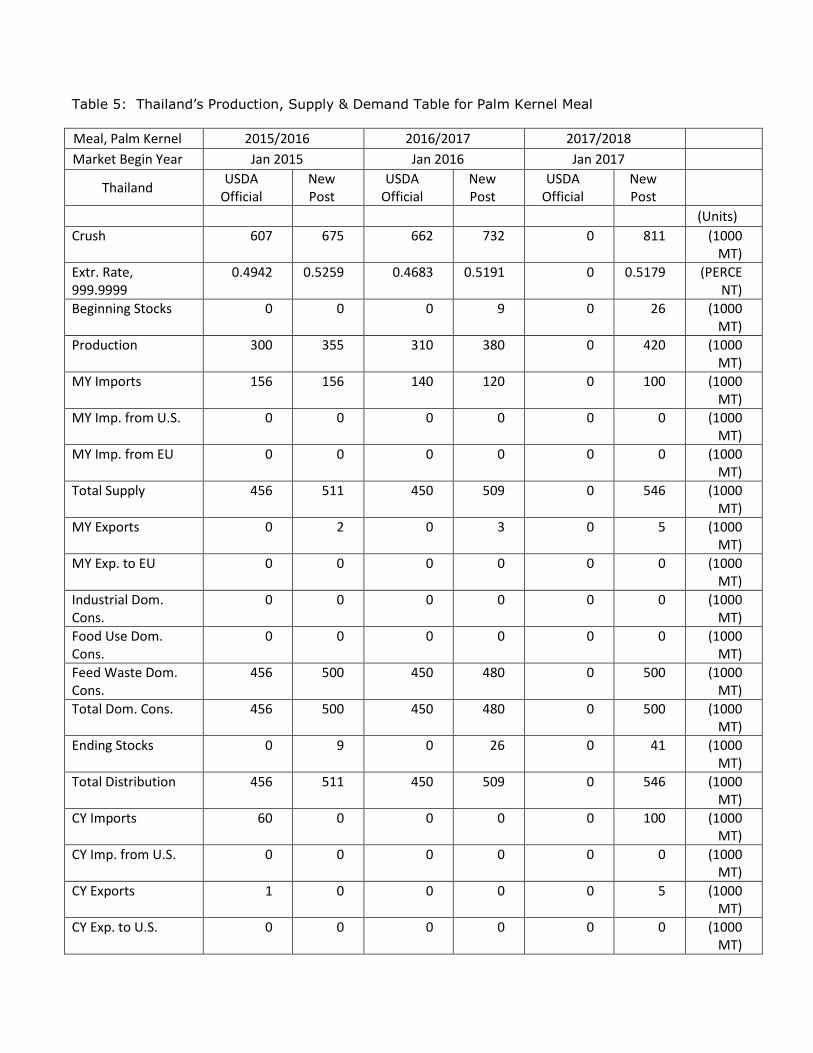
Table 5: Thailand’s Production, Supply & Demand Table for Palm Kernel Meal
Meal, Palm Kernel 2015/2016 2016/2017 2017/2018
Market Begin Year Jan 2015 Jan 2016 Jan 2017
Thailand USDA
Official New Post
USDA Official
New Post
USDA Official
New Post
(Units)
Crush 607 675 662 732 0 811 (1000 MT)
Extr. Rate, 999.9999
0.4942 0.5259 0.4683 0.5191 0 0.5179 (PERCENT)
Beginning Stocks 0 0 0 9 0 26 (1000 MT)
Production 300 355 310 380 0 420 (1000 MT)
MY Imports 156 156 140 120 0 100 (1000 MT)
MY Imp. from U.S. 0 0 0 0 0 0 (1000 MT)
MY Imp. from EU 0 0 0 0 0 0 (1000 MT)
Total Supply 456 511 450 509 0 546 (1000 MT)
MY Exports 0 2 0 3 0 5 (1000 MT)
MY Exp. to EU 0 0 0 0 0 0 (1000 MT)
Industrial Dom. Cons.
0 0 0 0 0 0 (1000 MT)
Food Use Dom. Cons.
0 0 0 0 0 0 (1000 MT)
Feed Waste Dom. Cons.
456 500 450 480 0 500 (1000 MT)
Total Dom. Cons. 456 500 450 480 0 500 (1000 MT)
Ending Stocks 0 9 0 26 0 41 (1000 MT)
Total Distribution 456 511 450 509 0 546 (1000 MT)
CY Imports 60 0 0 0 0 100 (1000 MT)
CY Imp. from U.S. 0 0 0 0 0 0 (1000 MT)
CY Exports 1 0 0 0 0 5 (1000 MT)
CY Exp. to U.S. 0 0 0 0 0 0 (1000 MT)
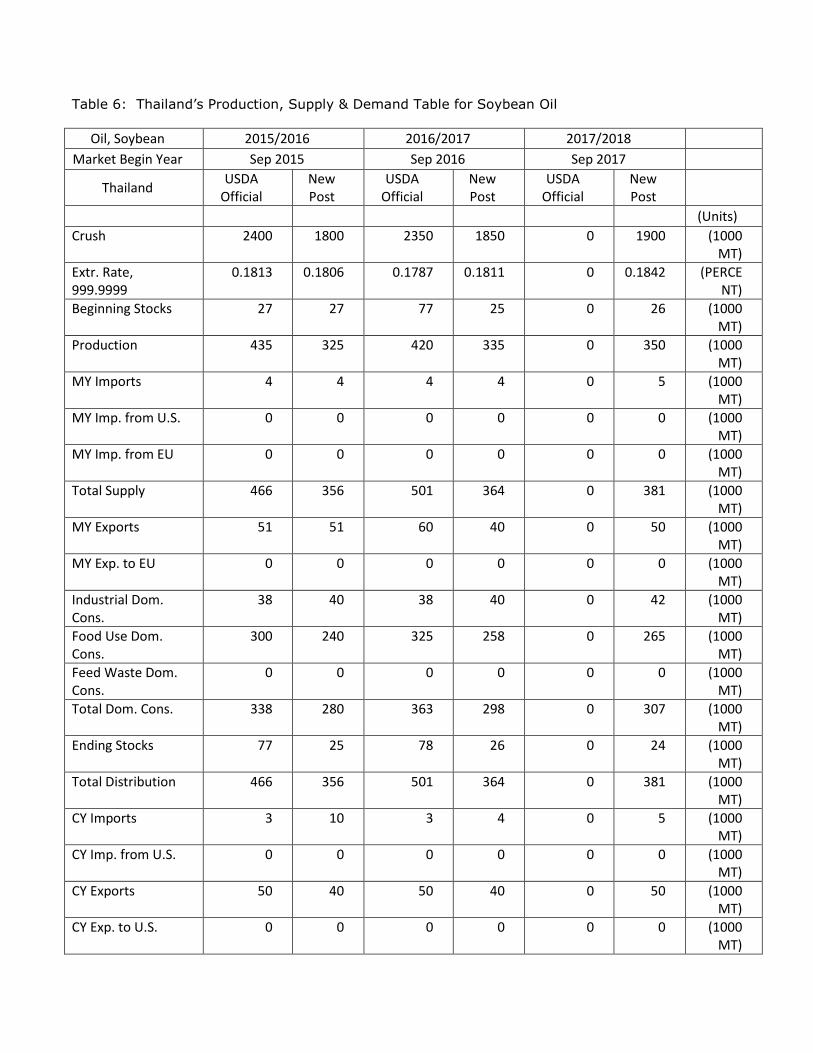
Table 6: Thailand’s Production, Supply & Demand Table for Soybean Oil
Oil, Soybean 2015/2016 2016/2017 2017/2018
Market Begin Year Sep 2015 Sep 2016 Sep 2017
Thailand USDA
Official New Post
USDA Official
New Post
USDA Official
New Post
(Units)
Crush 2400 1800 2350 1850 0 1900 (1000 MT)
Extr. Rate, 999.9999
0.1813 0.1806 0.1787 0.1811 0 0.1842 (PERCENT)
Beginning Stocks 27 27 77 25 0 26 (1000 MT)
Production 435 325 420 335 0 350 (1000 MT)
MY Imports 4 4 4 4 0 5 (1000 MT)
MY Imp. from U.S. 0 0 0 0 0 0 (1000 MT)
MY Imp. from EU 0 0 0 0 0 0 (1000 MT)
Total Supply 466 356 501 364 0 381 (1000 MT)
MY Exports 51 51 60 40 0 50 (1000 MT)
MY Exp. to EU 0 0 0 0 0 0 (1000 MT)
Industrial Dom. Cons.
38 40 38 40 0 42 (1000 MT)
Food Use Dom. Cons.
300 240 325 258 0 265 (1000 MT)
Feed Waste Dom. Cons.
0 0 0 0 0 0 (1000 MT)
Total Dom. Cons. 338 280 363 298 0 307 (1000 MT)
Ending Stocks 77 25 78 26 0 24 (1000 MT)
Total Distribution 466 356 501 364 0 381 (1000 MT)
CY Imports 3 10 3 4 0 5 (1000 MT)
CY Imp. from U.S. 0 0 0 0 0 0 (1000 MT)
CY Exports 50 40 50 40 0 50 (1000 MT)
CY Exp. to U.S. 0 0 0 0 0 0 (1000 MT)
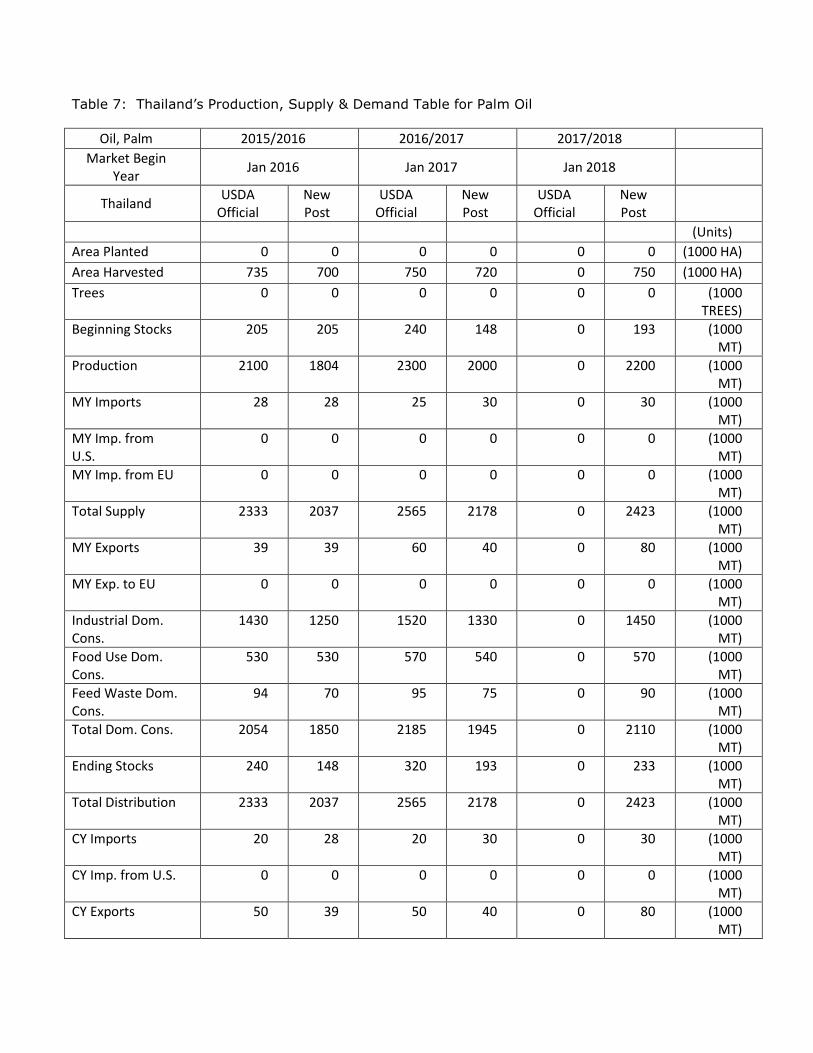
Table 7: Thailand’s Production, Supply & Demand Table for Palm Oil
Oil, Palm 2015/2016 2016/2017 2017/2018
Market Begin Year
Jan 2016 Jan 2017 Jan 2018
Thailand USDA
Official New Post
USDA Official
New Post
USDA Official
New Post
(Units)
Area Planted 0 0 0 0 0 0 (1000 HA)
Area Harvested 735 700 750 720 0 750 (1000 HA)
Trees 0 0 0 0 0 0 (1000 TREES)
Beginning Stocks 205 205 240 148 0 193 (1000 MT)
Production 2100 1804 2300 2000 0 2200 (1000 MT)
MY Imports 28 28 25 30 0 30 (1000 MT)
MY Imp. from U.S.
0 0 0 0 0 0 (1000 MT)
MY Imp. from EU 0 0 0 0 0 0 (1000 MT)
Total Supply 2333 2037 2565 2178 0 2423 (1000 MT)
MY Exports 39 39 60 40 0 80 (1000 MT)
MY Exp. to EU 0 0 0 0 0 0 (1000 MT)
Industrial Dom. Cons.
1430 1250 1520 1330 0 1450 (1000 MT)
Food Use Dom. Cons.
530 530 570 540 0 570 (1000 MT)
Feed Waste Dom. Cons.
94 70 95 75 0 90 (1000 MT)
Total Dom. Cons. 2054 1850 2185 1945 0 2110 (1000 MT)
Ending Stocks 240 148 320 193 0 233 (1000 MT)
Total Distribution 2333 2037 2565 2178 0 2423 (1000 MT)
CY Imports 20 28 20 30 0 30 (1000 MT)
CY Imp. from U.S. 0 0 0 0 0 0 (1000 MT)
CY Exports 50 39 50 40 0 80 (1000 MT)

CY Exp. to U.S. 0 0 0 0 0 0 (1000 MT)
Yield 2.8571 2.5771 3.0667 2.7778 0 2.9333 (MT/HA)
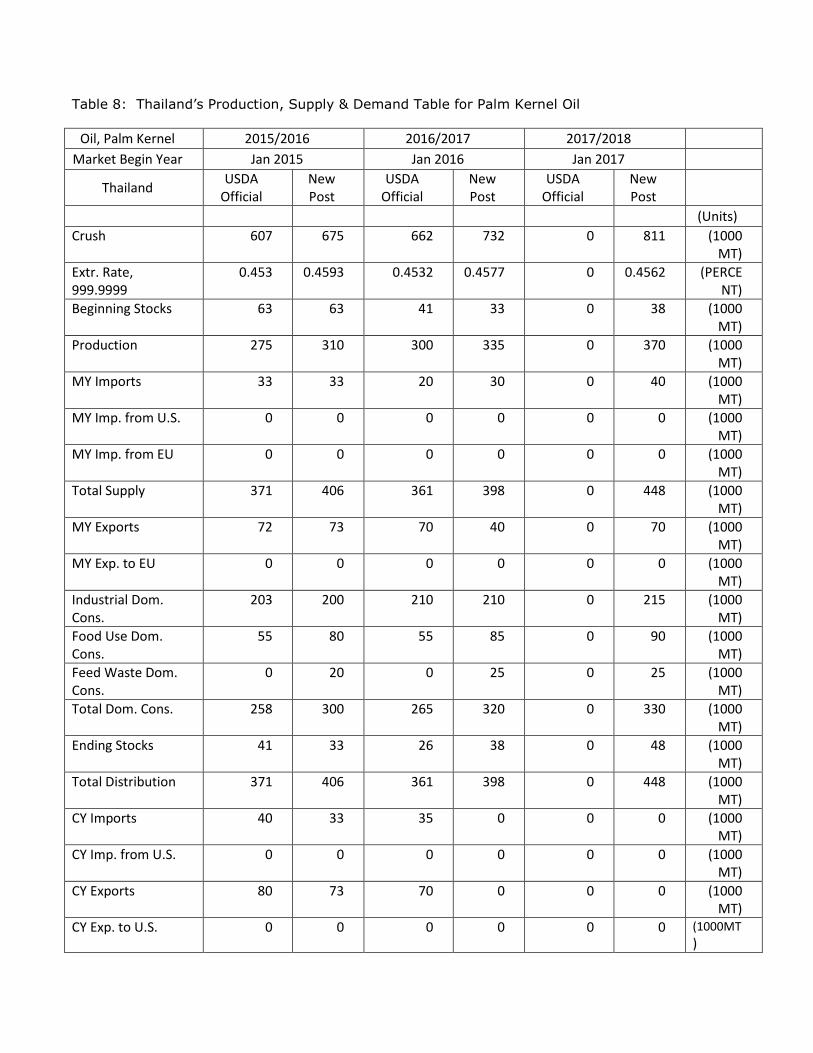
Table 8: Thailand’s Production, Supply & Demand Table for Palm Kernel Oil
Oil, Palm Kernel 2015/2016 2016/2017 2017/2018
Market Begin Year Jan 2015 Jan 2016 Jan 2017
Thailand USDA
Official New Post
USDA Official
New Post
USDA Official
New Post
(Units)
Crush 607 675 662 732 0 811 (1000 MT)
Extr. Rate, 999.9999
0.453 0.4593 0.4532 0.4577 0 0.4562 (PERCENT)
Beginning Stocks 63 63 41 33 0 38 (1000 MT)
Production 275 310 300 335 0 370 (1000 MT)
MY Imports 33 33 20 30 0 40 (1000 MT)
MY Imp. from U.S. 0 0 0 0 0 0 (1000 MT)
MY Imp. from EU 0 0 0 0 0 0 (1000 MT)
Total Supply 371 406 361 398 0 448 (1000 MT)
MY Exports 72 73 70 40 0 70 (1000 MT)
MY Exp. to EU 0 0 0 0 0 0 (1000 MT)
Industrial Dom. Cons.
203 200 210 210 0 215 (1000 MT)
Food Use Dom. Cons.
55 80 55 85 0 90 (1000 MT)
Feed Waste Dom. Cons.
0 20 0 25 0 25 (1000 MT)
Total Dom. Cons. 258 300 265 320 0 330 (1000 MT)
Ending Stocks 41 33 26 38 0 48 (1000 MT)
Total Distribution 371 406 361 398 0 448 (1000 MT)
CY Imports 40 33 35 0 0 0 (1000 MT)
CY Imp. from U.S. 0 0 0 0 0 0 (1000 MT)
CY Exports 80 73 70 0 0 0 (1000 MT)
CY Exp. to U.S. 0 0 0 0 0 0 (1000MT
)