Embed Size (px)
Citation preview

THIS REPORT CONTAINS ASSESSMENTS OF COMMODITY AND TRADE ISSUES MADE BY
USDA STAFF AND NOT NECESSARILY STATEMENTS OF OFFICIAL U.S. GOVERNMENT
POLICY
Date:
GAIN Report Number:
Approved By:
Prepared By:
Report Highlights:
Indonesian CPO production is expected to reach a record 35 MMT in MY 2015/16 despite the
continued slowdown of planting area expansion. Low petroleum prices that are offsetting demand for
biodiesel, coupled with growing palm oil production, are creating ample supplies, implying that palm
oil exports will reach 22.7 MMT in 2015/16, about one percent higher than 2014/15 exports. 2015/16
Indonesian soybean production is expected remain limited despite government self-sufficiency goals.
2014/15 and 2015/16 soybean imports are expected to remain moderate, due to high stocks. Indonesia
coconut planted area shows no significant expansion while copra production is expected to reach 1.6
MMT in 2015/16. Peanut production continues to decline following down trend in recent years.
Commodities:
Thom Wright, Arif Rahmanulloh
Ali Abdi
Oilseeds and Products Annual Report 2015
Oilseeds and Products Annual
Indonesia
ID1508
3/20/2015
Required Report - public distribution

Oil, Palm
Production:
Indonesian palm oil planting expansion continues to slow. Certified palm oil seed sales, a major
indicator of planting intentions, dropped 21 percent in 2014, preceded by an 18 percent drop in 2013.
While planting expansion remains positive, its slowdown is expected due to land disputes with locals in
several large-scale plantations areas as well as the implementation of Indonesia’s forest moratorium
policy. As a result, Post sets 2015/16 area planted at 10.8 million hectares with 8.9 million harvested
hectares.
Figure 1: Indonesia, Oil Palm Area (million hectares)
Source: Indonesian statistical agency and Post’s calculation
Crude Palm Oil (CPO) production is expected to reach 35 MMT in MY 2015/16 based on expanded
planted area and the maturation of existing plantations. 2014/15 remains at 33 MMT, based on less-than-
optimal rainfall throughout 2014.
Consumption:
The Government of Indonesia (GOI) increased biodiesel subsidies in early February 2015 in response to
falling petroleum prices. The subsidy moved up to Rp 4,000 (about 30 cents) a liter from Rp 1,500.
Despite this intervention, industry sources have indicated that it is unlikely to spur growth to targeted
levels. Industry sources note that although the subsidy rate has moved up considerably, petroleum prices
are too low. Additionally, there is some doubt about the actual amount budgeted by Indonesia’s House
of Representatives (DPR). In theory, the subsidy budget risks being diverted to other DPR objectives.
Sources did not specify a specific threat, but noted that this is a viable scenario which may reduce
overall funding for the subsidy. Industry sources did indicate that blending capacity and infrastructure
improved for 2015/16, supporting biodiesel’s overall production and consumption prospects. As a result,
Post sets 2015/16 industrial consumption at 4.4 MMT, slightly above 2014/15 consumption. Human
consumption is set at 6.2 MMT, reflecting population growth and an expanding food manufacturing
sector. Overall consumption will therefore grow to 10.92 MMT.
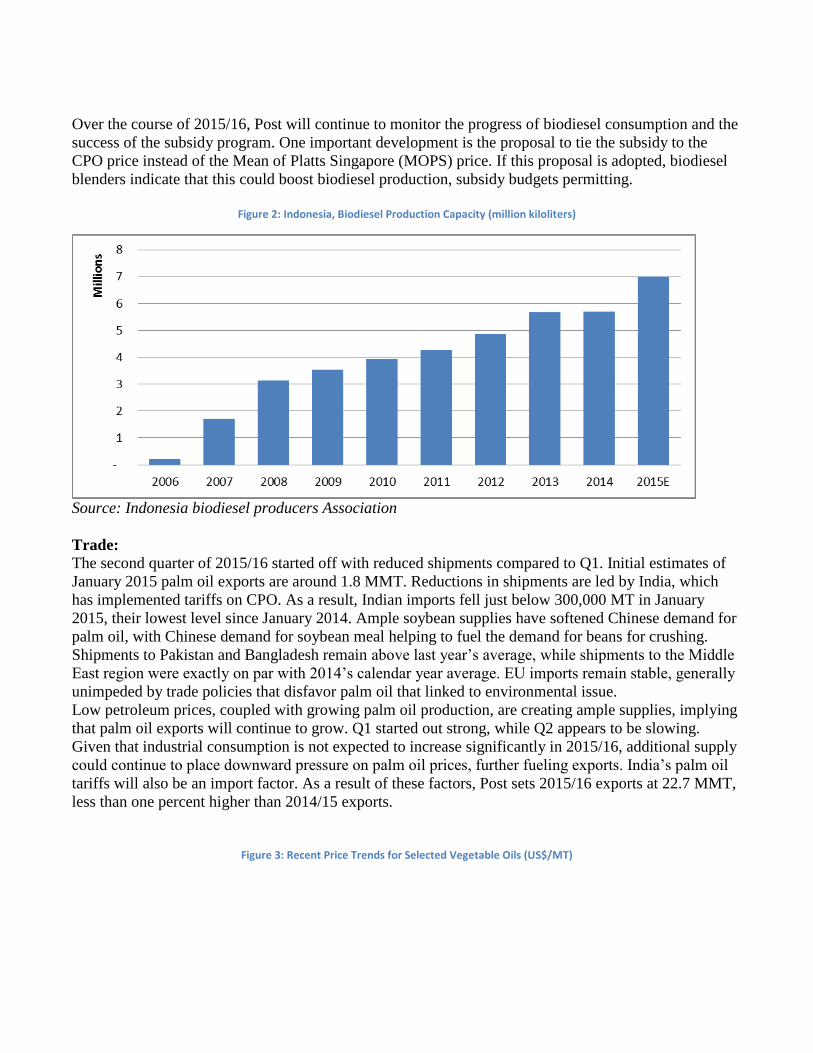
Over the course of 2015/16, Post will continue to monitor the progress of biodiesel consumption and the
success of the subsidy program. One important development is the proposal to tie the subsidy to the
CPO price instead of the Mean of Platts Singapore (MOPS) price. If this proposal is adopted, biodiesel
blenders indicate that this could boost biodiesel production, subsidy budgets permitting.
Figure 2: Indonesia, Biodiesel Production Capacity (million kiloliters)
Source: Indonesia biodiesel producers Association
Trade:
The second quarter of 2015/16 started off with reduced shipments compared to Q1. Initial estimates of
January 2015 palm oil exports are around 1.8 MMT. Reductions in shipments are led by India, which
has implemented tariffs on CPO. As a result, Indian imports fell just below 300,000 MT in January
2015, their lowest level since January 2014. Ample soybean supplies have softened Chinese demand for
palm oil, with Chinese demand for soybean meal helping to fuel the demand for beans for crushing.
Shipments to Pakistan and Bangladesh remain above last year’s average, while shipments to the Middle
East region were exactly on par with 2014’s calendar year average. EU imports remain stable, generally
unimpeded by trade policies that disfavor palm oil that linked to environmental issue.
Low petroleum prices, coupled with growing palm oil production, are creating ample supplies, implying
that palm oil exports will continue to grow. Q1 started out strong, while Q2 appears to be slowing.
Given that industrial consumption is not expected to increase significantly in 2015/16, additional supply
could continue to place downward pressure on palm oil prices, further fueling exports. India’s palm oil
tariffs will also be an import factor. As a result of these factors, Post sets 2015/16 exports at 22.7 MMT,
less than one percent higher than 2014/15 exports.
Figure 3: Recent Price Trends for Selected Vegetable Oils (US$/MT)

Source: www.Indexmundi.com
Stocks:
Indonesian palm oil stocks are poised to grow. Planting expansion continues with production hitting
record levels, while the global supply situation is complimented by robust soybean stocks. Local
consumption appears unlikely to keep pace with Indonesia’s production capacity, implying that stocks
will continue to grow. Post therefore sets the 2015/16 ending stock estimate at a record 3.574 MMT.
Stocks are greatly dependent on the success of Indonesia’s biofuel consumption, as well as the growth of
global demand for vegetable oils. Stocks may also decline if Indonesia experiences extended dry
weather, or violent weather that hinders oil palm pollination.
Production, Supply and Demand Data Statistic
Oil, Palm 2013/2014 2014/2015 2015/2016
Market Begin Year Oct 2013 Oct 2014 Oct 2015
Indonesia USDA Official
New Post USDA Official
New Post USDA Official
New Post
Area Planted 0 10,325 0 10,640 0 10,800
Area Harvested 8,115 8,115 8,540 8,540 0 8,965
Trees 0 1,548,750
0 1,596,000
0 1,643,250
Beginning Stocks 1,758 1,758 1,768 2,014 0 2,194
Production 30,500 30,500 33,000 33,000 0 35,000
MY Imports 27 1 0 0 0 0
MY Imp. from U.S. 0 0 0 0 0 0
MY Imp. from EU 0 0 0 0 0 0

Total Supply 32,285 32,259 34,768 35,014 0 37,194
MY Exports 21,719 21,719 22,300 22,500 0 22,700
MY Exp. to EU 3,500 3,500 3,500 3,500 0 3,500
Industrial Dom. Cons. 3,400 3,000 4,700 4,000 0 4,400
Food Use Dom. Cons. 5,168 5,270 5,500 6,000 0 6,200
Feed Waste Dom. Cons.
230 256 320 320 0 320
Total Dom. Cons. 8,798 8,526 10,520 10,320 0 10,920
Ending Stocks 1,768 2,014 1,948 2,194 0 3,574
Total Distribution 32,285 32,259 34,768 35,014 0 37,194
CY Imports 40 1 0 0 0 0
CY Imp. from U.S. 0 0 0 0 0 0
CY Exports 21,500 21,500 23,000 22,000 0 0
CY Exp. to U.S. 50 400 50 0 0 0
TS=TD 0 0 0 0 0 0
Commodities:
Oilseed, Palm Kernel
Production:
Fresh fruit bunch (FFB) yields correlate directly with palm kernel (PK) production levels. MY 2014/15
and 2015/16 CPO production levels are estimated at 33 MMT and 35 MMT respectively. Assuming a
23 percent oil extraction rate (OER), Indonesia is estimated to produce 144 MMT of FFB in MY
2014/15 and 152 MMT in MY 2015/16. PK accounts for about six percent of total FFB weight,
indicating that PK production will reach 8.7 MMT in MY 2014/15 and 9.2 MMT in MY 2015/16.
Consumption:
Post expects local millers will process 8.7 MMT of PK in MY 2014/15 and 9.2 MMT in MY 2015/16
respectively. PK is not directly used as animal or livestock feed in Indonesia. However, palm kernel
meal/cake (PKM), a byproduct from extracting PKO from the kernel, is used in limited quantities by the
local cattle industry.
Stocks:
PK ending stocks are expected to reach 133,000 MT in MY 2014/15 and 143,000 MT in MY 2015/16.
Stocks are based on the assumption that palm kernel mills will maintain two days operating supply.
Production, Supply and Demand Data Statistic

Oilseed, Palm Kernel 2013/2014 2014/2015 2015/2016
Market Begin Year Oct-13 Oct-14 Oct-15
Indonesia USDA Official
New Post USDA Official
New Post USDA Official
New Post
Area Planted 0 10,325 0 10,640 0 10,800
Area Harvested 8,115 8,115 8,540 8,540 0 8,965
Trees 0 1,548,750
0 1,596,000
0 1,643,250
Beginning Stocks 90 90 90 123 0 133
Production 8,050 8,100 8,700 8,700 0 9,200
MY Imports 0 0 0 0 0 0
MY Imp. from U.S. 0 0 0 0 0 0
MY Imp. from EU 0 0 0 0 0 0
Total Supply 8,140 8,190 8,790 8,823 0 9,333
MY Exports 0 0 0 0 0 0
MY Exp. to EU 0 0 0 0 0 0
Crush 7,980 7,997 8,630 8,620 0 9,120
Food Use Dom. Cons. 0 0 0 0 0 0
Feed Waste Dom. Cons.
70 70 70 70 0 70
Total Dom. Cons. 8,050 8,067 8,700 8,690 0 9,190
Ending Stocks 90 123 90 133 0 143
Total Distribution 8,140 8,190 8,790 8,823 0 9,333
CY Imports 0 0 0 0 0 0
CY Imp. from U.S. 0 0 0 0 0 0
CY Exports 0 0 0 0 0 0
CY Exp. to U.S. 0 0 0 0 0 0
TS=TD 0 -0 0 0 0 0
Commodities:
Oil, Palm Kernel
Production:
Indonesia will crush 8.600 MMT and 9.12 MMT of palm kernel in MY 2014/15 and MY 2015/16,
respectively. Based on an average oil content of 45 percent, Post expects that Indonesian PKO
production will reach 3.7 MMT in MY 2014/15 and 4 MMT in MY 2015/16.
Consumption:
PKO is preferred by industrial users. Oleochemical product manufacturers are the main users of PKO,
particularly in the form of refined, bleached and deodorized (RBD) PK olein and RBD PK stearin which
are used to produce fatty acid, fatty alcohol and glycerol. The Indonesian oleochemical industry has
grown in conjunction with the palm oil industry, and as a result, Indonesia consumes a large share of its

domestic production. Post thus expects Industrial PKO consumption to continue to grow to 1.8 MMT in
2014/15 and 1.9 MMT 2015/16 for a total of 2.11 MMT in 2014/15 and 2.22 MMT 2015/16 total
consumption.
Trade:
Indonesia exports approximately half of its PKO production. 2013/14 exports are set at 1.443 MMT,
based on trade data. 2014/15 and 2015/16 are expected at 1.6 and 1.7 MMT, respectively, based on the
continued growth of PKO production.
Stocks:
PKO ending stocks are expected to increase due to strong domestic production. Post expects ending
stocks will increase from 551,000 MT in MY 2014/15 ton 631,000 MT in 2015/16.
Production, Supply and Demand Data Statistic
Oil, Palm Kernel 2013/2014 2014/2015 2015/2016
Market Begin Year Oct-13 Oct-14 Oct-15
Indonesia USDA Official New Post USDA Official New Post USDA Official New Post
Crush 7,980 7,997 8,630 8,620 0 9,120
Extr. Rate, 999.9999 0.4440 0.4377 0.4380 0.4303 0.0000 0.4386
Beginning Stocks 293 293 321 512 0 551
Production 3,543 3,500 3,780 3,709 0 4,000
MY Imports 0 42 0 40 0 0
MY Imp. from U.S. 0 0 0 0 0 0
MY Imp. from EU 0 0 0 0 0 0
Total Supply 3,836 3,835 4,101 4,261 0 4,551
MY Exports 1,444 1,443 1,650 1,600 0 1,700
MY Exp. to EU 550 176 550 180 0 180
Industrial Dom. Cons. 1,806 1,600 1,850 1,800 0 1,900
Food Use Dom. Cons. 265 280 300 310 0 320
Feed Waste Dom. Cons. 0 0 0 0 0 0
Total Dom. Cons. 2,071 1,880 2,150 2,110 0 2,220
Ending Stocks 321 512 301 551 0 631
Total Distribution 3,836 3,835 4,101 4,261 0 4,551
CY Imports 1 327 0 300 0 0
CY Imp. from U.S. 0 0 0 0 0 0
CY Exports 1,700 1,644 1,750 1,700 0 0
CY Exp. to U.S. 0 0 0 0 0 0
TS=TD 0 0 0 0 0 0
Commodities:

Meal, Palm Kernel
Production:
Palm kernel meal (PKM) production is correlated directly to palm kernel production. Indonesia will
crush 8.6 MMT of palm kernel in MY 2014/15 and 9.1 MMT in MY 2015/16. As a result, Post expects
production of PKM will reach 4.6 MMT in MY 2014/15 and 4.9 MMT in 2015/16.
Consumption:
Post expects domestic PKM consumption to grow from 600,000 MT in MY 2014/15 to 650,000 MT in
next marketing year. Domestic consumption of PKM in Indonesia is relatively small and limited to
ruminant feed use for the dairy industry. Consumption growth may taper off if the Indonesian beef herd
continues to stagnate.
Trade:
Limited domestic consumption results in large supplies available for exports. PKM exports accounted
for about 90 percent of total PKM production in MY 2014/15. Export of PKM is expected to increase
from 4.1 MMT in MY 2014/15 to 4.4 MMT in MY 2015/16.
Stocks:
Ending stocks of PKM are expected to decline to 183 thousand MT in MY 2014/15 and 33 thousand MT
in 2015/16. This number may increase if Indonesian beef production stagnates or declines.
Production, Supply and Demand Data Statistic
Meal, Palm Kernel 2013/2014 2014/2015 2015/2016
Market Begin Year Oct-13 Oct-14 Oct-15
Indonesia USDA Official New Post USDA Official New Post USDA Official New Post
Crush 7,980 7,997 8,630 8,620 0 9,120
Extr. Rate, 999.9999 0.5382 0.5352 0.4983 0.5336 0.0000 0.5373
Beginning Stocks 90 90 116 283 0 183
Production 4,295 4,280 4,300 4,600 0 4,900
MY Imports 0 0 0 0 0 0
MY Imp. from U.S. 0 0 0 0 0 0
MY Imp. from EU 0 0 0 0 0 0
Total Supply 4,385 4,370 4,416 4,883 0 5,083
MY Exports 3,668 3,667 3,850 4,100 0 4,400
MY Exp. to EU 1,580 1,324 1,600 1,368 0 1,440
Industrial Dom. Cons. 0 0 0 0 0 0
Food Use Dom. Cons. 0 0 0 0 0 0
Feed Waste Dom. Cons. 601 420 500 600 0 650
Total Dom. Cons. 601 420 500 600 0 650
Ending Stocks 116 283 66 183 0 33
Total Distribution 4,385 4,370 4,416 4,883 0 5,083
CY Imports 0 0 0 0 0 0
CY Imp. from U.S. 0 0 0 0 0 0

CY Exports 3,575 3,568 3,700 3,700 0 0
CY Exp. to U.S. 0 0 0 0 0 0
SME 214 149 178 213 0 231
TS=TD 0 0 0 0 0 0
Commodities:
Oilseed, Soybean
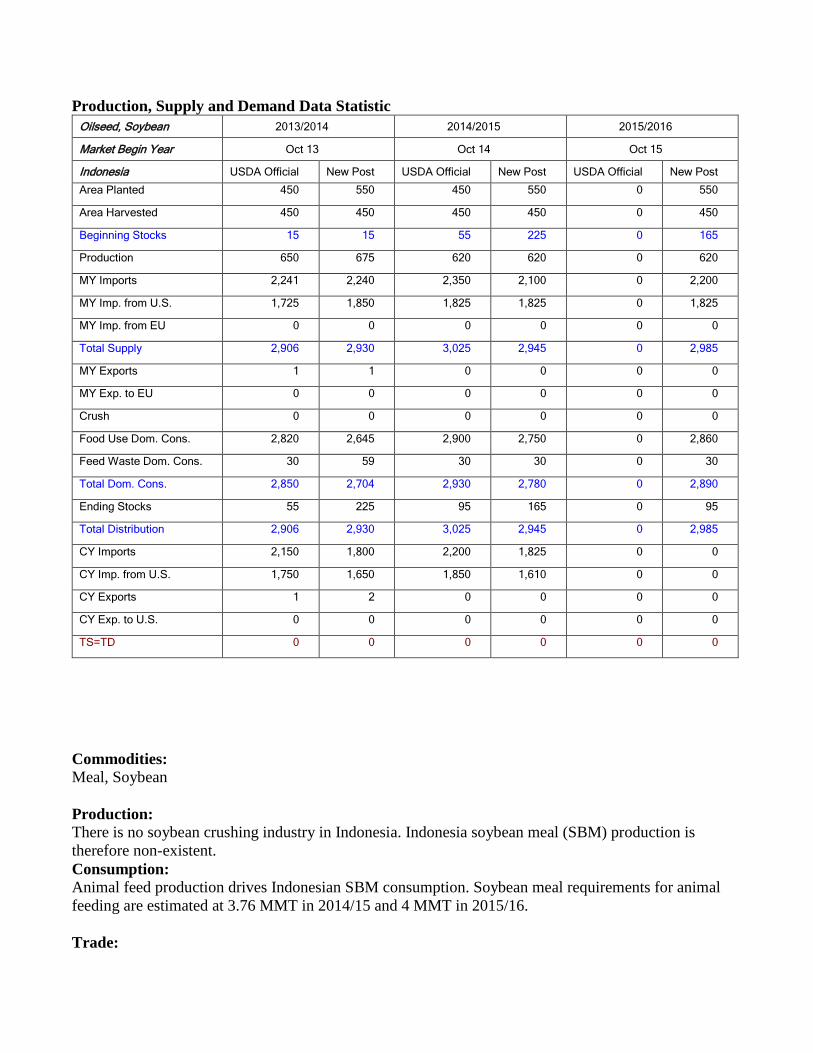
Production:
The Jokowi administration has continued its predecessor’s policy of self-sufficiency for several
agricultural commodities, including soybean. Post does not expect this policy will lead to increased
production of soybean, as farmers continue to prefer planting corn and rice. Additionally, comments
from within the Ministry of Agriculture indicate that initial self-sufficiency goals are more focused on
rice than soybean, likely because rice self-sufficiency is more easily attainable. Post also does not expect
a large shift of planted acres to soy, as it would imply decreasing production of other priority crops such
as corn and rice.
Ideal production conditions resulted in slightly higher Indonesian soybean production in 2013/14. Post
therefore maintains the slightly high production level of 675 thousand MT. Post travel throughout Java
confirmed that dry weather in November and December 2014 delayed planting until January. As a
result, Post expects the first harvest of 2015 to occur in late March/April. Post production estimates for
2014/15 and 2015/16 remain stable at 620 thousand MT.
Consumption:
Indonesian soybean consumption is focused on human users, especially the tempeh and tofu industry. As
the staple protein source for Indonesians, soybean consumption is expected to continue to rise with
population growth. Additionally, the weakening of the Rupiah vis-à-vis the dollar will also encourage
soybean consumption, given its price competitiveness compared to alternate protein sources. This is
supported by ample global soybean supplies leading to lower prices. As a result, consumption is
expected to reach 2.78 MMT in 2014/15 and 2.89 in 2015/16.
Trade:
2013/14 soybean imports leaped ahead in response to low global prices and ample supplies. Faced with
imports growing faster than consumption, Indonesia rolled over larger stocks in 2013/14, resulting in
slightly diminished imports in 2014/15. Post expects that imports will remain moderate, given larger
stocks. Thus, 2014/15 imports are slightly lower at 2.1 MMT, while 2015/16 imports are set at 2.2
MMT. Post will continue to review this estimate, as sustained low prices could lead to additional
imports.
Stocks:
Indonesian soybean stocks grew in 2013/14 following low prices and imports that outpaced
consumption growth. Post expects that stocks will slowly be drawn down, although this may be delayed
if soybean prices remain low, spurring imports at a faster pace than consumption. Given this scenario,
Post sets 2014/15 stocks at 165 thousand MT and 2015/16 at 95 thousand MT.
Production, Supply and Demand Data Statistic
Oilseed, Soybean 2013/2014 2014/2015 2015/2016
Market Begin Year Oct 13 Oct 14 Oct 15
Indonesia USDA Official New Post USDA Official New Post USDA Official New Post
Area Planted 450 550 450 550 0 550
Area Harvested 450 450 450 450 0 450
Beginning Stocks 15 15 55 225 0 165
Production 650 675 620 620 0 620
MY Imports 2,241 2,240 2,350 2,100 0 2,200
MY Imp. from U.S. 1,725 1,850 1,825 1,825 0 1,825
MY Imp. from EU 0 0 0 0 0 0
Total Supply 2,906 2,930 3,025 2,945 0 2,985
MY Exports 1 1 0 0 0 0
MY Exp. to EU 0 0 0 0 0 0
Crush 0 0 0 0 0 0
Food Use Dom. Cons. 2,820 2,645 2,900 2,750 0 2,860
Feed Waste Dom. Cons. 30 59 30 30 0 30
Total Dom. Cons. 2,850 2,704 2,930 2,780 0 2,890
Ending Stocks 55 225 95 165 0 95
Total Distribution 2,906 2,930 3,025 2,945 0 2,985
CY Imports 2,150 1,800 2,200 1,825 0 0
CY Imp. from U.S. 1,750 1,650 1,850 1,610 0 0
CY Exports 1 2 0 0 0 0
CY Exp. to U.S. 0 0 0 0 0 0
TS=TD 0 0 0 0 0 0
Commodities:
Meal, Soybean
Production:
There is no soybean crushing industry in Indonesia. Indonesia soybean meal (SBM) production is
therefore non-existent.
Consumption:
Animal feed production drives Indonesian SBM consumption. Soybean meal requirements for animal
feeding are estimated at 3.76 MMT in 2014/15 and 4 MMT in 2015/16.
Trade:

Based on domestic SBM consumption estimates and a six week inventory turnover, Indonesia is
expected to import 3.75 MMT of SBM in MY 2014/15. Under normal conditions, this will grow to
slightly increase to 3.97 MMT in MY 2015/16.
Stock:
Ending stocks of SBM will stand at 322,000 MT in MY 2014/15 and are expected to slightly down in to
292,000 MT in MY 2015/16.
Production, Supply and Demand Data Statistic
Meal, Soybean 2013/2014 2014/2015 2015/2016
Market Begin Year Oct-13 Oct-14 Oct-15
Indonesia USDA Official New Post USDA Official New Post USDA Official New Post
Crush 0 0 0 0 0 0
Extr. Rate, 999.9999 0.0000 0.0000 0.0000 0.0000 0.0000 0.0000
Beginning Stocks 323 323 406 333 0 322
Production 0 0 0 0 0 0
MY Imports 3,983 3,550 4,250 3,755 0 3,970
MY Imp. from U.S. 85 100 100 100 0 0
MY Imp. from EU 0 0 0 0 0 0
Total Supply 4,306 3,873 4,656 4,088 0 4,292
MY Exports 0 0 0 0 0 0
MY Exp. to EU 0 0 0 0 0 0
Industrial Dom. Cons. 0 0 0 0 0 0
Food Use Dom. Cons. 0 0 0 0 0 0
Feed Waste Dom. Cons. 3,900 3,540 4,250 3,766 0 4,000
Total Dom. Cons. 3,900 3,540 4,250 3,766 0 4,000
Ending Stocks 406 333 406 322 0 292
Total Distribution 4,306 3,873 4,656 4,088 0 4,292
CY Imports 3,650 0 3,900 0 0 0
CY Imp. from U.S. 85 0 100 0 0 0
CY Exports 0 0 0 0 0 0
CY Exp. to U.S. 0 0 0 0 0 0
SME 3,900 3,540 4,250 3,766 0 4,000
TS=TD 0 0 0 0 0 0
Commodities:
Oilseed, Copra
Production:
Coconut production determines the availability of copra in Indonesia. Approximately 98 percent of
Indonesian coconut plantations are farmed by smallholders using low-intensity management practices.
As a result, Indonesian coconut production has been stagnant in recent years.

There is no large-scale replanting program to replace old crops (above 60 years old) and the proportion
of non-peak production coconut plantations is increasing. This trend is not expected to change in the
short term, as GOI priorities are focused on improving other crops such as rice, corn, soy and sugar.
Given stagnating planting area, declining productivity, and National Statistic Agency (BPS) data
indicating that area planted increased only 5600 hectares in 2014, Post expects copra production to reach
1.6 MMT in MY 2014/15 and to remain at that level in 2015/16. This trend is further supported by the
fact that copra production is less profitable than sales of fresh coconut and palm sugar.
Consumption:
The Indonesian copra sector uses 45 to 47 percent of total national coconut production. Palm sugar and
fresh-in-shell coconut are the major non-copra uses of coconuts. Fresh-in-shell coconuts are usually
further processed into coconut milk and shredded coconut. Strong coconut demand for non-copra users
is mostly found on Java while copra demand is concentrated on other Indonesian Islands. Around 97
percent of total annual copra is processed into crude coconut oil (CNO). Post expects copra production
will reach 1.565 MMT in MY 2014/15 and 1.58 MMT in MY 2015/16.
Trade:
2013/14 exports are revised up to 47 thousand MT, based on final trade data. Stagnant production
implies that exports are expected to remain stable at 25 thousand MMT in 2014/15 and 2015/16.
Stock:
Ending stocks are adjusted downward to 1000 MT for 2013/14, reflecting higher than anticipated
exports. MY 2014/15 and 2015/16 stocks are lowered to 11000 and 6000 MT, respectively, reflecting
expected stagnant production, stable exports, and low beginning stocks.
Production, Supply and Demand Data Statistic
Oilseed, Copra 2013/2014 2014/2015 2015/2016
Market Begin Year Oct-13 Oct-14 Oct-15
Indonesia USDA Official New Post USDA Official New Post USDA Official New Post
Area Planted 0 0 0 0 0 0
Area Harvested 3,800 3,800 3,800 3,800 0 3,800
Trees 0 0 0 0 0 0
Beginning Stocks 18 18 12 1 0 11
Production 1,580 1,580 1,580 1,600 0 1,600
MY Imports 0 0 0 0 0 0
MY Imp. from U.S. 0 0 0 0 0 0
MY Imp. from EU 0 0 0 0 0 0
Total Supply 1,598 1,598 1,592 1,601 0 1,611
MY Exports 20 47 20 25 0 25
MY Exp. to EU 0 0 0 0 0 0
Crush 1,562 1,550 1,558 1,565 0 1,580
Food Use Dom. Cons. 0 0 0 0 0 0
Feed Waste Dom. Cons. 4 0 4 0 0 0
Total Dom. Cons. 1,566 1,550 1,562 1,565 0 1,580
Ending Stocks 12 1 10 11 0 6

Total Distribution 1,598 1,598 1,592 1,601 0 1,611
CY Imports 0 0 0 0 0 0
CY Imp. from U.S. 0 0 0 0 0 0
CY Exports 20 29 20 67 0 0
CY Exp. to U.S. 0 0 0 0 0 0
TS=TD 0 0 0 0 0 0
Commodities:
Oil, coconut
Production:
Copra milling defines production levels for Indonesia coconut oil (CNO). Post expects 1.6 MMT of
copra in MY 2014/15 and MY 2015/16. Copra production suggests that Indonesia will produce 975 MT
of CNO in MY 2014/15 and MY 2015/16.
Consumption:
2013/14 CNO industrial consumption was revised lower to 125 thousand MT following higher than
expected exports. 2014/15 and 2015/16 industrial consumption is expected to remain slightly higher due
to biofuels demand. As a result, post sets 2014/15 and 2015/16 industrial consumption at 200 thousand
MT. Post notes that biofuel demand is limited due to low petroleum prices and that offtake of CNO is
dependent on its price competitiveness with PKO.
CNO is not used as extensively for food uses compared to industrial uses. This is primarily due to food
manufacturer’s preference for low cost alternatives like CPO to produce cooking oil, margarine and
shortening. Despite the higher cost of CNO, Industrial users are willing to use it as they can process
CNO into higher value added oleo products.
Trade:
CNO is a lauric oil that competes with PKO in the world market. In recent years, ample supplies of
cheap PKO have supplied manufacturers of soaps, fatty acid and other oleo products in the place of
CNO. CNO exports reached higher than expected levels, growing to 777 thousand MT in 2013/14.
2014/15 and 2015/16 exports are expected to reach 650,000 MT, assuming average performance.
Stocks:
2013/14 ending stocks are revised down to 28 thousand MT based on higher than expected exports.
Ending stocks in 2014/15 and 2015/16 are expected to remain at this level due to increased domestic use
and stagnant CNO production.
Production, Supply and Demand Data Statistic
Oil, Coconut 2013/2014 2014/2015 2015/2016

Market Begin Year Oct-13 Oct-14 Oct-15
Indonesia USDA Official New Post USDA Official New Post USDA Official New Post
Crush 1,562 1,560 1,558 1,565 0 1,580
Extr. Rate, 999.9999 0.6242 0.6250 0.6239 0.6230 0.0000 0.6171
Beginning Stocks 80 80 42 28 0 28
Production 975 975 972 975 0 975
MY Imports 0 0 0 0 0 0
MY Imp. from U.S. 0 0 0 0 0 0
MY Imp. from EU 0 0 0 0 0 0
Total Supply 1,055 1,055 1,014 1,003 0 1,003
MY Exports 777 777 700 650 0 650
MY Exp. to EU 100 100 100 202 0 200
Industrial Dom. Cons. 133 125 175 200 0 200
Food Use Dom. Cons. 103 125 100 125 0 125
Feed Waste Dom. Cons. 0 0 0 0 0 0
Total Dom. Cons. 236 250 275 325 0 325
Ending Stocks 42 28 39 28 0 28
Total Distribution 1,055 1,055 1,014 1,003 0 1,003
CY Imports 0 0 0 0 0 0
CY Imp. from U.S. 0 0 0 0 0 0
CY Exports 0 0 0 0 0 0
CY Exp. to U.S. 0 0 0 0 0 0
TS=TD 0 0 0 0 0 0
Commodities:
Meal, Copra
Production:
Copra meal (CM) production levels are determined by milled copra production. As Indonesia is
expected to process 1.6 MMT of copra in MY 2014/15 and MY 2015/16, CM production is expected to
reach 520 thousand MT in MY 2014/15 and 2015/16.
Consumption:
Indonesian CM is mainly used as a feed ingredient. Domestic consumption is fixed at 250 thousand MT
based on flat production levels.
Trade:
2013/14 exports are set at 254 thousand MT, based on final trade data. 2014/15 and 2015/16 exports are
expected to remain constant at 250 thousand MT, based on flat production and consumption. Post notes
that despite large declines in the domestic beef herd, a growing dairy industry may offset falling CM
feed consumption, leaving domestic consumption levels stable.

Stocks:
Stocks are set to increase marginally due to unchanging consumption and trade. 2015/16 is thus set to
rise to 48 thousand MT over the 2014/15 level of 28 thousand MT.
Production, Supply and Demand Data Statistic
Meal, Copra 2013/2014 2014/2015 2015/2016
Market Begin Year Oct-13 Oct-14 Oct-15
Indonesia USDA Official New Post USDA Official New Post USDA Official New Post
Crush 1,562 1,560 1,558 1,565 0 1,580
Extr. Rate, 999.9999 0.3259 0.3263 0.3273 0.3323 0.0000 0.3291
Beginning Stocks 3 3 3 8 0 28
Production 509 509 510 520 0 520
MY Imports 0 0 0 0 0 0
MY Imp. from U.S. 0 0 0 0 0 0
MY Imp. from EU 0 0 0 0 0 0
Total Supply 512 512 513 528 0 548
MY Exports 254 254 300 250 0 250
MY Exp. to EU 0 0 0 0 0 0
Industrial Dom. Cons. 0 0 0 0 0 0
Food Use Dom. Cons. 0 0 0 0 0 0
Feed Waste Dom. Cons. 255 250 210 250 0 250
Total Dom. Cons. 255 250 210 250 0 250
Ending Stocks 3 8 3 28 0 48
Total Distribution 512 512 513 528 0 548
CY Imports 0 0 0 0 0 0
CY Imp. from U.S. 0 0 0 0 0 0
CY Exports 250 256 275 250 0 0
CY Exp. to U.S. 0 0 0 0 0 0
SME 115 113 95 113 0 113
TS=TD 0 0 0 0 0 0
Commodities:
Oilseed, peanut
Production:
Based on GOI data, Indonesian peanut area and production continues to decline. As a result, Post
expects peanut production to decline to 630 thousand MT in 2014/15 and 615 thousand MT in 2015/16.
Consumption:
Peanut consumption is divided into household, home industry and large scale industry consumers. Home
industry uses about 81 percent of total peanut consumption for food. Household peanut food use is

expected to decline slightly to 1.25 MMT in MY 2014/15 and 2015/16, following similar declines in
production.
Peanut oil consumption in Indonesia is nearly non-existent due to its limited availability compared to
palm and coconut oil. Therefore, Post expects the volume of peanuts for crushing will remain around
50,000 MT in MY 2014/15 and 2015/16. Feed use of peanuts is expected to reach 100,000 MT in MY
2014/15 and 2015/16.
Trade:
Post expects peanut imports to remain stable at 275 thousand MT in MY 2014/15 and 2015/16. Post will
continue surveillance on production, which may drive down imports if yields improve.
Stocks:
Ending stocks are expected to remain stable at 71,000 MT in MY 2014/15 and 68,000 MT in MY
2015/16, reflecting relatively stable production, consumption, and imports.
Production, Supply and Demand Data Statistic
Oilseed, Peanut 2013/2014 2014/2015 2015/2016
Market Begin Year Oct-13 Oct-14 Oct-15
Indonesia USDA Official New Post USDA Official New Post USDA Official New Post
Area Planted 0 0 0 0 0 0
Area Harvested 655 655 630 630 0 615
Beginning Stocks 36 36 38 53 0 71
Production 1,160 1,160 1,150 1,150 0 1,130
MY Imports 310 276 310 275 0 275
MY Imp. from U.S. 0 0 0 0 0 0
MY Imp. from EU 0 0 0 0 0 0
Total Supply 1,506 1,472 1,498 1,478 0 1,476
MY Exports 8 9 8 7 0 8
MY Exp. to EU 0 0 0 0 0 0
Crush 65 55 65 50 0 50
Food Use Dom. Cons. 1,330 1,290 1,300 1,250 0 1,250
Feed Waste Dom. Cons. 65 65 95 100 0 100
Total Dom. Cons. 1,460 1,410 1,460 1,400 0 1,400
Ending Stocks 38 53 30 71 0 68
Total Distribution 1,506 1,472 1,498 1,478 0 1,476
CY Imports 310 282 310 290 0 275
CY Imp. from U.S. 0 0 0 0 0 0
CY Exports 8 0 8 0 0 0
CY Exp. to U.S. 0 0 0 0 0 0
TS=TD 0 0 0 0 0 0

Commodities:
Select