Embed Size (px)
Citation preview

Thai Oil Public Company Limited
Q4 & 2016 Opportunity Day Presentation
2 Mar 2017
Time : 1.00 - 2.00 PM
Venue : Stock Exchange of Thailand
-2-
Disclaimer
The information contained in this presentation is intended solely for your
personal reference. Please do not circulate this material. If you are not an
intended recipient, you must not read, disclose, copy, retain, distribute or take
any action in reliance upon it.
Some statements made in this material are forward-looking with relevant
assumptions, which are subject to uncertainties, which may cause the actual
result/performance to be materially deviated from any future
result/performance implied by such forward-looking statements. Please note
that the company and management/staff are not capable to control and
guarantee if these forward-looking statements will be accurately materialized,
they are subject to various risks and uncertainties.

-3-
VISIONA LEADING FULLY INTEGRATED REFINING & PETROCHEMICAL
COMPANY IN ASIA PACIFIC
MISSION
• To be in top quartile on performance and return on investment
• To create a high-performance organization that promotes
teamwork, innovation and trust for sustainability
• To emphasis good Corporate Governance and commit to Corporate
Social Responsibility
VALUES
Corporate Vision, Mission and Values
Professionalism
Ownership & Commitment
Social Responsibility Integrity Teamwork & CollaborationInitiative
Vision Focus
Excellent Striving

-4-
Corporate Governance
Corporate Governance PolicyThe board of directors, management and all staff shall
commit to moral principles, equitable treatment to all
stakeholders and perform their duties for the company’s interest
with dedication, integrity, and transparency.
Anti-Corruption PolicyThe Board, the management, and employees must not
corrupt or accept corruption of all forms in any circumstances,
covering the business of the Company in every country and in
every relevant agency. The Company defines guidelines,
operating measures, and roles and duties of responsible persons,
as well as regularly monitoring and reviewing the
implementation of the anti-corruption policy in compliance with
changes in businesses, rules, regulations, and relevant laws.
Roles and Responsibilities
for Stakeholders
• Truthfully report company’s
situation and future trends to all
stakeholders equally on a timely
manner.
• Shall not exploit the confidential
information for the benefit of
related parties or personal gains.
• Shall not disclose any confidential
information to external parties.
Whistle-Blowing Channels
Should you discover any
ethical wrongdoing that is
not compliance to CG
policies or any activity that
could harm the Company’s
interest, please inform:
Chairman of the Board or
Chairman of the CG Committee or
Chairman of the Audit Committee or
CEO/President or Company Secretary
Thai Oil Public Company Limited
555/1 Energy Complex Building A
11F, Vibhavadi Rangsit Road,
Chatuchak, Bangkok 10900
http://www.thaioilgroup.com
+66-0-2797-2999 ext. 7440-7442
+66-0-2797-2973

-5-
Our Achievement in Sustainable Development
The World Most Sustainable Oil & Gas Refining and Marketing Company(from 28 invited companies in oil & gas refining and marketing industry)
60 industries3,420 companies invited2,473 companies assessed**cover companies outside DJSI invitation
For 4 consecutive years
For consecutive years 4

-6-
Presentation Agenda
2016 KEY HIGHLIGHTS
Q4 & 2016 PERFORMANCE ANALYSIS
1H-17 & 2017 MARKET OUTLOOK
TOP GROUP OVERVIEW

-7-
Thai Oil Group Business Structure
IRPC 20.0%
• 5 Oil & Chemical TankersCapacity : 52,350 DWT
• Crude Tankers: 3VLCCsCapacity: 881,050 DWT
• 14 crew & utility boats (120 DWT each)
• 2 Large vessels for crude, feedstock & product storage and transportation servicesCapacity: 200,000 DWT
• Ship management services
9.2 %
Principal power plant of PTTTotal Equity Capacity 1,922 MW of electricity 1,582 tons/hour of steam 2,080 Cu.m./hour of Industrial water 12,000 RT of Chilled water
PTT Group 80.0%
100.0% 100.0% 74.0% 100.0%
Thaioil (TOP)Thai Lube Base
(TLB)Thaioil Power
(TP)
Global Power Synergy Public Company Limited
Thaioil Energy Services(TES)
Thaioil Marine(TM)
Capacity : 275,000 barrels/day Small Power Producer
Program3-on-1 Combined CycleElectricity 118 MWSteam 216 tons/hour
PTT 26.0%
Proceeds the business on various professional of management services
PTT 22.6%
Thaioil 8.9%
TP 20.8%
100.0%
Thappline (THAP)
Multi-product PipelineCapacity:26,000 m.lts/y
20.0%
PTT 40.4%
Others 50.4%
Lube Base Oil Capacity :Base Oil 267,015 tons/annumBitumen350,000 tons/annumTDAE67,520 tons/annum
Thaioil SolventThrough TOP Solvent (TS)
100.0%
100.0%
Thaioil Ethanol(TET)
Solvent manufacturerCapacity : 141,000tons/annum
Thai Paraxylene(TPX)
100.0%80.5%
Solvent distribute in Thailand
Sak Chaisidhi (SAKC)
Top Solvent Vietnam
Solvent distribute in Vietnam
PTT ICT Solutions(PTT ICT)
Sapthip (SAP)
Cassava Based EthanolCapacity : 200,000 lts/day
50.0%
Ubon Bio Ethanol (UBE)21.3%
Cassava/Molasses Based PlantCapacity : 400,000 lts/day
PTT Energy Solutions(PTTES)
Provides engineering technique consulting services
20.0%PTT 40.0%
PTTGC 20.0%
BCP 21.3%Others 57.4%
PTTGC 22.7%
Aromatics Capacity:Paraxylene 527,000 tons/annumMixed Xylene52,000 tons/annumBenzene 259,000 tons/annumTotal 838,000 tons/annum
LABIX Company Limited (LABIX)
LAB producer and distributorCapacity: 120 KTA COD: 2016
Mitsui 25.0%75.0% TOP SPP
2 Small Power Producers Total capacity: 239 MWSteam capacity 498 T/HCOD 2016
100.0%
Sells Electricity/Steam to Group
47% 28% 14% 11%RefineryAromaticsLube BaseOthers
Net Profit Contribution
(Avg. from 2006 – 2016)

-8-
Key Milestones: 55 Years, A Long Track Record of Success
2007• Increased refining capacity to 275 kbd
2008• The first refinery in Thailand with diesel
production to comply with the sulfur content requirements of Euro IV
• Capacity expansion of Thai Paraxylene with total aromatics capacity of 900,000 tons p.a.
• Invested in Solvents business in Thailand and Vietnam
1993• We expanded our refining capacity to 190 kbd
1994 – 1997• Increased total refining capacity to 220 kbd• Initial investment in Thai Paraxylene (“TPX”) and
Thai Lube Base (“TLB”)• IPT became the first IPP to enter into a PPA with
EGAT2 with 700 MW capacity ; separately, Thaioil Power (“TP”) constructed the power generation plant under the SPP with 118 MW capacity
1961 – 1997 Capacity expansion and initial stage of
business diversification
2004 – 2011Listing, expansion and
diversification
TodayA leading integrated refining and
petrochemical group in Asia Pacific
• 275 kbd refinery ( approximately 22% of Thailand’s total refining capacity)
• Nelson index 9.81
• Diversified business through 13 subsidiaries
• The 3rd largest listed companyby revenue in Thailand
1961 – 1964
2004
1961• Incorporated
1964• Commenced
operation with distillation capacity of 35 kbd
• Simple refinery with Nelson complexity Index ~ 41
1970• Refining capacity
expanded to 65 kbpd
1989• Increased refining
capacity to 90 kbpd
2004• IPO and listed on the SET • Acquired remaining shares in
Thai Paraxylene and Thai Lube Base which became our wholly-owned subsidiaries
2007 -2008
2010
2011
1993-19971970-1989
2013-2014• Established LABIX• Invested in power biz via
GPSC & TOP SPP• Completed Emission
Improvement, HVU-2 Debottlenecking & CDU-3 Preheat Train project
2015-2016• 2016 Revenue 274,739 MB • 2016 Net profit 21,222 MB • Completed Projects: LABIX
& TOP SPP
2011• Manufactured diesel and
ULG in compliance with the sulfur and BZ aromatics content requirements of the Euro IV
• Acquired 1st VLCC
2010• Established
Thaioil Ethanol • Production
expansion of TDAE by 50,000 tons per annum
Note 1. Based on our internal estimates using the methodology of the Nelson Complexity Index 2. The Electricity Generating Authority of Thailand (“EGAT”) is the national grid

-9-
TOP Group Synergy & Strategic Role in PTT Group Value Chain
NATURAL GAS
CRUDE IMPORT
Mixed-Xylene
Solvent
Toluene
Pentane
Hexane
SOLVENTS
TP & TOP SPP provides electricity and steam to Thai Oil group and sells its remaining power to the national grid
AROMATICS & LAB
Lube Base Oil
Bitumen
TDAE
Slack Wax
ExtractLUBE BASE
REFINERY LPG
Fuel Oil
Diesel
Gasoline
Jet/Kero
PLATFORMATE
LONG RESIDUE
REFINED PETROLEUM
POWER
Diversifying to a broad
range of downstream
products to enjoy higher
profit margins and
reduce earnings
volatility
Thai Oil’s Businesses
The majority of refined petroleum products are sold domestically to PTT
PTT is our principal domestic customer for our lube base products
Upstream Intermediate Downstream
Paraxylene
Benzene
Mixed-Xylene
Toluene
LAB
-10-
2016 KEY HIGHLIGHTS
-11-
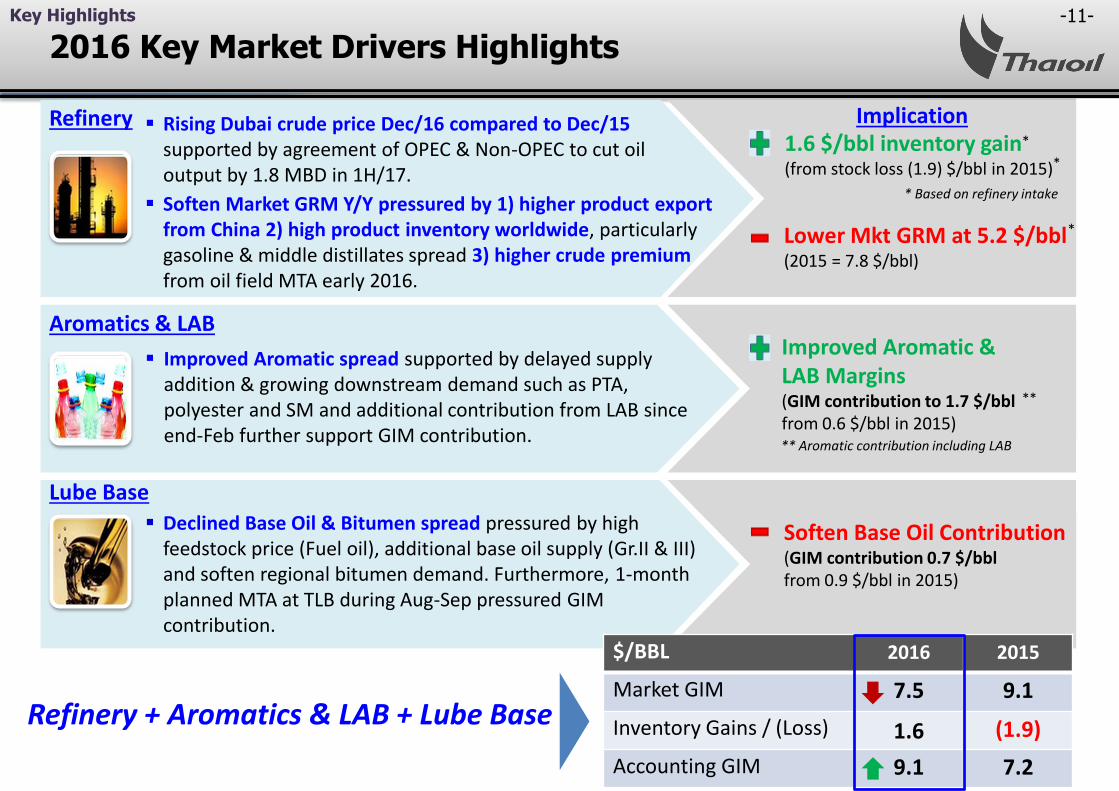
2016 Key Market Drivers Highlights
Improved Aromatic & LAB Margins(GIM contribution to 1.7 $/bbl from 0.6 $/bbl in 2015)
Implication1.6 $/bbl inventory gain(from stock loss (1.9) $/bbl in 2015)
Lower Mkt GRM at 5.2 $/bbl (2015 = 7.8 $/bbl)
Refinery
Aromatics & LAB
Lube Base
Soften Base Oil Contribution(GIM contribution 0.7 $/bbl from 0.9 $/bbl in 2015)
Refinery + Aromatics & LAB + Lube Base
$/BBL 2016 2015
Market GIM 7.5 9.1
Inventory Gains / (Loss) 1.6 (1.9)
Accounting GIM 9.1 7.2
Rising Dubai crude price Dec/16 compared to Dec/15 supported by agreement of OPEC & Non-OPEC to cut oil output by 1.8 MBD in 1H/17.
Soften Market GRM Y/Y pressured by 1) higher product export from China 2) high product inventory worldwide, particularly gasoline & middle distillates spread 3) higher crude premium from oil field MTA early 2016.
Declined Base Oil & Bitumen spread pressured by high feedstock price (Fuel oil), additional base oil supply (Gr.II & III) and soften regional bitumen demand. Furthermore, 1-month planned MTA at TLB during Aug-Sep pressured GIM contribution.
Improved Aromatic spread supported by delayed supply addition & growing downstream demand such as PTA, polyester and SM and additional contribution from LAB since end-Feb further support GIM contribution.
Key Highlights
*
*
* Based on refinery intake
*
**
** Aromatic contribution including LAB

-12-
3,292 4,078
12,55918,972
3,629
2,624
(532)
3,510
6,138
(6,945)(93)
242
1,041 1,338
274
(2,028) (2,145)
(3,808)
Net Operating Profit (before tax) Profitability Improvement
Stock G/(L) (before tax) Reversal of NRV/(NRV) (before tax)
Others
67%15%
6%9%
3%
2016 Key Achievements
Key Achievements 2016
Key Highlights
TOP Group Net Profit
Maintain high reliable production Unit : million THB (MB)
i.e. FX G/(L), Hedging G/(L), tax expense etc.
Operational Excellence 2016 2015
Refinery 108 % 108 %
Aromatic 81 % 81 %
Base Oil 81 % 86 %
21,222 MB
Q4/16
5,802 MB
Q3/16
2,941 MB
2016
12,181 MB
2015
Thailand Energy Awards 2016 (The Outstanding Award in Energy Conservation for a controlled plant)
Best IR by Senior Management & Best IR in Energy Sector from IR Magazine South East Asia 2016 & Best IR from SET Award 2016
The World Most Sustainable Oil & Gas Refining & Marketing Company for 4th
consecutive years (Jan/17)
Successfully COD: LAB in Q1/16 SPP (2 blocks) in Q2/16
Capture high local & Indochina sales of petroleum products
2016 2015
Local 87 % 80 %
Indochina 9 % 9 %
Other exports 4 % 11 %Growth
Sustainability& Awards
65%5%
17%
8%5%
2016 2015
* 1-month planned MTA
*
-13-
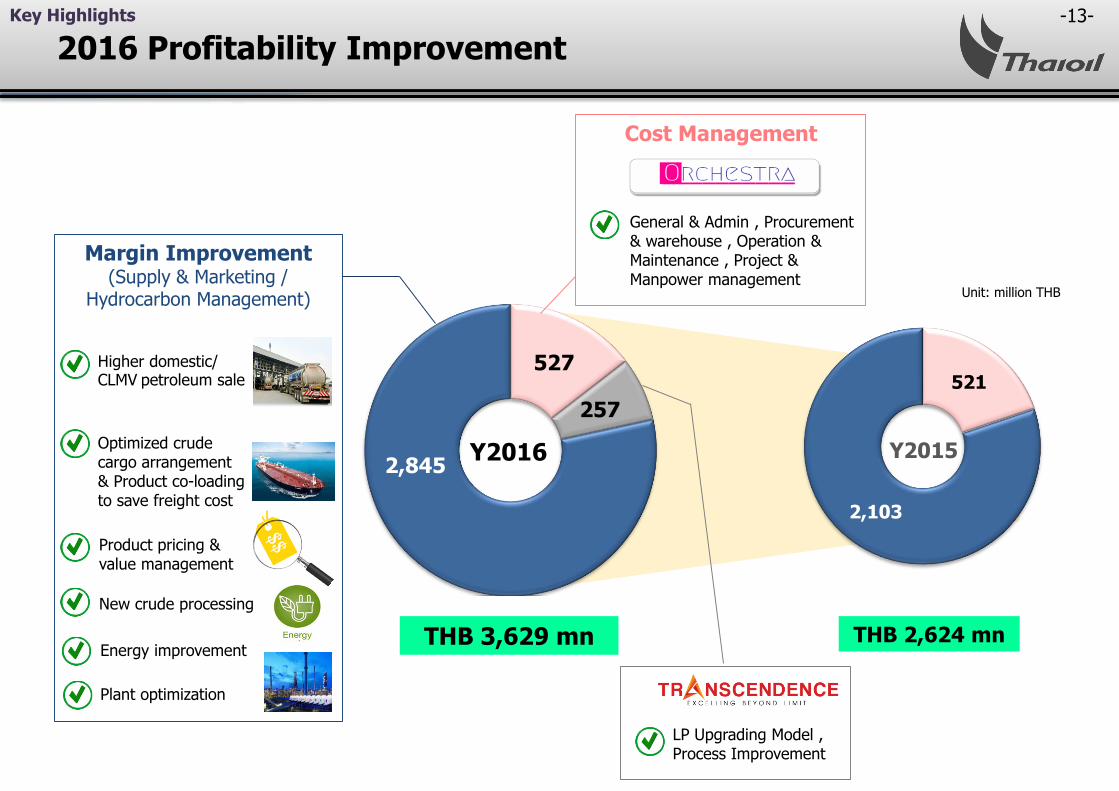
521
2,103
Y2016 Y2015
THB 3,629 mn THB 2,624 mn
Unit: million THB
527
257
2,845
Margin Improvement (Supply & Marketing /
Hydrocarbon Management)
Higher domestic/ CLMV petroleum sale
Product pricing & value management
Optimized crude cargo arrangement & Product co-loading to save freight cost
New crude processing
Energy improvement
Plant optimization
Cost Management
General & Admin , Procurement & warehouse , Operation & Maintenance , Project & Manpower management
LP Upgrading Model , Process Improvement
2016 Profitability ImprovementKey Highlights

-14-
Annual DPS (Baht/share)
1.80 3.50 3.50 4.50 2.75 2.55 2.00 3.30 2.70 2.30 1.16 2.70 4.50
Dividend Payout 25% 40% 45% 48% n.a. 43% 45% 45% 45% 50% n.a. 45% 43%
Dividend Yield* 4.0% 5.6% 5.6% 6.2% 5.2% 7.1% 4.0% 4.7% 4.2% 3.6% 2.3% 5.0% 6.7%
7.82
9.19
8.13
9.40
0.11
5.91
4.39
7.28
6.04
4.57
-2.03
5.97
10.40
FY/04 FY/05 FY/06 FY/07 FY/08 FY/09 FY/10 FY/11 FY/12 FY/13 FY/14 FY/15 FY/16
Avg TOP price 44.7 63.0 62.7 72.7 53.3 35.9 49.9 69.8 65.1 64.6 50.4 53.5 66.7
1.501.75 1.75
1.050.60
1.300.50 0.80 0.56 0.90
1.50
2.00
2.75
1.00 1.50
1.40
2.00
2.20 1.50 0.60
1.80
3.00
1.80
3.50
Dividend Policy : Not less than 25% of consolidated net profit after deducting reserves, subject to cash flow and investment plan
Unit : THB/Share EPSR
1H dividend
* Based on average TOP share price in each year
2H dividend
Year Dividend
2016 Dividend Payment
R Based on restated financial statement (year 2013 – 2014)
**
** Dividend payout before restated = 45%
***
*** Subject to AGM Approval on Apr 7,2017
Key Highlights

-15-
Q4 & 2016 PERFORMANCE ANALYSIS

-16-
TOP’s Domestic Sale vs Industry**Sales breakdown by customers
Refinery: Ongoing High Utilization Rate & Domestic Sales Portion
** Source: Department of Energy Business, Ministry of Energy
85%85% 87% 89% 87%
86%80%
71%
15% 15% 13%11% 13% 14% 20% 29%
Q4/16
TOP IndustryThailand
TOP IndustryThailand
FY/15
TOP IndustryThailand
Q3/16
ExportQ3/16 Q4/16 FY/16 FY/15
TOP Ind. TOP Ind. TOP Ind. TOP Ind.
CLMV 9% 5% 8% 6% 9% 5% 9% 8%
Others 6% 10% 5% 5% 4% 9% 11% 21%
Domestic
Export
FY/16
TOP IndustryThailand
39%
12%6%
1%
29%
9%4%
DomesticJobbers
Q4/16
Sales
Breakdown
Export 13%
39%
12%6%
1%
29%
9%4%
DomesticJobbers
FY/16
Sales
Breakdown
Export 13%
TOP/ Domestic Refinery Utilization Rate
94% 95% 94% 95%
91%88% 89%
95% 94%91%
106%107%107%110%
107%109%
107%110%
108%108%
70%
90%
110%
Q1/15 Q2 Q3 Q4 Q1/16 Q2 Q3 Q4 2015 2016
Industry utilization rate TOP utilization rate
Unit: % Utilization Rate
0
200
400
600
800
Mogas Jet/Kero Diesel Total Demand
2015 2016
3.1%
9.8%
5.4%
KBD
6.8%
Domestic Oil Demand
*
* exclude Fuel Oil & LPG demand
Refining
-17-
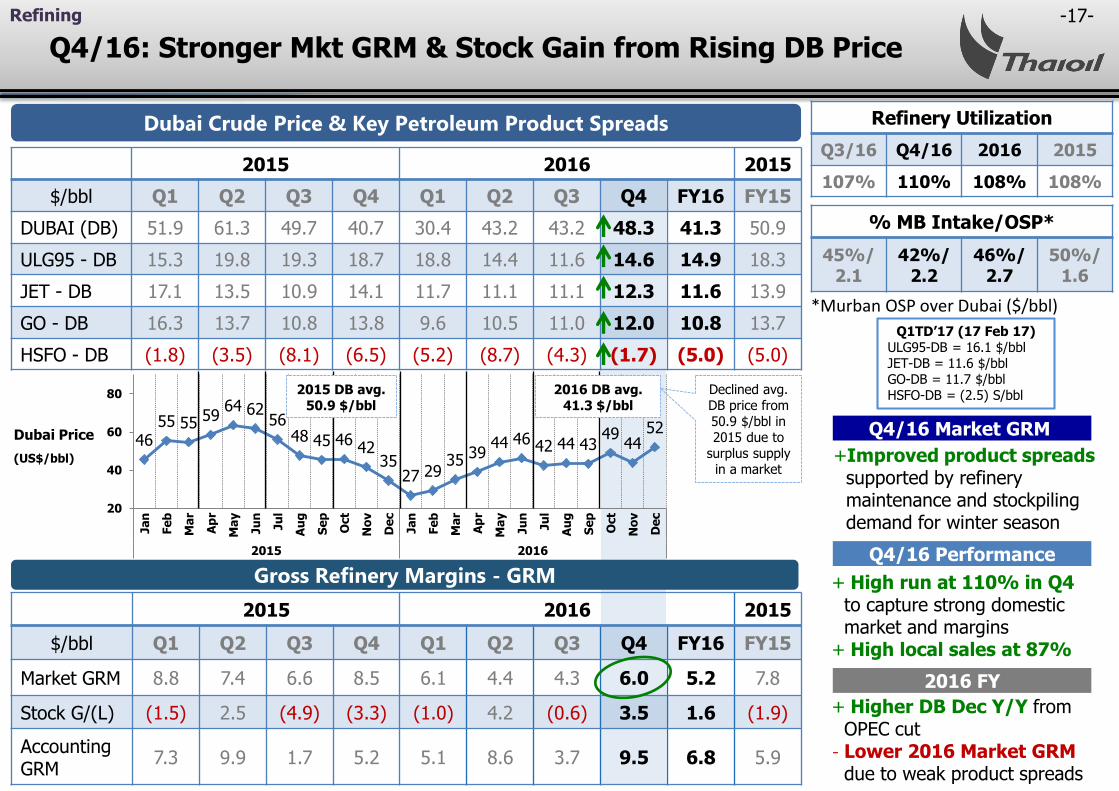
2015 2016 2015
$/bbl Q1 Q2 Q3 Q4 Q1 Q2 Q3 Q4 FY16 FY15
DUBAI (DB) 51.9 61.3 49.7 40.7 30.4 43.2 43.2 48.3 41.3 50.9
ULG95 - DB 15.3 19.8 19.3 18.7 18.8 14.4 11.6 14.6 14.9 18.3
JET - DB 17.1 13.5 10.9 14.1 11.7 11.1 11.1 12.3 11.6 13.9
GO - DB 16.3 13.7 10.8 13.8 9.6 10.5 11.0 12.0 10.8 13.7
HSFO - DB (1.8) (3.5) (8.1) (6.5) (5.2) (8.7) (4.3) (1.7) (5.0) (5.0)
2015 2016 2015
$/bbl Q1 Q2 Q3 Q4 Q1 Q2 Q3 Q4 FY16 FY15
Market GRM 8.8 7.4 6.6 8.5 6.1 4.4 4.3 6.0 5.2 7.8
Stock G/(L) (1.5) 2.5 (4.9) (3.3) (1.0) 4.2 (0.6) 3.5 1.6 (1.9)
AccountingGRM
7.3 9.9 1.7 5.2 5.1 8.6 3.7 9.5 6.8 5.9
4655 55 59
64 6256
48 45 4642
3527 29
35 3944 46 42 44 43
4944
52
20
40
60
80
Ja
n
Fe
b
Ma
r
Ap
r
Ma
y
Ju
n
Ju
l
Au
g
Se
p
Oct
No
v
De
c
Ja
n
Fe
b
Ma
r
Ap
r
Ma
y
Ju
n
Ju
l
Au
g
Se
p
Oct
No
v
De
c
2015 2016
Refining
Dubai Crude Price & Key Petroleum Product Spreads Refinery Utilization
Q3/16 Q4/16 2016 2015
107% 110% 108% 108%
Gross Refinery Margins - GRM
+Improved product spreads supported by refinery maintenance and stockpiling demand for winter season
Dubai Price
(US$/bbl)
Q4/16 Market GRM
Q4/16 Performance
*Murban OSP over Dubai ($/bbl)
Q1TD’17 (17 Feb 17) ULG95-DB = 16.1 $/bblJET-DB = 11.6 $/bblGO-DB = 11.7 $/bblHSFO-DB = (2.5) S/bbl
Q4/16: Stronger Mkt GRM & Stock Gain from Rising DB Price
2015 DB avg. 50.9 $/bbl
2016 DB avg. 41.3 $/bbl
Declined avg. DB price from 50.9 $/bbl in 2015 due to
surplus supply in a market
% MB Intake/OSP*
45%/2.1
42%/2.2
46%/2.7
50%/1.6
2016 FY
+ High run at 110% in Q4 to capture strong domestic market and margins
+ High local sales at 87%
+ Higher DB Dec Y/Y from OPEC cut
- Lower 2016 Market GRM due to weak product spreads

-18-
2015 2016 2015
Q1 Q2 Q3 Q4 Q1 Q2 Q3 Q4 FY16 FY15
Aromatic P2F -$/ton 11 76 54 93 98 99 109 95 100 63
Aromatic P2F -$/bbl 1.4 9.9 7.1 12.2 12.8 13.0 14.3 12.4 13.1 8.2
GIM contribution** (0.4) 0.8 0.5 1.3 1.4 1.7 1.9 1.5 1.7 0.6
Remark: TOL –ULG95 Q3/16 = 99 $/ton, Q4/16 = 103 $/ton, 2016 = 115 $/ton
290 251
224 277
238 224
266 235 235
270 295 299 290
360 347 339
292 314
377 345
303 266
296 278
120
56
119
184
66 94
164
70
25 59
125 119
121 167
180 177
130 108
193 187 143
100
191
264
-30
120
270
420
2015 2016 2015
$/ton Q1 Q2 Q3 Q4 Q1 Q2 Q3 Q4 FY16 FY15
PX*-ULG95 255 246 233 288 332 315 341 280 317 256
BZ*-ULG95 98 115 74 101 156 138 174 185 163 97
- Pressured Aromatics marginmainly from declined PX spread as startup of new PX plant from Reliance Industries No.4 phase 1 (0.8 MTA) but partially offset by better BZ spread as less supply from China & Japan due to environmental & earthquake incident respectively
Aromatics/LAB
Aromatics Spreads and Margins
Aromatic’s Sales (excluding byproduct) & Product-To-Feed Margin (P2F)
Aromatics Production
Q3/16 Q4/16 2016 2015
80% 82% 81% 81%
(Unit : KTon)
(US$/Ton)
PX-ULG95
BZ-ULG95
Q4/16 Market GRM
+ Higher Aromatic run at 82% & maintain high LAB run at 104%
103 108 126 106 104 113 108 110
48 4451
42 43 4435 545
3221 20
17 11 8TL
BZ
PX
** including LAB contribution since 25 Feb 2016
Q1TD’17 (17 Feb 17) PX-ULG95 = 302 $/tonBZ-ULG95 = 380 $/ton
Q4/16: Fallen Margins Mainly Pressured by Lower PX spread
435
17657
442
18559
* PX price = CFP Taiwan, BZ price = FOB Korea
Q4/16 Performance
2016 FY
+ Higher P2F due to less supply addition
-19-
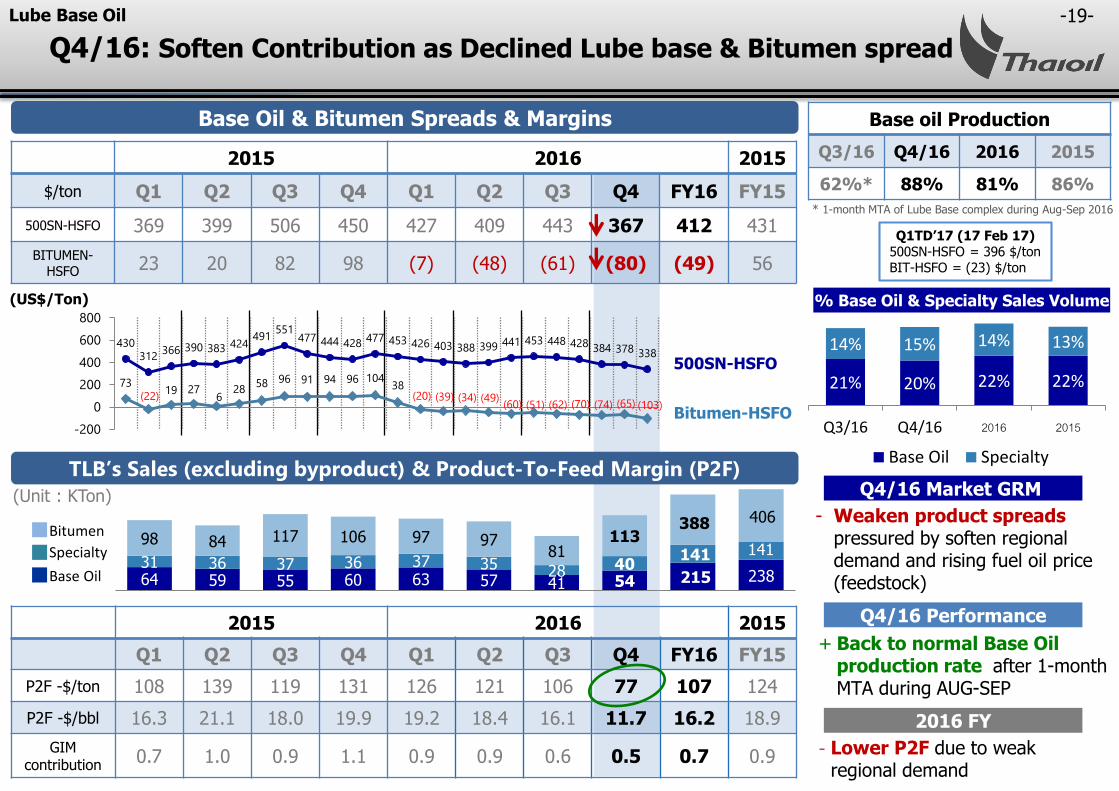
2015 2016 2015
$/ton Q1 Q2 Q3 Q4 Q1 Q2 Q3 Q4 FY16 FY15
500SN-HSFO 369 399 506 450 427 409 443 367 412 431
BITUMEN-HSFO 23 20 82 98 (7) (48) (61) (80) (49) 56
430312
366 390 383 424491
551477 444 428
477 453 426 403 388 399 441 453 448 428 384 378 338
73 (22)
19 27 6
28 58 96 91 94 96 104
38 (20) (39) (34) (49)
(60) (51) (62) (70) (74) (65) (103)
-200
0
200
400
600
800
2015 2016 2015
Q1 Q2 Q3 Q4 Q1 Q2 Q3 Q4 FY16 FY15
P2F -$/ton 108 139 119 131 126 121 106 77 107 124
P2F -$/bbl 16.3 21.1 18.0 19.9 19.2 18.4 16.1 11.7 16.2 18.9
GIM contribution
0.7 1.0 0.9 1.1 0.9 0.9 0.6 0.5 0.7 0.9
Lube Base Oil
64 59 55 60 63 57 41 5431 36 37 36 37 35 28 40
98 84 117 106 97 9781
113
Base Oil & Bitumen Spreads & Margins
TLB’s Sales (excluding byproduct) & Product-To-Feed Margin (P2F)
Base oil Production
Q3/16 Q4/16 2016 2015
62%* 88% 81% 86%
500SN-HSFO
Bitumen-HSFO
(Unit : KTon)
(US$/Ton)
Q4/16 Performance
Bitumen
Specialty
Base Oil
+ Back to normal Base Oil production rate after 1-month MTA during AUG-SEP
21% 20% 22% 22%
14% 15% 14% 13%
Q3/16 Q4/16 2016 2015
Base Oil Specialty
% Base Oil & Specialty Sales Volume
Q1TD’17 (17 Feb 17) 500SN-HSFO = 396 $/tonBIT-HSFO = (23) $/ton
Lower Base Oil Sales Volume
215
141
388
238
141
406
Q4/16: Soften Contribution as Declined Lube base & Bitumen spread
Q4/16 Market GRM
- Weaken product spreads pressured by soften regional demand and rising fuel oil price (feedstock)
* 1-month MTA of Lube Base complex during Aug-Sep 2016
2016 FY
- Lower P2F due to weak regional demand
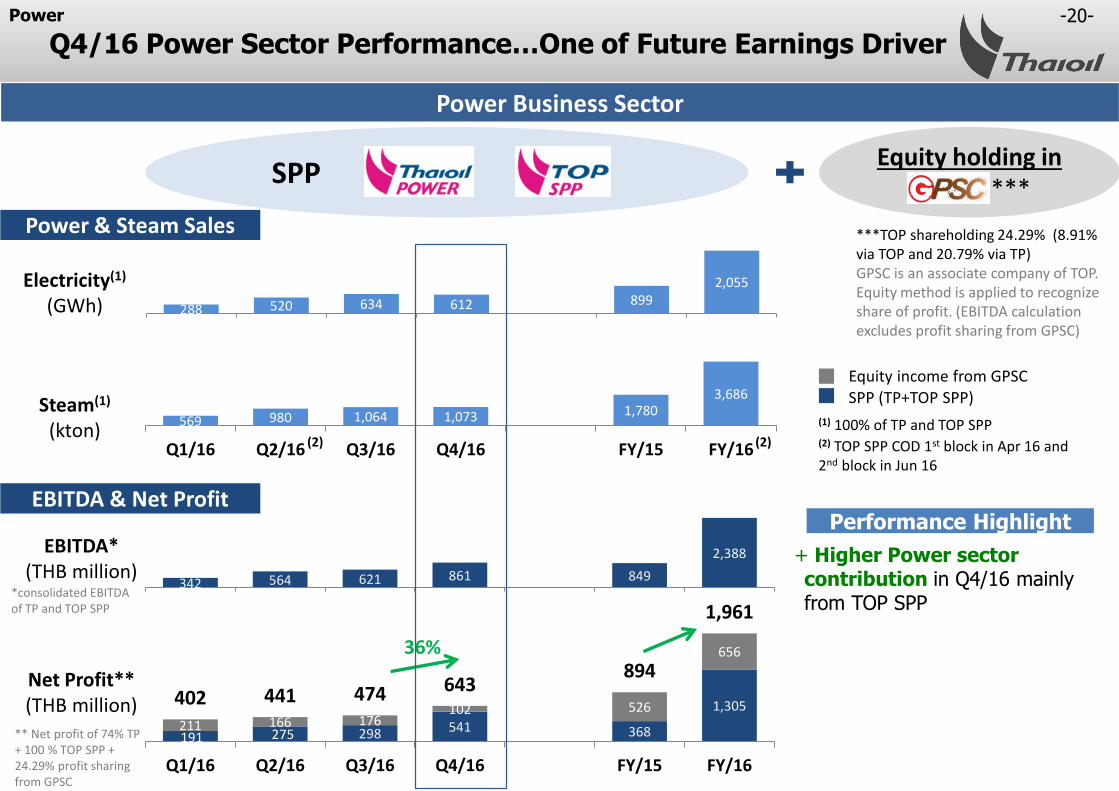
-20-
288 520 634 612 8992,055
Q1/16 Q2/16 Q3/16 Q4/16 FY/15 FY/16
Equity holding inGPSC ****
SPP
Q4/16 Power Sector Performance…One of Future Earnings Driver
342 564 621 861 849
2,388
Q1/16 Q2/16 Q3/16 Q4/16 FY/15 FY/16
191 275 298 541 368
1,305
211 166 176102 526
656
402 441 474 643894
1,961
Q1/16 Q2/16 Q3/16 Q4/16 FY/15 FY/16
*consolidated EBITDA of TP and TOP SPP
** Net profit of 74% TP + 100 % TOP SPP + 24.29% profit sharing from GPSC
+ Higher Power sector contribution in Q4/16 mainly from TOP SPP
36%
Power Business Sector
Power & Steam Sales
EBITDA & Net Profit
Electricity(1)
(GWh)
Steam(1)
(kton)569 980 1,064 1,073 1,780
3,686
Q1/16 Q2/16 Q3/16 Q4/16 FY/15 FY/16
EBITDA*(THB million)
Net Profit**(THB million)
***TOP shareholding 24.29% (8.91% via TOP and 20.79% via TP)GPSC is an associate company of TOP. Equity method is applied to recognize share of profit. (EBITDA calculation excludes profit sharing from GPSC)
SPP (TP+TOP SPP)Equity income from GPSC
Power
(1) 100% of TP and TOP SPP(2) (2) (2) TOP SPP COD 1st block in Apr 16 and
2nd block in Jun 16
Performance Highlight

-21-
4.1 4.9 5.4
1.1
7.6 5.8 5.2
6.7 5.9
9.4 1.8 1.8
0.1
0.1
0.6
0.6 1.7 1.7
1.6
1.6
0.9 0.9
0.7
0.7
0.9
0.9 0.7
0.7 0.5
0.5
6.8 6.2
9.17.5 8.07.6
1.9
7.2 9.1
11.5
2013 2014 2015 2016 Q4/16
Refinery Aromatics+LAB Lube Base
4.3
5.7
7.8
5.26.0
5.1
1.2
5.96.8
9.5
2013 2014 2015 2016 Q4/16
1.4 1.5 1.3 1.4 1.80.7 0.8 0.6 0.5
0.52.1 2.3 1.9 1.9 2.3
2013 2014 2015 2016 Q4/16
Operating Cost Interest Expense
1.7 1.8 1.5 1.8 2.30.6 0.7 0.6 0.5
0.62.32.5
2.1 2.3 2.9
2013 2014 2015 2016 Q4/16
Operating Cost Interest Expense
Refinery’s Cash Cost
(Unit: US$/bbl)
Group’s Cash Cost
(Unit: US$/bbl)
(Unit: US$/bbl)
Market GIM Accounting GIM (Market GIM + Stock G/L)
Market GRM Accounting GRM (Market GRM + Stock G/L)
Gross Refining Margin
Gross Integrated Margin
(Unit: US$/bbl)
Integrated Margin & Competitive Cash Cost
Financial
*
*
*Including MTA cost in MTA period since mid Jun-late July 2014 for 46 days (TOP MTA cost in 2014 = 436 MB or 0.14 $/bbl)
*Including MTA cost in MTA period since mid Jun-late July 2014 for 46 days ( TOP group MTA cost in 2014 = 609 MB or 0.20 $/bbl)
(excl. one-time non-operating item)
(excl. one-time non-operating item)
(net)
(net)
Higher group cash cost in 2016 mainly from MTA cost in TLB ~198 MB or ~ 0.1 $/bbl
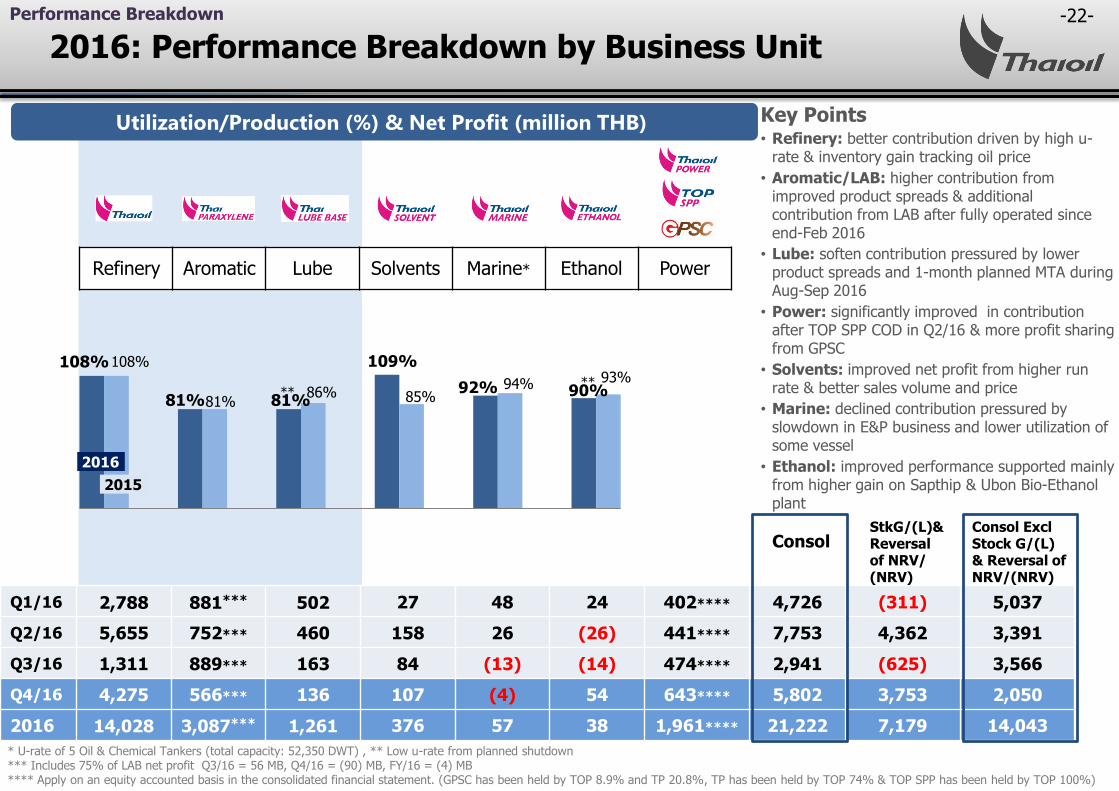
-22-
* U-rate of 5 Oil & Chemical Tankers (total capacity: 52,350 DWT) , ** Low u-rate from planned shutdown*** Includes 75% of LAB net profit Q3/16 = 56 MB, Q4/16 = (90) MB, FY/16 = (4) MB**** Apply on an equity accounted basis in the consolidated financial statement. (GPSC has been held by TOP 8.9% and TP 20.8%, TP has been held by TOP 74% & TOP SPP has been held by TOP 100%)
2016: Performance Breakdown by Business Unit
Q1/16 2,788 881*** 502 27 48 24 402**** 4,726 (311) 5,037
Q2/16 5,655 752*** 460 158 26 (26) 441**** 7,753 4,362 3,391
Q3/16 1,311 889*** 163 84 (13) (14) 474**** 2,941 (625) 3,566
Q4/16 4,275 566*** 136 107 (4) 54 643**** 5,802 3,753 2,050
2016 14,028 3,087*** 1,261 376 57 38 1,961**** 21,222 7,179 14,043
108%
81% 81%
109%
92% 90%
108%
81%86% 85%
94% 93%
2016
2015
Refinery Aromatic Lube Solvents Marine* Ethanol Power
Performance Breakdown
Consol
Utilization/Production (%) & Net Profit (million THB)
StkG/(L)&Reversal of NRV/(NRV)
Consol ExclStock G/(L)& Reversal of NRV/(NRV)
****
Key Points• Refinery: better contribution driven by high u-
rate & inventory gain tracking oil price
• Aromatic/LAB: higher contribution from improved product spreads & additional contribution from LAB after fully operated since end-Feb 2016
• Lube: soften contribution pressured by lower product spreads and 1-month planned MTA during Aug-Sep 2016
• Power: significantly improved in contribution after TOP SPP COD in Q2/16 & more profit sharing from GPSC
• Solvents: improved net profit from higher run rate & better sales volume and price
• Marine: declined contribution pressured by slowdown in E&P business and lower utilization of some vessel
• Ethanol: improved performance supported mainly from higher gain on Sapthip & Ubon Bio-Ethanol plant
-23-
THB/US$ - average 35.57 35.00 0.57
THB/US$ - ending 36.00 34.88 1.12
Effective Tax Rate (%) * 12% 13% (1%)
35.46 34.44 1.02
36.00 36.25 (0.25)
10% 11% (1%)
Stock G/(L)&Reversal of NRV/(NRV) 3,753 (625) 4,378
Net Profit/ (Loss) excl. StkG/(L) and Reversal of NRV/(NRV)
2,050 3,566 (1,516)
Sales Revenue 77,104 68,476 8,628
Hedging Gain / (Loss) (330) 206 (536)
EBITDA 10,085 5,392 4,693
EBITDA excl. Stk G/(L) & Reversal of NRV/(NRV)
6,332 6,017 315
Financial Charges (911) (879) (32)
FX G/(L) & CCS (870) 519 (1,389)
(Tax Expense)/reversal of income tax (794) (451) (343)
Net Profit / (Loss) 5,802 2,941 2,861
EPS (THB/Share) 2.84 1.44 1.40
35.99 (0.42)
36.25 (0.25)
13% (1%)
(4,166) 7,918
7,915 (5,865)
Financial
68,446 8,658
1,053 (1,383)
6,348 3,737
10,514 (4,182)
(659) (252)
318 (1,188)
(566) (228)
3,749 2,053
1.84 1.00
7,179 (5,608) 12,786
14,043 17,789 (3,746)
274,739 293,569 (18,830)A
(243) 1,489 (1,732)B
32,675 25,492 7,183C
25,496 31,099 (5,603)D
(3,461) (3,435) (26)
446 (2,754) 3,200E
(2,295) (1,597) (698)F
21,222 12,181 9,041
10.40 5.97 4.43
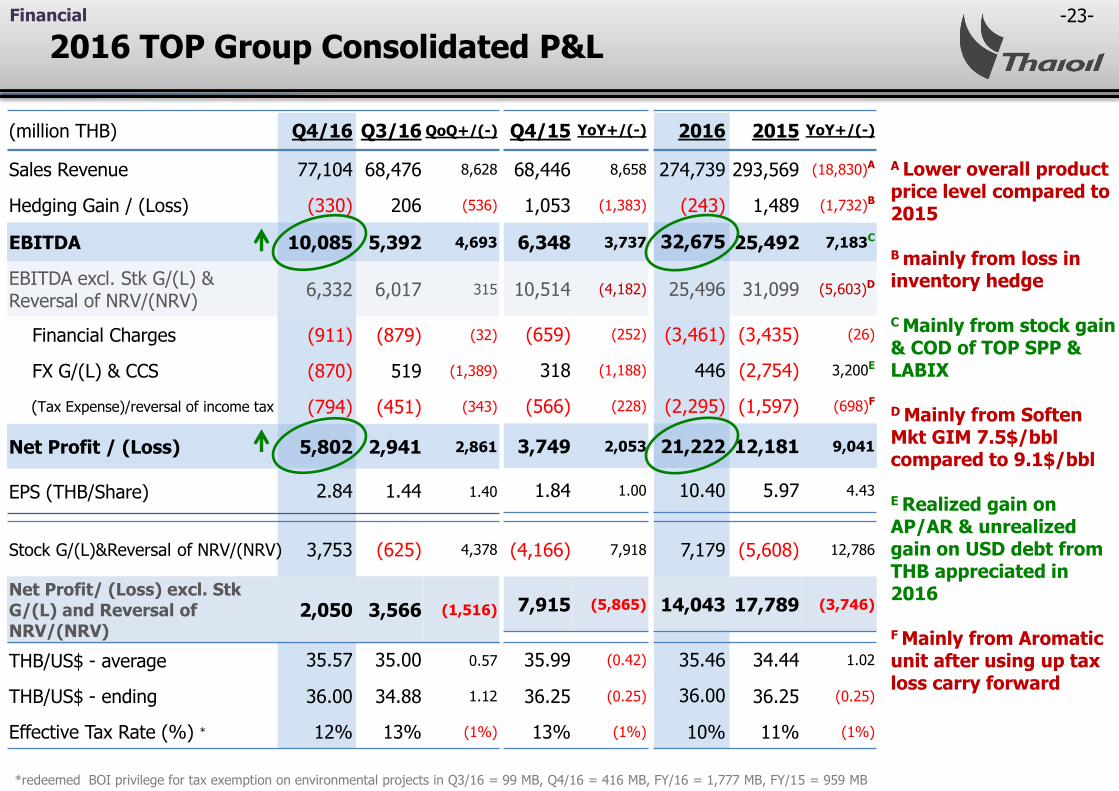
2016 TOP Group Consolidated P&L
*redeemed BOI privilege for tax exemption on environmental projects in Q3/16 = 99 MB, Q4/16 = 416 MB, FY/16 = 1,777 MB, FY/15 = 959 MB
(million THB) Q4/16 Q3/16 QoQ+/(-) Q4/15 YoY+/(-) 2016 2015 YoY+/(-)
A Lower overall product price level compared to 2015
B mainly from loss in inventory hedge
C Mainly from stock gain & COD of TOP SPP & LABIX
D Mainly from Soften Mkt GIM 7.5$/bbl compared to 9.1$/bbl
E Realized gain on AP/AR & unrealized gain on USD debt from THB appreciated in 2016
F Mainly from Aromatic unit after using up tax loss carry forward

-24--24-
Financing (9,397) (14,740)
Loans proceeding 4,0912 4,971
Loans repayment (3,051)3 (13,128)
Dividends paid (6,994) (3,194)
Interest (3,443) (3,389)
2016 2015
Operating Cash Flow 23,182 31,708
Net income & non-cash adj. 32,832 25,453
Change in working capital (9,650) 6,255
Free Cash Flow 4,830 34,238
2016 TOP Group Consolidated Cash Flow
Beginning
cash 35,764
S/T investment 17,365
53,129
+
+ =
+
2016 2015
Investments (18,352) 2,530
ST investments (12,057) 12,881
CAPEX (PP&E) & other (6,295)1 (10,351)
Ending
31,1214
29,654
60,775
Effect of FCD
(76)+Change
(4,567)
12,290*
Operating Cash Flow Investments
Financing
(Unit: Million THB) (Unit: Million THB)
Financial
1 Mainly from LABIX, TOPSPP and TOP
2 Mainly form LABIX3 Mainly form SAPTHIP, LABIX, SAKC & TM
4 Mainly form USD FCD
*non-cash transaction 233MB recorded as other payable-Proceed of purchase securities (Private fund)

-25-
Value (Million) Portion
US$ Bond & US$ Loan USD 1,191 57%
THB Bond THB 25,500 34%
THB Loan THB 7,050 9%
101,676 102,982 102,000
37,361 44,458 54,956
53,129 56,425 60,775
97,009
105,730 111,597
75,093 74,374 75,434
20,064 23,761
30,700
1.7
0.7 0.6
31-Dec-14 31-Dec-15 31-Dec-16
0.4 0.2 0.1
31-Dec-14 31-Dec-15 31-Dec-16
1) Including current portion of Long-Term Debt
Financial Ratios
Net Debt / adj. EBITDA** Net Debt / Equity
Statements of Financial Position
(Unit: million THB)
Trade Payable/ Others
LT Debt1)
Equities
CurrentAssets
Non-CurrentAssets
Cash & ST investment
217,731192,166
31 Dec 15 31 Dec 16
** Annualized EBITDA (excl stock gain/loss & Reversal of NRV/(NRV))
2016 TOP Group Strong Financial Position & Financial RatiosFinancial
ROE 13.2% 18.9% 20.3%
ROIC 12.6% 17.9% 18.8%
*
* Based on actual performance in the past 12 months
*
***Calculated by interest expense net off interest income as per FS as at 31 Dec 16
*
*
30 Sep 16
203,865
Cost of Debt
TOP Group (Net***) 3.63%
TOP Group (Gross) 4.75%
BBBStable Outlook
Baa1Stable Outlook
AA- (tha)Stable Outlook
Interest Rate Portion
Float 10%
Fixed 90%
TOP avg.debt life 10.9 Yrs
Consolidated Long-Term Debt as at 31 Dec 16 1)
75,434 million THB
(US$ 2,095 million
equivalence)
Total Long-Term Debt Net Debt
As at 31 Dec 16 (36.00 THB/US$)
15,526 million THB
(US$ 431 million equivalence)
-26-
1H-17 & 2017 MARKET OUTLOOK
• Crude Oil
• Petroleum Products
• Aromatics
• Base Oil & Bitumen
• Linear Alkyl Benzene (LAB)
-27-
CRUDE OIL

-28-
0
20
40
60
80
Jul-15 Oct-15 Jan-16 Apr-16 Jul-16 Oct-16 Jan-17 Apr-17 Jul-17 Oct-17
$/BBL
Dubai Price Movement
•Expectation of High Compliance For Output Cut Deal
• Oil Market to Rebalance, Driven By Output Cut Deal and Growing Oil Demand
• Risks Over Rising Crude Oil Supply
China’s stock market crash
Crude Oil
Crude Oil Market: Oil Market to Rebalance in 2017
Key Highlights in 1H-17 *Q1TD’17 (as of 10 Feb): $ 53.8/BBL
OPEC failed to agree on an
output ceiling
No consensus on output freeze
1
2
BREXIT
Iran’s nuclear deal done
Canada wildfire & Nigerian outages
Iran’s nuclear sanction lifted
OPEC targeted 32.5-33.0 MBD output
OPEC agreed to cut output to 32.5 MBD
3
Non-OPEC agreed to cut output by 0.558 MBD

-29-
10.6
10.8
11.0
11.2
11.4
11.6
11.8
Jan-16 Apr-16 Jul-16 Oct-16 Jan-17 Apr-17
Russia’s Crude Oil Production
1 Expectation of High Compliance For Output Cut Deal
Russia to Gradually Reduce Its Output
High Compliance From OPEC and Non-OPEC Bigger Cut Than Agreed Level From Saudi
MBD
A
C
B
1.164 1.078
0.558
0.403
0.0
0.5
1.0
1.5
2.0
Target cut Expected cut
OPEC & Non-OPEC Supply Cut
OPEC Non-OPEC
► Around 86% compliance from OPEC
and Non-OPEC members
► 93% compliance from OPEC, more
than the initial 60% compliance during
the previous cuts in 2009
0.0
0.2
0.4
0.6
0.8
Saudi Arabia Iraq UAE Kuwait
Major OPEC Production Cut
Target cut Expected cut
MBD
123%
40%59% 92%
MBD
Sources: IEA (Jan’17) and PIRA (Jan’17)
Target Cut :0.3 MBD
Jan’s Cut :0.1 MBD (33%)
Crude Oil
Sources: OPEC (Jan’17), and Reuters (Jan’17)
1.722
1.481
Sources: OPEC (Jan’17), and Reuters (Jan’17)
-30-
-2.0
-1.0
0.0
1.0
2.0
3.0
4.0
90
92
94
96
98
100
1Q-14 3Q-14 1Q-15 3Q-15 1Q-16 3Q-16 1Q-17 3Q-17
MBDMBD
Surplus (RHS) Demand (LHS) Supply (LHS)
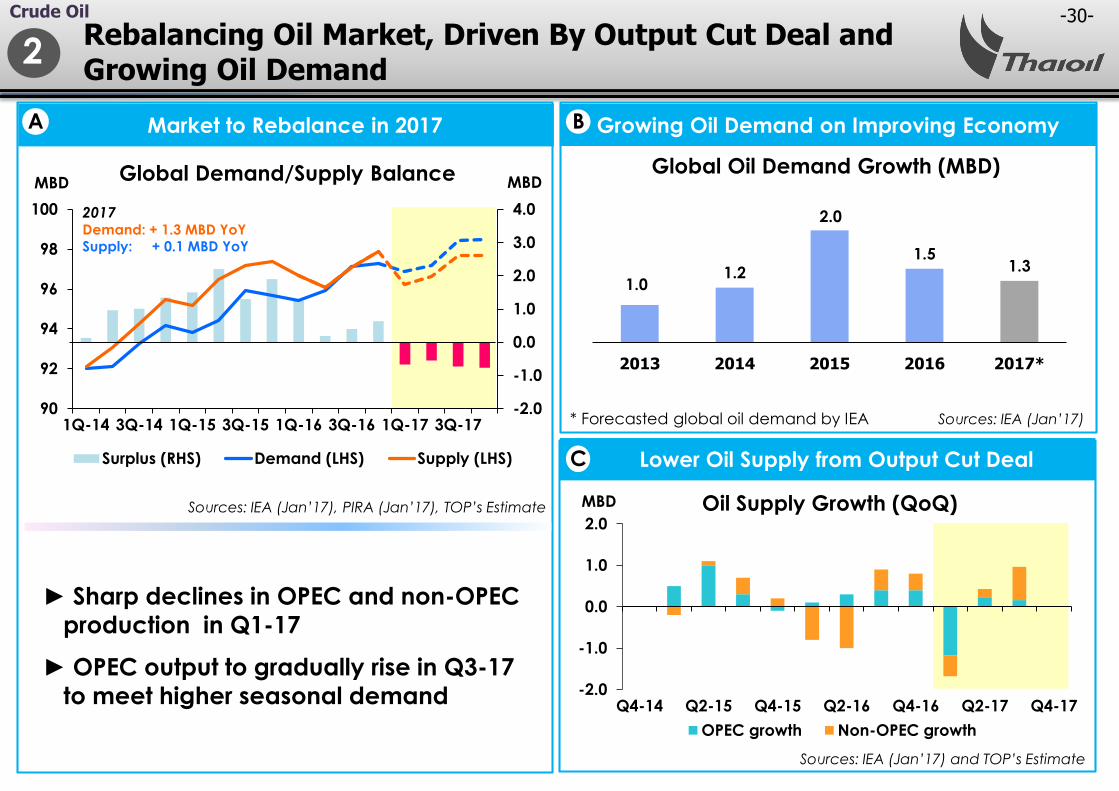
Global Demand/Supply Balance
2017Demand: + 1.3 MBD YoYSupply: + 0.1 MBD YoY
Lower Oil Supply from Output Cut Deal
Rebalancing Oil Market, Driven By Output Cut Deal and Growing Oil Demand
Crude Oil
2
Market to Rebalance in 2017 Growing Oil Demand on Improving Economy
MBD
A
C
-2.0
-1.0
0.0
1.0
2.0
Q4-14 Q2-15 Q4-15 Q2-16 Q4-16 Q2-17 Q4-17
Oil Supply Growth (QoQ)
OPEC growth Non-OPEC growth
B
► Sharp declines in OPEC and non-OPEC
production in Q1-17
► OPEC output to gradually rise in Q3-17
to meet higher seasonal demand
Sources: IEA (Jan’17), PIRA (Jan’17), TOP’s Estimate
1.01.2
2.0
1.51.3
2013 2014 2015 2016 2017*
Global Oil Demand Growth (MBD)
Sources: IEA (Jan’17)* Forecasted global oil demand by IEA
Sources: IEA (Jan’17) and TOP’s Estimate

-31-Crude Oil
3 Risks Over Rising Crude Oil Supply
Rising Libyan Output After Being Disrupted Concerns Over Resuming Nigeria’s Oil SupplyA B
Recovering US Shale Oil on More Drilling ActivitiesC
Total U.S. Oil Production YoYMBD
0.0
0.5
1.0
1.5
2.0
2.5
2010 2011 2012 2013 2014 2015 2016 2017
Libya’s Oil Production
Capacity : 1.6 MBD
MBD
Gov’t Target :1.25 MBD
Market view :1.00 MBD
Sources: IEA (Jan’17), Reuters, TOP’s Estimates
Sources: EIA (Jan’17) and IEA (Jan’17)
Sources: IEA (Jan’17) and PIRA (Jan’17)
Dakota Pipeline to Be Completed in Q2-17D
-1.0
-0.5
0.0
0.5
1.0
1.5
2.0
Jan'15 Jul'15 Jan'16 Jul'16 Jan'17 Jul'17
Alaska Gulf of Mexico Lower 48 states
US production to rise
by 0.1 MBD in 2017
Dakota Access Pipeline Map
Freight saving(over railways)
= “$5-10/BBL”
1 Railways 2
Capacity : 470 KBD
Location :Bakken – Illinois
0.0
0.5
1.0
1.5
2.0
2.5
2010 2011 2012 2013 2014 2015 2016 2017
Nigeria’s Oil ProductionMBD
Capacity : 2.2 MBD
Gov’t Target :2.20 MBD
Market view :1.55 MBD
North Dakota (Bakken)
-32-
PETROLEUM PRODUCTS
-32-

-33-
5.8
8.57.9
6.1
8.0 7.6 7.7
5.0 5.2
6.76.2
6.9
Y2014 Q1-15 Q2-15 Q3-15 Q4-15 Y2015 Q1-16 Q2-16 Q3-16 Q4-16 Y2016 Q1TD-17*
Key Highlights in 1H-17
Singapore Cracking GRM ($/BBL)
Better Gasoline Margins on Solid Demand Growth and Low ME Supply
1
Steady Middle Distillate Cracks from Recovered Demand on Improved Economy and Cold Weather
Still-High Margins from Demand Outpacing Refinery Addition
($/BBL) Q1-16 Q2-16 Q3-16 Q4-16 2016 Q1TD-17*
ULG95-DB 18.8 14.4 11.6 14.6 14.9 16.1
JET-DB 11.7 11.1 11.1 12.3 11.6 11.6
GO-DB 9.6 10.5 11.0 12.0 10.8 11.7
HSFO-DB (5.2) (8.7) (4.3) (1.7) (5.0) (2.5)
2
Remarks: *Q1TD-17 as of 17 Feb 17
Refinery

-34-
Deficit in Q2/17 on High DemandB
Demand Continues to Outstrip Supply in 2017D
Better Gasoline Margins on Solid Demand Growth and Low ME Supply1
Refinery
Tighter Product Supplied in ME after Ruwais S/DC
Still-high Gasoline Demand from Low Oil PricesA
MBD
0.0
0.2
0.4
0.6
0.8
1.0
2015 2016 2017(1H-17)
LPG
Naphtha
Gasoline
Jet Fuel
Diesel
Fuel Oil
Ruwais’s Refinery ProductionRuwais 2 (417 KBD)
Startup in Jan’16RFCC (125 KBD) S/D after fire broke out in Jan’17
Asia Pacific Gasoline Demand
6.0
6.5
7.0
7.5
Jan Feb Mar Apr May Jun Jul Aug Sep Oct Nov Dec
2016 2017
MBD
573 546532444
0
300
600
900
1200
2014 2015 2016 2017
Demand Supply
World Gasoline Demand & Supply Growth YoY
KBD
41102
Asia Pacific Gasoline Balance
-200
0
200
400
600
Jan Feb Mar Apr May Jun Jul Aug Sep Oct Nov Dec
2016 2017
MBD
1H-17 : 7.0 MBD (+4% YoY)
Source : FACTs (Jan’17) Source : FACTs (Jan’17)
Source : FACTs (Oct’16) , JBC (Nov’16) and TOP’s estimateSource : Reuters (Jan’17) and FGE (Feb’17)

-35-
Steady Exports from Stricter Regulations on TeapotC Better Market in 2017 from Recovered Demand D
Steady Middle Distillate Cracks from Recovered Demand on Improved Economy and Cold Weather2
Refinery
Greater Demand due to Cold WeatherBBetter Demand from Recovered Global Economy A
10.0
11.0
12.0
13.0
Jan Feb Mar Apr May Jun Jul Aug Sep Oct Nov Dec
2016 2017
MBDAsia Pacific Middle Distillate Demand U.S. Middle Distillate Demand
5.0
5.2
5.4
5.6
5.8
6.0
Jan Feb Mar Apr May Jun Jul Aug Sep Oct Nov Dec
2016 2017
MBD
126
716
36
417
0
300
600
900
1200
2014 2015 2016 2017
Demand Supply
World Middle Distillate Demand & Supply Growth YoYKBD
KBD Chinese Gasoil Export
0
100
200
300
400
500
600
Jan-16 Jul-16 Jan-17
1H-17 : 11.7 MBD (+2.4% YoY) 1H-17 : 5.5 MBD (+1.9% YoY)
AVG 2016 : 318 KBD AVG 1H-17 : 317 KBD
Source : FACTs (Jan’17)
Source : FACTs (Jan’17) Source : FACTs (Oct’16) , JBC (Nov’16) and TOP’s estimate
Source : EIA (Jan’17)
90
299

-36-
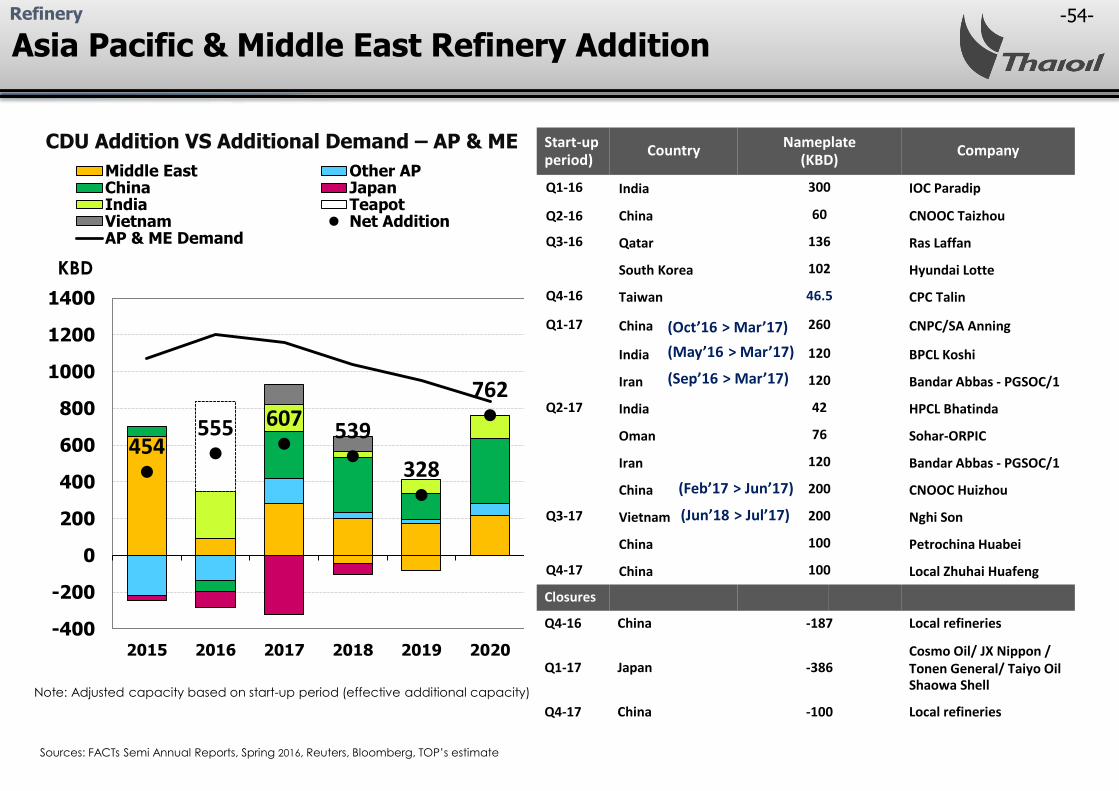
Firm Refinery Margins in 2017 as Demand Outpaces Refinery Addition
Refinery
Note: Adjusted capacity based on start-up period (effective additional capacity)
454555 607 539
328
762
-400
-200
0
200
400
600
800
1000
1200
1400
2015 2016 2017 2018 2019 2020
KBD
Middle East China Other AP
Japan India Vietnam
Teapot Net Addition AP & ME Demand
CDU Addition VS Additional Demand – AP & ME
Sources: FACTs Semi Annual Reports, Fall 2016, Reuters (Jan’17) , TOP’s estimate
Lower refinery addition in 2017 due to regulatory restrictions in Japan and delayed startup of two Chinese mega refineries

-37-
Year on YearAverage
2011-2015(B) Y 2015(B) Y 2016(B) Y 2017(C)
Mogas (A) +7.1% +13.3% +9.8% +1.3%
Jet/Kero +4.4% +9.7% +6.8% +3.7%
Diesel (A) +3.4% +4.0% +3.1% +2.4%
Total +4.4% +7.1% +5.4% +2.3%
GDP +3.4% +2.8% N/A +3.2%(D)
Domestic
Remarks: (A) Mogas and Diesel includes Ethanol and Biodiesel, respectively
(B) DOEB Statistics (Feb-17)
(C) PTT’s Estimation (Jul-16)
(D) BOT’s Estimate (BOT Monetary Report as of Dec-16)
Thailand Oil Demand Growth
Thailand Oil Demand Growth
Thailand oil demand growth at 2.3% YoY in 2017
-38-
AROMATICS

-39-
($/TON) Q1-16 Q2-16 Q3-16 Q4-16 2016 Q1TD-17*
PX-ULG95 332 315 341 280 317 302
BZ-ULG95 156 138 174 185 163 380
Key Highlights in 1H-17
Aromatics Market
Positive PX Outlook due to Strong Chinese Polyester Demand
Firm Chinese SM Demand Drives BZ Market
1
2
255 246 233
288256
332 315341
280317 302
Q1
-15
Q2
-15
Q3
-15
Q4
-15
Y2
01
5
Q1
-16
Q2
-16
Q3
-16
Q4
-16
Y2
01
6
Q1
TD
-17
*
PX CFR Taiwan-ULG95 ($/TON)
98 11574
101 97
156 138174 185
163
380
Q1
-15
Q2
-15
Q3
-15
Q4
-15
Y2
01
5
Q1
-16
Q2
-16
Q3
-16
Q4
-16
Y2
01
6
Q1
TD
-17
*
BZ FOB Korea-ULG95 ($/TON)
Firm Aromatics Market due to Strong Downstream Demand
Remarks: *Q1TD-17 as of 17 Feb 17
Aromatics

-40-
Growing Chinese PX Import Lifts MarketPolyester Demand Growth Boosts PX Market
Heavy Maintenance in Q2-17 Supports MarketNew PTA Capacity Addition Supports Market
Sources: PCI WoodMackenzie (Dec’16), IHS (Jan’17)
Positive PX Outlook due to Strong Chinese Polyester Demand
1
C
A
D
B
Aromatics
0.660.47
0.26
0.69
0.97
0.660.79
0.30
0.0
0.5
1.0
1.5
Q3-16 Q4-16 Q1-17 Q2-17
Mil TON
Asian PX and PTA Plant Maintenance
PX PTA (PX Equivalent)
0.23 0.07 0.20
0.56
0.06 -0.01
0.390.48
-0.5
0.0
0.5
1.0
Q3-16 Q4-16 Q1-17 Q2-17
Mil TON
AP & ME PX and PTA Capacity Addition
PX Effective Capacity Addition
PTA Effective Capacity Addition (PX Equivalent)
Two fires at NE Asia refineries in end-Jan boosted PX spot price
20.01
21.25
22.46
23.31
18
19
20
21
22
23
24
2014 2015 2016 2017
Mil TON
Chinese Polyester Production(PX Equivalent)
9.87
11.6912.29
13.18
0
2
4
6
8
10
12
14
2014 2015 2016 2017
Mil TON
Chinese PX Net Trade

-41-
Firm Chinese Import Helps Boost BZ MarketRising SM Demand in China Pushes BZ Market
Heavy Maintenance in Q2-17 Supports MarketBalanced Market due to New Downstream Plant
Source: IHS (Jan’17)
Aromatics
2 Firm Chinese SM Demand Drives BZ Market
C D
BA
0.120.18
0.32
0.48
0.240.20
0.36 0.37
0.0
0.1
0.2
0.3
0.4
0.5
Q3-16 Q4-16 Q1-17 Q2-17
Mil TON
AP & ME BZ and Downstream Capacity Addition
BZ Effective Capacity Addition
Downstream Effective Capacity Addition (BZ Equivalent)
0.63
0.43
0.18
0.480.46
0.20 0.18 0.22
0.0
0.2
0.4
0.6
0.8
1.0
Q3-16 Q4-16 Q1-17 Q2-17
Mil TON
AP BZ, SM and Phenol Plant Maintenance
BZ SM and Phenol (BZ Equivalent)
Two fires at NE Asia refineries in end-Jan boosted BZ spot price
3.89 4.084.46
4.90
0
1
2
3
4
5
6
2014 2015 2016 2017
Mil TON
Chinese SM Production(BZ Equivalent)
0.60
1.09
1.55
1.87
0.0
0.5
1.0
1.5
2.0
2014 2015 2016 2017
Mil TONChinese BZ Net Trade

-42-
BASE OIL & BITUMEN

-43-
($/TON) Q1-16 Q2-16 Q3-16 Q4-16 2016 Q1TD-17*
500SN
-HSFO427 409 443 367 412 396
Lower Global Base Oil Capacity Addition
Lower Asia Pacific Plant Maintenance
Peak Seasonal Demand in Q2’17 to Support the Market
Base Oil & Bitumen
Key Highlights in 1H-17
Global Additional Nameplate Capacity
AP Plant Maintenance (Effective Capacity)
Mil TON
Sources: Argus Jan’17 and TOP’s Estimate
Mil TON
495
369 399506
450 431 427 409 443367
412 396
Y2
01
4
Q1
-15
Q2
-15
Q3
-15
Q4
-15
Y2
01
5
Q1
-16
Q2
-16
Q3
-16
Q4
-16
Y2
01
6
Q1
TD
-17
*
Firm Base Oil Market in H1 on Lower Global Base Oil Capacity Addition amid Seasonal Demand
0.3
0.7
0.3
0.0
0.5
1.0
H1-16 H2-16 H1-17
Group 1 Group 2 Group 3 Net Capacity
0.10.6
0.3
-2.0
0.0
2.0
H1-16 H2-16 H1-17
Group 1 Group 2 Group 3 Net Capacity
2
1500SN – HSFO ($/TON)
Remarks: *Q1TD-17 as of 17 Feb 17
0.8 0.60.0
-2.0
0.0
2.0
H1-16 H2-16 H1-17
Group 1 Group 2 Group 3 Net Capacity
AP Additional Nameplate Capacity
Mil TON
2
1
3
Sources: Argus (Jan’16-Jan’17) and TOP’s Estimate

-44-Base Oil & Bitumen
($/TON) Q1-16 Q2-16 Q3-16 Q4-16 2016 Q1TD-17*
Bitumen
-HSFO(7) (48) (61) (80) (49) (23)
Firm Bitumen Market on Seasonal Demand in the Region
-32
23 20
82 98 56
-7 -48 -61 -80
-49-23
Y2
01
4
Q1
-15
Q2
-15
Q3
-15
Q4
-15
Y2
01
5
Q1
-16
Q2
-16
Q3
-16
Q4
-16
Y2
01
6
Q1
TD
-17
*
Import Volume of Major Asian Players in 2016
Expected Firm Thai Demand in 2017
Bitumen-HSFO ($/TON)
‘000 Km.
Expect Higher Import Interest during Peak Paving Season
Improved Thai Demand on Higher Infrastructure Budget and Road Maintenance Plan
Key Highlights in 1H-17
Source: Department of Highways and Maintenance Bureau (2014-Sep’16)
KTON/MONTH China
VietnamKTON/MONTH
IndiaKTON/MONTH
IndonesiaKTON/MONTH
1
2
Source: Bitumart (Oct’16)
40
41
42
43
44
45
2015 2016 2017
2.9%YoY Growth1
2
Billion Baht
0
50
100
150
200
2015 2016 2017
RuralRoadsdept.
Highwaysdept.
12%YoY Growth
0
300
600
Jan-16 May-16 Sep-16
0
100
200
Jan-16 May-16 Sep-16
0
100
200
Jan-16 May-16 Sep-16
0
100
200
Jan-16 May-16 Sep-16
Infrastructure Budget Asphalt Road Distance
Remarks: *Q1TD-17 as of 17 Feb 17

-45-
Linear Alkyl Benzene (LAB)
-46-
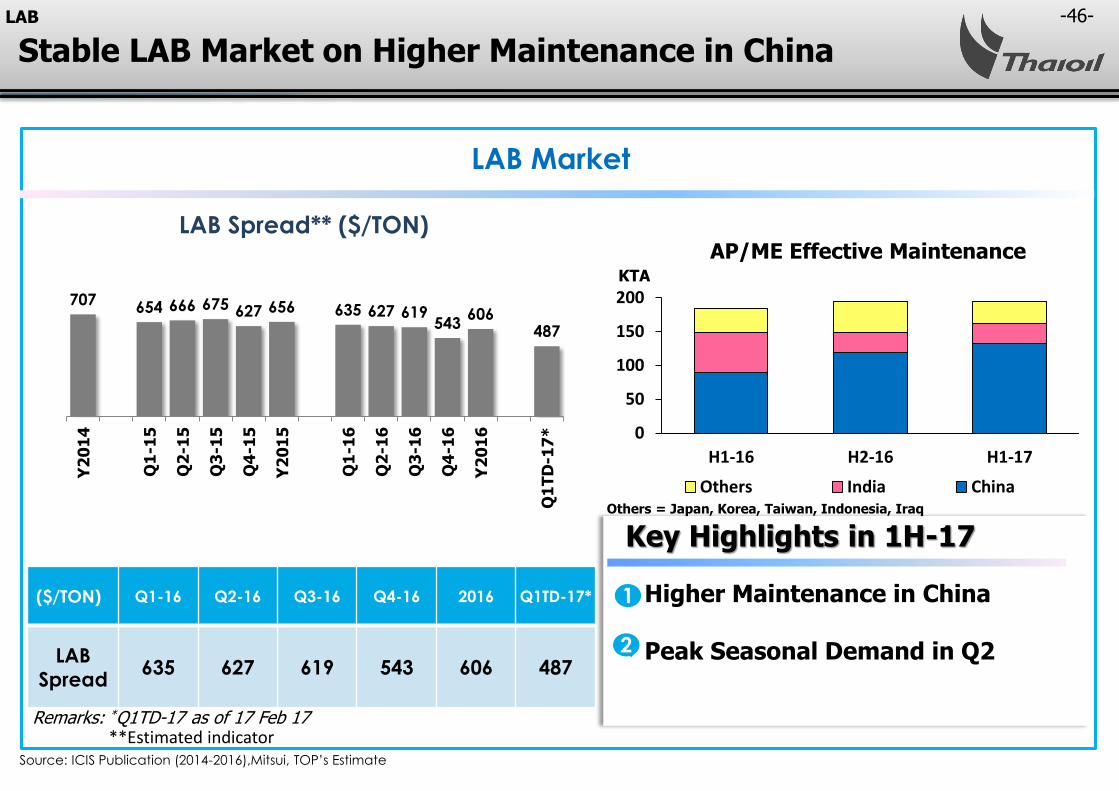
Key Highlights in 1H-17
Higher Maintenance in China
Peak Seasonal Demand in Q2
LAB Market
Source: ICIS Publication (2014-2016),Mitsui, TOP’s Estimate
LAB Spread** ($/TON)
1
2
($/TON) Q1-16 Q2-16 Q3-16 Q4-16 2016 Q1TD-17*
LAB
Spread635 627 619 543 606 487
707 654 666 675 627 656 635 627 619543
606487
Y2
01
4
Q1
-15
Q2
-15
Q3
-15
Q4
-15
Y2
01
5
Q1
-16
Q2
-16
Q3
-16
Q4
-16
Y2
01
6
Q1
TD
-17
*
KTA
Remarks: *Q1TD-17 as of 17 Feb 17
AP/ME Effective Maintenance
0
50
100
150
200
H1-16 H2-16 H1-17
Others* India ChinaOthers = Japan, Korea, Taiwan, Indonesia, Iraq
**Estimated indicator
LAB
Stable LAB Market on Higher Maintenance in China

-47-
CONCLUSION

-48-Conclusion
2017 Market Outlook Conclusion
Stable LAB Market on Higher Plant Maintenance in China
(vs. 2016)
Crude Oil
Refinery
Lube Base
LAB
Aromatics Firm Aromatics Market from Stronger Demand Despite Increasing New Capacity Addition
Firm Base Oil Market due to No Additional Capacity in Asia Despite Lower Regional Plant Maintenance
Firm Bitumen Market on Expectation of Improved Regional Demand
Still-High Margins from Demand Outpacing Refinery Addition
Oil Market to Rebalance in 2017, Driven by Output Cut Deal and Growing Oil Demand

-49-
Thank You
Any queries, please contact:
at email: [email protected]
Tel: 662-797-2999 / 662-797-2961
Fax: 662-797-2976

-50-
APPENDIX
• Strategic Investment Plan
• Optimized & Flexible Operations…Superior Performance
• CDU Addition VS Additional Demand – AP & ME
• World GRM / Inventories
• Thailand petroleum demand by products
-51-
Remaining capital investment
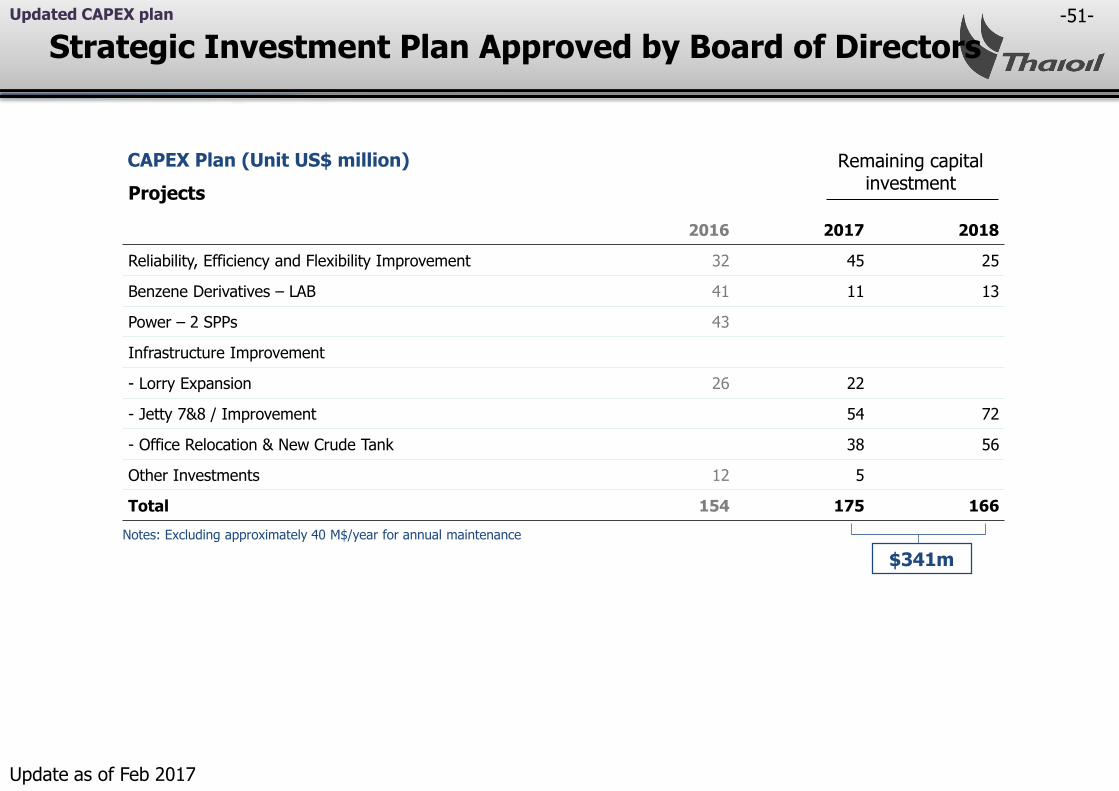
Strategic Investment Plan Approved by Board of Directors
Projects
2016 2017 2018
Reliability, Efficiency and Flexibility Improvement 32 45 25
Benzene Derivatives – LAB 41 11 13
Power – 2 SPPs 43
Infrastructure Improvement
- Lorry Expansion 26 22
- Jetty 7&8 / Improvement 54 72
- Office Relocation & New Crude Tank 38 56
Other Investments 12 5
Total 154 175 166
CAPEX Plan (Unit US$ million)
Notes: Excluding approximately 40 M$/year for annual maintenance
$341m
Updated CAPEX plan
Update as of Feb 2017

-52-
Optimized & Flexible Operations…Superior Performance
27%17%
7%17%
28%29%
28%28%
45% 54%65%
55%
Oman Dubai Murban ArabLight
Short Residue Waxy Gas/Distillates
Sources of Crude
• Flexibility in crude intake allows diversification of crude types to source cheaper crude
• Flexibility in product outputs by maximizing middle distillates (jet and diesel) by adjusting production mode to capture domestic demand and price premium
• Maximize Platformate production to capture higher margin on aromatics
• Minimize fuel oil output to avoid lower margin products
Product output
Domestic demand for
petroleum products**
**Source: Energy Policy and Planning Office, Ministry of Energy Thailand
% S = 0.78API = 39.4
% S = 1.43API = 32.0
% S = 2.52API = 31.2
Crude Assays based onTOP configuration*
Thai Oil is able to diversify its type of crude intake and product outputs to maximize demand and margin
*** Including Nigeria, Russia and others
% S = 1.97API = 32.8
*Crude yield as per assay in Spiral as of Feb 2016
79%
7%
12%
2%
5%
7%
32%
23%
16%
12%
4%
4%
42%
12%
20%
21%Far East
Local
Middle East
Q4/16
1SAUDI ARAMCO
MOPS Jet Kerosene FOB
SG
MOPS Gasoil 0.05% Sulfur
FOB SG
MOPS ULG 95 FOB SG
Others
1.LPG price = LPG CP - 20$/ton)since 2 Feb 15onwards.
LPG
PLATFORMATE
GASOLINE
JET
DIESEL
FUEL OIL
Q4/16
***
LONG RESIDUE
MOPS Fuel Oil 180 CST 3.5% Sulfur FOB SG
Reference Price
Crude

-53--53-
Optimized & Flexible Operations…Superior Performance
27%17%
7%17%
28%29%
28%28%
45% 54%65%
55%
Oman Dubai Murban ArabLight
Short Residue Waxy Gas/Distillates
Sources of Crude
• Flexibility in crude intake allows diversification of crude types to source cheaper crude
• Flexibility in product outputs by maximizing middle distillates (jet and diesel) by adjusting production mode to capture domestic demand and price premium
• Maximize Platformate production to capture higher margin on aromatics
• Minimize fuel oil output to avoid lower margin products
Product output
Domestic demand for
petroleum products**
**Source: Energy Policy and Planning Office, Ministry of Energy Thailand
% S = 0.78API = 39.4
% S = 1.43API = 32.0
% S = 2.52API = 31.2
Crude Assays based onTOP configuration*
Thai Oil is able to diversify its type of crude intake and product outputs to maximize demand and margin
*** Including Nigeria, Russia and others
% S = 1.97API = 32.8
*Crude yield as per assay in Spiral as of Feb 2016
79%
8%
10%
3%
4%7%
34%
22%
16%
12%
4%
6%
57%
16%
27%
28%Far East
Local
Middle East
FY/16
1SAUDI ARAMCO
MOPS Jet Kerosene FOB
SG
MOPS Gasoil 0.05% Sulfur
FOB SG
MOPS ULG 95 FOB SG
Others
1.LPG price = LPG CP - 20$/ton)since 2 Feb 15onwards.
LPG
PLATFORMATE
GASOLINE
JET
DIESEL
FUEL OIL
FY/16
***
LONG RESIDUE
MOPS Fuel Oil 180 CST 3.5% Sulfur FOB SG
Reference Price
-54-
Sources: FACTs Semi Annual Reports, Spring 2016, Reuters, Bloomberg, TOP’s estimate
CDU Addition VS Additional Demand – AP & ME Start-up period)
CountryNameplate
(KBD)Company
Q1-16 India 300 IOC Paradip
Q2-16 China 60 CNOOC Taizhou
Q3-16 Qatar 136 Ras Laffan
South Korea 102 Hyundai Lotte
Q4-16 Taiwan 46.5 CPC Talin
Q1-17 China 260 CNPC/SA Anning
India 120 BPCL Koshi
Iran 120 Bandar Abbas - PGSOC/1
Q2-17 India 42 HPCL Bhatinda
Oman 76 Sohar-ORPIC
Iran 120 Bandar Abbas - PGSOC/1
China 200 CNOOC Huizhou
Q3-17 Vietnam 200 Nghi Son
China 100 Petrochina Huabei
Q4-17 China 100 Local Zhuhai Huafeng
Closures
Q4-16 China -187 Local refineries
Q1-17 Japan -386Cosmo Oil/ JX Nippon /Tonen General/ Taiyo OilShaowa Shell
Q4-17 China -100 Local refineries
Note: Adjusted capacity based on start-up period (effective additional capacity)
(Sep’16 > Mar’17)
(May’16 > Mar’17)
(Jun’18 > Jul’17)
454555 607
539
328
762
-400
-200
0
200
400
600
800
1000
1200
1400
2015 2016 2017 2018 2019 2020
KBD
Middle East Other APChina JapanIndia TeapotVietnam Net AdditionAP & ME Demand
(Oct’16 > Mar’17)
(Feb’17 > Jun’17)
Asia Pacific & Middle East Refinery AdditionRefinery

-55-
Asian Margin Vs. US-EU margin
World GRM
12
13
14
15
16
17
18
1 5 9 13 17 21 25 29 33 37 41 45 49
U.S. Crude Refinery Input
5yr-range 20162017 avg 12-16
MBDSource : EIA
8
9
10
11
12
1 2 3 4 5 6 7 8 9 10 11 12
EU 16 Crude Refinery Input
5yr-range 20162017 avg 12-16
MBDSource : Euroil
2.5
3.0
3.5
4.0
4.5
1 5 9 13 17 21 25 29 33 37 41 45 49
Japan Crude Refinery Input
5yr-range 20162017 avg 12-16
MBDSource : METI
-10
0
10
20
30
Jan-15 Jul-15 Jan-16 Jul-16 Jan-17
$/BBL
BRENT CRACK BRENT HYDRO WTI CRACK
US and EU GRM
-8
-4
0
4
8
12
Jan-15 Jul-15 Jan-16 Jul-16 Jan-17
$/BBL
SING CRACK SING HYDRO
Singapore GRM
Total Capacity: 3.8 MBD 87.57% 67.15% 93.68%Total Capacity: 18.1 MBD Total Capacity: 15.8 MBD
-56-
250
300
350
400
450
500
550
600
1 5 9 13 17 21 25 29 33 37 41 45 49
U.S. Crude Stocks (excl. SPR)
5yr-range 2016 2017 avg 12-16
MBBLSource : EIA
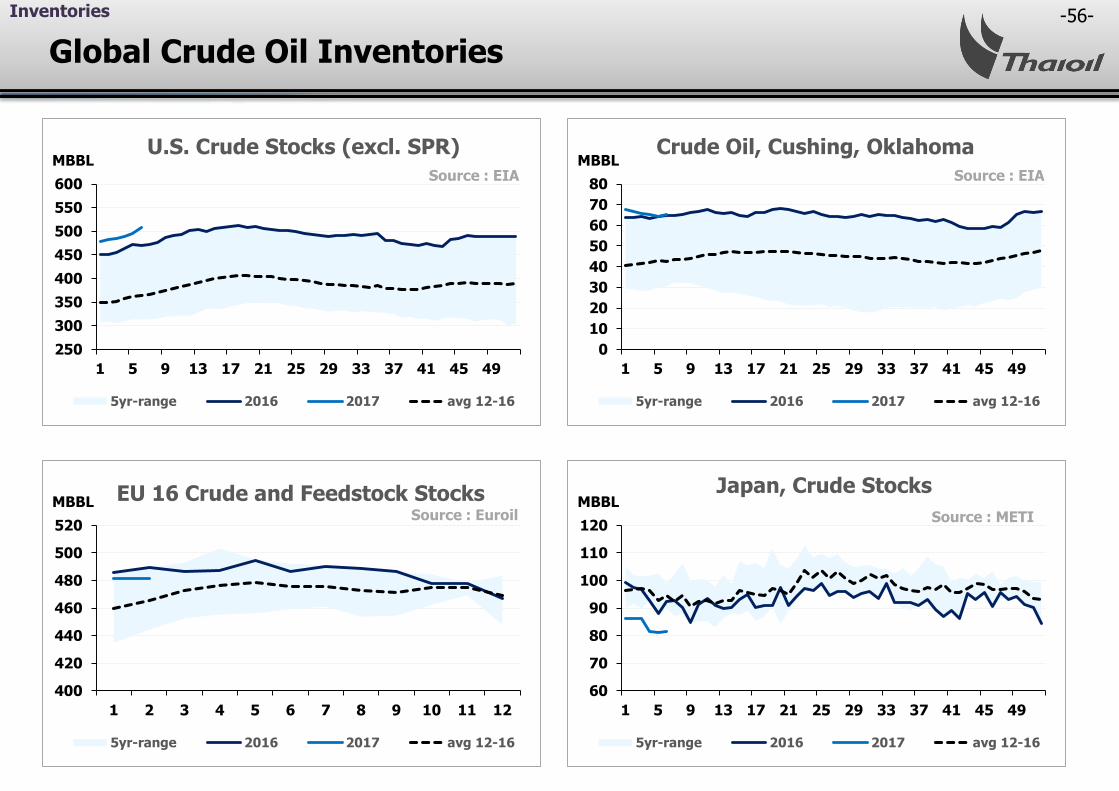
Global Crude Oil Inventories
Inventories
0
10
20
30
40
50
60
70
80
1 5 9 13 17 21 25 29 33 37 41 45 49
Crude Oil, Cushing, Oklahoma
5yr-range 2016 2017 avg 12-16
MBBLSource : EIA
60
70
80
90
100
110
120
1 5 9 13 17 21 25 29 33 37 41 45 49
Japan, Crude Stocks
5yr-range 2016 2017 avg 12-16
MBBLSource : METI
400
420
440
460
480
500
520
1 2 3 4 5 6 7 8 9 10 11 12
EU 16 Crude and Feedstock Stocks
5yr-range 2016 2017 avg 12-16
MBBLSource : Euroil

-57-
180
200
220
240
260
280
1 5 9 13 17 21 25 29 33 37 41 45 49
U.S. Gasoline Stocks
5yr-range 2016 2017 avg 12-16
MBBLSource : EIA
Global Gasoline Inventories
Inventories
0
5
10
15
20
1 5 9 13 17 21 25 29 33 37 41 45 49
Japan, Gasoline Stocks
5yr-range 2016 2017 avg 12-16
MBBLSource : METI
80
100
120
140
1 2 3 4 5 6 7 8 9 10 11 12
EU 16 Gasoline Stocks
5yr-range 2016 2017 avg 12-16
MBBLSource : Euroil
0
10
20
1 5 9 13 17 21 25 29 33 37 41 45 49
Singapore Gasoline Stocks
5yr-range 2016 2017 avg 12-16
MBBLSource : IE Singapore

-58-
80
100
120
140
160
180
1 5 9 13 17 21 25 29 33 37 41 45 49
U.S. Diesel Stocks
5yr-range 2016 2017 avg 12-16
MBBLSource : EIA
Global Middle Distillate Inventories
Inventories
30
40
50
60
70
1 5 9 13 17 21 25 29 33 37 41 45 49
Japan, Middle Distillate Stocks
5yr-range 2016 2017 avg 12-16
MBBLSource : METI
300
350
400
450
500
1 2 3 4 5 6 7 8 9 10 11 12
EU 16 Diesel Stocks
5yr-range 2016 2017 avg 12-16
MBBLSource : Euroil
0
10
20
1 5 9 13 17 21 25 29 33 37 41 45 49
Singapore Middle Distillate Stocks
5yr-range 2016 2017 avg 12-16
MBBLSource : IE Singapore

-59-
20
30
40
50
1 5 9 13 17 21 25 29 33 37 41 45 49
U.S. Residual Fuel Oil Stocks
5yr-range 2016 2017 avg 12-16
MBBLSource : EIA
Global Fuel Oil Inventories
Inventories
0
5
10
15
20
1 5 9 13 17 21 25 29 33 37 41 45 49
Japan, Residual Fuel Oil Stocks
5yr-range 2016 2017 avg 12-16
MBBLSource : METI
60
70
80
90
100
1 2 3 4 5 6 7 8 9 10 11 12
EU 16 Residual Fuel Oil Stocks
5yr-range 2016 2017 avg 12-16
MBBLSource : Euroil
0
10
20
30
40
1 5 9 13 17 21 25 29 33 37 41 45 49
Singapore Residual Fuel Oil Stocks
5yr-range 2016 2017 avg 12-16
MBBLSource : IE Singapore

-60-
China’s Refined Product Exports
China Export
0
50
100
150
200
250
300
350
Jan Feb Mar Apr May Jun Jul Aug Sep Oct Nov Dec
China’s Gasoline Exports
2015 2016
KBDSource : China Custom
0
100
200
300
400
500
600
Jan Feb Mar Apr May Jun Jul Aug Sep Oct Nov Dec
China’s Gasoil Exports
2015 2016
KBDSource : China Custom
0
100
200
300
400
500
600
Jan Feb Mar Apr May Jun Jul Aug Sep Oct Nov Dec
China’s Jet/Kero Exports
2015 2016
KBDSource : China Custom
0
50
100
150
200
250
300
Jan Feb Mar Apr May Jun Jul Aug Sep Oct Nov Dec
China’s Fuel Oil Exports
2015 2016
KBDSource : China Custom

-61-
Domestic LPG Demand
LPG Demand by Sector
LPG Demand Highlight
• In 2016, LPG demand fell significantly by 8.6%YoY on account of lower usages in all sectors. Most of the decline came from petrochemical sector which its feedstock switching from LPG to Naphtha leading to drop in this sector. Furthermore, LPG demand in automobile fell harshly by 15.5%YoY, as a result of fuel switching from LPG to Mogas due to lower price of Mogas.
Outlook for 2017
• LPG demand is expected to dropped by 1.5% YoYpressured by the expectation of more fuel switching from LPG to Mogas, due to low oil price.
• Moreover, the demand from household sector is also expected to decrease from changing of customers’ behavior.
• However, the slowdown of LPG demand was expected to be limited by higher usage in industry sector as a result of persistent low level of LPG price.
Thailand LPG Demand
Remark : LPG demand includes Petrochemical and own used consumption
Source: EPPO, DOEB (As of February 2017)
Thailand petroleum demand by products

-62--62-
Domestic Gasoline/Gasohol Demand
Gasoline/Gasohol Demand by Grade
GASOLINE/Gasohol Demand Highlight
• In 2016, Mogas demand jumped sharply by 9.8%YoY to an average 28.99 ML/day. This was mainly due to lower retail prices and higher number of passenger cars since the end of the last year, as a result of avoiding new tax implementation. In fact, the gasohol portion increase significantly to 95.4% of total mogasdemand as a result of lower proportion of ULG95 from 5.2% to 4.6%, according to more attractive price gap of ULG95 and GSH E10.
• The level of domestic ethanol demand, in 2016, rose significantly by 9.5%YoY from 3.57 mml/day to 3.91 mml/day following the rising of Mogasdemand. Additionally, this was also because of higher demand in GSH-91, GSH-95, E20, and E85 which increased by 1.6%YoY, 20.5%YoY, 15.7%YoY, and 1.9%YoY, respectively, backed by increasing in the number of new E20 vehicle, E20 gas station, and wider GSH95-E20 price gap.
Outlook for 2017
• Mogas consumption is predicted to grow by 1.3% YoY supported by expectation of growing of new passengers cars from return of private consumption. However, the demand is limited by high growth level in 2016 and higher oil price.
Thailand Gasoline/Gasohol Demand
Source: DOEB (As of February 2017)
Thailand petroleum demand by products
-63--63-
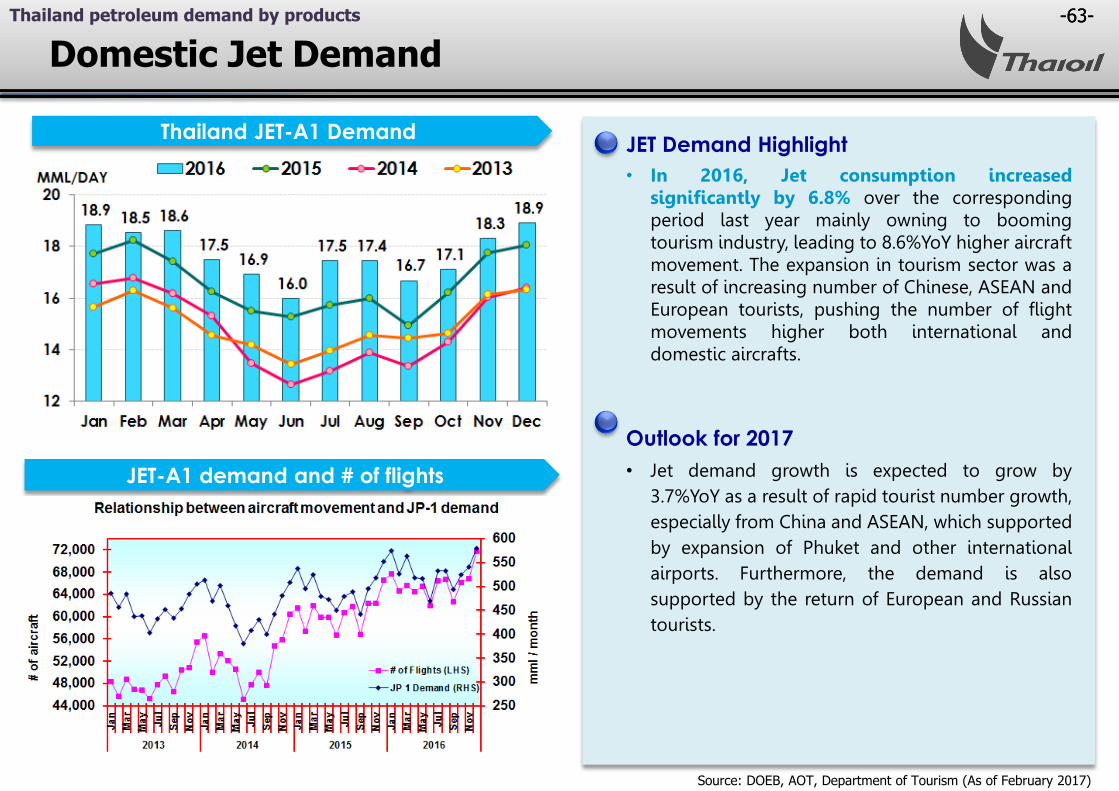
Domestic Jet Demand
JET-A1 demand and # of flights
JET Demand Highlight
• In 2016, Jet consumption increased significantly by 6.8% over the corresponding period last year mainly owning to booming tourism industry, leading to 8.6%YoY higher aircraft movement. The expansion in tourism sector was a result of increasing number of Chinese, ASEAN and European tourists, pushing the number of flight movements higher both international and domestic aircrafts.
Outlook for 2017
• Jet demand growth is expected to grow by 3.7%YoY as a result of rapid tourist number growth, especially from China and ASEAN, which supported by expansion of Phuket and other international airports. Furthermore, the demand is also supported by the return of European and Russian tourists.
Thailand JET-A1 Demand
Source: DOEB, AOT, Department of Tourism (As of February 2017)
Thailand petroleum demand by products

-64--64-
Domestic Gasoil and NGV Demand
NGV Demand
Diesel Demand Highlight
• In 2016, Diesel demand rose gradually by 3.1% YoY as relatively low retail prices boosted the consumption amidst higher number of accumulated commercial vehicles. Nevertheless, demand growth was curbed by lower level of export activity, as a result of slowdown of global economy.
Outlook for 2017
• Diesel demand in 2017 is expected to expand by 1.8% YoY supported by Thailand economic improvement.
NGV Demand Highlight
• In 2016, NGV demand declined significantly by 9.1%YoY. This was mainly because of higher NGV retail price, which had increased to hit the record high at 13.5 baht/kg in Q1/16, and lower oil prices which reduced the fuel switching from old cars.
Thailand Gasoil Demand
Source: DOEB (As of February 2017)
Thailand petroleum demand by products
-65--65-
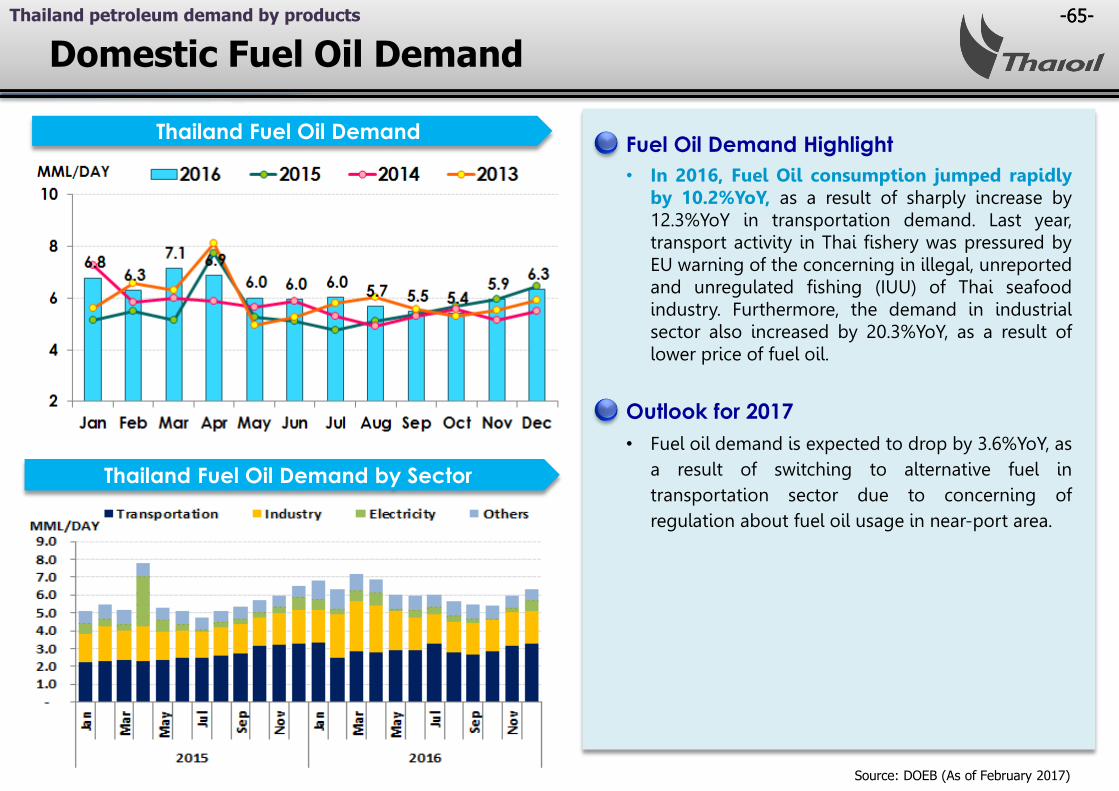
Domestic Fuel Oil Demand
Thailand Fuel Oil Demand by Sector
Fuel Oil Demand Highlight
• In 2016, Fuel Oil consumption jumped rapidly by 10.2%YoY, as a result of sharply increase by 12.3%YoY in transportation demand. Last year, transport activity in Thai fishery was pressured by EU warning of the concerning in illegal, unreported and unregulated fishing (IUU) of Thai seafood industry. Furthermore, the demand in industrial sector also increased by 20.3%YoY, as a result of lower price of fuel oil.
Outlook for 2017
• Fuel oil demand is expected to drop by 3.6%YoY, as a result of switching to alternative fuel in transportation sector due to concerning of regulation about fuel oil usage in near-port area.
Thailand Fuel Oil Demand
Source: DOEB (As of February 2017)
Thailand petroleum demand by products

-66-
Broadening Growth, Capturing Step Out ,Pursuing Sustainability
A Leading fully integrated refining andpetrochemical company in Asia Pacific
Vision
Core Strategies
Financial disciplineManpower readiness Process/System
Vision Measurement by 2021
WA
YEN
D
Enables
MEA
N
• Operational excellence(Safety, Reliability, Efficiency, Flexibility)
• Margin improvement
• Cost management
• Complete projects i.e. LABIX, TOP SPP
• Organic growth i.e. CFP
• PTT Group collaboration in Srirachaarea/ International business
• Value chain enhancement & Integrated downstream
• New business
• R&D
• Portfolio master plan
Review external environments / scenarios & stress test
Top quartile performer DJSI
(Sustainability)
Top Qrt ROIC & NP Growth
Strategy
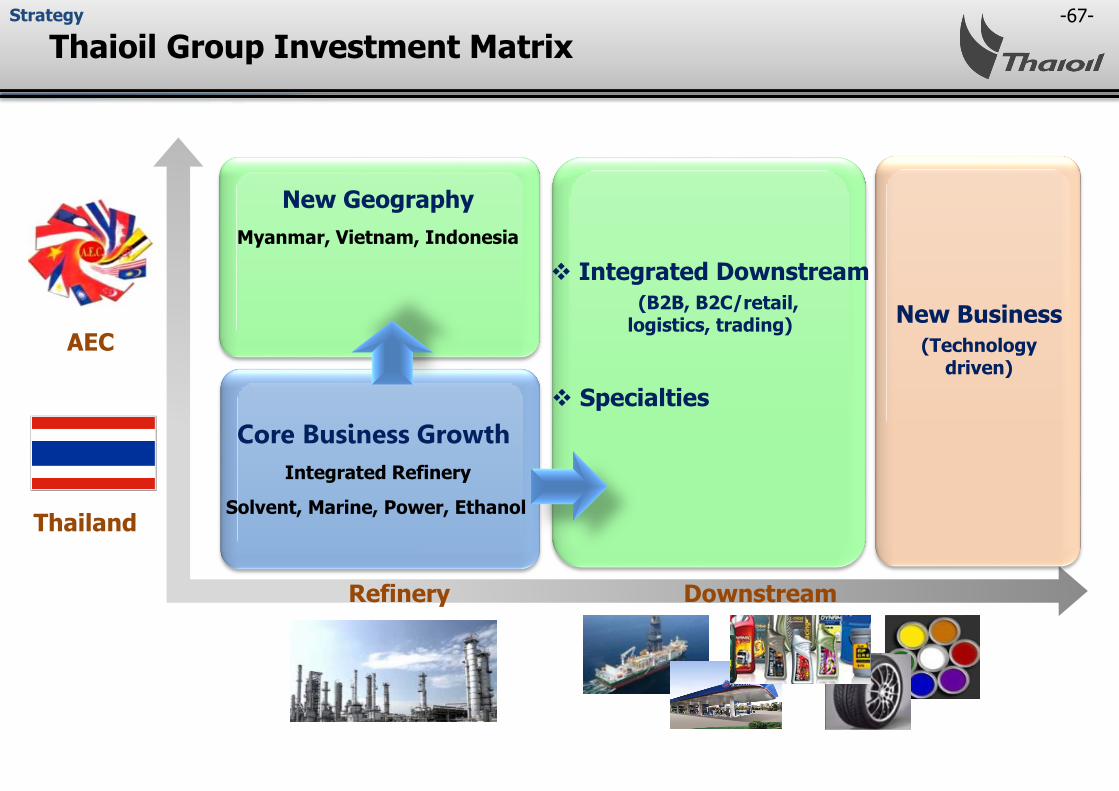
-67-
Thaioil Group Investment Matrix
Refinery Downstream
AEC
Thailand
Core Business Growth
New Geography
Myanmar, Vietnam, Indonesia
Integrated Downstream
(B2B, B2C/retail, logistics, trading)
Specialties
Integrated Refinery
New Business
(Technology driven)
Solvent, Marine, Power, Ethanol
Strategy

-68-
Study Project : Clean Fuel Project (CFP)
2015 2016 2017 2018 2019 2020 2021
BDP
FEED
EPC (Engineering Procurement Construction)
EPC Bidding
CODCFP Study Time line
Main objectives of CFP
Enhance competitive advantage of the refinery and maintain 1st quartile performer
Enhance capability to upgrade lower value product into higher value product and ability to process heavier (cheaper) crude oil
(Basic Design Package)
(Front-End Engineering and Design)
FID (Final Investment Decision)
CAPEX +/- 10%
Project Update

-69--69-
Thank You
Any queries, please contact:
at email: [email protected]
Tel: 662-797-2999 / 662-797-2961
Fax: 662-797-2976