Embed Size (px)
Citation preview

Honda Corporate Update - 2017 Autumn
Accord

Business Status
Other Topics
Automobile Business Operations
Motorcycle Business Operations
Business Strategy
Honda Corporate Update
2030 Vision
2
Financial Highlights

70
80
90
100
110
120
130
183 203 199 178
177 192 182 171
461 280
153
501
7.9%
1.9%
4.2%
6.4%
2.9%
5.5%
6.6%
5.0%
3.4%
6.0%
5.0%
-1%
1%
3%
5%
7%
-200
0
200
400
600
800
1,000
1,200
1,400
1,600
1,800
FY2008 2009 2010 2011 2012 2013 2014 2015 2016 2017 2018(P)
PP & Others Finance Motorcycle Automobile O/P Margin
・Earthquake・Thai flood・Earthquake・Thai flood
2012
231
569
363
189
953
USD/JPY
544
¥109 forFY18
840823
670
IFRSUS GAAP
Profit Structure Profile over Past Decade and FY18 Forecast
・Airbag Inflator Issue
・Airbag Inflator Issue
・LehmanCrisis
・LehmanCrisis
Yen (billion)
745
503
* Forecast as of November1, 2017 3
*

4
FY18PreviousForecast
FY18RevisedForecast
ChangeFY18
PreviousForecast
FY18RevisedForecast
ChangeFY18
PreviousForecast
FY18RevisedForecast
Change
Japan 170 165 - 5 680 690 + 10 265 280 + 15North
America 315 315 - 1,920 1,920 - 3,010 3,010 -Europe 220 225 + 5 175 175 - 1,030 1,015 - 15
Asia 17,015 17,375 + 360 2,060 2,100 + 40 1,460 1,455 - 5Other
Regions 1,050 1,100 + 50 245 245 - 400 405 + 5Total 18,770 19,180 + 410 5,080 5,130 + 50 6,165 6,165 -
17,661 18,770 19,180 5,028 5,080 5,130 6,121 6,165 6,165
+ 410( + 2.2 %)
± 0( ± 0 %)
+ 50( + 1.0 %)
Forecast: Honda Group Unit Sales
Motorcycles Automobiles Power Products
Unit(Thousand)
FY17Results
FY18PreviousForecast
FY18RevisedForecast
FY17Results
FY18PreviousForecast
FY18RevisedForecast
FY17Results
FY18PreviousForecast
FY18RevisedForecast

5
Operating profit - 95.7 ( - 11.4 % )
840.7745.0
+ 89.0- 11.0 - 54.0+ 75.0 - 57.0
Excluding currency effects and one time issue
Operating profit + 53.0 ( + 7.1 % )
- 84.0745.7 - 53.7798.7
FY18 Forecast: Change in Operating Profit
FY17Results
Operating margin6.0%
CurrencyEffects
Operating margin5.3%
Impact of pension
accounting treatment
Revenue,model mix,
etc.
Increase inSG&A Increase in
R&D Litigationsettlement
Yen (billion)
Operating margin5.3%
Operating margin5.0%
CostReduction,
etc.
FY18RevisedForecast

Change in the company’s shareholders’ return policy
6
【Purpose for the change】
Further improving the Company’s capital strategy
【Points of the change】
Goal: to maintain a shareholders’ return ratio of
approximately 30%
Goal: to realize a return ratio alone of approximately 30%
Acquisition of the Company’s own shares at a timing that it
deems optimal
With respect to the redistribution of profits to its shareholders, the Company’s basic policy is to determine such distributions after taking into account, among others, its retained earnings for future growth and consolidated earnings performance based on a long-term perspective.

Business Status
Other Topics
Automobile Business Operations
Motorcycle Business Operations
Business Strategy
Honda Corporate Update
2030 Vision
Financial Highlights
7

8
2030 Vision

9
2030 Vision
- Focus on three areas: Mobility, Robotics and Energy- Strive to further expand the joy of people by offering products and services- Strive to become No.1 in the areas of the environment and safety
10Utilize our corporate resources effectively and strengthen our business foundation.
2030 Vision

11
Further enhance inter-regional coordination and collaboration andincrease the efficiency of our operations from a global perspective.
2030 Vision

Global Models continue to be widely popular representingapprox. 70% of CY2016 global Honda unit sales
Global models: Accord, Civic, CR-V, Vezel/ HR-V and Fit/ Jazz
12
Accord- All-new Accord launched in October 2017 in N.A. to be followed by other markets
Civic- Underwent full model change in 2015 in N.A. and successfully launched in global market
- Shares commonized platform between sedan, coupe and hatchback
CR-V- All-new CR-V underwent full model change in 2016 in N.A.- Hybrid model will be launched initially in China
Vezel/ HR-V- Grew into strong model and became one of the global models since its launch in 2013
Accord
Civic
CR-V
Vezel/ HR-V
Fit/ Jazz
*Derivative models: City/Grace, Greiz and XR-V
Sharing of down-sized turbocharged engine at some trim levels
Focus onplatform and parts
commonality
Focus onplatform and parts
commonality
Accord 11% Civic
13%
CR-V 14%
Vezel11%
Fit10%
Derivative models
Other
5.0milCY2016

Global models: Direction of Model Development
2013 2014 2015 2016
Civic
CR-V
HR-V
Fit
Global Operation Reform• Concurrent development
in all six regions• Adoption of locally
optimized design
• Increase commonality of platform and parts (Civic, CR-V and Accord)
Further enhance electrification, autonomous driving and connectivity technologies.
Spearhead industry effort to realize a carbon-free and collision-free mobile society.
13
Accord
• Adopt Lead-Country Introduction Strategy(Clarification of model development leadership in each region and increase model development efficiency.)
• Discuss introduction of modular strategies
• Introduce advanced platforms to accommodate electrification of powertrains

14
Regional Models
Introduction of regional models has also been expanding in each region.
China: Brand differentiationbetween two Joint Ventures
North America: Light Truck models
Japan: Mini-vehiclesAsia: Meet demand in each country with affordable models
Crider UR-V
Avancier XR-V
Odyssey
Pilot
Ridgeline
BR-VMobilio
Brio Amaze
N-Box
N-One N-WGN
N-Box +
Guangqi Dongfeng

CR-V
RDX
■ Production Allocation
Indiana
OhioEast
LibertyPlant(ELP)
20172016
CR-V
MDX
Pilot
Shift
Civic
MDX
GlobalSource CivicExport to N.A.
Alabama
Pilot
Global Source
Civic
Ridgeline Odyssey
Odyssey
Ridgeline
Alabama
ProductionPlant
■ As of the end of 2017
Indiana
CR-V
Civic
MexicoEl Salto
CR-V
HR-V
Shift
Ohio(East Liberty)
RDX
CR-V
MDX
Model Allocation: North America
15
Split
Sedan(4D/5D) SUV MPV
D
Guangqi
Dongfeng
C
Guangqi
Dongfeng
B
Guangqi
Dongfeng
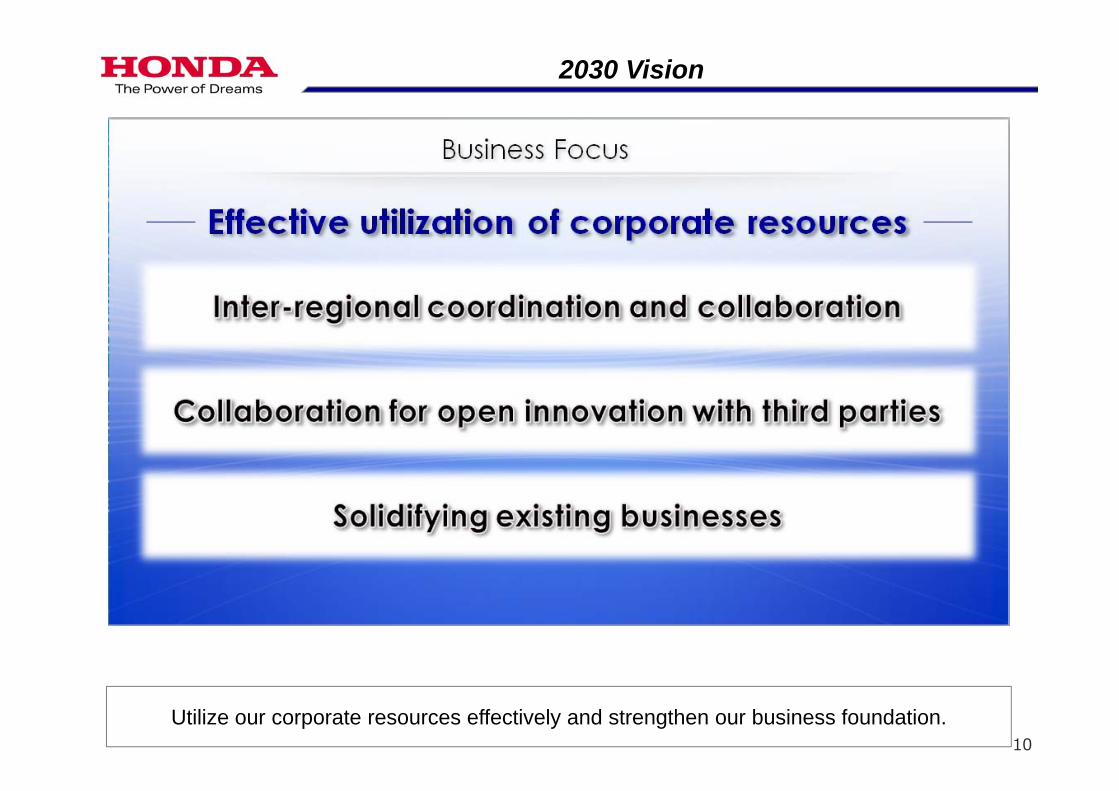
By utilizing common platforms and strengthening local procurement and R&D functions, successive launch of cost competitive models being realized.
Accord
JadeCrider
Odyssey
Spirior
Gienia
Segment
Fit City Vezel
XR-V
CR-V (July 2017)
Elysion
Greiz
UR-V(Mar 2017)
Civic
Avancier
Regional Models: China
16
Two joint ventures offer different model types
consistent with their respective brand image

Identify and prioritize core technologies and strengths (ex. “powertrain”, “packaging”) to be developed in-house and strategically partner with external specialists for other technologies.
* Mono-zukuri: The art of making things Koto-zukuri: New experiences drawn from the art of making things
2030 Vision
(technology/manufacturing expertise) (innovative business solutions)
17

2030 Vision
GM: Collaborate on production of Next-Generation Fuel Cell stackHITACHI: Establish JV for the development, manufacture and sale of motors for electric vehiclesYAMAHA: Collaboration in the area of small-sized scooters in the Japanese market
JP: Collaboration toward the establishment of local charging station infrastructureGrab: Collaboration in the area of motorcycle sharing servicesWaymo: Technical collaboration for fully autonomous automobile driving technology 18

2030 Vision
19

Honda Business Status
Other Topics
Automobile Business Operations
Motorcycle Business Operations
Business Strategy
Honda Corporate Update
2030 Vision
Financial Highlights
20

Roadmap for Environmental Technologies
2010 2020 2030
DI engineCVT / DCT
Turbo engine
2000
(CO
2(g/
km)
0
Global expansion
Global expansion
Technologies to increase electrical
efficiency
Technologies to increase thermal
efficiency
ZEROemissions technology
21
2015
Clarity BEV (2017)
Clarity PHEV(2017)
Clarity Fuel Cell(2016)
New FCV
Accord PHEV(2013)
FCX Clarity(2008)
FCX(2002)
Developments related to expansion of electrified vehicles- Established Electric Vehicle Development Division in Oct 2016- Launch of Clarity BEV and Clarity PHEV in N.A.(2017) and Japan (2018).- Introduced CR-V Hybrid model in 2017 in China (world premier)- Introduction of China-exclusive BEV model and Acura CDX Hybrid in 2018- Dedicated EV models based on Urban EV Concept will be launched
in Europe (2019) and Japan (2020).
Strive to electrify two-thirds of all vehicles we sell globally by 2030
ZNew BEVin China
CR-V HEV(2017)
Urban EV Concept

Roadmap for Environmental Technologies: Clarity Series
- The Clarity Fuel Cell, only five-passenger FCV sedan in the industry, launched in Japan in March 2016 and in U.S. in December 2016, respectively
- Clarity Plug-in Hybrid, which earned a class-leading 47-mile EV driving range rating and340-mile extended range rating, will be launched in the U.S.(2017) and in Japan (2018).
“3-in-1” Clarity series provides unparalleled electric drive choice with premium midsize sedan capability and three advanced electrified powertrains
in a single vehicle platform to address cost and manufacturability
PHEV: Benefits of both Hybrids and BEVs
BEV:Affordable model for daily use
FCV: Supreme environmental technology
22

Toward realization of a collision-free mobile society
Expanding adoption of Honda SENSINGJapan: Make Honda SENSEING standard equipment on all new models to be introducedNorth America/ China/ Europe/ Other regions: Expanding application to all-new models
* For Acura vehicles, called “Acura Watch”
23

Automated Driving Vision
Serve people worldwide with the joy and freedom of collision-free mobility
Realizecollision-free society(zero human error)
Provide freedom of mobilityfor everyone
whenever it is needed
Create freedomof time and space, make
traveling enjoyable
24

- Strive to realize automated lane-changing function which enables the vehicle to drive in multiple lanes without any command from the driver on highways in 2020
- Strive to achieve the technological establishment of “level 4” automated driving for use in personal cars by around 2025
Automated Driving Roadmap
✔
✔
25

1,066 1,066 1,066 816
1,923 1,923 1,9231,923
200 200 200 200
1,080 930 930 930
1,080+50
1,080+50
1,200+50 1,200
+50
151 151 151 151
Mar '16 Apr '17 Plan '19 Plan '22
5,550
as of
Japan
NorthAmerica
Europe
Asia
China
Other
5,400-150
(Export only)
Global Production Capacity
(Export only)(Export only)
5,270
Thailand -150
FY2017
Unit(thousand)
26
China Dongfeng
+120
Plan
(Export only)
5,520+120 -250
Japan Saitama
-250
Plan

China
Europe
Capacity increase to 5.7 milEstablish stable production structure leveraging regional capacity + mutual parts/model sharing
North America
South AmericaAsia
Japan
1.06 mil<Export>
Global Models& Electrified models 1.92 mil
200,000
Primarily Civic 5D production
150,000
1.13 mil
<Export> Acura, L/T models,
Accord & CR-V
930,000
<Export> • Strengthen mutual parts/model
sharing within Asia• Export to Africa
<Export> Leverage local cost benefit for
next markets (Africa)
Middle East and Africa
Jazz
Electrified models
CR-V
Accord & L/T models
Acura
10-20%for Other regions
80-90% for Local markets
Total Capacity
approx. 5.4 mil units(Since April 2017)
City
■ Utilization Image
Civic 5D
1,000
CR-V , HR-V(plan)
Civic(option)
Flexible Global Production Infrastructure
(Units)
Clarity Series
27
Civic 5D

Automobile Operations by Regions
10,430 11,588
12,777 14,491
15,600 16,522
17,479 17,550
0
5,000
10,000
15,000
20,000
CY09 10 11 12 13 14 15 16
Passenger CarsLight Trucks
1,151 1,259
1,147
1,423 1,525 1,541 1,587 1,638
0
500
1,000
1,500
2,000
CY09 10 11 12 13 14 15 16
AcuraHonda Passenger CarsHonda Light Trucks
4,880 4,601 4,753 5,211
5,692 5,297
4,937 5,078
0
2,500
5,000
7,500
FY10 11 12 13 14 15 16 17
Registered vehiclesMini vehicles
662 608 601
717
848 788
704 711
0
250
500
750
1,000
FY10 11 12 13 14 15 16 17
Registered vehiclesMini vehicles
28
<Industry>
<Honda>
United States Japan<Industry>
<Honda>
Unit(thousands)
Source: Autodata
Source: Honda
Source: MUMSS
Source: Honda
Increase production capacity of light truck models to meet industry demand
Improve capacity utilization through exporting global models

Automobile Operations by Regions
29
<Industry>
<Honda>
China
<Honda>
Europe (EU+EFTA)
14,508 13,743 13,542
12,452 12,240 12,913
14,095 15,132
0
5,000
10,000
15,000
20,000
CY09 10 11 12 13 14 15 16
256
187 150 141 140 133 132
159
0
100
200
300
400
CY09 10 11 12 13 14 15 16
10,331
13,757 14,473 15,495 17,929
19,701 21,146
24,378
0
10,000
20,000
30,000
CY09 10 11 12 13 14 15 16
Minivan SUVMPV Sedan
580 652 622 599
757 793
1,010
1,256
0
500
1,000
1,500
CY09 10 11 12 13 14 15 16
Acura SUVMPV Sedan
Unit(thousands)
(excluding commercial vehicles)
(EU and EFTA)
(excluding commercial vehicles)
※2008-2014 Wholesale2015-2016 Retail
<Industry>
Source: ACEA / Honda
Source: ACEA / Honda Source: Honda
Source: Honda
U.K. has been designated to serve asglobal supply base of the Civic Series. Further expand sister models strategy.

Automobile Operations by Regions
<Industry>
30
<Honda>
Brazil
<Honda>
Asia
3,390
4,493 4,796 5,696 5,748 5,477 5,464 5,478
0
4,000
8,000
CY09 10 11 12 13 14 15 16
Malaysia ThailandIndonesia PhilippinesIndia
252 297
227
356
474 524
587 578
0
250
500
750
CY09 10 11 12 13 14 15 16
Malaysia ThailandIndonesia PhilippinesIndia
3,008 3,329 3,426
3,634 3,580 3,333
2,481 1,989
0
2,500
5,000
CY09 10 11 12 13 14 15 16
126 126
93
135 139 138 153
123
0
100
200
CY09 10 11 12 13 14 15 16
Unit(thousands)
<Industry>
Source: HondaSource: Honda
Source: Honda Source: ANFAVEA
(Five main market in Asia)* India: excluding commercial
vehicles and pickups
(Main market in Other Region)* excluding trucks
Introduce new models to meet specific market needs in each Asian market.
Improve Forex toughness by increasing local procurement and localization of development.

Sep
Sep
Sep
Automobile New Model Introductions (global models only)
31
Civic CY2015 CY2016 CY2017
North America
Sedan
Coupe
Hatchback
Type R
Japan
Sedan
Hatchback
Type R
Europe
Sedan
Hatchback
Type R
Asia Sedan
China Sedan
Brazil Sedan
November
March
September
June
Sep
April
April
March
August
March~
CR-V CY2015 CY2016 CY2017North
America Gas
Asia Gas
ChinaGas
HEV
December
July
March~
Civic Sedan
Civic Hatchback
Civic Type R
CR-V
Civic has already been launched in most regions.CR-V is currently being introduced in many regions as well.

To be launched
Automobile New Model Introductions (main models only)
* Please note that “To be launched” models reflect the current plan and is subject to change.Also, photos are from currently available sources and are not actual specification models.
UR-V: China
Mar Apr May Jun Jul Aug Sep
WR-V: Brazil, India
Odyssey: N.A. N-Box: Japan
Clarity PHEV: U.S., Japan
Accord: N.A.
Clarity BEV: U.S.
Oct
Already Launched in 2017
32
Business Status
Other Topics
Automobile Business Operations
Motorcycle Business Operations
Business Strategy
Honda Corporate Update
2030 Vision
33
Financial Highlights

0
4,000
8,000
12,000
16,000
2008 2009 2010 2011 2012 2013 2014 2015 2016
151 100 59 139 143 110 177 192 182 171
9.7%7.1% 5.2%
10.8% 10.6%8.2%
10.5% 10.4% 10.1% 9.9%
0
50
100
150
200
250
300
FY08 09 10 11 12 13 14 15 16 17
Honda Global Unit Sales
*excluding sales by Hero Honda
*Operating profit and margin until FY13 are based on US GAAP while FY14 and after are based on IFRS
Operating Profit and Margin
Overview of Motorcycle Business
Honda M/C Business = High Profitability + Stability + Growth Potential
Yen (billion)
Unit(thousand)
34

Mega ModelsAnnual sales of each of these “Mega Models” has grown to approximately 3 million units. By leveraging the scale merit of this sales volume we will further enhance the efficiency of our parts procurement activities.
Overview of Motorcycle Business
17.66FY2017
mil
Light Motorcycle110/125cc
ACTIVA 110cc1.9 mil
2.4 milScooter 110cc
3.6mil
Cub 110/125cc
2.3 mil
35

Indonesia
Malaysia
Thailand
VietnamIndia
PakistanChina
Japan
Bangladesh
Brazil
Argentine
PeruNigeria
Kenya
ItalyU.S.A
(ATV, S×S)Mexico
Philippines
27%
India17.7 mil
69%
Vietnam3.1 mil
74%
Indonesia5.9 mil
71%Brazil1.0 mil
79%
Thailand1.7 mil
21%U.S.A (MC+ATV)
0.7 mil
47%
0.4 mil
16%Europe0.9 mil
Motorcycle productionat 35 plants in 21 countries
Motorcycle productionat 35 plants in 21 countries
Annual Production Capacity in India
5.8mil in 2016 6.4mil in 2017
*Market share excluding 50cc
Motorcycle Market Size and Honda Share (CY2016)
36

Thailand
Vietnam
Indonesia
India
Number of motorcycles units in operationPopulation
1,292
255
91
6840%
33%
25%
8%
Significant growth expected
Motorcycle Market Penetration in Asia (millions)Source: Honda & IMF
0.2mil
Growth in Motorcycle Popularity
Next Markets Growing Markets Mature Markets
1,000
2,000
3,000
4,000
(USD)
India17.7 mil
Indonesia5.9mil
ThailandThailand
VietnamVietnam1.4mil
Pakistan
1mil
Philippines
Bangladesh0.8mil
Myanmar
GDP per capita 1.7mil
3.1mil
(CY2016)
0.2mil
0.4mil
Kenya
0.1mil
Nigeria
37

18%
82%
In CY201132%
68%
In CY2016
0%
5%
10%
15%
20%
25%
30%
35%
40%
45%
50%
2010 2011 2012 2013 2014 2015 2016
Motorcycle Market Share Trend in India
■ Scooter Unit Sales of Honda / Competitors and Honda Share in Scooter Market
SC SC
MCMC
■ Fast Growing Segment Scooter / Motorcycle Sales Ratio (Industry)
0%
10%
20%
30%
40%
50%
60%
70%
0
1,000
2,000
3,000
4,000
5,000
6,000
7,000
2010 2011 2012 2013 2014 2015 2016
Competitors (Unit)
Honda (Unit)
Honda Share(%)
Honda
Honda has gained the No.2 market share position.
India
Company C
Company A
Company B
Company D
Hero Honda
(Wholesale)
38

1.6 1.6 1.6 1.6 1.6
1.2 1.2 1.2 1.2 1.2
1.2 1.8 1.8 1.8 2.4
1.21.2
CY13 CY14 CY15 CY16 CY17
Expanded annual production capacity to 6.4 mil.
1st
2nd
3rd4.0mil
4.6mil
6.4mil
4.6mil
Capacity Expansion
4th
Manesar
Rajasthan
Karnataka
Gujarat
3rd
2nd
4th
1st
Product Line-up
110cc AT-ScooterActiva
110cc AT-ScooterDio
110cc MotorcycleDream Yuga
125cc MotorcycleCB Shine
India Motorcycle Operations
5.8mil
39

47% 48% 48% 51% 52%
0%
10%
20%
30%
40%
50%
60%
70%
0
500
1,000
1,500
2,000
FY13 14 15 16 17
Others
Honda
Share
0% 1% 1%
9%12%
0%
10%
20%
30%
40%
50%
60%
70%
0
500
1,000
1,500
2,000
FY13 14 15 16 17
Others
Honda
Share
0% 0%4% 5% 6%
0%
10%
20%
30%
40%
50%
60%
70%
0
250
500
750
1,000
FY13 14 15 16 17
Others
Honda
Share
Honda Business Strategy
Motorcycle Business Operations in Next Markets
CD70
< Pakistan >・Local production capacity was increased to 1.35 million
units in 2016・Increase dealer network and number of service shops・Expand model line-up by strengthening the
competitiveness of core 70cc models as well as introducing larger sized 125cc to 150cc models
< Myanmar >・Expand model Line-up・Expand dealership network
< Bangladesh>・Construct new plant (100k units in 2018 and 200k units in 2021) ・Expand dealership network・Cost reductions through increase in local procurement
Unit(thousands)
Unit(thousands)
Unit(thousands)
40
MyanmarPakistan
Bangladesh

41
Electrification in Motorcycle and Mobile Battery
Introduce PCX ELECTRIC / PCX HYBRID in the Asia region including Japan (2018).
For future expansion of electric motorcycles/scooters: - Utilizing electric commuters, which feature a detachable mobile battery is
under consideration (in collaboration with the Japan Post Co., Ltd.)
- E-KIZUNA project with Saitama-city and Yamaha Motor Co., Ltd. is conducting an experiment involving electric motorcycles and replacement of batteries. EV motorcycle sharing scheme also under consideration.
Removable mobile battery pack and recharging station
PCX Electric Honda Mobile Power Pack
Honda Mobile Power Pack Exchanger Concept

Business Status
Other Topics
Automobile Business Operations
Motorcycle Business Operations
Business Strategy
Honda Corporate Update
2030 Vision
Financial Highlights
42

Transition to the Company with Audit and Supervisory Committee
- For faster decision making, transfer of authority to Executive Council from Board of Directors to resolve most matters
- Board of Directors will focus more on discussions of mid to long term business strategies, as well as strengthening of oversight function
✔
43

HondaJet
Advanced Technologies
- Natural laminar Flow Wings and NoseOutstanding flight speed and fuel efficiency
- Over-the-Wing Mounted EnginesFaster flight speed, greater fuel efficiency, and more spacious cabin
- United States (Dec. 2015)- Mexico (Mar. 2016)- Europe (May. 2016)- Canada (Jun. 2017)- Brazil (Aug. 2017)
Certification Received
Sales Units- Delivered 54 units by the end of Sept. 2017- HondaJet ranks as Most-delivered Jet in itscategory during first half of 2017.
44
- Over-The-Wing Engine Mount (OTWEM) ConfigurationWave drag reduction, maximized fuselage space
- Natural Laminar Flow (NLF) TechnologyAerodynamic drag reduction
- Composite FuselageLight-weight structure
- Advanced CockpitMinimized pilot workload, intuitive operation
The HondaJet is the world’s most advanced light jet. The aircraft is the fastest, highest-flying, most fuel-efficient, and achieves most comfortable cabin in its class.

Business Status
Other Topics
Automobile Business Operations
Motorcycle Business Operations
Business Strategy
Honda Corporate Update
2030 Vision
Financial Highlights
45
0
100
200
300
400
0
200
400
0
1,000
2,000
3,000
0
2,000
4,000
6,000
8,000
46
0
2,000
4,000
6,000
0
500
1,000
1,500
2,0006,6911,798 1,807 2,728 2,589 6,734.6
7,489.2 494.9
422.15,873 351.7381.3
incl. Pensionimpact
84.0(profit)incl.
litigation settlement 53.7(loss)
Consolidated Unit Sales Sales Revenue / Operating Profit / Profit for the Period
Motorcycles Sales Revenue Operating ProfitProfit for the Period
attributable to owners of the parent
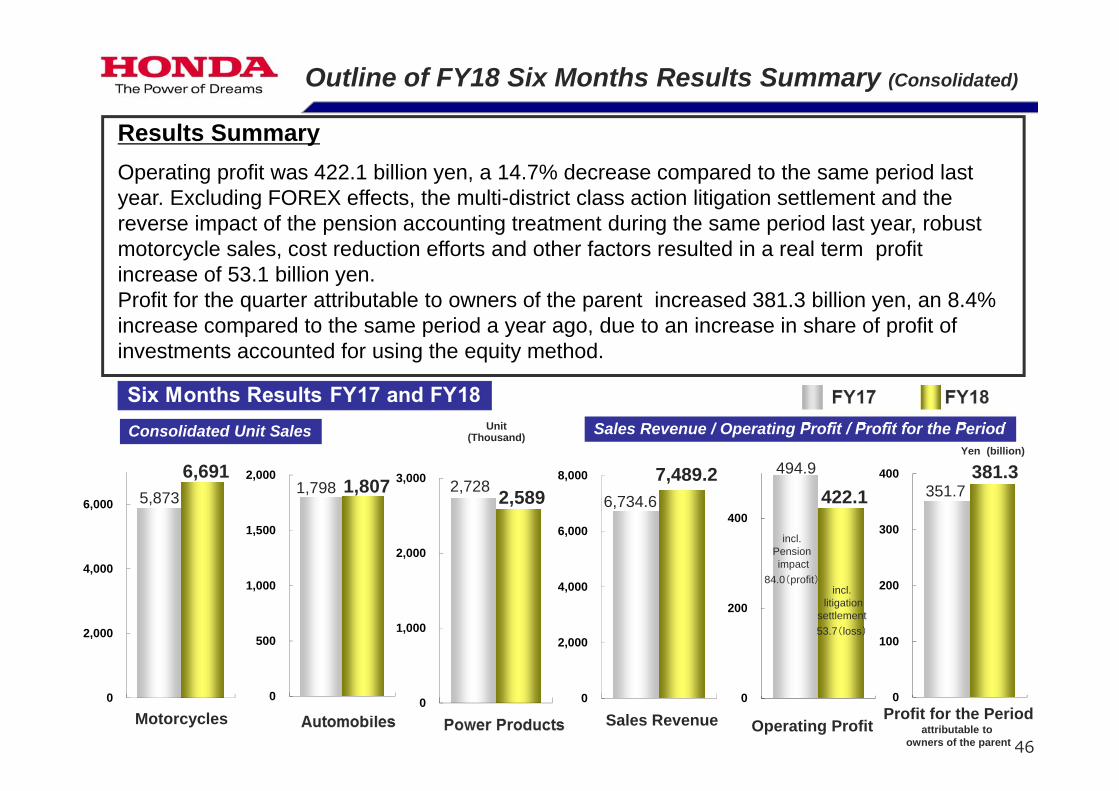
Outline of FY18 Six Months Results Summary (Consolidated)
Results SummaryOperating profit was 422.1 billion yen, a 14.7% decrease compared to the same period last year. Excluding FOREX effects, the multi-district class action litigation settlement and the reverse impact of the pension accounting treatment during the same period last year, robust motorcycle sales, cost reduction efforts and other factors resulted in a real term profit increase of 53.1 billion yen.Profit for the quarter attributable to owners of the parent increased 381.3 billion yen, an 8.4% increase compared to the same period a year ago, due to an increase in share of profit of investments accounted for using the equity method.
Yen (billion)
Unit(Thousand)

47
FY17Six Months
FY18Six Months Change FY17
Six MonthsFY18
Six Months Change FY17Six Months
FY18Six Months Change
Japan 62 84 + 22 302 324 + 22 146 138 - 8North
America 149 163 + 14 989 933 - 56 1,291 1,141 - 150Europe 120 134 + 14 90 85 - 5 390 406 + 16
Asia 8,010 9,023 + 1,013 935 1,093 + 158 736 741 + 5Other
Regions 549 533 - 16 115 124 + 9 165 163 - 2Total 8,890 9,937 + 1,047 2,431 2,559 + 128 2,728 2,589 - 139
8,8909,937
2,431 2,559 2,728 2,589
+ 1,047( + 11.8 %)
+ 128( + 5.3 %)
- 139( - 5.1 %)
Honda Group Unit sales include those of Honda, its subsidiaries and affliates which are acounted for using the equity method (mainly wholesale basis).
Honda Group Unit Sales <FY18 Six Months>
Motorcycles AutomobilesPower
ProductsUnit
(Thousand)
FY17Six Months
FY17Six Months
FY17Six Months
FY18Six Months
FY18Six Months
FY18Six Months

48
・N-Box series was the best-selling modelin Japan in fiscal first half - 94 thousand units sold making it the best-selling model in
Japan, even including registered vehicles-The new edition, launched in September generated over52 thousand unit orders in first month on the market
・New Civic launched (Sept.)
・Expansion of Honda SENSING as standard equipment across all trim levels- starting with N-Box followed by Shuttle (Sept.)
and Step WGN models (Sept.)
N-BOX
Industry Demand:
Unit Sales :2,482
333(107.6%)(103.6%)
322 333
+ 3.6 %
Japan Retail
(Source:Japan Automobile Dealers Association)
Main Market (Automobiles – Japan)
Unit (Thousand)
FY17Six Months
FY18Six Months
Unit (Thousand)
Vs. FY17

49
Industry Demand:
Unit Sales :8,842
866(98.1%)(99.5%)
871 866
- 0.5 %
U.S Retail
・Despite decrease in industry demand,Honda’s retail sales were on par with the same period last year.-Strong sales of Civic, HR-V and Acura RDX
・Production of the brand-new Accordbegan(Sept.)
・Enhancing Honda’s supply network for light truck models
-Production of Acura MDX was shifted from Alabama plant to East Liberty Plant in Ohio(May)
Acura RDX
Civic Hatchback
(Source:Autodata)
FY17Six Months
Main Market (Automobiles – U.S.)
Unit (Thousand)
FY18Six Months
Unit (Thousand) vs. FY17

50
Industry Demand *:Unit Sales :
13,218729
(103.5%)(118.9%)
613
729
+ 18.9 %
China
・729 thousand unit salesin fiscal first half is the highest in history-Strong sales of Civic, UR-V and Avancier
・ CR-V Sports Hybrid model launched (Sept.)
・Announced joint development of EVs forthe Chinese market with a local IT company named Neusoft (Sept.)
*Industry demand is wholesale basis
Retail
CR-V
Avancier
Main Market (Automobiles – China)
Unit (Thousand) vs. FY17
(source:China Association of Automobile Manufactures)
Unit (Thousand)
FY17Six Months
FY18Six Months

51
“Line-off ceremony” of the Number 4thline at the 3rd plant
Industry Demand :Unit Sales :
10,5043,146
( 110.2%)( 117.7%)
2,673
3,146
+ 17.7 %
India Wholesale・Sales surpass pace of overall market for
fiscal first half(vs. FY17 :117.7%)
-Strong sales of scooters such as Activa and DIO
・Expantion of production at Number 4th lineof the Number 3rd plant in Narsapura,Karnataka-Honda’s overall motorcycle production capacity in India increased to 6.4 million units
Main Market (Motorcycle – India)
Unit (Thousand) vs. FY17
(Source:Honda)
Unit (Thousand)
FY17Six Months
FY18Six Months

52
・ Selected as a component of the Dow Jones Sustainability World Index (Sept.)
・ Announced evolution of automobile production system to further enhance Mono-zukuri (the art of makingthings/manufacturing) in Japan- To produce new technologies such as for the electrification of vehicles,
automobile production at the Sayama Plant and Yorii Plant will beconsolidated at the Yorii Plant by the fiscal year ending March 31, 2022
・ 100 Million-Unit Cumulative Global Production Milestonefor Super Cub Series (Oct.)-Production of Super Cub 110 began at Yamato Plantin Saitama in August,1958
-Currently produced at 16 plants in 15 countries and sold in more than 160 countries
-Selected for the first time as a component of “Dow Jones Sustainability World Index ”, which benchmarks for socially responsible companies
-Selected for 3rd cumulative year as a component of “Dow Jones Sustainability Asia/Pacific Index”,which targets companies in Asia/Pacific
Yorii Plant
Super Cub 110commemorationmodel
News Topics
- Within the Yorii Plant, a function to create, standardize and globallyshare new automotive production technologies, including electrification, to beestablished

Financial ResultsSix Month Results
FY17 FY18 Change
Sales revenue 6,734.6 7,489.2 + 11.2%
Operating profit 494.9 422.1 - 14.7%
Operating margin 7.3% 5.6% - 1.7pt
Share of profit of investmentsaccounted for using the equity method 67.0 135.2 + 101.6%
Profit before income taxes 559.0 577.6 + 3.3%
Profit for the periodattributable to owners of the parent 351.7 381.3 + 8.4%
*1Earnings per share attributable to owners of the parent 195.19 211.59 + 16.40
53
US Dollar 105 111 Yen down by6 yen
FY18 Six Months Financial Results (Consolidated)
(Yen)
For *1, please refer to footnote on page 43Market average rates (Yen)
Yen (billion)

0
500
1,000
1,500
0
1,000
2,000
3,000
4,000
0
200
400
600
800
1,000
0
500
1,000
1,500
0
200
400
600
800
1,000
1,200
1,400
0
1,000
2,000
3,000
4,000
5,000
6,000
Honda Group Unit Sales
2Q Results (3 Months)
FY17 FY18 Change
Motorcycles 4,538 5,238 + 15.4%
Automobiles 1,218 1,292 + 6.1%
Power Products 1,240 1,258 + 1.5%
ConsolidatedUnit Sales
2Q Results (3 Months)
FY17 FY18 Change
Motorcycles 3,042 3,446 + 13.3%
Automobiles 890 907 + 1.9%
Power Products 1,240 1,258 + 1.5%
(Thousand)
4,5385,238 1,218 1,292
1,240 1,258
3,0423,446 890 907
1,240 1,258
Honda Group Unit Sales- Increase in motorcycle unit sales due mainly to sales growth in India, Indonesia and Vietnam. - Increase in automobile unit sales due mainly to sales growth in China and Japan despite a decline
in sales in North America
FY18 2nd Quarter Unit Sales
(Thousand)
Honda Group Unit Sales FY17 FY18
Unit (Thousand)
Motorcycles Automobiles Power ProductsUnit
(Thousand)
Motorcycles Automobiles Power Products
Consolidated Unit Sales
54

98.26 96.55 - 1.71
7.7%7.0%
5.9%
3.7%7.3%
4.1%
0%
2%
4%
6%
8%
10%
1Q 2Q 3Q 4Q
FY17FY18
0
100
200
300
1Q 2Q 3Q 4Q
FY17FY18
Earnings per shareattributable to owners of the parent
Financial Results2Q Results (3 Months)
FY17 FY18 Change
Sales revenue 3,262.9 3,776.1 + 15.7%
Operating profit 228.0 152.9 - 32.9%
Operating margin 7.0% 4.1% - 2.9ptShare of profit of investmentsaccounted for using the equity method
39.8 82.2 + 106.4%
Profit before income taxes 270.5 242.6 - 10.3%Profit for the periodattributable to owners of the parent 177.0 174.0 - 1.7%
US Dollar 102 111 Yen down by 9 yen
266.8228.0
207.6
138.1
(excl. pension impact 4.4%)
*1
269.2
152.9
Financial SummarySales revenue increased by 15.7% primarily due to sales increases in all business operations and positive foreign currency translation effects.
Operating profit decreased by 32.9% due primarily to the multi-discrict class action litigation settlement and the impact of the pension accounting treatment during the same period last year, despite the positiveimpact from revenue and model mix and a decline in SG&A expenses.
FY18 2nd Quarter Financial Results (Consolidated)
Yen (billion)
(Yen)
Market average rates (Yen) For *1, please refer to the footnote on page 43
Operating Profit Yen (billion)Operating Margin
(excl. litigation settlement 5.5%)
55

4,352 4,538 4,523 4,248 4,699 5,238
0
1,000
2,000
3,000
4,000
5,000
6,000
Japan 29 33 49 45 42 42North
America 78 71 68 77 80 83Europe 72 48 31 66 81 53
Asia 3,885 4,125 4,115 3,812 4,219 4,804Other
Regions 288 261 260 248 277 256Total 4,352 4,538 4,523 4,248 4,699 5,238
+ 700( + 15.4 % )
<Asia>・Increased sales in India, Indonesia and Vietnam<North America>・ Increased sales of GROM125 and other sports
motorcycles ・ Positive effect of Rebel 500 new model introduction
Rebel 500 (U.S.)
56
Motorcycles - Honda Group Unit Sales(Motorcycles, All-Terrain Vehicles, Side-by-Side etc.)
Unit (Thousand)
1Q 2Q 3Q 4Q 1Q 2QFY17 FY18

1,213 1,218 1,312 1,285 1,267 1,292
0
500
1,000
1,500
1Q 2Q 3Q 4Q 1Q 2QFY17 FY18
Japan 146 156 170 196 157 167North
America 510 479 510 471 481 452Europe 45 45 43 51 42 43
Asia 453 482 527 502 523 570Other
Regions 59 56 62 65 64 60Total 1,213 1,218 1,312 1,285 1,267 1,292
<Asia>・ China:increased sales of Civic and Avancier<Japan>・ Increased sales of Freed and N-Box<North America>・ Decreased sales in the sedan segment
+ 74( + 6.1 % )
Freed(Japan)
Automobiles - Honda Group Unit Sales
Unit (Thousand)
57

1,488 1,240 1,175
2,218 1,331 1,258
0
500
1,000
1,500
2,000
2,500
1Q 2Q 3Q 4Q 1Q 2QFY17 FY18
Japan 59 87 54 101 59 79North
America 769 522 521 1,165 596 545Europe 225 165 190 455 240 166
Asia 360 376 311 383 362 379Other
Regions 75 90 99 114 74 89Total 1,488 1,240 1,175 2,218 1,331 1,258
<North America>・Increased sales of generators in the U.S.<Japan>・ Decreased sales of OEM engines
+ 18( + 1.5 % )
EU2000i(generator)
Power Products - Honda Group Unit Sales
Unit (Thousand)
58

59
+ 524.9 - 290.8 - 165.7 + 32.12,002.5 2,102.9
Net Change + 100.4 Free cash flow+ 234.0
Net Cash1,524.8
+ 503.1 - 277.7- 154.5 - 141.31,666.8 1,596.4
Net Change - 70.4Free cash flow
+ 225.4
Net Cash1,179.9
Net Cash1,171.5
Cash Flows of Non-financial Services Businesses
FY17 Six Months
Cash & Cash equivalentsat beginning of FY17
Cash flows fromoperating activities
Cash flows from investing activities Cash flows from
financing activities Effect of exchange rate changes
Profit before income taxes + 461.9Share of profit of investment accounted for using the equity method - 67.0Depreciation* + 326.7Other - 218.4
Capital expenditures - 220.1Intangible assets -77.4Other +19.8
Dividends paid - 79.3Others - 75.2
Yen (billion)
Cash & Cash equivalentsat end of period
Cash flows fromoperating activities
Cash flows from investing activities
Profit before income taxes + 469.1Share of profit of investment accounted for using the equity method - 135.2Depreciation* + 349.9Other - 158.9
Capital expenditures - 236.0Intangible assets - 71.7Other + 16.8
Dividends paid - 86.5Others - 79.2
Net Cash1,627.9
Cash & Cash equivalentsat end of period
* Depreciation, amortization and impairment losses excluding equipment on operating leases
Cash flows from financing activities
Effect of exchange rate changes
Cash & Cash equivalentsat beginning of FY18
FY18 Six Months

270.5+ 23.2
- 16.1 + 22.6
+ 42.4 + 4.7
+ 11.4
Profit before Income Taxes - 27.9 ( - 10.3 % )
242.6
+ 21.4 - 84.0
LitigationSettlement
<Increase Factors>- Positive impact from sales
volume and model mix, etc<Decrease Factors>- Increased incentives, etc
Excluding currency effects, pension impactand litigation settlement + 39.9
Operating Profit - 75.1 ( - 32.9 % )
- 53.7
60
<Increase Factors>- Cost reduction efforts, etc.<Decrease Factors>- Raw material price increase,etc.
Impact ofPension
AccountingTreatment
-JPY / USD +17.0- USD / Others +7.0
(BRL, CAD, MXN)-JPY / Asian Currencies +11.5
(INR, THB, VND, CNY, IDR)-Others -12.9
Change in Profit before Income Taxes <FY18 2nd Qtr>
OperatingProfit
228.0
Revenue,model mix,
etc.
Decrease inSG&A
Increase inR&D
CurrencyEffects
Share of profit of investments
accounted for using the equity
method
OperatingProfit
152.9
Finance income and
finance costs
- Currency Effects -1.5- Interest rate swap
/currency swap +1.9- Others +4.2
Yen (billion)
FY17 2Q FY18 2Q
CostReduction,
etc.

Profit before Income Taxes + 18.5 ( + 3.3 % )
559.0 577.6+ 51.5 + 31.4 - 6.1 - 23.6 + 11.8
+ 68.1 + 23.2
Operating Profit - 72.7 ( - 14.7 % )
- 84.0
- 53.7
61
<Increase Factors>- Cost reduction efforts, etc< Decrease Factors>- Raw material price increase,
etc.
-JPY / USD +22.0- USD / Others +3.5
(BRL, CAD, MXN)-JPY / Asian Currencies +14.0
(INR, THB, VND, CNY, IDR)-Others -27.7
Change in Profit before Income Taxes <FY18 Six Months>
Yen (billion)
OperatingProfit
494.9
FY17Six Months
Revenue,model mix,
etc.
CostReduction,
etc.
Increase inSG&A Increase in
R&DCurrencyEffects
Impact of Pension
Accounting Treatment
Share of profit of investments
accounted for using the equity
method
Finance income and
finance costsLitigation
Settlement
Excluding currency effects, pension impactand litigation settlement + 53.1
- Currency Effects + 14.2 - Interest rate swap/currency swap
+ 3.5- Others + 5.3
OperatingProfit
422.1
FY18Six Months

31.159.5
41.8 38.1
78.8 68.5
7.2%
14.5%
10.0%8.4%
15.5%13.4%
-20%
-15%
-10%
-5%
0%
5%
10%
15%
20%
0
20
40
60
80
100
120
140
160
1Q 2Q 3Q 4Q 1Q 2QFY17 FY18
Honda GroupUnit Sales
(Consolidated Unit Sales)
4,352(2,831)
4,538(3,042)
4,523(2,675)
4,248(2,689)
4,699(3,245)
5,238(3,446)
Sales Revenue 432.4 409.3 420.6 453.7 508.5 510.1
(excl. pension impact :12.9%)
( + 15.1 % )
( + 24.6 % )+ 100.7 (Currency effect + 42.2)
FY17 FY181Q 2Q 3Q 4Q 1Q 2Q
<Increase Factors>・Positive impact from sales volume
and model mix, etc.<Decrease Factors>・The impact of the pension accounting
treatment, etc.
Motorcycle Business Sales Revenue /Operating Profit (Margin)
Yen (billion) Operating Profit
Operating Margin
Unit (Thousand)Yen (billion)
62

FY17 FY181Q 2Q 3Q 4Q 1Q 2Q
184.5131.8 129.8
54.9140.3
39.2
7.3% 5.5%5.0%
2.0%5.3% 1.5%
-40%
-30%
-20%
-10%
0%
10%
20%
0
100
200
300
400
500
Honda GroupUnit Sales
(Consolidated Unit Sales)
1,213(908)
1,218(890)
1,312(925)
1,285(960)
1,267(900)
1,292(907)
Sales Revenue 2,536.1 2,377.4 2,596.4 2,746.7 2,624.5 2,693.0
( - 70.2 % )
( + 13.3 % )+ 315.6 (Currency effect + 180.4)
1Q 2Q 3Q 4Q 1Q 2QFY17 FY18
(excl. litigation settlement :3.4%)
<Increase Factors>・Decrease in SG&A expenses, etc.<Decrease Factors>・The impact of the pension accounting
treatment・The multi-district class action
litigation settlement, etc.
Automobile Business Sales Revenue/Operating Profit (Margin)
Unit (Thousand)Yen (billion)
Yen (billion) Operating Profit
Operating Margin
(excl. pension impact :2.4%)
63

1Q 2Q 3Q 4Q 1Q 2QFY17 FY18
FY17 FY181Q 2Q 3Q 4Q 1Q 2Q
0.5
-1.0
-6.3 -2.7
0.1 - 2.0 0.7%
-1.4%
-7.9%
-2.4%
0.2%
-2.3%
-10%
-5%
0%
5%
10%
-10.0
-7.5
-5.0
-2.5
0.0
2.5
5.0
7.5
10.0
*
Operating profitfromaircraft and aircraft engines
- 8.8 - 10.6 - 12.3 - 12.0 - 8.5 - 13.6
(For reference)
(excl. pension impact :- 4.4%)
Honda GroupUnit Sales
(Consolidated Unit Sales)
1,488(1,488)
1,240(1,240)
1,175(1,175)
2,218(2,218)
1,331(1,331)
1,258(1,258)
Sales Revenue 80.9 73.5 80.3 114.8 83.1 87.8( + 19.3 % )
+ 14.2 (Currency effect + 5.2)*Honda Group Unit Sales and Consolidated Unit Sales include only power product units
<Increase Factors>・Positive impact from sales volume and model mix, etc.
<Decrease Factors>・The impact of the pension accounting treatment ・Increased expenses in other businesses operations etc.
Operating Profit
Operating Margin
Yen (billion)
Power Product & Other Businesses Sales Revenue/Operating Profit (Margin)
Unit (Thousand)Yen (billion)
64

FY17 FY181Q 2Q 3Q 4Q 1Q 2Q
50.537.7 42.3 47.7 49.8 47.2
10.8%8.5% 9.3% 9.2% 9.2% 8.8%
-20%
-15%
-10%
-5%
0%
5%
10%
15%
20%
0
20
40
60
80
100
120
Total Assets of Finance
Subsidiaries8,538.3 8,440.3 9,643.3 9,437.0 9,494.4 9,688.7
Sales Revenue 467.9 446.3 455.7 521.1 539.6 539.5( + 20.9 % )
+ 93.1 (Currency effect + 37.0)
1Q 2Q 3Q 4Q 1Q 2Q
FY17 FY18
( + 25.1 % )
<Increase Factors>Increased in operationg lease revenues,etc.
Financial Services BusinessTotal Assets/Sales Revenue/Operating Profit (Margin)
Operating Profit
Operating Margin
Yen (billion)
Yen (billion)
65

Motorcycle Business
Automobile Business
Power Product and Other
BusinessesFinancial Services
BusinessFY17
Six MonthsFY18
Six MonthsFY17
Six MonthsFY18
Six MonthsFY17
Six MonthsFY18
Six MonthsFY17
Six MonthsFY18
Six MonthsHonda Group
Unit Sales(Consolidated Unit Sales)
8,890 9,937 2,431 2,559 2,728 2,589 - -(5,873) (6,691) (1,798) (1,807) (2,728) (2,589) (-) (-)
Sales Revenue 841.7 1,018.6 4,913.5 5,317.6 154.4 170.9 914.3 1,079.2
-50
0
50
100
150
200
250
300
350
+ 62.5 % + 9.9 %
(6.4 %)
(-0.3 %) (9.7 %)(-1.1 %) (9.0 %)(3.4 %)
(14.5 %)
- 43.2 %
66
(10.8 %)
FY17Six Months
FY18Six Months
FY17Six Months
FY18Six Months
FY17Six Months
FY18Six Months
FY17Six Months
FY18Six Months
90.7147.3
316.3
179.5- 0.5 - 1.8 88.3 97.1
Sales Revenue/Operating Profit (Margin) by Business Segment <FY18 Six Months >
Unit (Thousand)Yen (billion)
Operating Profit : Yen (billion) Operating Margin : (%)

85.8
38.10.1
91.2
13.434.3
- 0.6 2.5
110.3
12.0
-20
0
20
40
60
80
100
120
Japan North America Europe Asia Other
RegionsFY17 FY18 FY17 FY18 FY17 FY18 FY17 FY18 FY17 FY18
2Q 2Q 2Q 2Q 2Q 2Q 2Q 2Q 2Q 2Q
Sales Revenue 977.5 1,058.2 1,839.2 2,067.9 161.0 208.9 831.2 1,094.2 173.6 202.6
FY17 FY18 FY17 FY18 FY17 FY18 FY17 FY18 FY17 FY182Q 2Q 2Q 2Q 2Q 2Q 2Q 2Q 2Q 2Q
+ 20.8 % - 10.6 %- 60.0 %
67
incl. pension impact
84.0(profit)
incl. litigation settlement 53.7(loss)
Sales Revenue/Operating Profit by Geographical Segment <FY18 2nd Qtr>
Operating Profit: Yen (billion)
Yen (billion)

Japan North America Europe Asia Other
RegionsFY17 FY18 FY17 FY18 FY17 FY18 FY17 FY18 FY17 FY18
Six Months Six Months Six Months Six Months Six Months Six Months Six Months Six Months Six Months Six Months
Sales Revenue 1,883.2 2,083.2 3,908.0 4,198.1 344.0 422.2 1,662.5 2,075.9 346.5 406.5
66.0
209.3
1.3
181.6
27.755.8100.9
9.1
208.1
26.7
-50
0
50
100
150
200
250
- 15.4 % - 51.8 % + 14.6 % - 3.7 %
68
Sales Revenue/Operating Profit (Margin) by Geographical Segment <FY18 Six Months>
Yen (billion)
Operating Profit: Yen (billion)
incl. pension impact
84.0(profit)
incl. litigation settlement 53.7(loss)
FY17 FY18 FY17 FY18 FY17 FY18 FY17 FY18 FY17 FY18Six Months Six Months Six Months Six Months Six Months Six Months Six Months Six Months Six Months Six Months

1Q 2Q 3Q 4Q 1Q 2QFY17 FY18
27.239.8 49.1 48.5 52.9
82.2
0
20
40
60
80
100
From Asia 39.3 36.2 40.8 43.8 46.3 57.9
+ 42.4( + 106.4% )
Share of Profit of InvestmentsAccounted for Using the Equity Method
Yen (billion)
Yen (billion)
69

70
FY18PreviousForecast
FY18RevisedForecast
ChangeFY18
PreviousForecast
FY18RevisedForecast
ChangeFY18
PreviousForecast
FY18RevisedForecast
Change
Japan 170 165 - 5 680 690 + 10 265 280 + 15North
America 315 315 - 1,920 1,920 - 3,010 3,010 -Europe 220 225 + 5 175 175 - 1,030 1,015 - 15
Asia 17,015 17,375 + 360 2,060 2,100 + 40 1,460 1,455 - 5Other
Regions 1,050 1,100 + 50 245 245 - 400 405 + 5Total 18,770 19,180 + 410 5,080 5,130 + 50 6,165 6,165 -
17,661 18,770 19,180 5,028 5,080 5,130 6,121 6,165 6,165
+ 410( + 2.2 %)
± 0( ± 0 %)
+ 50( + 1.0 %)
Forecast: Honda Group Unit Sales
Motorcycles Automobiles Power Products
Unit(Thousand)
FY17Results
FY18PreviousForecast
FY18RevisedForecast
FY17Results
FY18PreviousForecast
FY18RevisedForecast
FY17Results
FY18PreviousForecast
FY18RevisedForecast

71
FY18PreviousForecast
FY18RevisedForecast
ChangeFY18
PreviousForecast
FY18RevisedForecast
ChangeFY18
PreviousForecast
FY18RevisedForecast
Change
Japan 170 165 - 5 615 620 + 5 265 280 + 15North
America 315 315 - 1,920 1,920 - 3,010 3,010 -Europe 220 225 + 5 175 175 - 1,030 1,015 - 15
Asia 10,465 10,815 + 350 730 730 - 1,460 1,455 - 5Other
Regions 1,050 1,100 + 50 245 245 - 400 405 + 5Total 12,220 12,620 + 400 3,685 3,690 + 5 6,165 6,165 -
11,23712,220 12,620
3,683 3,685 3,690 6,121 6,165 6,165
+ 400( + 3.3 %)
± 0( ± 0 %)
+ 5( + 0.1 %)
Forecast: Consolidated Unit Sales
AutomobilesMotorcycles Power Products
FY17Results
FY18PreviousForecast
FY18RevisedForecast
FY17Results
FY18PreviousForecast
FY18RevisedForecast
FY17Results
FY18PreviousForecast
FY18RevisedForecast
Unit(Thousand)

Earnings per shareattributable to owners of the parent 342.10 326.26 - 15.84 + 23.87
FY17Results
FY18Forecast
Change Change from previous forecastAmount %
Sales revenue 13,999.2 15,050.0 + 1,050.8 + 7.5% + 550.0
Operating profit 840.7 745.0 - 95.7 - 11.4% + 20.0
Operating margin 6.0% 5.0% - 1.0pt -
Share of profit of investments accounted for using the equity method
164.7 205.0 + 40.2 + 24.4% + 25.0
Profit before income taxes 1,006.9 955.0 - 51.9 - 5.2% + 55.0
Profit for the yearattributable to owners of the parent
616.5 585.0 - 31.5 - 5.1% + 40.0
US Dollar 108 109 (1H 111 /
3Q 110 / 4Q 105 )Yen down by 1 yen Yen down
by 2 yen
*1
FY18 Financial Forecasts (Consolidated)Yen (billion)
Market average rates (Yen)
(Yen)
For *1, please refer to the footnote on page 43
72

73
Profit before Income Taxes - 51.9 ( - 5.2 % )
1,006.9 955.0+ 89.0
+ 75.0 - 57.0- 54.0
- 11.0+ 40.2 + 3.5
Operating Profit - 95.7 ( - 11.4 % )
- 53.7
LitigationSettlement
- 84.0
FY18 Forecast: Change in Profit before Income Taxes
Yen (billion)
OperatingProfit
840.7
Revenue,model mix,
etc.
Increase inSG&A Increase in
R&D CurrencyEffects
Impact of Pension
Accounting Treatment
Share of profit of investments
accounted for using the equity
method
Finance income and
finance costs
OperatingProfit
745.0
- JPY / USD - USD / Others
(BRL, CAD, MXN)- JPY / Asian Currencies
(INR, THB, VND, CNY, IDR)- Others
+7.0+7.5
+9.5
- 35.0
FY18RevisedForecast
FY17Results
CostReduction,
etc.

74
900.0955.0
-+ 64.0 + 25.0-
Profit before Income Taxes + 55.0 ( + 6.1 % )
- 53.7+ 29.7 - 20.0 + 10.0
Excl. currency effects and litigation settlement
+ 9.7
Operating Profit + 20.0 ( + 2.8 % )
FY18 Forecast: Change in Profit before Income Taxes
Yen (billion)
OperatingProfit
725.0
FY18PreviousForecast
Revenue,model mix,
etc.
Increase inSG&A R&D
CurrencyEffects
Litigationsettlement
Share of profit of investments
accounted for using the equity
method
Finance income and
finance costs
OperatingProfit
745.0
FY18RevisedForecast
- JPY / USD - USD / Others
(BRL, CAD, MXN)- JPY / Asian Currencies
(INR, THB, VND, CNY, IDR)- Others
+ 38.5+7.5
+ 13.5
+ 4.5
CostReduction,
etc.

75
FY18 Forecast: Capital Expenditures, Depreciation and R&D
0%
2%
4%
6%
8%
0
200
400
600
800
FY11 12 13 14 15 16 17 18P0%
2%
4%
6%
8%
0
200
400
600
800
FY11 12 13 14 15 16 170%
2%
4%
6%
8%
0
200
400
600
800
FY11 12 13 14 15 16 17 18P
Capital Expenditures Depreciation
Actual Amounts % against Sales
US GAAP IFRS US GAAP IFRS US GAAP IFRS
R&D Expenditures
* Capital expenditures as well as Depreciation and amotization n results and forecast aforementioned exclude investment in operating leases, finance leases and intangible assets.
** Research and development expenditures are research and development activity related costs incurred during the reporting period. In accordance with IFRS, a portion of research and development expenditures is recognized as an intangible asset and amortized over its estimated useful life. As such, this amount is not in conformity with "Research and development" on our Consolidated Statement of Income.Research and development expenditures aforementioned exclude decrease of 25.4 billion yen due to the impact of pension accounting treatment in FY17 2nd quarter.

【Acquisition of the Company’s Own Shares】
・Total number of shares to be acquired : Up to 24 million shares (shares of common stock)(1.3% of total number of issued shares (excluding treasury stock))
・Total amount of shares to be acquired : Up to 90 billion yen・Period of acquisition: Starting on November 2, 2017 and ending on January 31, 2018
・Method of acquisition: Market purchases on the Tokyo Stock Exchange
1.Purchases through the Tokyo Stock Exchange Trading Network Off-Auction OwnShare Repurchase Trading System (ToSTNeT-3)
2.Market purchases based on the discretionary investment contracts regardingacquisition of own shares
76
FY18 Shareholders’ return(Yen)
Dividend per Share FY17 FY18(Expectation)
change
1st Quarter End 22 24 + 22nd Quarter End 22 24 + 2 3rd Quarter End 24 ( 24 ) ( - )4th Quarter End 24 ( 24 ) ( - )
Fiscal Year 92 ( 96 ) ( + 4 )

97.4 108.1137.0 147.8 158.6 158.6 165.8 171.9
25
90
122.4108.1
137.0 147.8 158.6 158.6165.8
261.9
18.3%51.1%
37.3%
25.7%32.2%
46.0%
26.9%29.4%
0
100
200
300
400
500
FY11 FY12 FY13 FY14 FY15 FY16 FY17 FY18
77
FY11Actual
FY12Actual
FY13Actual
FY14Actual
FY15Actual
FY16Actual
FY17Actual
FY18(Estimated)
Dividend(Yen)
1st Quarter End 12 15 19 20 22 22 22 24
2ndQuarter End 12 15 19 20 22 22 22 24
3rd Quarter End 15 15 19 20 22 22 24 ( 24 )
4th Quarter End 15 15 19 22 22 22 24 ( 24 )
Fiscal Year 54 60 76 82 88 88 92 ( 96 )
Dividends ratio* 18.3% 51.1% 37.3% 25.7% 32.2% 46.0% 26.9% ( 29.4% )
Acquisition of the Company’s Own Shares 25.0 0 0 0 0 0 0 ( 90 )
(billionYen)
Acquisition of the Company’sOwn Shares
TotalDividend
DividendsRatio
Recent Shareholders’ Return Summary Trend
* US GAAP up to FY15 , IFRS from FY16
(billion)

Caution with Respect to Forward-Looking Statements:This slide contains forward-looking statements about the performance of Honda, which are based on management’s assumptions and beliefs taking into account information currently available to it. Therefore, please be advised that Honda’s actual results could differ materially from those described in these forward-looking statements as a result of numerous factors, including general economic conditions in Honda’s principal markets and fluctuation of foreign exchange rates, as well as other factors detailed from time to time.
Accounting standards: Our consolidated financial statements are prepared in conformity with International Financial Reporting Standards (IFRS), as issued by the International Accounting Standards Board (IASB)
Notice on the Factors for Increases and Decreases in Income:With respect to the discussion above of the change in Operating profit, management has identified the factors set forth below and used what it believes to be a reasonable method to analyze the respective changes in such factors. Each of these factors is explained below. Management has analyzed changes in these factors at the levels of the Company and its material consolidated subsidiaries.(1)“Currency effects” consist of translation adjustments, which come from the translation of the currency of foreign subsidiaries’ financial statements into Japanese Yen, and foreign currency adjustments, which result from foreign-currency-denominated sales, which, at the levels of the Company and those consolidated subsidiaries which have been analyzed, primarily relate to the following currencies: U.S. dollar, Canada dollar, Euro, GBP, BRL and Japanese Yen. (2) With respect to “Cost reduction, etc.”, management has analyzed cost reduction and effects of raw material cost fluctuations at the levels of the Company and its material foreign manufacturing subsidiaries in North America, Europe and other regions.(3) With respect to “Revenue, model mix, etc.”, management has analyzed changes in sales volume and in the mix of product models sold in major markets which have resulted inincreases/decreases in profit, as well as certain other reasons for increases/decreases in sales revenue and cost of sales.(4) With respect to “Selling, General and Administrative expenses”, management has analyzed reasons for an increase/decrease in selling, general and administrative expenses from the previous fiscal year net of currency translation effects.(5) With respect to “Research and Development expenses”, management has analyzed reasons for an increase/decrease in research and development expenses from the previous fiscal year net of currency translation effects.
Unit sales:Motorcycle BusinessHonda Group Unit Sales is the total unit sales of completed products, including motorcycles, ATVs, and Side-by-Side of Honda, its consolidated subsidiaries and its affiliates and joint ventures accounted for using the equity method. Consolidated Unit Sales is the total unit sales of completed products corresponding to consolidated sales revenue to external customers, which consists of unit sales of completed products of Honda and its consolidated subsidiaries.Automobile BusinessHonda Group Unit Sales is the total unit sales of completed products of Honda, its consolidated subsidiaries and its affiliates and joint ventures accounted for using the equity method. Consolidated Unit Sales is the total unit sales of completed products corresponding to consolidated sales revenue to external customers, which consists of unit sales of completed products of Honda and its consolidated subsidiaries. Certain sales of automobiles that are financed with residual value type auto loans by our Japanese finance subsidiaries and sold through our consolidated subsidiaries are accounted for as operating leases in conformity with IFRS and are not included in consolidated sales revenue to the external customers in our Automobile business. Accordingly, they are not included in Consolidated Unit Sales, but are included in Honda Group Unit Sales of our Automobile business.Power Product BusinessesHonda Group Unit Sales is the total unit sales of completed power products of Honda, its consolidated subsidiaries and its affiliates and joint ventures accounted for using the equity method. Consolidated Unit Sales is the total unit sales of completed power products corresponding to consolidated sales revenue to external customers, which consists of unit sales of completed power products of Honda and its consolidated subsidiaries. In Power Product business, there is no discrepancy between Honda Group Unit Sales and Consolidated Unit Sales since no affiliate and joint venture accounted for using the equity method was involved in the sale of Honda power products.
78