Embed Size (px)
Citation preview
8/7/2019 Thackray Market Letter 2010 December
http://slidepdf.com/reader/full/thackray-market-letter-2010-december 1/7
Thackray Market Letter — Know Your Buy & Sells a Month in Advance —
Published the 10th Calendar Day of Every MonthVolume 4, Number 12, December 2010 Written by Brooke Thackray
alphaMountain Investments - alphamountain.com
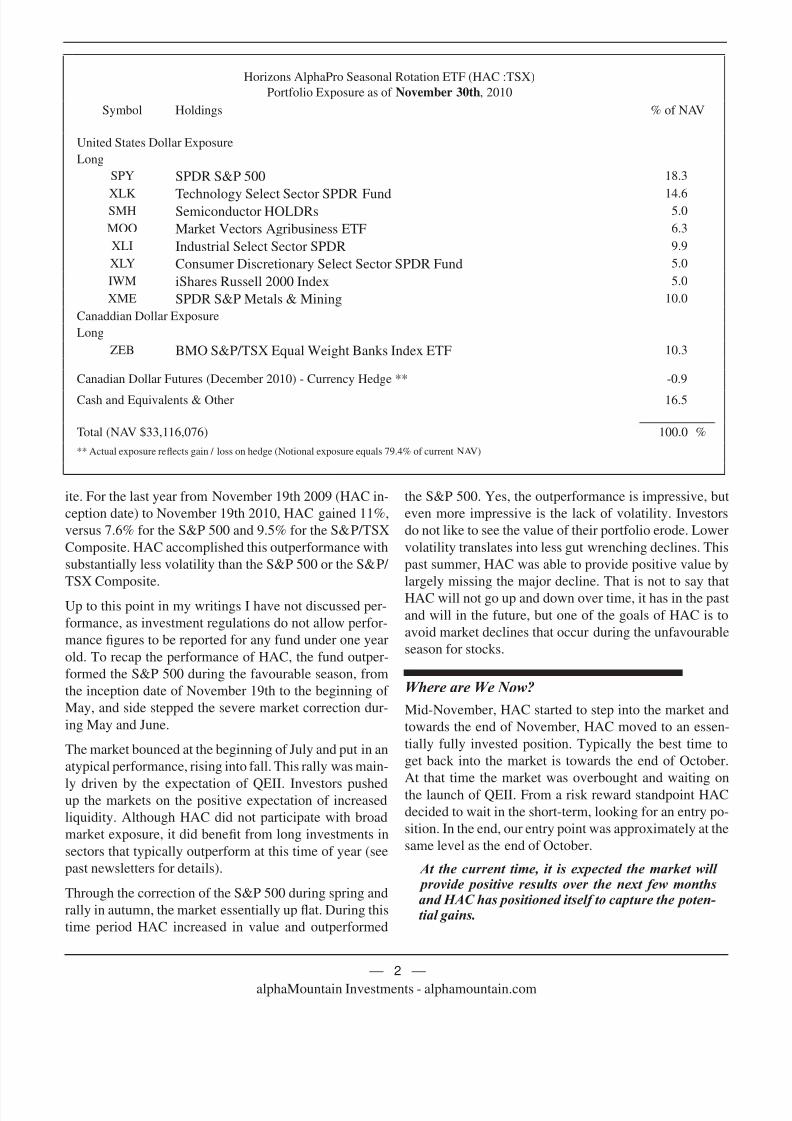
S&P 500 Technical Status
The S&P 500 has just recently broken out of its trading range. Although this is a positive development, investorsshould not get too excited. We are at the early stages of the breakout. Look for strong volume to confirm a continuingrally. Just prior to the breakout, the S&P 500 bounced off its 50 Day Moving Average. This is also a positive devel-opment. If the S&P 500 were too fall below its 50 DMA, then it is possible for a retracement to approximately 1120.We are currently in the favourable season for the stock market and as such, the market is expected to move higherover the next few months. Possible areas for a retracement are the middle of January and the month of February.
Brooke Thackray is a Research Analyst along with Don Vialoux for the Horizons AlphaPro Seasonal Rotation ETFthat trades under the symbol HAC on the Toronto Stock Exchange. The objective of HAC is long-term capital ap-
preciation in all market cycles by tactically allocating its exposure amongst equities, fixed income, commodities
and currencies during periods that have historically demonstrated seasonal trends. The Thackray Market Letter is
for educational purposes and is meant to demonstrate the advantages of seasonal investing by describing many of
the trades and strategies in HAC.
Thackray’s 2011 Investor’s Guide
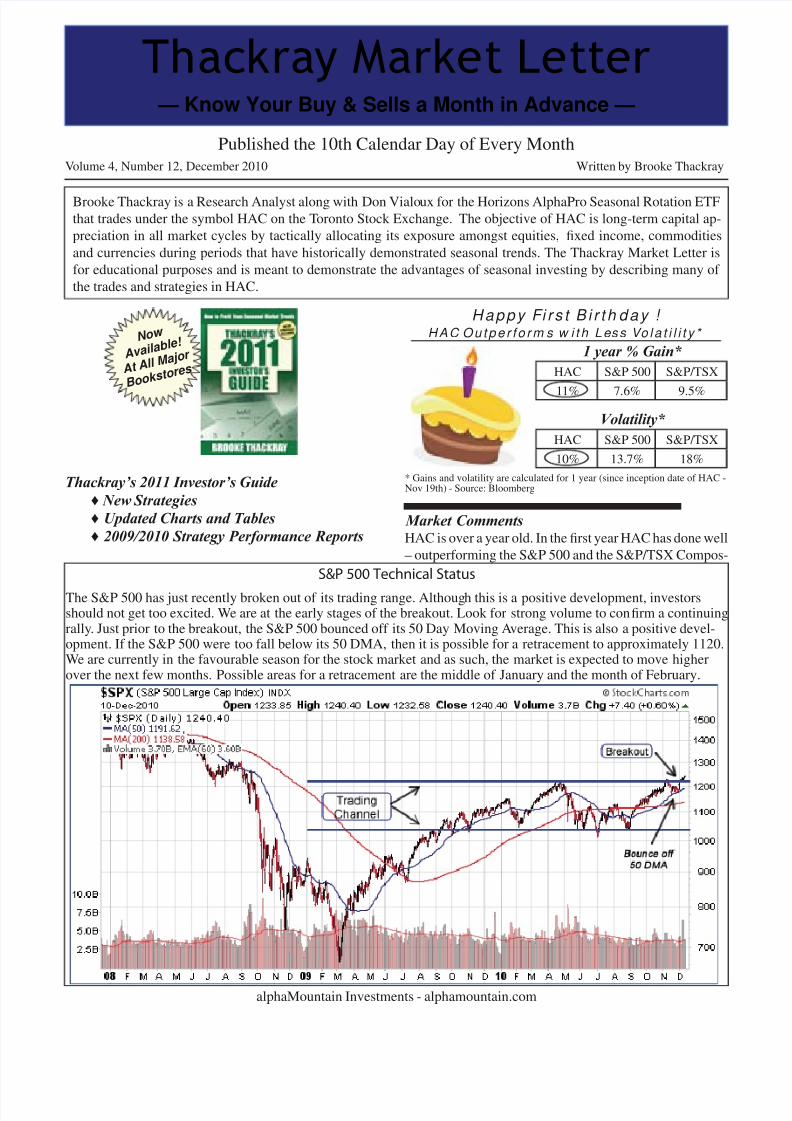
Happy Fi r s t B i r t h day ! HAC Ou t pe r f o r m s w i t h Less Vo la t i l i t y *
Market CommentsHAC is over a year old. In the first year HAC has done well
– outperforming the S&P 500 and the S&P/TSX Compos-
No w
Available!
At All Major
Bookstores
♦ New Strategies
♦ Updated Charts and Tables
♦ 2009/2010 Strategy Performance Reports
1 year % Gain*
HAC S&P 500 S&P/TSX
11% 7.6% 9.5%
Volatility*
HAC S&P 500 S&P/TSX
10% 13.7% 18%
* Gains and volatility are calculated for 1 year (since inception date of HAC -Nov 19th) - Source: Bloomberg
8/7/2019 Thackray Market Letter 2010 December
http://slidepdf.com/reader/full/thackray-market-letter-2010-december 2/7alphaMountain Investments - alphamountain.com
— 2 —
ite. For the last year from November 19th 2009 (HAC in-
ception date) to November 19th 2010, HAC gained 11%,
versus 7.6% for the S&P 500 and 9.5% for the S&P/TSX
Composite. HAC accomplished this outperformance with
substantially less volatility than the S&P 500 or the S&P/
TSX Composite.
Up to this point in my writings I have not discussed per-
formance, as investment regulations do not allow perfor-
mance figures to be reported for any fund under one year
old. To recap the performance of HAC, the fund outper-
formed the S&P 500 during the favourable season, from
the inception date of November 19th to the beginning of
May, and side stepped the severe market correction dur-
ing May and June.
The market bounced at the beginning of July and put in an
atypical performance, rising into fall. This rally was main-
ly driven by the expectation of QEII. Investors pushedup the markets on the positive expectation of increased
liquidity. Although HAC did not participate with broad
market exposure, it did benefit from long investments in
sectors that typically outperform at this time of year (see
past newsletters for details).
Through the correction of the S&P 500 during spring and
rally in autumn, the market essentially up flat. During this
time period HAC increased in value and outperformed
the S&P 500. Yes, the outperformance is impressive, but
even more impressive is the lack of volatility. Investors
do not like to see the value of their portfolio erode. Lower
volatility translates into less gut wrenching declines. This
past summer, HAC was able to provide positive value by
largely missing the major decline. That is not to say that
HAC will not go up and down over time, it has in the past
and will in the future, but one of the goals of HAC is to
avoid market declines that occur during the unfavourable
season for stocks.
Where are We Now?
Mid-November, HAC started to step into the market and
towards the end of November, HAC moved to an essen-
tially fully invested position. Typically the best time to
get back into the market is towards the end of October.
At that time the market was overbought and waiting on
the launch of QEII. From a risk reward standpoint HAC
decided to wait in the short-term, looking for an entry po-
sition. In the end, our entry point was approximately at the
same level as the end of October.
At the current time, it is expected the market will provide positive results over the next few monthsand HAC has positioned itself to capture the poten-tial gains.
Horizons AlphaPro Seasonal Rotation ETF (HAC :TSX)
Portfolio Exposure as of November 30th, 2010
Symbol Holdings % of NAV
United States Dollar Exposure
Long
SPY SPDR S&P 500 18.3
XLK Technology Select Sector SPDR Fund 14.6SMH Semiconductor HOLDRs 5.0
MOO Market Vectors Agribusiness ETF 6.3
XLI Industrial Select Sector SPDR 9.9
XLY Consumer Discretionary Select Sector SPDR Fund 5.0
IWM iShares Russell 2000 Index 5.0
XME SPDR S&P Metals & Mining 10.0
Canaddian Dollar Exposure
Long
ZEB BMO S&P/TSX Equal Weight Banks Index ETF 10.3
Canadian Dollar Futures (December 2010) - Currency Hedge ** -0.9
Cash and Equivalents & Other 16.5
Total (NAV $33,116,076) 100.0 %
** Actual exposure reflects gain / loss on hedge (Notional exposure equals 79.4% of current NAV)
8/7/2019 Thackray Market Letter 2010 December
http://slidepdf.com/reader/full/thackray-market-letter-2010-december 3/7alphaMountain Investments - alphamountain.com
— 3 —
It is possible that the market may encounter soft spots
in the middle weeks of January and the month of Feb-
ruary. Although January is the fourth best month of the
year (S&P 500 since 1950), the middle weeks in January
can be soft. In addition February has on average been the
second worst month of the year (S&P 500 since 1950).
Despite these weaker tendencies, we are still in the fa-
vourable six months of the year.
Last year HAC was able to outperform the S&P 500 dur-
ing the favourable season by overweighting the season-
ally strong sectors. It is the goal of HAC to do the same
again this year.
The portfolio for HAC at the end of November is listed on
the second page of this report. The major equity holdings
for each sector are discussed below.
Technology
The technology sector typically outperforms at this time
of year (mid-October to mid-January) as companies spendmoney on computer equipment before yearend to clean
out their budget. Investors also push up the technology
sector as they anticipate increased electronics shopping
around the Christmas season and anticipate positive prod-
uct announcements at the Consumer Electronics Show in
January.
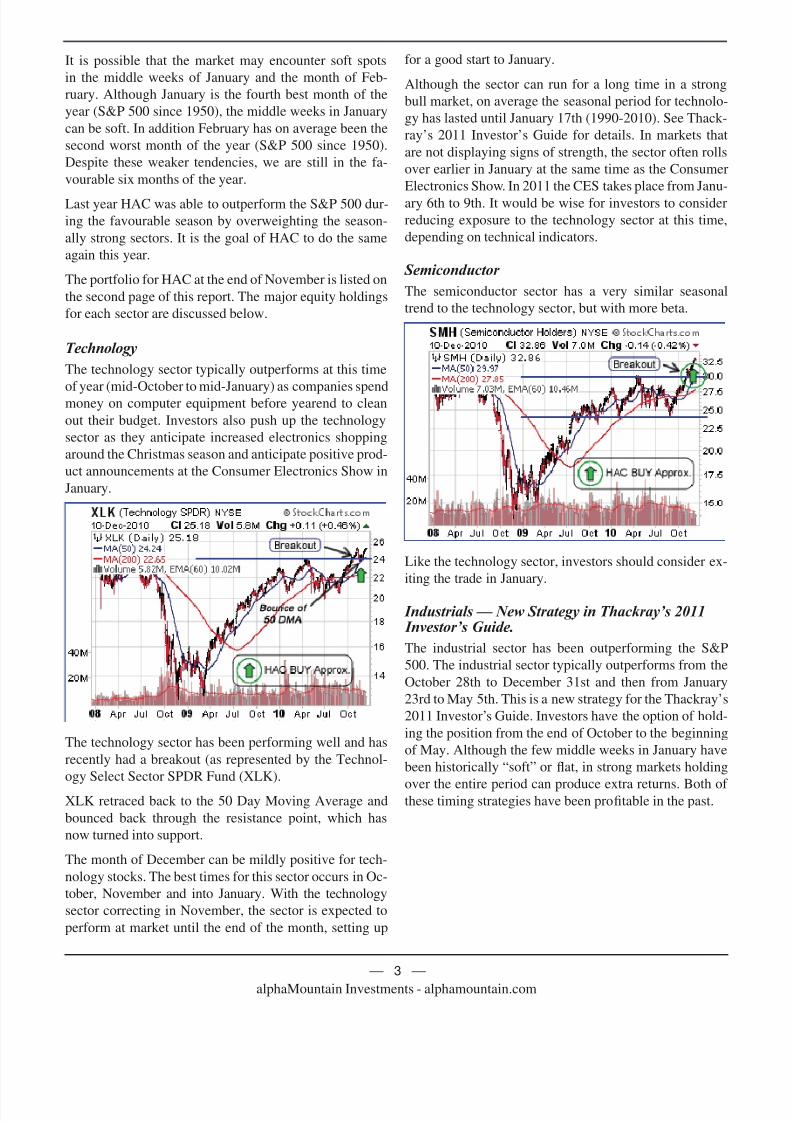
The technology sector has been performing well and has
recently had a breakout (as represented by the Technol-
ogy Select Sector SPDR Fund (XLK).
XLK retraced back to the 50 Day Moving Average and
bounced back through the resistance point, which has
now turned into support.
The month of December can be mildly positive for tech-
nology stocks. The best times for this sector occurs in Oc-
tober, November and into January. With the technology
sector correcting in November, the sector is expected to
perform at market until the end of the month, setting up
for a good start to January.
Although the sector can run for a long time in a strong
bull market, on average the seasonal period for technolo-
gy has lasted until January 17th (1990-2010). See Thack-
ray’s 2011 Investor’s Guide for details. In markets that
are not displaying signs of strength, the sector often rolls
over earlier in January at the same time as the Consumer
Electronics Show. In 2011 the CES takes place from Janu-
ary 6th to 9th. It would be wise for investors to consider
reducing exposure to the technology sector at this time,
depending on technical indicators.
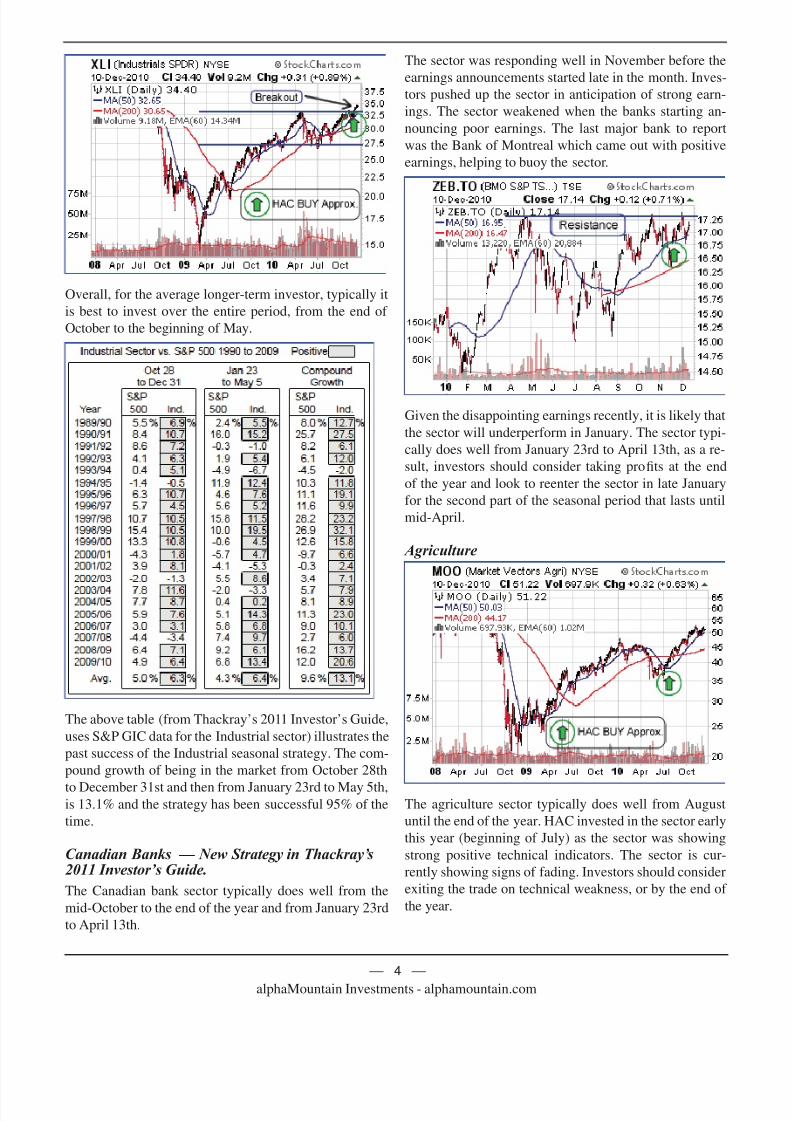
Semiconductor
The semiconductor sector has a very similar seasonal
trend to the technology sector, but with more beta.
Like the technology sector, investors should consider ex-
iting the trade in January.
Industrials — New Strategy in Thackray’s 2011 Investor’s Guide.
The industrial sector has been outperforming the S&P
500. The industrial sector typically outperforms from the
October 28th to December 31st and then from January
23rd to May 5th. This is a new strategy for the Thackray’s
2011 Investor’s Guide. Investors have the option of hold-
ing the position from the end of October to the beginning
of May. Although the few middle weeks in January have
been historically “soft” or flat, in strong markets holding
over the entire period can produce extra returns. Both of these timing strategies have been profitable in the past.
8/7/2019 Thackray Market Letter 2010 December
http://slidepdf.com/reader/full/thackray-market-letter-2010-december 4/7alphaMountain Investments - alphamountain.com
— 4 —
Overall, for the average longer-term investor, typically it
is best to invest over the entire period, from the end of
October to the beginning of May.
The above table (from Thackray’s 2011 Investor’s Guide,
uses S&P GIC data for the Industrial sector) illustrates the
past success of the Industrial seasonal strategy. The com-
pound growth of being in the market from October 28th
to December 31st and then from January 23rd to May 5th,is 13.1% and the strategy has been successful 95% of the
time.
Canadian Banks — New Strategy in Thackray’s2011 Investor’s Guide.
The Canadian bank sector typically does well from the
mid-October to the end of the year and from January 23rd
to April 13th.
The sector was responding well in November before the
earnings announcements started late in the month. Inves-
tors pushed up the sector in anticipation of strong earn-
ings. The sector weakened when the banks starting an-
nouncing poor earnings. The last major bank to report
was the Bank of Montreal which came out with positive
earnings, helping to buoy the sector.
Given the disappointing earnings recently, it is likely that
the sector will underperform in January. The sector typi-
cally does well from January 23rd to April 13th, as a re-
sult, investors should consider taking profits at the end
of the year and look to reenter the sector in late January
for the second part of the seasonal period that lasts until
mid-April.
Agriculture
The agriculture sector typically does well from August
until the end of the year. HAC invested in the sector early
this year (beginning of July) as the sector was showing
strong positive technical indicators. The sector is cur-
rently showing signs of fading. Investors should consider
exiting the trade on technical weakness, or by the end of
the year.
8/7/2019 Thackray Market Letter 2010 December
http://slidepdf.com/reader/full/thackray-market-letter-2010-december 5/7alphaMountain Investments - alphamountain.com
— 5 —
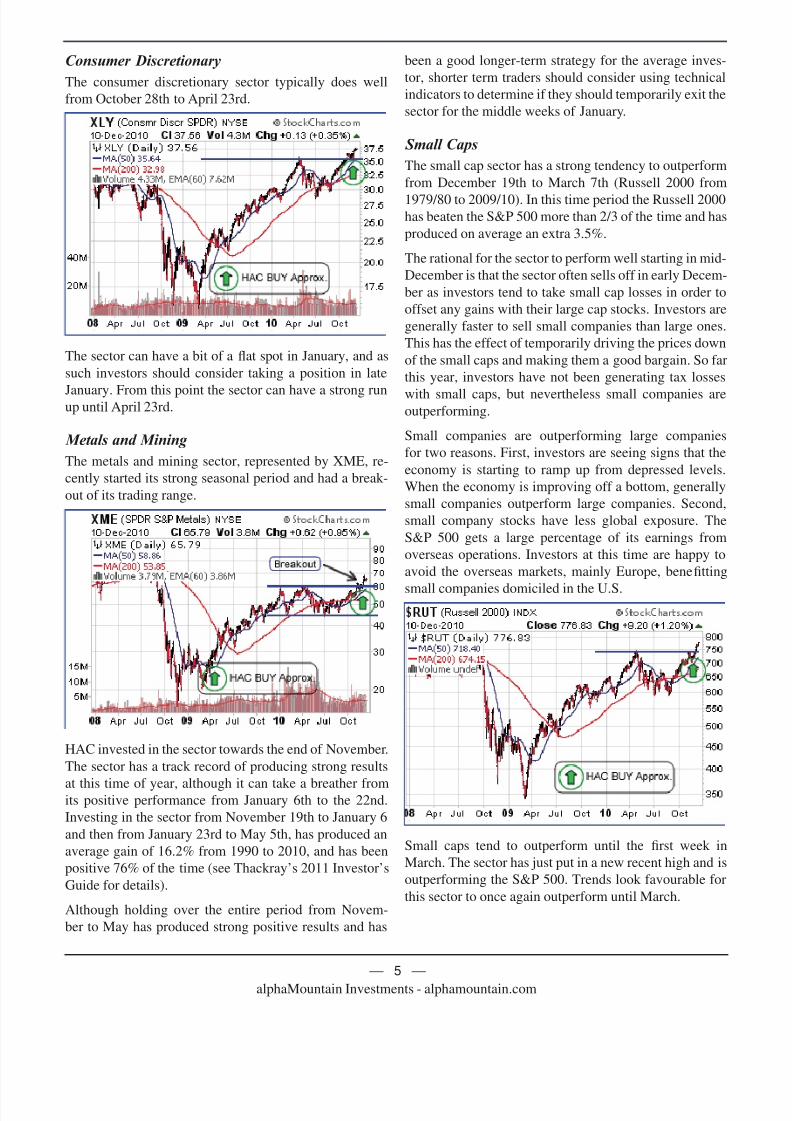
Consumer Discretionary
The consumer discretionary sector typically does well
from October 28th to April 23rd.
The sector can have a bit of a flat spot in January, and as
such investors should consider taking a position in late
January. From this point the sector can have a strong runup until April 23rd.
Metals and Mining
The metals and mining sector, represented by XME, re-
cently started its strong seasonal period and had a break-
out of its trading range.
HAC invested in the sector towards the end of November.
The sector has a track record of producing strong results
at this time of year, although it can take a breather fromits positive performance from January 6th to the 22nd.
Investing in the sector from November 19th to January 6
and then from January 23rd to May 5th, has produced an
average gain of 16.2% from 1990 to 2010, and has been
positive 76% of the time (see Thackray’s 2011 Investor’s
Guide for details).
Although holding over the entire period from Novem-
ber to May has produced strong positive results and has
been a good longer-term strategy for the average inves-
tor, shorter term traders should consider using technical
indicators to determine if they should temporarily exit the
sector for the middle weeks of January.
Small Caps
The small cap sector has a strong tendency to outperform
from December 19th to March 7th (Russell 2000 from
1979/80 to 2009/10). In this time period the Russell 2000has beaten the S&P 500 more than 2/3 of the time and has
produced on average an extra 3.5%.
The rational for the sector to perform well starting in mid-
December is that the sector often sells off in early Decem-
ber as investors tend to take small cap losses in order to
offset any gains with their large cap stocks. Investors are
generally faster to sell small companies than large ones.
This has the effect of temporarily driving the prices down
of the small caps and making them a good bargain. So far
this year, investors have not been generating tax losses
with small caps, but nevertheless small companies areoutperforming.
Small companies are outperforming large companies
for two reasons. First, investors are seeing signs that the
economy is starting to ramp up from depressed levels.
When the economy is improving off a bottom, generally
small companies outperform large companies. Second,
small company stocks have less global exposure. The
S&P 500 gets a large percentage of its earnings from
overseas operations. Investors at this time are happy to
avoid the overseas markets, mainly Europe, benefitting
small companies domiciled in the U.S.
Small caps tend to outperform until the first week in
March. The sector has just put in a new recent high and is
outperforming the S&P 500. Trends look favourable for
this sector to once again outperform until March.
8/7/2019 Thackray Market Letter 2010 December
http://slidepdf.com/reader/full/thackray-market-letter-2010-december 6/7alphaMountain Investments - alphamountain.com
— 6 —
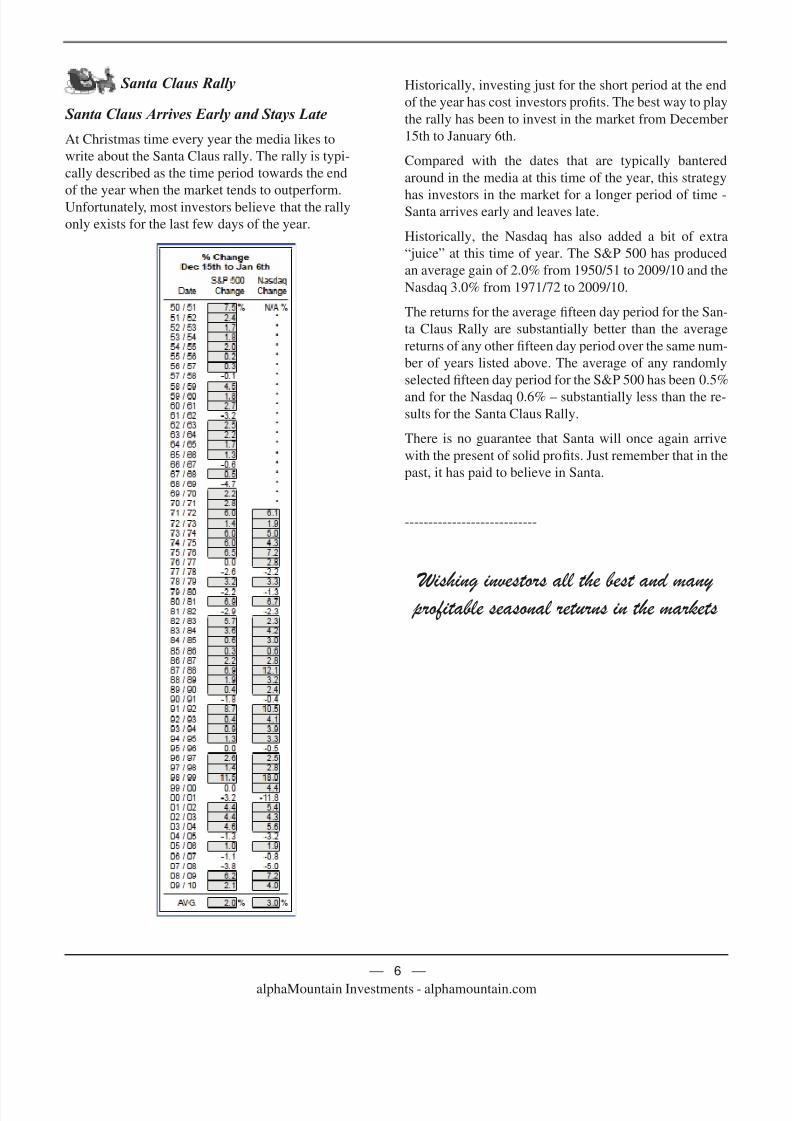
Santa Claus Rally
Santa Claus Arrives Early and Stays Late
At Christmas time every year the media likes to
write about the Santa Claus rally. The rally is typi-
cally described as the time period towards the end
of the year when the market tends to outperform.Unfortunately, most investors believe that the rally
only exists for the last few days of the year.
Historically, investing just for the short period at the end
of the year has cost investors profits. The best way to play
the rally has been to invest in the market from December
15th to January 6th.
Compared with the dates that are typically bantered
around in the media at this time of the year, this strategy
has investors in the market for a longer period of time -Santa arrives early and leaves late.
Historically, the Nasdaq has also added a bit of extra
“juice” at this time of year. The S&P 500 has produced
an average gain of 2.0% from 1950/51 to 2009/10 and the
Nasdaq 3.0% from 1971/72 to 2009/10.
The returns for the average fifteen day period for the San-
ta Claus Rally are substantially better than the average
returns of any other fifteen day period over the same num-
ber of years listed above. The average of any randomly
selected fifteen day period for the S&P 500 has been 0.5%
and for the Nasdaq 0.6% – substantially less than the re-sults for the Santa Claus Rally.
There is no guarantee that Santa will once again arrive
with the present of solid profits. Just remember that in the
past, it has paid to believe in Santa.
----------------------------
Wishing investors all the best and many profitable seasonal returns in the markets

8/7/2019 Thackray Market Letter 2010 December
http://slidepdf.com/reader/full/thackray-market-letter-2010-december 7/7alphaMountain Investments - alphamountain.com
— 7 —
Disclaimer: Brooke Thackray is a research analyst for JovInvestment Management Inc. All of the views
expressed herein are the personal views of the author and are not necessarily the views of JovInvestment
Management Inc., although any of the recommendations found herein may be reflected in positions or
transactions in the various client portfolios managed by JovInvestment Management Inc. HAC buys and
sells of securties listed in this newsletter are meant to highlight investment strategies for educational pur-poses only. The list of buys and sells does not include all the transactions undertaken by the fund.
While the writer of this newsletter has used his best efforts in preparing this publication, no warranty with
respect to the accuracy or completeness is given. The information presented is for educational purposes
and is not investment advice. Historical results do not guarantee future results
Mailing List Policy: We do not give or rent out subscriber’s email addresses.
Subscribe to the Thackray Market Letter: To subscribe send an email to [email protected]
with SUBSCRIBE in the subject line. Also state your first and last name, city and country.
Unsubscribe: If you wish to unsubscribe from the Thackray Market Letter send an email with UNSUB-
SCRIBE in the subject line to: [email protected].
Contact: For further information send an email to [email protected]