Embed Size (px)
Citation preview

THE EFFECT OF PRISON POPULATION SIZEON CRIME RATES: EVIDENCE FROM
PRISON OVERCROWDING LITIGATION*
STEVEN D. LEVITT
Simultaneity between prisoner populations and crime rates makes it difficultto isolate the causal effect of changes in prison populations on crime. To breakthat simultaneity, this paper uses prison overcrowding litigation in a state as aninstrument for changes in the prison population. The resulting elasticities are twoto three times greater than those of previous studies. A one-prisoner reduction isassociated with an increase of fifteen Index I crimes per year. While calculationsof the costs of crime are inherently uncertain, it appears that the social benefitsassociated with crime reduction equal or exceed the social costs of incarcerationfor the marginal prisoner.
The incarceration rate in the United States has more thantripled in the last two decades. At year-end 1994 the UnitedStates prison population exceeded one million. Annual govern-ment outlays on prisons are roughly $40 billion per year. The rateof imprisonment in the United States is three to four timesgreater than most European countries [Chappell 1988].
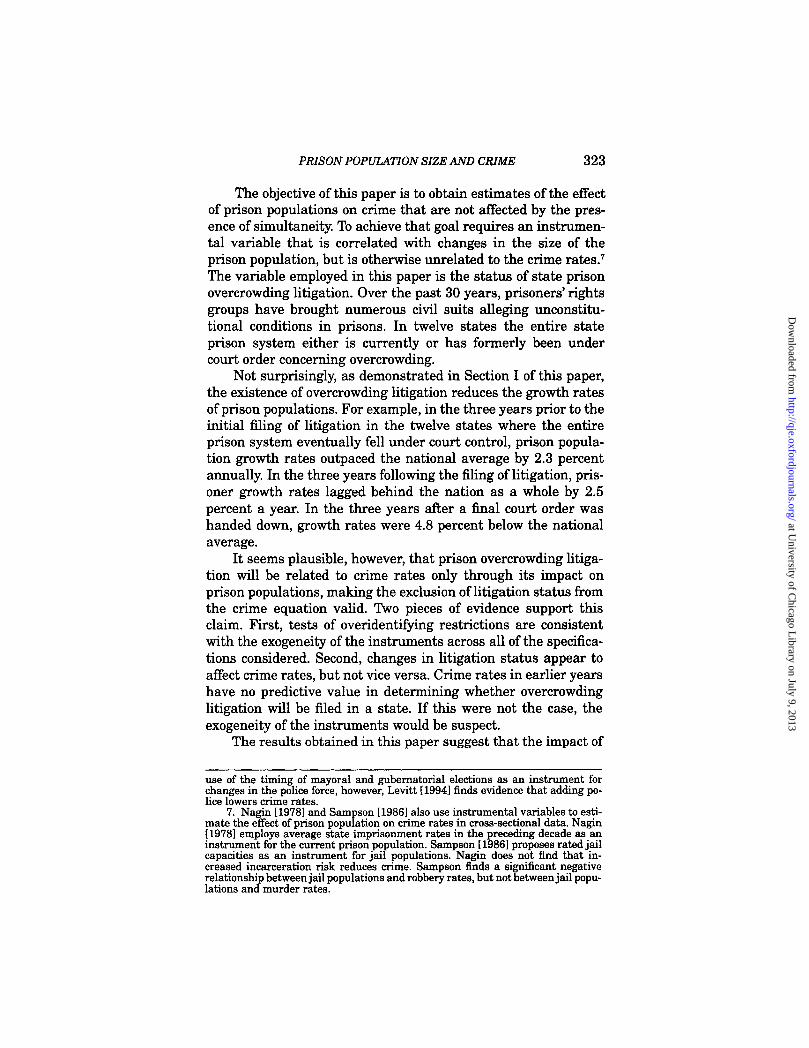
While the evidence on trends in crime rates is mixed, it doesnot appear that record levels of incarceration in the United Stateshave been accompanied by large declines in crime, as demon-strated in Figure I. Over the same period that the incarcerationrate more than tripled, violent crimes reported to the police, asmeasured by the Federal Bureau of Investigation's UniformCrime Reports, doubled on a per capita basis, while reportedproperty crimes rose 30 percent. Victimization rates from theNational Crime Survey, which reflect both crimes that are re-ported to the police and crimes that go unreported, demonstratea more favorable pattern. Violent victimizations remained flatover the period, while property crime victimizations fell by 30
*I would like to thank Joshua Angrist, John Donohue, Austan Goolsbee, Law-rence Katz, Thomas Marvell, Kevin Murphy, Anne Piehl, James Poterba, PeterSiegelman, Joel Waldfogel, two anonymous referees, and seminar participants atGeorge Washington University, Harvard University, the Massachusetts Instituteof Technology, and the National Bureau of Economic Research Public Economicsprogram, Tufts University, and the University of Chicago for helpful commentsand discussions, as well as Thomas Marvell and the American Civil LibertiesUnion National Prison Project for graciously supplying data. Financial support ofthe National Science Foundation is gratefully acknowledged. All remaining errorsare my own.
© 1996 by the President and Fellows of Harvard College and the Massachusetts Instituteof Technology.The Quarterly Journal of Economics, May 1996.
at University of C
hicago Library on July 9, 2013
http://qje.oxfordjournals.org/D
ownloaded from

320 QUARTERLY JOURNAL OF ECONOMICS
400
360
00
r)a)N- 200
xsa)12 120
' I240
280
320
1 60
80
40
074 76 78 80 82 84 86 88 90 92
Year4- Prisoners -4)- UCR Violent Crime
AI- UCR Property Crime -0- NCS Violent Crime
-0- NCS Property Crime
FIGURE IU. S. Prison Population and Crime Rates 1973-1992
Data are indexed using 1973 as a base year. All underlying variables reflectrates per capita. Prisoners indexes the number of prisoners held per capita instate prisons on December 31. UCR violent and property crimes index the percapita rate of violent and property crimes reported to the police, as compiled inthe Federal Bureau of Investigation's Uniform Crime Reports. NCS violent andproperty crimes index victimization rates are drawn from the National CrimeSurvey.
percent.' The fact that crime rates have not fallen dramaticallyin response to such large increases in imprisonment has led com-mentators to label the increasing reliance on imprisonment a pol-
1. For a discussion of the various measures of crime in the United States,see O'Brien [19851
at University of C
hicago Library on July 9, 2013
http://qje.oxfordjournals.org/D
ownloaded from

PRISON POPULATION SIZE AND CRIME 321
icy failure, recommending a moratorium on new prisonconstruction, alternative correctional programs, or decriminal-ization of drug offenses (e.g., Nagel [1977], Rogers [1989], Zim-ring and Hawkins [1991], and Selke [1993]).
Clearly, however, one cannot conclude that the increased lev-els of incarceration have been a failure simply based on suchtime-series patterns. To the extent that the underlying determi-nants of crime, such as gang involvement, the increase in single-parent families [Bane 1986], and the declining availability of le-gitimate economic opportunities for teenagers have worsenedover time [Grogger 1994; Freeman 1995], the increased use ofprisons may simply be masking what would have been a fargreater rise in criminal activity.
Increased prison populations can reduce crime through ei-ther deterrence (i.e., an increased threat of imprisonment deterspeople from engaging in criminal acts), or incapacitation (i.e.,while incarcerated criminals are unable to commit crimes). Whileit is more difficult to measure deterrence effects, data on self-reported criminal activity obtained from prisoner surveys provideestimates of incapacitation effects [Peterson and Braiker 1980;Visher 1986; Dilulio and Piehl 1991; Piehl and Dilulio 19951 Thevarious surveys of prison populations have yielded similar re-sults, the most striking feature of which is the skew of the distri-bution. In Wisconsin, for instance, the median prisoner reportsinvolvement in twelve nondrug-related crimes per year when notimprisoned; the mean self-report, in contrast, is 141 [Dilulio andPiehl 1991]. 2 Cost-benefit calculations based on prisoner self-reports suggest that the social benefits of incarcerating the me-dian and mean prisoner outweigh the social costs, but that thecost of imprisoning the bottom quartile of inmates outweighs thesocial benefits [Piehl and Dilulio 1995].
There are, however, a number of risks in using prisoner self-reports as a basis for determining public policy toward the scopeof imprisonment. First, there are the standard problems withsurvey data reliability, especially when the respondents are con-victed criminals. 3 A second problem with prisoner self-reports is
2. When drug-related crimes are also included, the median rises to 26, andthe mean becomes 1834.
3. A large literature surveyed in Spelman [1994] examines the validity ofprisoner self-reports. There is some evidence that, particularly on the extremes,infrequent offenders underreport criminal activity and frequent offenders exag-gerate their criminal involvement. Consequently, the median may be a more reli-able estimator than the mean.
at University of C
hicago Library on July 9, 2013
http://qje.oxfordjournals.org/D
ownloaded from

322 QUARTERLY JOURNAL OF ECONOMICS
that they capture only incapacitation effects of prison sentencesand therefore will systematically underestimate the benefits ofprisons if deterrence is also present.4 On the other hand, if crimesare committed in groups, or other criminals step in to replacethose incarcerated, the number of crimes prevented through in-carceration will be exaggerated. Finally, it is difficult to deter-mine where in the distribution a particular prisoner falls.Attempts to predict recidivism have generally been unsuccessful,although improved econometric techniques have led to greatersuccess [Schmidt and Witte 1989]. Without knowing the capabil-ity of parole boards for distinguishing between the risks posed bydifferent prisoners, it is impossible to make an informed choiceabout the optimal scale of imprisonment since the policy implica-tions of releasing the twenty-fifth percentile prisoner differs dra-matically from that of the median or mean prisoner.
An alternative approach to measuring the impact of impris-onment on crime rates is to estimate aggregate elasticities[Bowker 1981; Devine, Sheley, and Smith 1988; Marvell andMoody 1994]. The most relevant of these studies is Marvell andMoody, which uses state-level panel data, obtaining estimates ofthe elasticity of crime with respect to the prison population of—0.16, a figure that is consistent with other recent estimates inthe literature [Spelman 1994; Wilson 1994]. Donohue andSiegelman [1994], using these estimates, conclude that the pres-ent scale of imprisonment is approximately optimal from a socialcost-benefit perspective.
While the use of aggregate data avoids many of the difficult-ies inherent in the use of prisoner self-reports, simultaneity biasbecomes a critical concern. 5 Increased incarceration is likely toreduce the amount of crime, but there is also little question thatincreases in crime will translate into larger prison populations.For instance, if there is no change in the punishment per crime,the prison population will trend one-for-one with changes in thecrime rate. Consequently, OLS estimates of the effect of prisonson crime are likely to understate the true magnitude of the effect,perhaps dramatically.6
4. Ehrlich [1981] and Levitt [1995a] find that deterrence effects are substan-tially larger than incapacitation effects.
5. Marvell and Moody [1994] do not attempt to control for simultaneity, in-stead using the results of Granger tests to conclude that there is little evidenceof a short-term impact of crime on state prison populations.
6. This simultaneity is pervasive in empirical research on criminal topics.Estimates of the effect of police on crime, for instance, almost invariably carry anunexpected positive sign [Cameron 1988]. Breaking the simultaneity through the
at University of C
hicago Library on July 9, 2013
http://qje.oxfordjournals.org/D
ownloaded from
PRISON POPULATION SIZE AND CRIME 323
The objective of this paper is to obtain estimates of the effectof prison populations on crime that are not affected by the pres-ence of simultaneity. To achieve that goal requires an instrumen-tal variable that is correlated with changes in the size of theprison population, but is otherwise unrelated to the crime rates.?The variable employed in this paper is the status of state prisonovercrowding litigation. Over the past 30 years, prisoners' rightsgroups have brought numerous civil suits alleging unconstitu-tional conditions in prisons. In twelve states the entire stateprison system either is currently or has formerly been undercourt order concerning overcrowding.
Not surprisingly, as demonstrated in Section I of this paper,the existence of overcrowding litigation reduces the growth ratesof prison populations. For example, in the three years prior to theinitial filing of litigation in the twelve states where the entireprison system eventually fell under court control, prison popula-tion growth rates outpaced the national average by 2.3 percentannually. In the three years following the filing of litigation, pris-oner growth rates lagged behind the nation as a whole by 2.5percent a year. In the three years after a final court order washanded down, growth rates were 4.8 percent below the nationalaverage.
It seems plausible, however, that prison overcrowding litiga-tion will be related to crime rates only through its impact onprison populations, making the exclusion of litigation status fromthe crime equation valid. Two pieces of evidence support thisclaim. First, tests of overidentifying restrictions are consistentwith the exogeneity of the instruments across all of the specifica-tions considered. Second, changes in litigation status appear toaffect crime rates, but not vice versa. Crime rates in earlier yearshave no predictive value in determining whether overcrowdinglitigation will be filed in a state. If this were not the case, theexogeneity of the instruments would be suspect.
The results obtained in this paper suggest that the impact of
use of the timing of mayoral and gubernatorial elections as an instrument forchanges in the police force, however, Levitt [1994] finds evidence that adding po-lice lowers crime rates.
7. Nagin [1978] and Sampson [1986] also use instrumental variables to esti-mate the effect of prison population on crime rates in cross-sectional data. Nagin[1978] employs average state imprisonment rates in the preceding decade as aninstrument for the current prison population. Sampson [1986] proposes rated jailcapacities as an instrument for jail populations. Nagin does not find that in-creased incarceration risk reduces crime. Sampson finds a significant negativerelationship between jail populations and robbery rates, but not between jail popu-lations and murder rates.
at University of C
hicago Library on July 9, 2013
http://qje.oxfordjournals.org/D
ownloaded from

324 QUARTERLY JOURNAL OF ECONOMICS
prison populations on crime is two to three times greater thanprevious estimates would imply. Prior to instrumenting, I obtainestimates that are actually slightly smaller than those in pastresearch: elasticities of crime with respect to prisoner popula-tions of approximately —0.10. The IV estimates, in contrast, aremuch larger in magnitude. For violent crime, elasticities of —0.40are obtained. For property crime, the elasticities are —0.30. Myestimates imply that each marginal prisoner released as a resultof overcrowding litigation is associated with an increase of fifteencrimes per year, almost exactly the self-reported criminal activityof the median prisoner.
Using the estimates of the costs of crime to victims in Cohen[1988] and Miller, Cohen, and Rossman [1993], the marginal so-cial benefit in crime reduction of adding one prisoner for one yearis approximately $50,000. The marginal costs of incarceration areroughly $30,000 per prisoner per year. While cost-benefit calcula-tions of this kind are inherently speculative, it appears that thecurrent level of imprisonment is roughly efficient, although theremay be some benefit from lengthening the time served by the cur-rent prisoner population. 8
The outline of the paper is as follows. Section I provides back-ground information on prison overcrowding litigation. Section IIdescribes the data used in the analysis and establishes a negativerelationship between overcrowding litigation and the size of theprison population. A positive reduced-form correlation betweenovercrowding litigation and crime rates is also demonstrated.Section III estimates a relationship between prison populationsand crime, using the status of prison overcrowding lawsuitsas an instrument. Section IV considers various public policy im-plications of these estimates. Section V offers a brief set ofconclusions.
I. PRISON OVERCROWDING LITIGATION
Since the first filing of prison overcrowding litigation on thegrounds of cruel and unusual punishment in 1965, 9 similar law-
8. The estimates of this paper are less directly applicable to the questionof whether expanding the prison population by incarcerating criminals who arecurrently punished by probation or fines is cost-beneficial. Given the skew in thecriminal distribution, however, the benefits of incarceration at this margin arelikely to be well below that of longer sentences for the current prisoner population.
9. Finney v. Arkansas Board of Correction, 505 F.2d 194 (8th Cir. 1974). Acomplete summary of litigation can be found in Koren [1993] and other issues ofThe National Prison Project Journal.
at University of C
hicago Library on July 9, 2013
http://qje.oxfordjournals.org/D
ownloaded from
PRISON POPULATION SIZE AND CRIME 325
suits have been brought in 47 states and the District of Columbia.The success of plaintiffs in overcrowding litigation has been over-whelming: of the approximately 70 cases brought, at least partialvictory has been achieved in all but 6. As of January 1, 1993,litigation was pending in twelve states.
Stipulations of court orders on overcrowding vary substan-tially. Only on rare occasions do judges mandate the release ofprisoners to alleviate overcrowding. More frequently, populationcaps have been imposed, or "double ceiling" prohibited, with theprison system administrators and state government left with thefreedom to determine the means through which compliance willbe attained (e.g., construction of new prison facilities, fewer of-fenders sentenced to prison terms, early release programs, or re-allocation of prisoners across institutions). The court frequentlyjudges compliance to be inadequate, leading to the further stepof contempt orders, or court-appointed receivers/monitors.
In twelve states the entire prison system has been undercourt order concerning overcrowding. In the other states only aportion of the prison facilities has been affected. Whether the en-tire state prison system is under court control is likely to be criti-cal in determining the impact of such litigation on overall stateprison populations. When only some of the prisons are deemedovercrowded, the state has flexibility in shifting prisoners be-tween facilities and need not adjust the total number ofprisoners.°
The status of prison litigation in a given state at a particularpoint in time can be classified into one of six categories: (1) noovercrowding litigation filed, (2) litigation filed, but no decisionyet handed down, (3) an initial decision reached, but currentlyunder appeal, (4) a final decision reached, (5) further court actionsuch as the appointment of a monitor, and (6) release of theprison system from court supervision. A priori, one would expectcategories 2 through 5 to be associated with lower prison growthrates, at least in the short term." Even before a final decision ishanded down, prison systems will have incentives to act strategi-cally, improving prison conditions in an attempt to win more fa-vorable court opinions. The sixth category, release of the prisonsystem from court supervision, is likely to be associated with anincreased growth rate in the prison population.
Table I identifies the twelve states in which the entire prison
10. There is, however, little shifting of prisoners across state lines.11. Over a time frame in which the states are able to add prison capacity—
four to five years—the effect on prison populations is likely to be less pronounced.
at University of C
hicago Library on July 9, 2013
http://qje.oxfordjournals.org/D
ownloaded from

326 QUARTERLY JOURNAL OF ECONOMICS
TABLE I
PRISON OVERCROWDING LITIGATION STATUS 1971-1993
(STATES WITH ENTIRE PRISON SYSTEM UNDER COURT ORDER)
Prelim. Final Further ReleasedPrefiling Filed decision decision action by court
Alabama 71-73 74-75 76-77 78 79-83 84-93Alaska 71-85 86-89 — 90-93 — —Arkansas — — — 71-73 74-81 82-93Delaware 71-87 — — 88-91 92-93 —Florida 71 72-74 75-76 77-79 80-93 —Mississippi — 71-73 — 74-93 — —New Mexico 71-76 77-79 80-89 90 91-93 —Oklahoma 71 72-76 — 77-85 — 86-93Rhode Island 71-73 74-76 — 77-85 86-93 —South Carolina 71-81 82-84 85-90 91-93 — —Tennessee 71-79 80-81 — 82-84 85-93 —Texas 71-77 78-79 80-84 85-91 92-93 —
Categories of litigation status are defined as follows. Prefiling: no prison overcrowding litigation filed inthe state. Filed: litigation filed, but no court decision. Preliminary decision: a court decision has been handeddown, but is under appeal. Final decision: a court decision handed down, no further appeals. Further action:subsequent court intervention on the issue of overcrowding, including appointment of special monitors, con-tempt orders. Released by court: dismissal of case or relinquishing of court's oversight of prisons. The twelvestates included in the table reflect all states that have had their entire prison system under court orderconcerning overcrowding at some point between 1971-1993. Litigation status in a particular year based oninformation reported in the ACLU National Prison Project Journal (multiple issues) and the court opinionscited therein.
system has come under court control, along with the correspond-ing dates. There is wide variation in the timing of prison over-crowding litigation status across the different states. Final courtdecisions were handed down as early as 1971 and as late as 1991.The states falling entirely under court control are disproportion-ately, but not exclusively, Southern states. Southern states havehistorically had higher incarceration rates. In 1970, for instance,the prison population per 100,000 residents was 125 in the South,105 in the West, 86 in the North Central, and 70 in the Northeast[Zimring and Hawkins 19911 When litigation was first filed inthese twelve states, incarceration rates were on average 34 per-cent greater than the national average.
To the extent that the states where the entire prison systemis under court control differ systematically from the rest of thecountry, the use of cross-state variation is potentially misleading.A number of steps are taken to counteract that possibility. First,all of the analysis in this paper focuses on percent changes invariables, eliminating any effects of differences in levels of crimerates or imprisonment across states. Second, in some specifica-
at University of C
hicago Library on July 9, 2013
http://qje.oxfordjournals.org/D
ownloaded from
PRISON POPULATION SIZE AND CRIME 327
tions, state fixed effects are included to control for the possibilitythat not only do the levels of the variables differ systematicallyacross states, but also the growth rates. 12 Finally, the possibil-ity that the coefficients systematically differ between Southernand non-Southern states, even after these precautions, is alsoexamined.
II. CORRELATIONS BETWEEN PRISON OVERCROWDING LITIGATION,PRISON POPULATIONS, AND CRIME RATES IN THE RAW DATA
The data set used in this paper is a panel of annual, state-level observations, running from 1971-1993. 13 Throughout thepaper all incarceration and crime rates are defined on a per cap-ita basis. State prison populations are defined as the number ofprisoners serving sentences of at least one year under the juris-diction of the state prison system, and thus include inmates instate prisons, state prisoners held in local jails due to overcrowd-ing, and prisoners housed in other states due to lack of appro-priate facilities within the state borders. Prison populations arecomputed as a snapshot as of December 31. 14
Data on state crime rates are based on the number of crimesreported to the police over the course of a year, as compiled annu-ally by the Federal Bureau of Investigation in Uniform CrimeReports. While victimization data would be preferable to reportedcrimes from a theoretical standpoint, such data are unavailableat the required level of geographic disaggregation, necessitatingthe use of reported crime statistics. 15 Reported crime data areavailable for the seven Index I crime categories: murder and non-
12. Although the identification of the prison population parameter comesonly from the twelve states with litigation affecting the entire system, the re-maining states are kept in the sample to help estimate the other parameters ofthe model. When these other states are excluded, neither the coefficient nor stan-dard error on the prison population variable is affected. The standard errors onthe other variables, however, more than double.
13. State prison population estimates from before 1971 are not comparableto more recent data. In fifteen state-year pairs, prison data are either unavailableor not comparable. In addition, there are a small number of missing observationson crime rates.
14. Ideally, one would also like to include jail inmates as well as state prison-ers (the jail population is roughly half the magnitude of state prison populations).Unfortunately, state-level estimates of jail populations are updated only at five-year intervals. Omission of jail inmates would be particularly problematic ifprison overcrowding led to substantial numbers of state prisoners being held injails and consequently crowded out jail inmates. Only about 1 percent of stateprisoners, however, are typically held in local jails due to overcrowding.
15. For conflicting views on the validity of reported crime data, see O'Brien[1985] and Gove, Hughes, and Geerken [1985].
at University of C
hicago Library on July 9, 2013
http://qje.oxfordjournals.org/D
ownloaded from

328 QUARTERLY JOURNAL OF ECONOMICS
negligent homicide, forcible rape, aggravated assault, robbery,burglary, larceny, and motor vehicle theft. Precise definitions ofeach of the crime categories are provided in the appendix. Thefirst four crimes are classified as violent crimes; the latter threecrimes are denoted property crimes. The use of reported (as op-posed to actual) crime rates is a clear source of measurement er-ror. However, since crime rates are left-hand side variables in theanalysis, such measurement error will not lead to bias in the pa-rameter estimates unless the measurement error is correlatedwith the right-hand side variables. 16 The fact that the paper fo-cuses on growth rates rather than levels and even finds similarresults after taking out state fixed effects in growth rates makesit unlikely that systematic measurement error is driving theresults.
In considering the effects of prison overcrowding litigation,the analysis will focus exclusively on the twelve states in whichthe entire prison system has come under court supervision. Thesestates will be unable to comply with court orders on overcrowdingsimply by redistributing prisoners across institutions. In con-trast, states in which only a subset of institutions is affected bya court order have much greater flexibility in responding to courtmandates. Empirically, I have been unable to uncover any sys-tematic evidence that court orders affecting individual facili-ties within a state have any impact on overall state prisonpopulations.
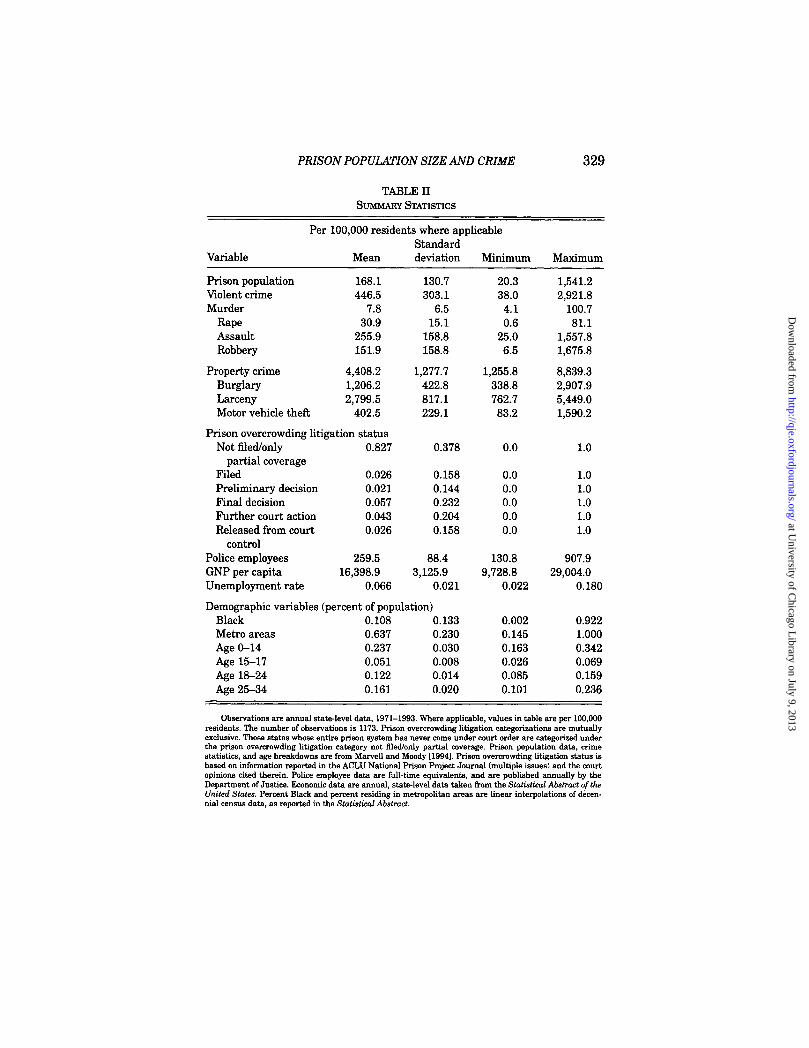
Prison litigation status is captured by a series of indicatorvariables corresponding to the six litigation categories describedin the previous section. Throughout much of the analysis onlyrecent changes in litigation status are considered since the effectson prisoner population growth rates are likely to be concentratedin the short run. Table II gives summary statistics for all 50states for the data described above, as well as for additional vari-ables (police employees, economic factors, and demographic con-trols) used in the analysis.
Table III presents state-by-state data on prison populationgrowth rates as a function of prison overcrowding litigation sta-tus for the twelve states where the entire court system falls undercourt jurisdiction. In order to control for national trends in prison
16. For instance, a correlation might be expected between the rate of crimereporting and the size of the police force. A larger police force might affect thelikelihood that a case is solved, leading victims to report a greater percentage ofcrimes. Levitt [1995b] finds only weak evidence of such a relationship.
at University of C
hicago Library on July 9, 2013
http://qje.oxfordjournals.org/D
ownloaded from
PRISON POPULATION SIZE AND CRIME 329
TABLE IISUMMARY STATISTICS
Per 100,000 residents where applicableStandard
Variable Mean deviation Minimum Maximum
Prison population 168.1 130.7 20.3 1,541.2Violent crime 446.5 303.1 38.0 2,921.8Murder 7.8 6.5 4.1 100.7
Rape 30.9 15.1 0.6 81.1Assault 255.9 158.8 25.0 1,557.8Robbery 151.9 158.8 6.5 1,675.8
Property crime 4,408.2 1,277.7 1,255.8 8,839.3Burglary 1,206.2 422.8 338.8 2,907.9Larceny 2,799.5 817.1 762.7 5,449.0Motor vehicle theft 402.5 229.1 83.2 1,590.2
Prison overcrowding litigation statusNot filed/only 0.827 0.378 0.0 1.0
partial coverageFiled 0.026 0.158 0.0 1.0Preliminary decision 0.021 0.144 0.0 1.0Final decision 0.057 0.232 0.0 1.0Further court action 0.043 0.204 0.0 1.0Released from court 0.026 0.158 0.0 1.0
controlPolice employees 259.5 88.4 130.8 907.9GNP per capita 16,398.9 3,125.9 9,728.8 29,004.0Unemployment rate 0.066 0.021 0.022 0.180
Demographic variables (percent of population)Black 0.108 0.133 0.002 0.922Metro areas 0.637 0.230 0.145 1.000Age 0-14 0.237 0.030 0.163 0.342Age 15-17 0.051 0.008 0.026 0.069Age 18-24 0.122 0.014 0.085 0.159Age 25-34 0.161 0.020 0.101 0.236
Observations are annual state-level data, 1971-1993. Where applicable, values in table are per 100,000residents. The number of observations is 1173. Prison overcrowding litigation categorizations are mutuallyexclusive. Those states whose entire prison system has never come under court order are categorized underthe prison overcrowding litigation category not filed/only partial coverage. Prison population data, crimestatistics, and age breakdowns are from Marvell and Moody [1994]. Prison overcrowding litigation status isbased on information reported in the ACLU National Prison Project Journal (multiple issues) and the courtopinions cited therein. Police employee data are full-time equivalents, and are published annually by theDepartment of Justice. Economic data are annual, state-level data taken from the Statistical Abstract of theUnited States. Percent Black and percent residing in metropolitan areas are linear interpolations of decen-nial census data, as reported in the Statistical Abstract.
at University of C
hicago Library on July 9, 2013
http://qje.oxfordjournals.org/D
ownloaded from
330 QUARTERLY JOURNAL OF ECONOMICS
TABLE III
EFFECT OF PRISON OVERCROWDING LITIGATION ON PRISON POPULATIONS
(ANNUAL DEVIATION FROM NATIONAL AVERAGE)
Prison overcrowding litigation statusPrelim. Final Further Released
Prefiling Filed decision decision action by court
Alabama -2.1% -1.1% 7.0% -14.5% 3.2% -0.3%Alaska 5.1 -2.1 - 1.5 - -Arkansas - - - -0.7 0.1 0.4Delaware 8.6 - - -5.2 0.2 -Florida - -1.3 10.4 -4.4 -2.2 -Mississippi - -3.9 - 1.3 - -New Mexico 5.4 -1.0 -1.4 -8.8 -3.5 -Oklahoma - -6.5 - 0.7 - 3.4Rhode Island 3.4 -1.4 - 0.7 0.9 -South Carolina 2.3 -3.3 .1.3 -2.7 - -Tennessee 1.7 -0.2 - -4.1 -2.9 -Texas -1.5 1.0 -4.0 -2.9 9.0 -
Average across alltwelve states 4.2 -2.4 0.3 -0.8 -0.5 0.8
Values in the table reflect the average annual deviation in a state's growth rate in per capita prisonpopulation from the national average. Data cover the period 1971-1993 (implying observations on growthrates for the years 1972-1993). The average across the states reported in the bottom row of the table reflectsthe fact that different states satisfy the various litigations categories for different numbers of years, andthus is not a simple average of the table entries. For definitions of litigation status categories and the yearsthat each state falls under that category, see Table I. The twelve states included in the table reflect all statesthat have had their entire prison system under court order concerning overcrowding at some point between1971-1993. Prison populations are computed at the end of each year. Litigation status in a particular yearis based on information reported in the ACLU National Prison Project Journal (multiple issues) and thecourt opinions cited therein.
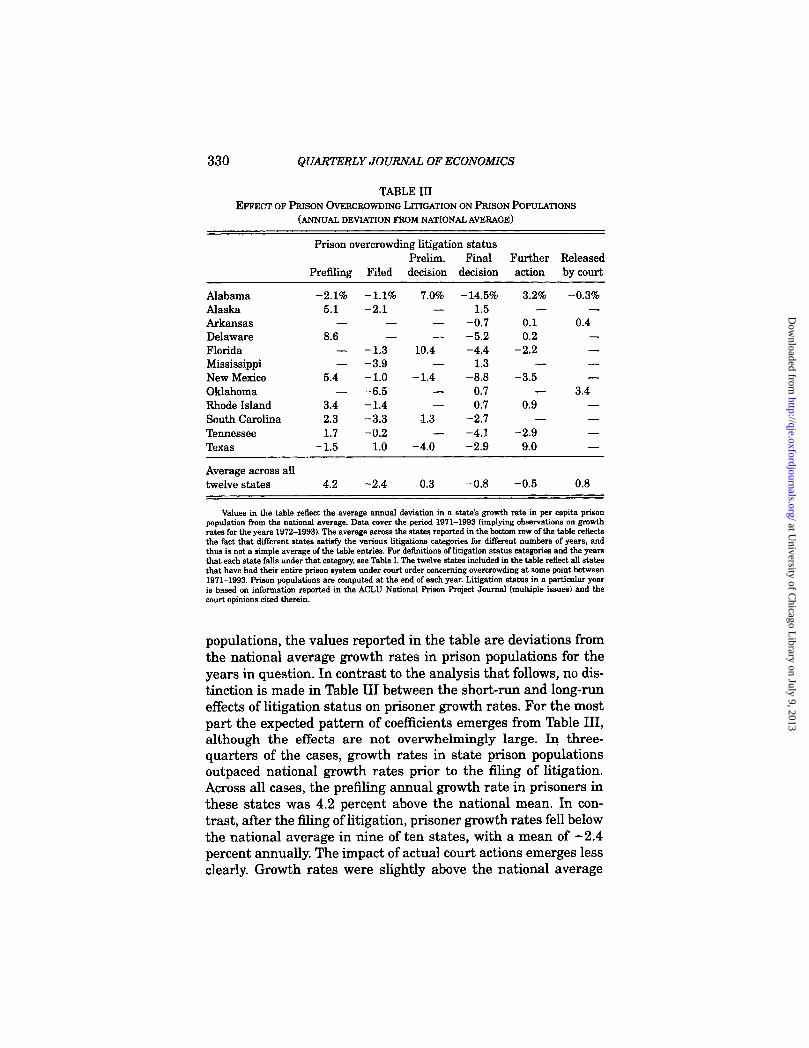
populations, the values reported in the table are deviations fromthe national average growth rates in prison populations for theyears in question. In contrast to the analysis that follows, no dis-tinction is made in Table III between the short-run and long-runeffects of litigation status on prisoner growth rates. For the mostpart the expected pattern of coefficients emerges from Table III,although the effects are not overwhelmingly large. In three-quarters of the cases, growth rates in state prison populationsoutpaced national growth rates prior to the filing of litigation.Across all cases, the prefiling annual growth rate in prisoners inthese states was 4.2 percent above the national mean. In con-trast, after the filing of litigation, prisoner growth rates fell belowthe national average in nine of ten states, with a mean of -2.4percent annually. The impact of actual court actions emerges lessclearly. Growth rates were slightly above the national average
at University of C
hicago Library on July 9, 2013
http://qje.oxfordjournals.org/D
ownloaded from
PRISON POPULATION SIZE AND CRIME 331
after preliminary court decisions were handed down, but wereslightly below the nation as a whole after final decisions werereached and after further court actions were taken. As expected,prisoner populations grow more quickly after the courts releasecontrol, although only three states fall into that category. Of the46 state-by-state values listed in the table, 30 carry the expectedsign. Assuming independence across those observations, that pat-tern of observations would be expected to occur by chance lessthan 3 percent of the time.
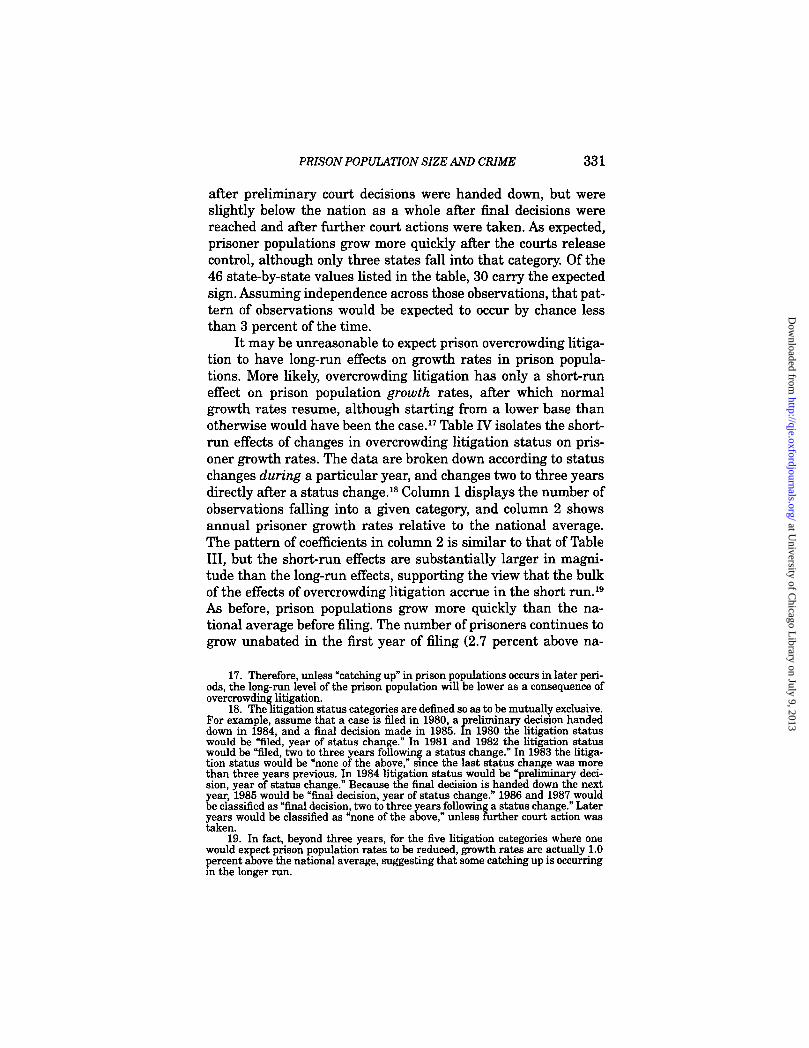
It may be unreasonable to expect prison overcrowding litiga-tion to have long-run effects on growth rates in prison popula-tions. More likely, overcrowding litigation has only a short-runeffect on prison population growth rates, after which normalgrowth rates resume, although starting from a lower base thanotherwise would have been the case.'? Table IV isolates the short-run effects of changes in overcrowding litigation status on pris-oner growth rates. The data are broken down according to statuschanges during a particular year, and changes two to three yearsdirectly after a status change. 18 Column 1 displays the number ofobservations falling into a given category, and column 2 showsannual prisoner growth rates relative to the national average.The pattern of coefficients in column 2 is similar to that of TableIII, but the short-run effects are substantially larger in magni-tude than the long-run effects, supporting the view that the bulkof the effects of overcrowding litigation accrue in the short run.' 9
As before, prison populations grow more quickly than the na-tional average before filing. The number of prisoners continues togrow unabated in the first year of filing (2.7 percent above na-
17. Therefore, unless "catching up" in prison populations occurs in later peri-ods, the long-run level of the prison population will be lower as a consequence ofovercrowding litigation.
18. The litigation status categories are defined so as to be mutually exclusive.For example, assume that a case is filed in 1980, a preliminary decision handeddown in 1984, and a final decision made in 1985. In 1980 the litigation statuswould be "filed, year of status change." In 1981 and 1982 the litigation statuswould be "filed, two to three years following a status change." In 1983 the litiga-tion status would be "none of the above," since the last status change was morethan three years previous. In 1984 litigation status would be "preliminary deci-sion, year of status change." Because the final decision is handed down the nextyear, 1985 would be "final decision, year of status change." 1986 and 1987 wouldbe classified as "final decision, two to three years following a status change." Lateryears would be classified as "none of the above," unless further court action wastaken.
19. In fact, beyond three years, for the five litigation categories where onewould expect prison population rates to be reduced, growth rates are actually 1.0percent above the national average, suggesting that some catching up is occurringin the longer run.
at University of C
hicago Library on July 9, 2013
http://qje.oxfordjournals.org/D
ownloaded from
332 QUARTERLY JOURNAL OF ECONOMICS
TABLE IVSHORT-RUN RESPONSE OF PRISON POPULATIONS AND CRIME TO CHANGES IN PRISON
OVERCROWDING LITIGATION STATUS
(PERCENT ANNUAL DEVIATION FROM NATIONAL AVERAGE GROWTH RATE)
Litigation Number of Prison Violent Propertystatus observations population crime crime
Prefiling 22 2.3 -0.4 -0.4
Year of status changeFiling 9 2.7 -4.4 -2.5Preliminary decision 5 -0.5 1.8 4.4Final decision 11 -5.1 3.6 0.5Further court action 9 -3.2 4.2 0.9Released from court control 3 5.2 -0.5 -1.6
Two or three yearsfollowing status change
Filing 17 -5.1 0.1 0.5Preliminary decision 8 -0.2 2.7 4.1Final decision 18 -4.6 3.3 2.5Further court action 17 1.3 -1.6 -0.9Released from court control 6 -0.6 6.4 1.3
Data cover the period 1971-1993 (implying observations on growth rates for the years 1972-1993).Based on data from the twelve states with their entire prison system under court order. Litigation statuscategories are mutually exclusive; i.e., a second status change within three years overrides the previousstatus change. Prisoner populations are computed at the end of the year, and crime rates correspond to thefollowing year. Figures in the table are computed using only data within three years of a change in litigationstatus. Litigation status in a particular year is based on information reported in the ACLU National PrisonProject Journal (multiple issues) and the court opinions cited therein. Not all states fall into all litigationstatus categories.
tional average), but then drops sharply in the two years followinginitial filing (5.1 percent below the national average). Prelimi-nary court decisions appear to have little effect, either initially orwith a lag. Final court decisions, however, have a substantial ef-fect, both initially (-5.1 percent) and in the following two years(-4.6 percent). In the three years after a final court order affect-ing the entire prison system, therefore, prisoner populationgrowth is almost 15 percent below the rest of the nation. Sinceincarceration rates grew at approximately 6 percent per year onaverage during the sample period, this implies that prison popu-lations are almost flat after final decisions. Further court actionshave an initial limiting effect on prison populations, but thatchange is largely undone in the two years that follow. Releasefrom court supervision leads to an immediate jump in prisoners,but no lagged effect.
at University of C
hicago Library on July 9, 2013
http://qje.oxfordjournals.org/D
ownloaded from

PRISON POPULATION SIZE AND CRIME 333
If changes in overcrowding litigation status are truly exoge-nous shifters of the prison population, then a comparison of thepatterns of prisoner population growth and changes in the crimerate under the different litigation categories should provide arough measure of the effects of prison populations on crime. Col-umns 3 and 4 of Table IV report changes in violent and propertycrime rates relative to the nation as a whole. 2° If decreases in theprison population have a large impact on crime rates, then onewould expect the sign of the values in columns 3 and 4 to be theopposite of those in column 2. That pattern of opposite signs holdstrue in all eleven categories for both violent and property crimes,a fact that is somewhat remarkable given the small number ofobservations used in constructing Table IV. 2' This result, whilemerely suggestive, foreshadows the large elasticities that will beobtained when litigation status is used as an instrument.
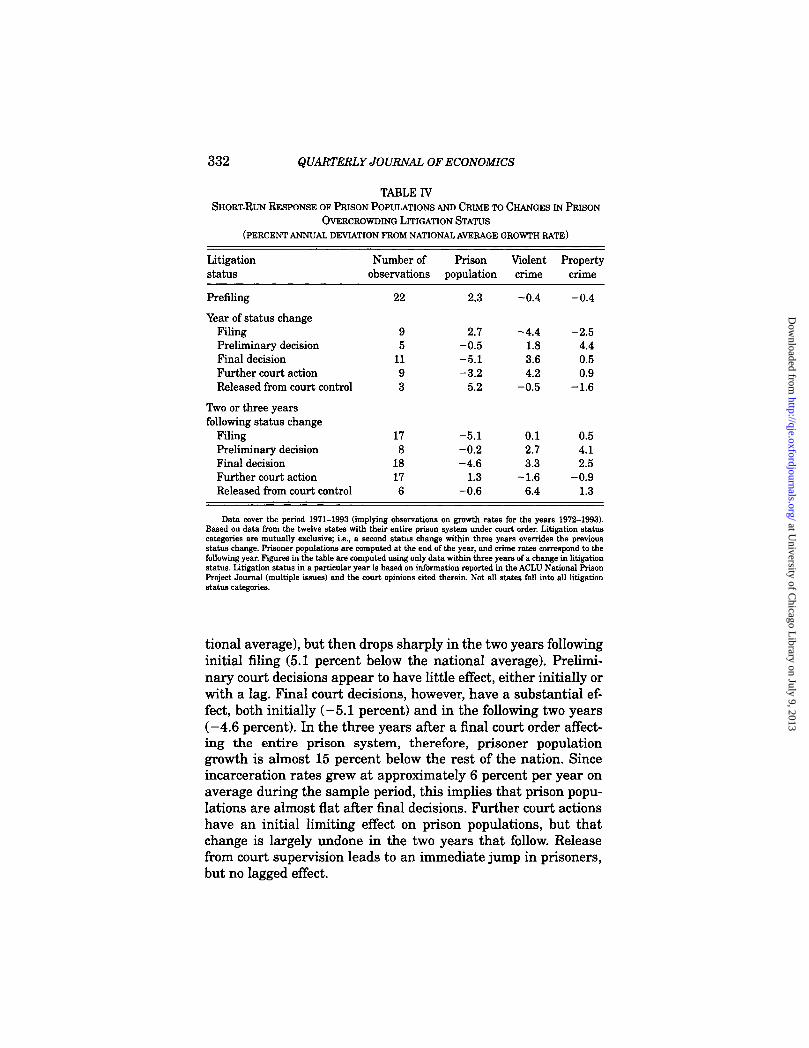
Table V reproduces the analysis of Table IV, adding a widerange of covariates including year dummies, economic factors,percent changes in police staffing, and changes in demographicfactors such as racial composition and the age distribution, andyear dummies. 22 The omitted litigation status categories are morethan three years prior to filing or more than three years since astatus change, so all coefficients are relative to those categories.All regressions in Table V are estimated using ordinary leastsquares, with White-heteroskedasticity consistent standard er-rors in parentheses. Even-numbered columns also include state-fixed effects, which allow for growth rates of the key variables to
20. Both the prison population data and litigation status reflect a snapshotas of December 31 of the year in question. Therefore, the once lagged values areused in explaining changes in crime rates. For instance, if a final court decisionis handed down in July 1990, the percent change in the crime rate is computedas ln(crime1991)—In(crimei990). To the extent that some of the increase in crime maycome in the second half of 1990, this measure may understate the true change inthe crime rate.
21. In contrast, this negative relationship between prisoner growth rates andchanges in crime rates does not emerge in the sample more generally. Of theapproximately 1000 state-year observations, in 51.1 percent (54.4 percent) of thecases are the signs on changes in prisoners and violent (property) crime ratesopposite. The contrast between those numbers and the results in Table IV suggestboth that endogeneity is a problem in the data and that prison litigation status isbreaking the endogeneity.
22. Data on age distributions within a state are from Marvell and Moody[1994]. Data on police employees are the total number of public police FTEs (in-cluding both municipal police and state troopers) in a state, published annuallyby the Department of Justice. All other variables are available in the StatisticalAbstract of the United States. Income and unemployment data vary annually. Incontrast, both the percent of a state's population who is Black and who resides ina metropolitan area are linearly interpolated from figures reported in the decen-nial censuses.
at University of C
hicago Library on July 9, 2013
http://qje.oxfordjournals.org/D
ownloaded from
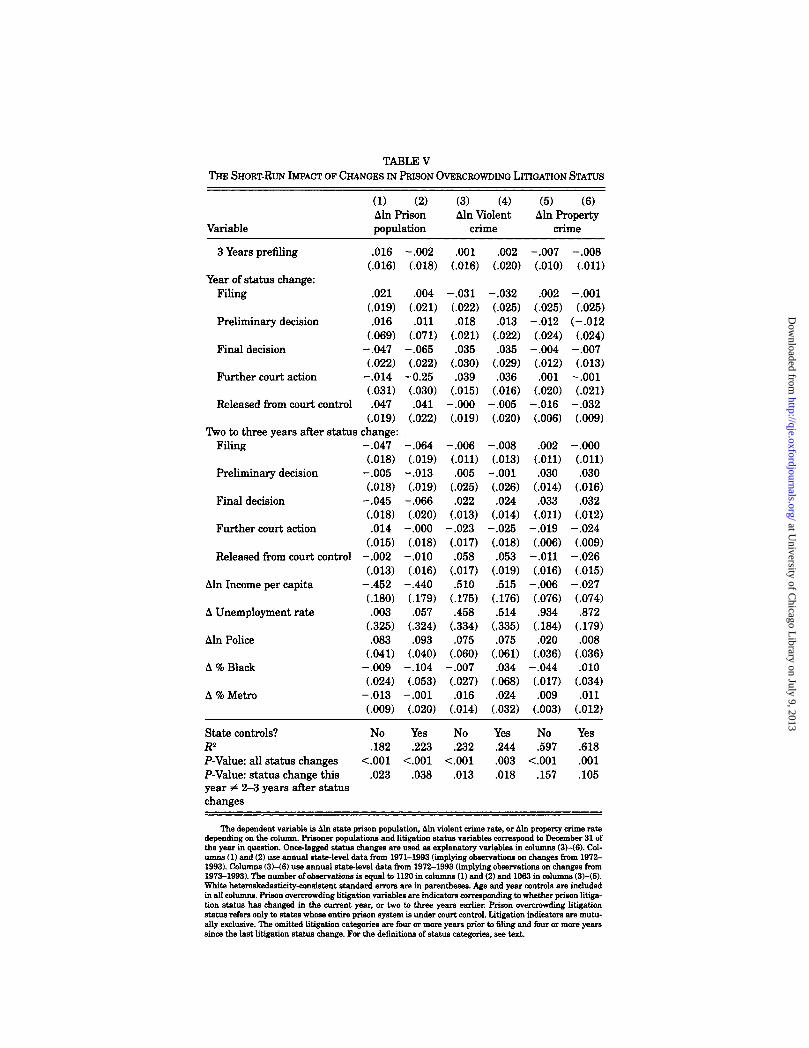
TABLE VTHE SHORT-RUN IMPACT OF CHANGES IN PRISON OVERCROWDING LITIGATION STATUS
(1) (2) (3) (4) (5) (6)Aln Prison Aln Violent Aln Property
Variable population crime crime
3 Years prefiling .016 -.002 .001 .002 -.007 -.008(.016) (.018) (.016) (.020) (.010) (.011)
Year of status change:Filing .021 .004 -.031 -.032 .002 -.001
(.019) (.021) (.022) (.025) (.025) (.025)Preliminary decision .016 .011 .018 .013 -.012 (-.012
(.069) (.071) (.021) (.022) (.024) (.024)Final decision -.047 -.065 .035 .035 -.004 -.007
(.022) (.022) (.030) (.029) (.012) (.013)Further court action -.014 -0.25 .039 .036 .001 -.001
(.031) (.030) (.015) (.016) (.020) (.021)Released from court control .047 .041 -.000 -.005 -.016 -.032
(.019) (.022) (.019) (.020) (.006) (.009)Two to three years after status change:
Filing -.047 -.064 -.006 -.008 .002 -.000
(.018) (.019) (.011) (.013) (.011) (.011)Preliminary decision -.005 -.013 .005 -.001 .030 .030
(.018) (.019) (.025) (.026) (.014) (.016)Final decision -.045 -.066 .022 .024 .033 .032
(.018) (.020) (.013) (.014) (.011) (.012)Further court action .014 -.000 -.023 -.025 -.019 -.024
(.015) (.018) (.017) (.018) (.006) (.009)
Released from court control -.002 -.010 .058 .053 -.011 -.026
(.013) (.016) (.017) (.019) (.016) (.015)Aln Income per capita -.452 -.440 .510 .515 -.006 -.027
(.180) (.179) (.175) (.176) (.076) (.074)A Unemployment rate .003 .057 .458 .514 .934 .872
(.325) (.324) (.334) (,335) (.184) (.179)Mn Police .083 .093 .075 .075 .020 .008
(.041) (.040) (.060) (.061) (.036) (.036)A % Black -.009 -.104 -.007 .034 -.044 .010
(.024) (.053) (.027) (.068) (.017) (.034)A % Metro -.013 -.001 .016 .024 .009 .011
(.009) (.020) (.014) (.032) (.003) (.012)
State controls? No Yes No Yes No YesR2.182 .223 .232 .244 .597 .618P-Value: all status changes <.001 <.001 <.001 .003 <.001 .001P-Value: status change this .023 .038 .013 .018 .157 .105year 0 2-3 years after statuschanges
The dependent variable is tan state prison population, Mn violent crime rate, or Mn property crime ratedepending on the column. Prisoner populations and litigation status variables correspond to December 31 ofthe year in question. Once-lagged status changes are used as explanatory variables in columns (3)-(6). Col-umns (1) and (2) use annual state-level data from 1971-1993 (implying observations on changes from 1972-1993). Columns (3)-(6) use annual state-level data from 1972-1993 (implying observations on changes from1973-1993). The number of observations is equal to 1120 in columns (1) and (2) and 1063 in columns (3)-(6).White heteroskedasticity-consistent standard errors are in parentheses. Age and year controls are includedin all columns. Prison overcrowding litigation variables are indicators corresponding to whether prison litiga-tion status has changed in the current year, or two to three years earlier. Prison overcrowding litigationstatus refers only to states whose entire prison system is under court control. Litigation indicators are mutu-ally exclusive. The omitted litigation categories are four or more years prior to filing and four or more yearssince the last litigation status change. For the definitions of status categories, see text.
at University of C
hicago Library on July 9, 2013
http://qje.oxfordjournals.org/D
ownloaded from
PRISON POPULATION SIZE AND CRIME 335
systematically differ across states. There are some scenarios inwhich inclusion of state-fixed effects is appropriate, even thoughthe dependent variable is already in terms of percent changes.For instance, if all states are converging to similar incarcerationrates in the long run, but Southern states had higher rates at thebeginning of the sample, then one might expect slower growthrates in prisoners in Southern states in the sample.
Similar patterns continue to emerge after adding covariates.In columns (1) and (2) only one coefficient changes sign from Ta-ble IV. The largest impacts on prison populations continue to beassociated with final court decisions and (with a one-year lag)initial filing. Slightly less than half of the status change indica-tors are individually statistically significant from zero. More im-portantly, however, the status change indicators are jointlysignificant at the .001 level. The null hypothesis of equal effectsof status changes in the current year and the two following yearsis rejected at the .05 level in both columns (1) and (2), suggestingthat classifying the observations in this manner is a useful char-acterization of the data. 23
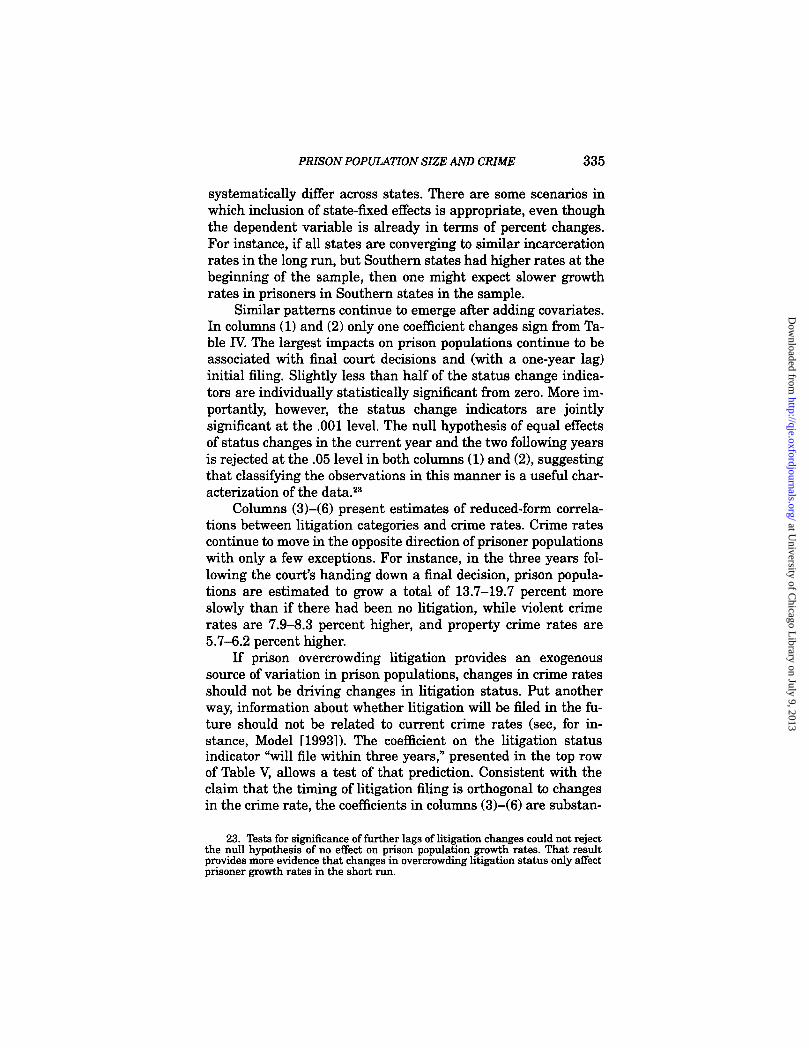
Columns (3)—(6) present estimates of reduced-form correla-tions between litigation categories and crime rates. Crime ratescontinue to move in the opposite direction of prisoner populationswith only a few exceptions. For instance, in the three years fol-lowing the court's handing down a final decision, prison popula-tions are estimated to grow a total of 13.7-19.7 percent moreslowly than if there had been no litigation, while violent crimerates are 7.9-8.3 percent higher, and property crime rates are5.7-6.2 percent higher.
If prison overcrowding litigation provides an exogenoussource of variation in prison populations, changes in crime ratesshould not be driving changes in litigation status. Put anotherway, information about whether litigation will be filed in the fu-ture should not be related to current crime rates (see, for in-stance, Model [1993]). The coefficient on the litigation statusindicator "will file within three years," presented in the top rowof Table V, allows a test of that prediction. Consistent with theclaim that the timing of litigation filing is orthogonal to changesin the crime rate, the coefficients in columns (3)—(6) are substan-
23. Tests for significance of further lags of litigation changes could not rejectthe null hypothesis of no effect on prison population growth rates. That resultprovides more evidence that changes in overcrowding litigation status only affectprisoner growth rates in the short run.
at University of C
hicago Library on July 9, 2013
http://qje.oxfordjournals.org/D
ownloaded from
336 QUARTERLY JOURNAL OF ECONOMICS
tively small, statistically insignificant, and flip signs between vio-lent and property crimes. 24
III. ESTIMATES OF THE ELASTICITY OF CRIME WITH RESPECT TOPRISONER POPULATIONS
Having demonstrated in the previous section a relationshipbetween prison overcrowding litigation and prison populationgrowth rates, as well as a reduced-form relationship betweensuch litigation and changes in crime rates, this section appliesinstrumental variables techniques to estimate elasticities ofcrime with respect to prisoner populations.
It is assumed that percent changes in crime rates and prisonpopulations are determined according to
Aln(CRIME st ) = pAln(PRISONst_ i ) + rstO . t ± est
where the subscript s corresponds to states, t indexes years, and/ denotes the various prison litigation categories. CRIME S, andPRISONS,_ are the relevant per capita crime and incarcerationrates. Because data on prison populations are snapshots as of De-cember 31, the once-lagged value is used in explaining crimerates, which correspond to calendar years. Xst is a vector of covari-ates, and 'y t is a vector of year dummies. In some cases, state-fixedeffects are also included. Because both crime rates and prisonerpopulations are in terms of log changes, p is an elasticity. It islikely that the number of prisoners is positively correlated withthe residuals of the crime equation, potentially inducing a posi-tive bias in estimates of p. If the exclusion of prison litigationstatus from the crime equation is valid, however, two-stage leastsquares estimation using the litigation status as instruments willlead to consistent estimates. 25
24. While not directly testable, it is also possible that the timing of laterchanges in litigation status, e.g., the handing down of a final decision, are endoge-nously related to changes in crime rates. To the extent that endogeneity exists,serial correlation in changes in crime rates will exacerbate the problem. A largejump in crime may trigger a judge to hand down a final decision. Crime rates willcontinue to be high in the ensuing years due to a serial correlation, inducing aspurious relationship between litigation status changes and crime rates. Thereis, however, little serial correlation in changes in crime rates. Once the nationaltrend is removed, the serial correlation in state-level changes in violent (property)crime is .033 (.039).
25. One argument against the validity of overcrowding litigation as an in-strument is that such litigation may be correlated with overall prison conditions.To the extent that more pleasant prison conditions reduce the deterrent effect of
at University of C
hicago Library on July 9, 2013
http://qje.oxfordjournals.org/D
ownloaded from
PRISON POPULATION SIZE AND CRIME 337
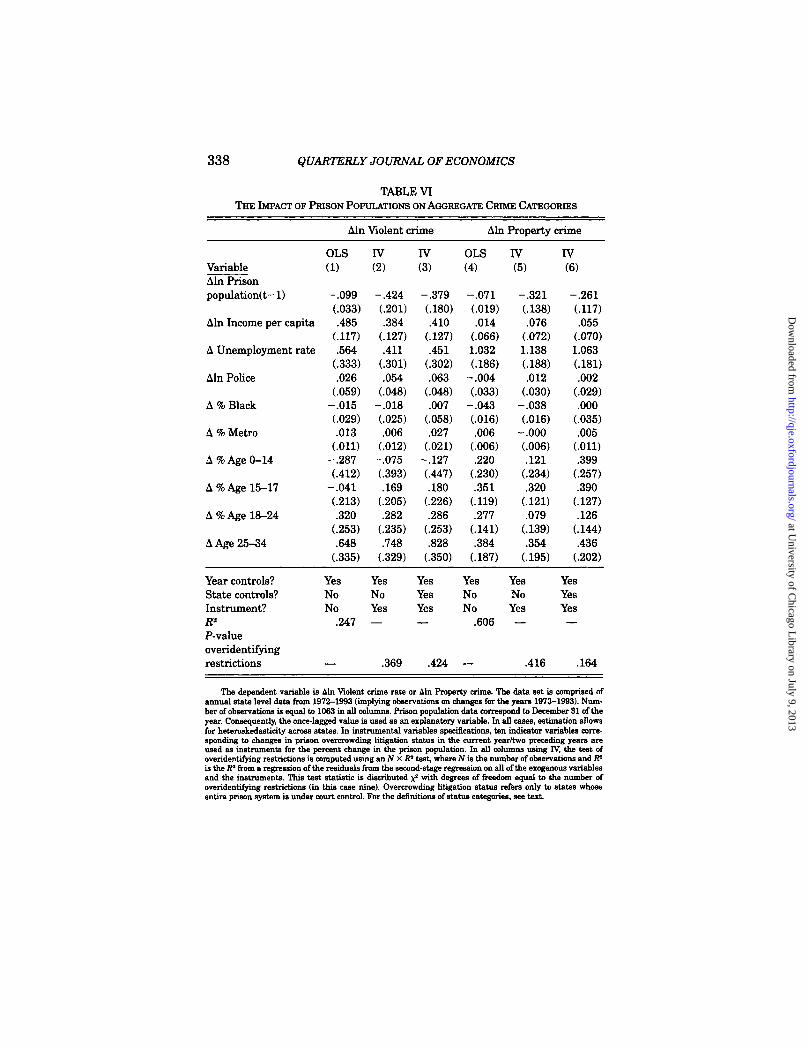
Table VI presents estimates of the crime equation separatelyfor violent crimes and property crimes using the same data setand covariates described in the preceding section. In columns 1and 4, OLS coefficients, which do not control for the endogeneityof prison populations, are presented. In the other columns indica-tor variables corresponding to litigation status changes are usedas instruments for A ln(PRISON). For each of the five litigationcategories, separate indicators are employed for the year of a sta-tus change, and the two years following a status change, yieldinga total of ten instruments. 26 Columns (3) and (6) also includestate-fixed effects. Feasible generalized least squares is employedin the IV regressions to allow for heteroskedasticity across states.
When prison populations are treated as exogenous in col-umns (1) and (4), the estimated elasticity of crime with respect toprisoners is —0.099 for violent crime and —0.071 for propertycrime. In both cases, the estimates are quite precise. These elas-ticities are roughly consistent with, but somewhat smaller than,previous estimates in the literature, which have typically been inthe neighborhood of —0.10 to —0.20 [Marvell and Moody 1994;Spelman 1994].
Instrumenting for the prison population has a pronouncedeffect on the estimated elasticities. The estimated elasticities forviolent crime in columns (2) and (3) are —0.424 and —0.379, re-spectively, four times greater than without instrumenting. Whilethe estimates are much less precise due to instrumenting, theyare nonetheless statistically different from zero. The increases forproperty crimes (columns (5) and (6)) are also substantial. Instru-menting leads to estimates of —0.321 and —0.261, again almostfour times higher than the uninstrumented case. The standarderrors once again increase, but the estimates are precise enoughto attain statistical significance at the .05 level. Prisoners percapita increased by 272 percent in the United States between.1971 and 1993. Assuming that the instrumented elasticities ob-
incarceration, overcrowding cases may increase crime rates through channelsother than the number of prisoners. If this scenario is true, it is likely that the IVestimates will overstate the impact of changes in size of prison populations.
26. The results presented below have also been replicated not differentiatingbetween the year of a status change and the following two years with very similarpoint estimates, but larger standard errors. I opt for the larger set of instrumentsboth because an F-test of equal effects in the year of a status change and thefollowing two years is rejected in the first stage (see Table V), and because thelikely consequence of choosing a set of instruments that is too large is to induce abias in the direction of OLS, which does not appear to arise moving from five toten instruments.
at University of C
hicago Library on July 9, 2013
http://qje.oxfordjournals.org/D
ownloaded from
338 QUARTERLY JOURNAL OF ECONOMICS
TABLE VI
THE IMPACT OF PRISON POPULATIONS ON AGGREGATE CRIME CATEGORIES
Aln Violent crime Aln Property crime
OLS IV IV OLS IV IVVariable (1) (2) (3) (4) (5) (6)Aln Prisonpopulation(t-1) -.099 -.424 -.379 -.071 -.321 -.261
(.033) (.201) (.180) (.019) (.138) (.117)Aln Income per capita .485 .384 .410 .014 .076 .055
(.117) (.127) (.127) (.066) (.072) (.070)A Unemployment rate .564 .411 .451 1.032 1.138 1.063
(.333) (.301) (.302) (.186) (.188) (.181)Aln Police .026 .054 .063 -.004 .012 .002
(.059) (.048) (.048) (.033) (.030) (.029)A % Black -.015 -.018 .007 -.043 -.038 .000
(.029) (.025) (.058) (.016) (.016) (.035)A % Metro .013 .006 .027 .006 -.000 .005
(.011) (.012) (.021) (.006) (.006) (.011)A % Age 0-14 -.287 -.075 -.127 .220 .121 .399
(.412) (.393) (.447) (.230) (.234) (.257)A % Age 15-17 -.041 .169 .180 .351 .320 .390
(.213) (.205) (.226) (.119) (.121) (.127)A % Age 18-24 .320 .282 .286 .277 .079 .126
(.253) (.235) (.253) (.141) (.139) (.144)A Age 25-34 .648 .748 .828 .384 .354 .436
(.335) (.329) (.350) (.187) (.195) (.202)
Year controls? Yes Yes Yes Yes Yes YesState controls? No No Yes No No YesInstrument? No Yes Yes No Yes YesR2 .247 - - .606 - -P-valueoveridentifyingrestrictions - .369 .424 - .416 .164
The dependent variable is Ain Violent crime rate or Alm Property crime. The data set is comprised ofannual state level data from 1972-1993 (implying observations on changes for the years 1973-1993). Num-ber of observations is equal to 1063 in all columns. Prison population data correspond to December 31 of theyear. Consequently, the once-lagged value is used as an explanatory variable. In all cases, estimation allowsfor heteroskedasticity across states. In instrumental variables specifications, ten indicator variables corre-sponding to changes in prison overcrowding litigation status in the current year/two preceding years areused as instruments for the percent change in the prison population. In all columns using IV, the test ofoveridentifying restrictions is computed using an N x R2 test, where N is the number of observations and R2
is the R2 from a regression of the residuals from the second-stage regression on all of the exogenous variablesand the instruments. This test statistic is distributed x 2 with degrees of freedom equal to the number ofoveridentifying restrictions (in this case nine). Overcrowding litigation status refers only to states whoseentire prison system is under court control. For the definitions of status categories, see text.
at University of C
hicago Library on July 9, 2013
http://qje.oxfordjournals.org/D
ownloaded from
PRISON POPULATION SIZE AND CRIME 339
tained here are generalizable to the nation as a whole, violentcrime would be approximately 70 percent higher today if the in-crease in prisoners had not occurred, and property crime wouldbe almost 50 percent more frequent.
The other parameters of the model, while also of interest,generally yield mixed and imprecise coefficients. Increases in percapita income are positively correlated with violent crime, but arenot strongly related to property crime. The reverse holds truewith changes in the unemployment rate. Each one-point changein state unemployment rates leads to an increase of slightly lessthan 0.5 percent in violent crime and a 1 percent increase in theproperty crime rate.
Changes in the number of police are weakly positively corre-lated with changes in the crime rate, a finding that is common instudies such as these (see Cameron [1988] for a survey). The mostlikely explanation for that result is endogeneity of police hiring:when crime worsens, the public policy response is to hire morepolice.27 The percent of the population that is Black and the per-cent residing in metropolitan areas are generally statistically in-significant and switch signs across specifications. In all cases, anincrease in the fraction of the population between the ages 15 and34 is related to higher crime rates. Somewhat surprisingly, thegreatest impact comes from the 25-34 age range. The age coeffi-cients are imprecisely estimated, however, making it difficult todraw strong conclusions.
Given the dramatic change in the estimated effects of incar-ceration in the instrumented regressions, and the fact that theseestimates are two to three times greater than conventional wis-dom on the subject would predict, special scrutiny of the resultsis warranted. In the following paragraphs three separate issues
27. Following Levitt [1994], an attempt was made to instrument for changesin the police force using the timing of state elections. Levitt [1994] finds thatpolice hiring in the nation's largest cities is disproportionately concentrated inmayoral and gubernatorial election years, and exploits that fact to estimate theeffect of police on crime. Electoral cycles in police hiring, however, are much lesspronounced outside of large cities, possibly because crime is a less critical politicalissue. Consequently, the first-stage correlations between overall state police andgubernatorial elections, while positive, is weak. Instrumenting for police with gu-bernatorial elections had little impact on the estimated effects of prison popula-tion on crime. The elasticity of violent crime with respect to the prison populationis —0.37 (SE = 0.17), and for property crimes the elasticity is —0.22 (SE = 0.10).The coefficient on % in police becomes negative in the violent crime equation (anelasticity of —0.44 (SE = 0.36), but remained positive, 0.09 (SE = 0.18) in theproperty crime equation. Eliminating the police variable from the equation en-tirely has little effect on the prisoner coefficients.
at University of C
hicago Library on July 9, 2013
http://qje.oxfordjournals.org/D
ownloaded from
340 QUARTERLY JOURNAL OF ECONOMICS
are considered: the validity of the instruments, the robustness ofthe results, and the generalizability of the findings.
Because the number of instruments exceeds the number ofendogenous variables, it is possible to test the overidentifying re-strictions on the excluded instruments. The test statistic is calcu-lated as N x R2 , where Nis the number of observations and R2 isthe R2 from a regression of the residuals of the crime equation onall of the exogenous variables, including the instruments. Thetest statistic is distributed x2 with degrees of freedom equal tothe number of overidentifying restrictions, in this case nine. TheP-values for this test are presented in the bottom row of Table W.In all cases, the test statistic is well within conventional bounds,supporting the claim of exogeneity of the instruments. 28
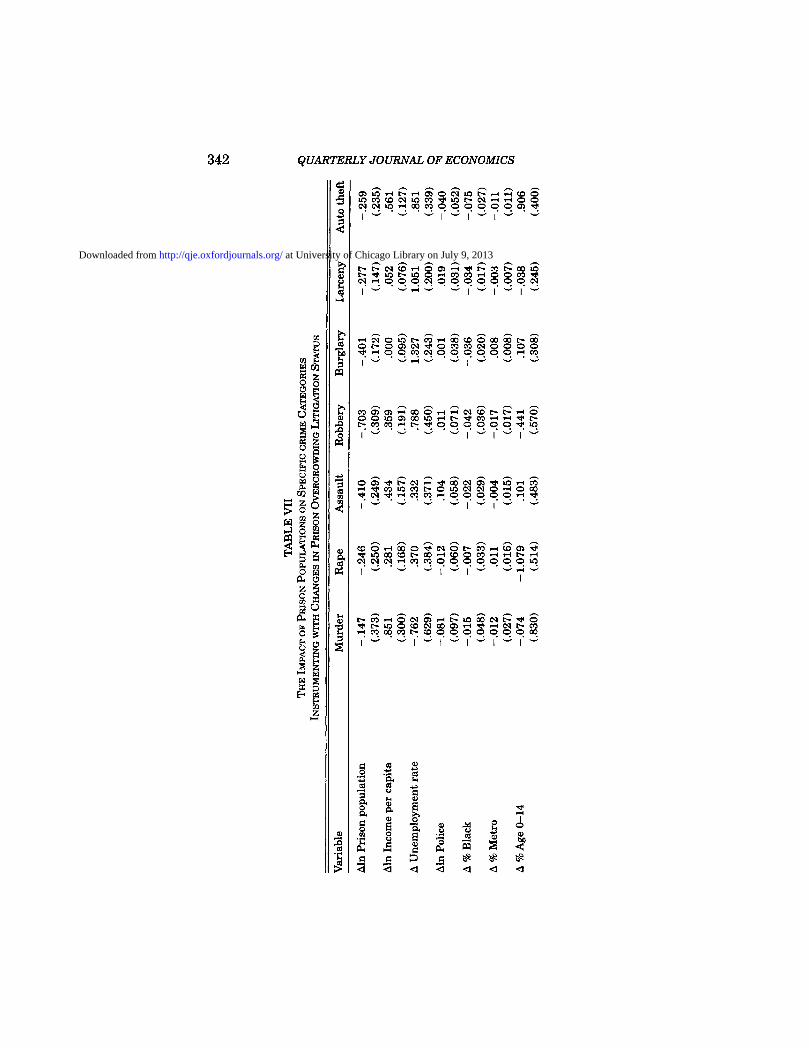
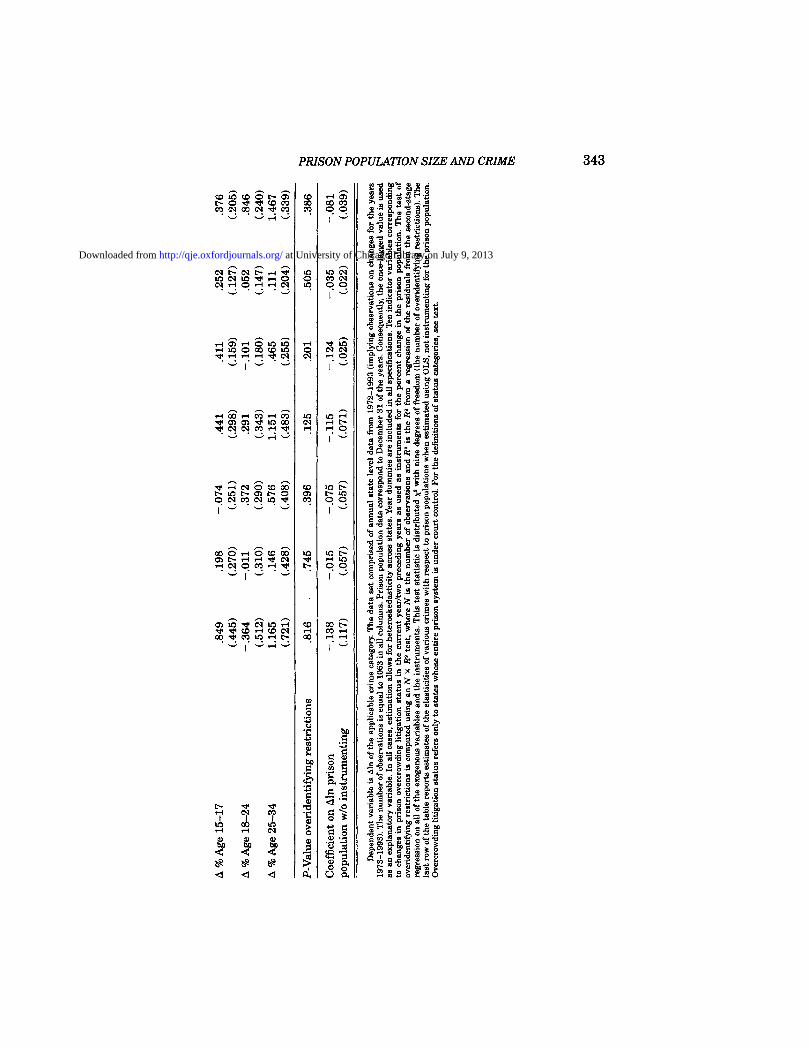
The results presented here appear to be robust to a varietyof alternative specifications. The point estimates rise slightlywhen the demographic, economic, and age variables are removed(elasticities of violent crime with respect to prison population sizeof —0.50 to —0.42, and —0.40 to-0.26 for property crime). I havealso experimented with estimation in log-levels rather than log-differences and obtained similar results. Perhaps the strongestevidence that the results are authentic comes from disaggregat-ing the crime data into individual crime categories. Table VIIpresents crime-by-crime estimates of specifications correspond-ing to columns (3) and (6) of Table VI. 29 The bottom row of TableVII also presents the uninstrumented coefficient on the prisonvariable for comparison purposes. The estimates across the sevencrime categories are consistent with the earlier results. The esti-mated elasticities with respect to prison populations range from—0.147 to —0.703. Because of large standard errors, only two ofthe seven estimates are statistically significant at the .05 level,with two others significant at or around the .10 level. In all sevencases, instrumenting leads to more negative estimates. Tests ofoveridentifying restrictions are safely within accepted bounds foreach crime category. Assault, robbery, and burglary are the twocrimes most responsive to increases in imprisonment.
28. Creating ten separate instruments out of the litigation status variablemay predispose the overidentification test toward acceptance of the exogeneity ofthe instruments. When the ten instruments are reduced to five by eliminating thedistinction between the year of the status change and the following two years, theP values on the test of overidentifying restrictions range between .104 and .427across the columns of Table VII, still within acceptable bounds in all instances.
29. The results presented in Table VII do not allow for correlation in errorsacross the different crime categories. The results are similar when the sevencrime categories are jointly estimated, allowing for cross-crime correlations inthe errors.
at University of C
hicago Library on July 9, 2013
http://qje.oxfordjournals.org/D
ownloaded from
PRISON POPULATION SIZE AND CRIME 341
A final consideration in interpreting the instrumented coef-ficients is whether such estimates are generalizable to the full setof states, or to other potential changes in imprisonment policy.When instrumenting, the parameters are identified solely basedon variation in prison populations in states where the entireprison system falls under court control. These states tend to bedisproportionately Southern and have higher initial incarcera-tion rates. One might consequently expect that the marginal pris-oner is less criminal in such states, implying larger elasticitiesfor other states. On the other hand, it is possible that states thatrely on higher levels of incarceration are self-selected. Theyimprison more criminals precisely because incarceration hasa greater crime-reducing impact in these states. As a test ofwhether either of those scenarios appears to hold true, the coeffi-cient on prisoners was allowed to vary (in the uninstrumentedregressions) according to whether or not a state is Southern. Theestimated elasticities were somewhat smaller in Southern states.For violent crime the elasticities were —0.016 (SE = 0.063) and—0.118 (SE = 0.035) in Southern and non-Southern states, re-spectively. For property crime the elasticities were —0.034 (SE =0.035) and —0.081 (SE = 0.020). In neither case, however, couldthe null hypothesis of no difference in the coefficients acrossSouthern and non-Southern states be rejected at the .05 level. Ifthe marginal impact of increased incarceration on crime is actu-ally lower in Southern states, the estimates of this paper willtend to understate the true benefits of increased imprisonmentin the nation as a whole. 3°
Perhaps the more pressing question of applicability for theestimates in this paper concerns whether prison populationchanges that are court-ordered are similar to other sources ofvariation in prison populations. An important observation withrespect to this issue is that all of the reduction in prison popula-tions due to overcrowding litigation appears to be due to earlyrelease of prisoners. The litigation indicator variables have es-sentially no explanatory power with respect to the number ofprisoners committed to the prison system on the front end. Thus,the estimates presented here are likely to be more applicable to
30. As an additional check, the sample was also divided according to whetheror not a state's entire prison system eventually fell under court control. For bothviolent and property crime, the point estimates on the effect of prison populationson crime were nearly identical across the two sets of states: —0.068 (SE = 0.047)versus —0.099 (SE = 0.033) for violent crime; —0.081 (SE = 0.029) versus —0.079(SE = 0.019) for property crime. Again, in neither case can the null hypothesisthat the two sets of states have equal coefficients be rejected.
at University of C
hicago Library on July 9, 2013
http://qje.oxfordjournals.org/D
ownloaded from
TA
BL
E V
IIT
HE
IM
PA
CT
OF
PR
ISO
N P
OP
UL
AT
ION
S O
N S
PE
CIF
IC C
RIM
E C
AT
EG
OR
IES
ADIN
STR
UM
EN
TIN
G W
ITH
CH
AN
GE
S IN
PR
ISO
N O
VE
RC
RO
WD
ING
LIT
IGA
TIO
N S
TA
TU
S
Var
iab
le
Mu
rder
Rap
e A
ssau
lt
Rob
ber
y B
urg
lary
Lar
cen
y A
uto
th
eft
tzi
Aln
Pri
son
pop
ula
tion
-.1
47
-.246
-.4
10
-.7
03
-.401
-.277
-.2
59
''C
(.37
3)
(.25
0)
(.24
9)
(.30
9)
(.17
2)
(.14
7)
(.23
5)0
Aln
In
com
e p
er c
apit
a
.851
.281
.434
.359
.000
.052
.561
(.30
0)
(.16
8)
(.15
7)
(.19
1)
(.09
5)
(.07
6)
(.12
7)A
Un
emp
loym
ent
rate
-.7
62
.370
.332
.788
1.32
7 1.
051
.851
(.62
9)
(.38
4)
(.37
1)
(.45
0)
(.24
3)
(.20
0)
(.33
9)
pA
ln P
olic
e -.
08
1
-.012
.104
.011
.001
.019
-.0
40
'xl
(.09
7)
(.06
0)
(.05
8)
(.07
1)
(.03
8)
(.03
1)
(.05
2)
N c-A
% B
lack
-.0
15
-.007
-.0
22
-.0
42
-.0
36
-.034
-.0
75
0
(.04
8)
(.03
3)
(.02
9)
(.03
6)
(.02
0)
(.01
7)
(.02
7)
0A
% M
etro
-.0
12
.011
-.0
04
-.0
17
.008
-.003
-.0
11
..
(.02
7)
(.01
6)
(.01
5)
(.01
7)
(.00
8)
(.00
7)
(.01
1)
c) c4A
% A
ge 0
-14
-.0
74
-1.0
79
.101
-.4
41
.107
-.0
38
.906
(.83
0)
(.51
4)
(.48
3)
(.57
0)
(.30
8)
(.24
5)
(.40
0)
at University of Chicago Library on July 9, 2013http://qje.oxfordjournals.org/Downloaded from
A %
Age
15-
17
.849
.198
-.0
74
.441
.411
.252
.376
(.44
5)
(.27
0)
(.25
1)
(.29
8)
(.15
9)
(.12
7)
(.20
5)A
% A
ge 1
8-24
-.364
-.0
11
.372
.291
-.101
.052
.846
(.51
2)
(.31
0)
(.29
0)
(.34
3)
(.18
0)
(.14
7)
(.24
0)A
% A
ge 2
5-34
1.16
5.1
46
.576
1.15
1 .4
65
.111
1.46
7
(.72
1)
(.42
8)
(.40
8)
(.48
3)
(.25
5)
(.20
4)
(.33
9)
P-V
alu
e ov
erid
enti
fyin
g re
stri
ctio
ns
.816
.745
.396
.125
.201
.505
.386
Coe
ffic
ien
t on
Aln
pri
son
-.138
-.015
-.0
75
-.115
-.1
24
-.035
-.081
pop
ula
tion
w/o
in
stru
men
tin
g
(.11
7)
(.05
7)
(.05
7)
(.07
1)
(.02
5)
(.02
2)
(.03
9)
Dep
end
ent
vari
able
is
Ain
of
the
app
lica
ble
cri
me
cate
gory
. Th
e d
ata
set
com
pri
sed
of
ann
ual
sta
te l
evel
dat
a fr
om 1
972-
1993
(im
ply
ing
obse
rvat
ion
s on
ch
ange
s fo
r th
e ye
ars
1973
-199
3). T
he
nu
mb
er o
f ob
serv
atio
ns
is e
qu
al t
o 10
63 i
n a
ll c
olu
mn
s. P
riso
n p
opu
lati
on d
ata
corr
esp
ond
to
Dec
emb
er 3
1 of
th
e ye
ars.
Con
seq
uen
tly,
th
e on
ce-l
agge
d v
alu
e is
use
das
an
exp
lan
ator
y va
riab
le. I
n a
ll c
ases
, est
imat
ion
all
ows
for
het
eros
ked
asti
city
acr
oss
stat
es. Y
ear
du
mm
ies
are
incl
ud
ed i
n a
ll s
pec
ific
atio
ns.
Ten
in
dic
ator
var
iab
les
corr
esp
ond
ing
to c
han
ges
in
pri
son
over
crow
din
g l
itig
ati
on
sta
tus
in t
he
curr
ent
yea
r/tw
o p
rece
din
g y
ears
as
use
d a
s in
stru
men
ts f
or
the
per
cen
t ch
an
ge
in t
he
pri
son
po
pu
lati
on
. T
he
test
of
over
iden
tify
ing
rest
rict
ion
s is
com
pu
ted
usi
ng
an N
x R
. te
st,
wh
ere
N i
s th
e n
um
ber
of
ob
serv
ati
on
s a
nd
R. i
s th
e R
2 fr
om
a r
egre
ssio
n o
f th
e re
sid
ua
ls f
rom
th
e se
con
d-s
tag
ere
gres
sion
on
all
of
the
exog
enou
s va
riab
les
and
th
e in
stru
men
ts. T
his
tes
t st
atis
tic
is d
istr
ibu
ted
X2
wit
h n
ine
deg
rees
of
free
dom
(th
e n
um
ber
of
over
iden
tify
ing
rest
rict
ion
s). T
he
last
row
of
the
tab
le r
epor
ts e
stim
ates
of
the
elas
tici
ties
of
vari
ous
crim
es w
ith
res
pec
t to
pri
son
pop
ula
tion
s w
hen
est
imat
ed u
sin
g O
LS
, not
in
stru
men
tin
g fo
r th
e p
riso
n p
opu
lati
on.
Ove
rcro
wd
ing
liti
gati
on s
tatu
s re
fers
on
ly t
o st
ates
wh
ose
enti
re p
riso
n s
yste
m i
s u
nd
er c
ourt
con
trol
. For
th
e d
efin
itio
ns
of s
tatu
s ca
tego
ries
, se
e te
xt.
Cra
041n
CAD
at University of Chicago Library on July 9, 2013http://qje.oxfordjournals.org/Downloaded from
344 QUARTERLY JOURNAL OF ECONOMICS
changes in policies affecting time served, such as parole policies.The court only rarely mandates the release of prisoners, insteadtaking actions such as enjoining double bunking or closing por-tions of prisons, which must then be resolved by the state prisonsystems. Consequently, court-ordered fluctuations in prisonersmay in fact be quite similar in their impact to other sources ofvariation in prison populations.
W. POLICY IMPLICATIONS OF THE ESTIMATES
In order to use the results of the previous section in formulat-ing public policy, estimates of the social costs of crime are re-quired. The estimates of Cohen [19881 and Miller, Cohen, andRossman [1993] are used for that purpose. Those papers attemptto capture both monetary costs of crime (medical bills, propertyloss, lost productivity) and quality of life reductions caused bypain and suffering. To gauge the quality of life reductions, juryawards in civil suits, excluding punitive damages, are estimatedfor a wide range of injuries. Those awards are then mapped tothe distribution of injuries associated with the various crime cate-gories. The cost estimates do not include the additional preventa-tive measures taken by victims, lifestyle changes associated withthe marginal crime, costs to employers, or legal costs, and there-fore may understate the true costs of crime. On the other hand,the cost estimates correspond to the average crime, which may bemore serious than the marginal crime, and therefore may exag-gerate the costs of crime.
Another consideration in interpreting the estimates of theprevious section in a policy context is the extent to which theresults obtained using reported crimes carry over to unreportedcrimes. This question is important since victimization surveyssuggest that only 38 percent of all index crimes are reported tothe police. Even serious crimes such as robbery are reported littlemore than half of the time. In what follows, it is assumed thatthe elasticity of unreported crime to the number of prisoners isidentical to that for reported crime. To the extent that criminalsdo not know in advance whether a crime will be reported, thisseems to be a reasonable assumption. 31
Table VIII presents the estimated impact of adding one pris-
31. It is possible that reported and unreported crimes differ systematically.For instance, crimes perpetrated by strangers are more likely to be reported. Thefact that the criminal is in prison might be a signal that the criminal has a propen-sity to commit crimes that get reported.
at University of C
hicago Library on July 9, 2013
http://qje.oxfordjournals.org/D
ownloaded from
PRISON POPULATION SIZE AND CRIME 345
TABLE VIIIESTIMATED IMPACT ON CRIME FROM ADDING ONE ADDITIONAL PRISONER
(EVALUATED AT 1993 SAMPLE MEAN)
Change in total Cost per crimecrime (assumes Social benefit
Change in same elasticity for Quality of reducedreported crimes unreported crimes) Monetary of life crime
Murder –0.004 –0.004 $17,000 $2.7 Million $10,800Rape –0.031 –0.053 9,800 40,800 2,700Assault –0.55 –1.2 1,800 10,200 14,000Robbery –0.55 –1.1 2,900 14,900 17,800Burglary –1.3 –2.6 1,200 400 4,300Larceny –2.6 –9.2 200 0 1,800Auto theft –0.5 –0.7 4,000 0 2,500Total –5.54 –14.86 — — 53,900
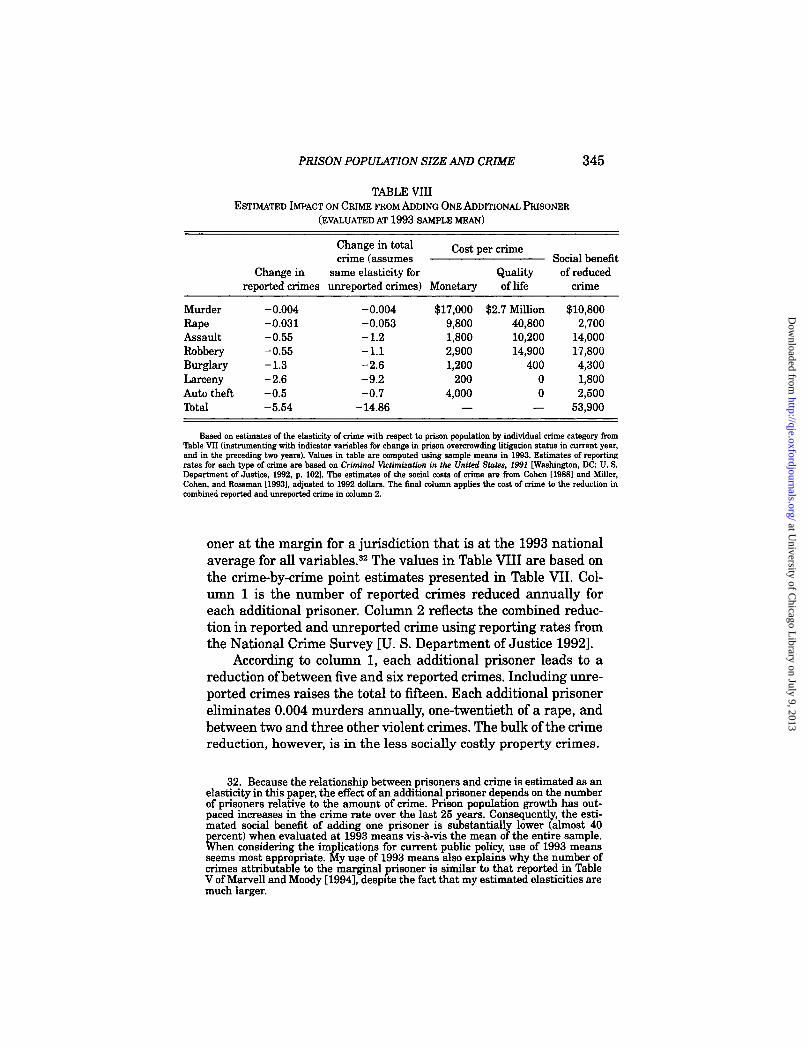
Based on estimates of the elasticity of crime with respect to prison population by individual crime category fromTable VII (instrumenting with indicator variables for change in prison overcrowding litigation status in current year,and in the preceding two years). Values in table are computed using sample means in 1993. Estimates of reportingrates for each type of crime are based on Criminal Victimization in the United States, 1991 [Washington, DC: U. S.Department of Justice, 1992, p. 102]. The estimates of the social costs of crime are from Cohen [1988] and Miller,Cohen, and Rossman [1993], adjusted to 1992 dollars. The final column applies the cost of crime to the reduction incombined reported and unreported crime in column 2.
oner at the margin for a jurisdiction that is at the 1993 nationalaverage for all variables.32 The values in Table VIII are based onthe crime-by-crime point estimates presented in Table VII. Col-umn 1 is the number of reported crimes reduced annually foreach additional prisoner. Column 2 reflects the combined reduc-tion in reported and unreported crime using reporting rates fromthe National Crime Survey [U. S. Department of Justice 1992].
According to column 1, each additional prisoner leads to areduction of between five and six reported crimes. Including unre-ported crimes raises the total to fifteen. Each additional prisonereliminates 0.004 murders annually, one-twentieth of a rape, andbetween two and three other violent crimes. The bulk of the crimereduction, however, is in the less socially costly property crimes.
32. Because the relationship between prisoners and crime is estimated as anelasticity in this paper, the effect of an additional prisoner depends on the numberof prisoners relative to the amount of crime. Prison population growth has out-paced increases in the crime rate over the last 25 years. Consequently, the esti-mated social benefit of adding one prisoner is substantially lower (almost 40percent) when evaluated at 1993 means vis-à-vis the mean of the entire sample.When considering the implications for current public policy, use of 1993 meansseems most appropriate. My use of 1993 means also explains why the number ofcrimes attributable to the marginal prisoner is similar to that reported in TableV of Marvell and Moody [1994], despite the fact that my estimated elasticities aremuch larger.
at University of C
hicago Library on July 9, 2013
http://qje.oxfordjournals.org/D
ownloaded from
346 QUARTERLY JOURNAL OF ECONOMICS
The estimate of fifteen crimes eliminated per prisoner peryear is remarkably close to the median number of crimes ob-tained from surveys of prisoner self-reports, which have rangedfrom twelve to fifteen [Peterson and Braiker 1980; Dilulio andPiehl 1991; Piehl and Dilulio 1995]. The similarity between thetwo sets of results does not necessarily imply that the marginalprisoner is also the median prisoner since prisoner surveys onlytake into account incapacitation effects of prison, and also do notcapture replacement effects when one criminal is arrested. Incontrast, the estimates of this paper incorporate incapacitation,replacement, and deterrence effects.
Columns 3 and 4 are the Cohen [1988] and Miller, Cohen,and Rossman [1993] estimates of the monetary and quality of lifelosses due to crime.33 For violent crimes the bulk of the costs areassociated with quality of life reductions. For property crimes thecosts are almost exclusively monetary. Column 5 combines theinformation in the second, third, and fourth columns to providean estimate of the social benefit of crime reduction. The largestsocial benefits are associated with reduced murders, assaults,and robberies, together accounting for over $40,000 per prisonerper year. No other type of crime reduction yields a social benefitgreater than $5000. The reduction in larcenies, though far andaway the largest in raw numbers, carries the smallest social bene-fit across the crime categories. Combining all of the crime catego-ries, incarcerating one additional prisoner yields a social benefitof $53,900 annually." The true benefits of crime reduction arelikely to exceed this total since it reflects only the seven crimecategories examined in this paper and thus omits any benefitsfrom reductions in other illegal activities such as drug offenses,arson, fraud, and driving under the influence.
A number of estimates are available of the average taxpayercost of incarceration. 35 Freeman [1995] computes the average an-
33. The Miller, Cohen, and Rossman [1993] estimates, which update Cohen[1988], are only available for violent crimes.
34. To get a rough estimate of the precision of the aggregate social benefittotal of $53,900, a standard error was computed, assuming that the costs percrime were exact and the point estimates across the different crime categorieswere uncorrelated. Both of those assumptions will lead the computed standarderror to understate the true value. Given those assumptions, the estimated stan-dard error on the social benefit per marginal prisoner is approximately $30,000.The overall standard error is greatly inflated by the imprecision of the estimatesof the murder coefficients. If murder is excluded from the calculations, the socialbenefit falls to $43,100 with a standard error of $12,000.
35. AU of the estimates discussed below have been translated into 1992 dol-lars for comparability to the social cost of crime estimates.
at University of C
hicago Library on July 9, 2013
http://qje.oxfordjournals.org/D
ownloaded from

PRISON POPULATION SIZE AND CRIME 347
nual cost per prisoner and jail inmate as approximately $23,500.Dilulio and Piehl [1995] use $25,000 as a "widely asserted"benchmark. Waldfogel [1993] calculates the annual cost of lock-ing up a prisoner to be $28,500. Donohue and Siegelman [1994],correcting apparent shortcomings in the approach of Cavanaughand Kleiman [1990], estimate the cost to be roughly $35,000.Confirming these estimates, the state of Missouri, faced with ex-cess prison capacity, rented prison space to other states at an an-nual rate of $27,000 [Corrections Compendium 1989].
The above estimates of prison costs fail to capture the truesocial costs of incarcerating the marginal prisoner in a number ofways. The estimates do not take into account tax distortions thatmake the social cost of raising a dollar greater than a dollar, 36
lost social surplus from wasted human capital due to incarcera-tion, post-release decline in wages [Lott 1992; Waldfogel 1994],or the pain and suffering of prisoners and their families. All ofthose omissions lead the estimates to understate the true socialcosts. On the other hand, these estimates reflect the average costsof running prisons rather than the marginal costs of an addi-tional prisoner, which is almost certainly lower.
Given the practical limitations and conceptual problems as-sociated with the estimates of both social costs and benefits, anycomparison of the two is uncertain. Nonetheless, it is interestingto note that the two sets of estimates carry roughly the samemagnitude, suggesting that the criminal justice system is roughlyefficient in its determination of the scope of incarceration. 37 Ifanything, the results of this paper suggest that increasing theamount of time served by the current pool of prisoners would besocially beneficial.
An important caveat concerning the application of these re-sults to public policy is that the social benefit of radically ex-panding the prison population through the incarceration ofincreasingly minor criminals is likely to be well below the esti-mates presented here. Given the apparent skew in the distribu-tion of criminal activity, the current group of prisoners is likelyto be much more criminally active than the marginal pool of indi-viduals that come into contact with the criminal justice systembut are not imprisoned. If the amount of incarceration is to beincreased, keeping the current pool of prisoners behind bars for
36. Feldstein [1995] suggests that the deadweight loss associated with rais-ing marginal federal funds may be much higher than previously thought.
37. Easterbrook [1983] and Waldfogel [1993] also argue that the criminaljustice system achieves efficient outcomes.
at University of C
hicago Library on July 9, 2013
http://qje.oxfordjournals.org/D
ownloaded from

348 QUARTERLY JOURNAL OF ECONOMICS
a longer period of time is likely to be a more advisable publicpolicy approach.
V. CONCLUSIONS
Using prison overcrowding litigation as an instrument forchanges in the prison population, this paper attempts to estimatethe marginal productivity of increased incarceration in reducingcrime. The estimates obtained are two to three times larger thanthe conventional wisdom. The results are robust across all of thecrime categories examined. Incarcerating one additional prisonerreduces the number of crimes by approximately fifteen per year,a number in close accordance with the level of criminal activityreported by the median prisoner in surveys. While any cost bene-fit analysis is dependent on many questionable assumptions, theestimates presented in this paper suggest that the marginal costsof incarceration are at or below the accompanying social benefitsof crime reduction.
The finding that increased prison populations appear to sub-stantially reduce crime does nothing to reduce the importance ofidentifying and correcting those factors that lie at the source ofcriminal behavior. If truly feasible, prevention or rehabilitationwould likely be preferable to long-term incarceration from botha cost-benefit and humanitarian perspective. Toward that end,Donohue and Siegelman [1994] survey a number of early-childhood and family-intervention programs that have achievedencouraging results in small samples but have not yet been at-tempted on a larger scale. While labor market interventions havegenerally not been successful in this realm, the Job Corps ap-pears to be a possible exception [Donohue and Siegelman]. Fi-nally, recent experimentation with alternatives to traditionalprisons, including community-based sentences and "boot camps,"represents an important avenue of investigation. In the absenceof strong alternatives to imprisonment at the present time, how-ever, increased reliance on incarceration appears to have been,and continue to be, an effective approach to reducing crime.
APPENDIX: DEFINITIONS OF THE UNIFORM CRIME REPORTSCRIME CATEGORIES
Murder and Nonnegligent ManslaughterThe willful killing of one human being by another. Deathscaused by negligence, attempts to kill, assaults to kill, sui-
at University of C
hicago Library on July 9, 2013
http://qje.oxfordjournals.org/D
ownloaded from
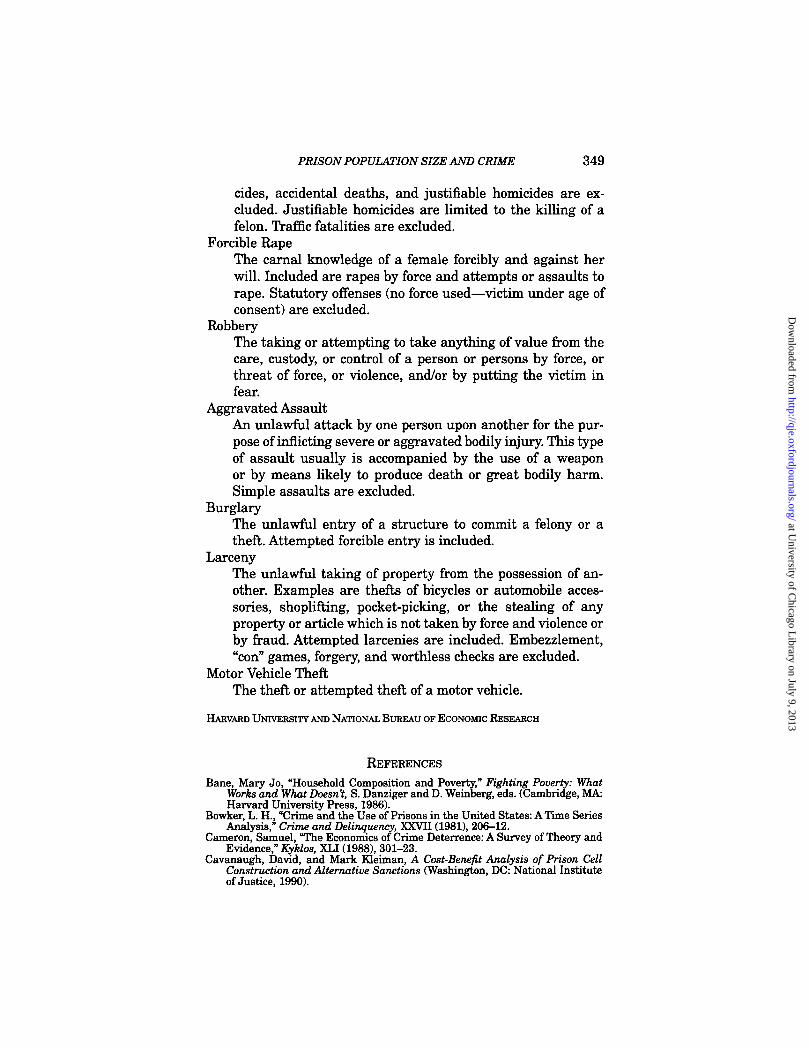
PRISON POPULATION SIZE AND CRIME 349
cides, accidental deaths, and justifiable homicides are ex-cluded. Justifiable homicides are limited to the killing of afelon. Traffic fatalities are excluded.
Forcible RapeThe carnal knowledge of a female forcibly and against herwill. Included are rapes by force and attempts or assaults torape. Statutory offenses (no force used—victim under age ofconsent) are excluded.
RobberyThe taking or attempting to take anything of value from thecare, custody, or control of a person or persons by force, orthreat of force, or violence, and/or by putting the victim infear.
Aggravated AssaultAn unlawful attack by one person upon another for the pur-pose of inflicting severe or aggravated bodily injury. This typeof assault usually is accompanied by the use of a weaponor by means likely to produce death or great bodily harm.Simple assaults are excluded.
BurglaryThe unlawful entry of a structure to commit a felony or atheft. Attempted forcible entry is included.
LarcenyThe unlawful taking of property from the possession of an-other. Examples are thefts of bicycles or automobile acces-sories, shoplifting, pocket-picking, or the stealing of anyproperty or article which is not taken by force and violence orby fraud. Attempted larcenies are included. Embezzlement,"con" games, forgery, and worthless checks are excluded.
Motor Vehicle TheftThe theft or attempted theft of a motor vehicle.
HARVARD UNIVERSITY AND NATIONAL BUREAU OF ECONOMIC RESEARCH
REFERENCESBane, Mary Jo, "Household Composition and Poverty," Fighting Poverty: What
Works and What Doesn't, S. Danziger and D. Weinberg, eds. (Cambridge, MA:Harvard University Press, 1986).
Bowker, L. H., "Crime and the Use of Prisons in the United States: A Time SeriesAnalysis," Crime and Delinquency, XXVII (1981), 206-12.
Cameron, Samuel, "The Economics of Crime Deterrence: A Survey of Theory andEvidence," Kyklos, XLI (1988), 301-23.
Cavanaugh, David, and Mark Kleiman, A Cost-Benefit Analysis of Prison CellConstruction and Alternative Sanctions (Washington, DC: National Instituteof Justice, 1990).
at University of C
hicago Library on July 9, 2013
http://qje.oxfordjournals.org/D
ownloaded from
350 QUARTERLY JOURNAL OF ECONOMICS
Chappell, Duncan, "International Developments in Corrections," The Prison Jour-nal, LXVIII (1988), 34-40.
Cohen, Mark, "Pain, Suffering, and Jury Awards: A Study of the Cost of Crime toVictims," Law and Society Review, XXII (1988), 537-55.
Corrections Compendium, "Missouri Has Cells to Rent," Corrections Compen-dium, XIV (November 1989), 14.
Devine, Joel A., Joseph F. Sheley, and M. Dwayne Smith, "Macroeconomic andSocial-Control Policy Influences on Crime Rate Changes, 1948-1985," Ameri-can Sociological Review, LIII (1988), 407-20.
Dilulio, John, and Anne Piehl, "Does Prison Pay? The Stormy National Debateover the Cost-Effectiveness of Imprisonment," The Brookings Review (Fall1991), 28-35.
Donohue, John, and Peter Siegelman, "Is the United States at the Optimal Rateof Crime?" American Bar Foundation mimeo, 1994.
Easterbrook, Frank, "Criminal Procedure as a Market System," Journal of LegalStudies, XII (1983), 289-32.
Ehrlich, Isaac, "On the Usefulness of Controlling Individuals: An Economic Analy-sis of Rehabilitation, Incapacitation, and Deterrence," American EconomicReview, UM (1981), 307-22.
Feldstein, Martin, "Tax Avoidance and the Deadweight Loss of the Income Tax,"NBER Working Paper No. 5055,1995.
Freeman, Richard, "Why Do So Many Young American Men Commit Crimes andWhat Might We Do about It?" Journal of Economic Perspectives (1995),forthcoming.
Gove, Walter, Michael Hughes, and Michael Geerken, "Are Uniform Crime Re-ports a Valid Indicator of the Index Crimes? An Affirmative Answer with Mi-nor Qualifications," Criminology, XXIII (1985), 451-501.
Grogger, Jeff, "Criminal Opportunities, Youth Crime, and Young Men's LaborSupply," University of California at Santa Barbara mimeo, 1994.
Koren, Edward, "Status Report: State Prisons and the Courts: January 1, 1993,"National Prison Project Journal, VIII (1993), 3-11.
Levitt, Steven, "Using Electoral Cycles in Police Hiring to Estimate the Effect ofPolice on Crime," NBER Working Paper No. 4991,1994., "Why Do Higher Arrest Rates Reduce Crime: Deterrence, Incapacitation, orMeasurement Error?" Harvard University mimeo, 1995a., "The Response of Crime Reporting Behavior to Changes in the Size of thePolice Force: Implications for Studies of Police Effectiveness Using ReportedCrime Data," Harvard University mimeo, 1995b.
Lott, John, "Do We Punish High Income Criminals Too Heavily?" Economic In-quiry, XXX (1992), 1307-16.
Marvell, Thomas, and Carlisle Moody, "Prison Population Growth and Crime Re-duction," Journal of Quantitative Criminology, X (1994), 109-40.
Miller, Ted, Mark Cohen, and Shelli Rossman, "Victim Costs of Violent Crime andResulting Injuries," Health Affairs, XII (1993), 186-97.
Model, Karyn, "The Effect of Marijuana Decriminalization on Hospital Emer-gency Room Drug Episodes: 1975-1978," Journal of the American StatisticalAssociation, LXXXIII (1993), 737-47.
Nagel, William, "On Behalf of a Moratorium on Prison Construction," Crime andDelinquency, XXIII (1977), 152-74.
Nagin, Daniel, "Crime Rates, Sanction Levels and Constraints on Prison Popula-tion," Law and Society Review, XII (1978), 341-66.
O'Brien, Robert, Crime and Victimization Data (Beverly Hills, CA: Sage, 1985).Peterson, M. A., and H. B. Braiker, 1980, Doing Crime: A Survey of California
Prison Inmates (Santa Monica, CA: Rand Corporation, 1980).Piehl, Anne, and John Dilulio, "Does Prison Pay? Revisited," The Brookings Re-
view (Winter 1995), 21-25.Rogers, Joseph, "The Greatest Correctional Myth," Federal Probation, LIII
(1989), 21-28.Sampson, Robert, "Crime in Cities: The Effects of Formal and Informal Social
Control," Crime and Justice: A Review of Research, Volume VIII, Albert Reiss,Jr., and Michael Tonry, eds. (Chicago, IL: University of Chicago Press, 1986).
Schmidt, Peter, and Anne Witte, "Predicting Criminal Recidivism Using 'SplitPopulation' Survival Time Models," Journal of Econometrics, XL (1989),141-59.
at University of C
hicago Library on July 9, 2013
http://qje.oxfordjournals.org/D
ownloaded from
PRISON POPULATION SIZE AND CRIME 351
Selke, William, Prisons in Crisis (Bloomington, IN: Indiana University Press,1993).
Spelman, William, Criminal Incapacitation (New York, NY: Plenum Press, 1994).Visher, Christie, "The RAND Inmate Survey: A Reanalysis," Criminal Careers and
"Career Criminals," Alfred Blumstein et al., eds. (Washington, DC: NationalAcademy Press, 1986).
Waldfogel, Joel, "Criminal Sentences as Endogenous Taxes: Are They 'Just' or`Efficient?' Journal of Law and Economics, XXXVI (1993), 139-51., "Does Conviction Have a Persistent Effect on Income and Employment,"International Review of Law and Economics, XIV (1994), 103-19.
Wilson, James Q., "Prisons in a Free Society," The Public Interest, CXVII (1994),37-38.
Zimring, Franklin, and Gordon Hawkins, The Scale of Imprisonment (Chicago,IL: University of Chicago Press, 1991).
at University of C
hicago Library on July 9, 2013
http://qje.oxfordjournals.org/D
ownloaded from