Embed Size (px)
Citation preview
See important disclosures at the end of this report Powered by EFATM
Platform 1
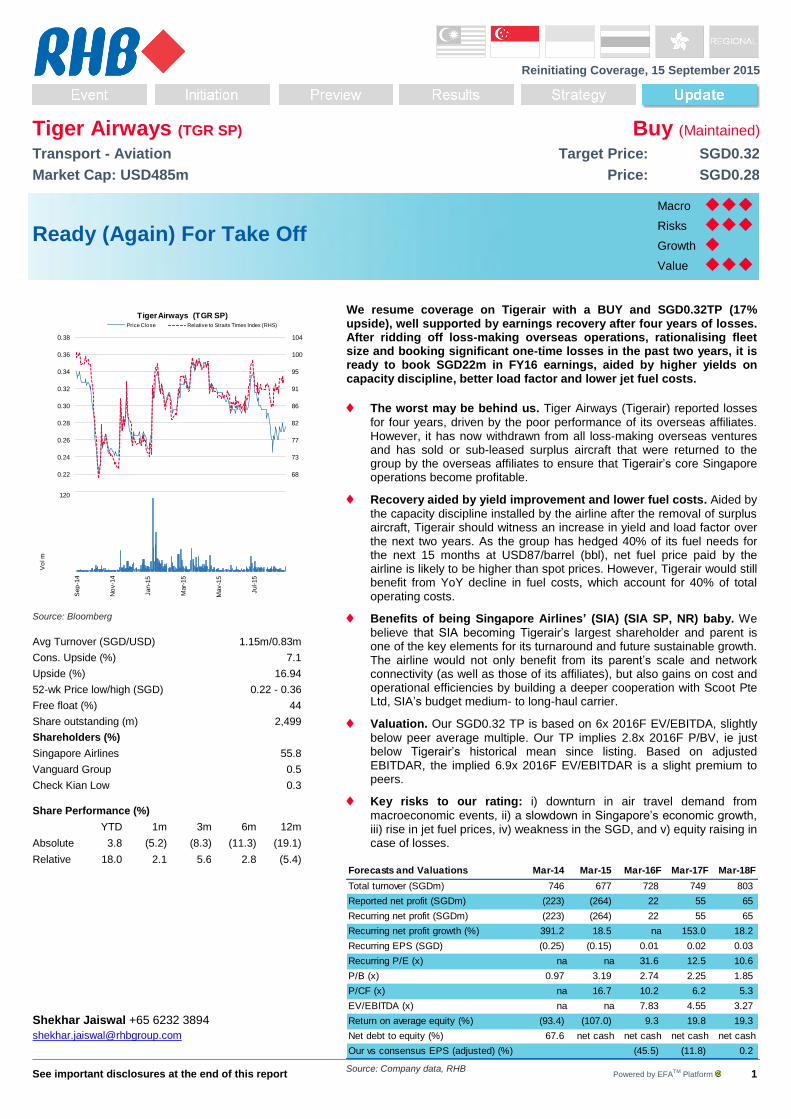
Reinitiating Coverage, 15 September 2015
Tiger Airways (TGR SP) Buy (Maintained) Transport - Aviation Target Price: SGD0.32
Market Cap: USD485m Price: SGD0.28
Ready (Again) For Take Off
Macro
3.00
Risks
3.00
Growth
1.00
Value
3.00
64
68
73
77
82
86
91
95
100
104
0.20
0.22
0.24
0.26
0.28
0.30
0.32
0.34
0.36
0.38
Tiger Airways (TGR SP)Price Close Relative to Straits Times Index (RHS)
20
40
60
80
100
120
Sep
-14
No
v-1
4
Jan-1
5
Mar-
15
May-1
5
Jul-15
Vo
l m
Source: Bloomberg
Avg Turnover (SGD/USD) 1.15m/0.83m
Cons. Upside (%) 7.1
Upside (%) 16.94
52-wk Price low/high (SGD) 0.22 - 0.36
Free float (%) 44
Share outstanding (m) 2,499
Shareholders (%)
Singapore Airlines 55.8
Vanguard Group 0.5
Check Kian Low 0.3
Share Performance (%)
YTD 1m 3m 6m 12m
Absolute 3.8 (5.2) (8.3) (11.3) (19.1)
Relative 18.0 2.1 5.6 2.8 (5.4)
Shekhar Jaiswal +65 6232 3894
Forecasts and Valuations Mar-14 Mar-15 Mar-16F Mar-17F Mar-18F
Total turnover (SGDm) 746 677 728 749 803
Reported net profit (SGDm) (223) (264) 22 55 65
Recurring net profit (SGDm) (223) (264) 22 55 65
Recurring net profit growth (%) 391.2 18.5 na 153.0 18.2
Recurring EPS (SGD) (0.25) (0.15) 0.01 0.02 0.03
Recurring P/E (x) na na 31.6 12.5 10.6
P/B (x) 0.97 3.19 2.74 2.25 1.85
P/CF (x) na 16.7 10.2 6.2 5.3
EV/EBITDA (x) na na 7.83 4.55 3.27
Return on average equity (%) (93.4) (107.0) 9.3 19.8 19.3
Net debt to equity (%) 67.6 net cash net cash net cash net cash
Our vs consensus EPS (adjusted) (%) (45.5) (11.8) 0.2
Source: Company data, RHB
We resume coverage on Tigerair with a BUY and SGD0.32TP (17% upside), well supported by earnings recovery after four years of losses. After ridding off loss-making overseas operations, rationalising fleet size and booking significant one-time losses in the past two years, it is ready to book SGD22m in FY16 earnings, aided by higher yields on capacity discipline, better load factor and lower jet fuel costs.
The worst may be behind us. Tiger Airways (Tigerair) reported losses
for four years, driven by the poor performance of its overseas affiliates. However, it has now withdrawn from all loss-making overseas ventures and has sold or sub-leased surplus aircraft that were returned to the group by the overseas affiliates to ensure that Tigerair’s core Singapore operations become profitable.
Recovery aided by yield improvement and lower fuel costs. Aided by
the capacity discipline installed by the airline after the removal of surplus aircraft, Tigerair should witness an increase in yield and load factor over the next two years. As the group has hedged 40% of its fuel needs for the next 15 months at USD87/barrel (bbl), net fuel price paid by the airline is likely to be higher than spot prices. However, Tigerair would still benefit from YoY decline in fuel costs, which account for 40% of total operating costs.
Benefits of being Singapore Airlines’ (SIA) (SIA SP, NR) baby. We
believe that SIA becoming Tigerair’s largest shareholder and parent is one of the key elements for its turnaround and future sustainable growth. The airline would not only benefit from its parent’s scale and network connectivity (as well as those of its affiliates), but also gains on cost and operational efficiencies by building a deeper cooperation with Scoot Pte Ltd, SIA’s budget medium- to long-haul carrier.
Valuation. Our SGD0.32 TP is based on 6x 2016F EV/EBITDA, slightly
below peer average multiple. Our TP implies 2.8x 2016F P/BV, ie just below Tigerair’s historical mean since listing. Based on adjusted EBITDAR, the implied 6.9x 2016F EV/EBITDAR is a slight premium to peers.
Key risks to our rating: i) downturn in air travel demand from
macroeconomic events, ii) a slowdown in Singapore’s economic growth, iii) rise in jet fuel prices, iv) weakness in the SGD, and v) equity raising in case of losses.

Tiger Airways (TGR SP)
15 September 2015
See important disclosures at the end of this report 2
A Quick Glance
Key financials Valuation and TP basis
FYE (Mar) FY15 FY16F FY17F FY18F
Revenue SGDm 677 728 749 803
Revenue growth % -9% 7% 3% 7%
EBITDAR SGDm 66 152 192 213
EBITDAR margin % 10% 21% 26% 27%
Net profit SGDm (264) 22 55 65
Net profit margin % -39% 3% 7% 8%
EPS SGD (0.15) 0.01 0.02 0.03
EPS growth % nm nm 153% 18%
BVPS SGD 0.09 0.10 0.12 0.15
Operating cash flow SGDm 28 67 110 130
Free cash flow SGDm (13) 49 90 110
Our SGD0.32 TP for Tigerair is based on 6x 2016F EV/EBITDA and implies 2.8x 2016F P/BV, which is just below its historical mean since listing. Our TP implies a target 2016F EV/EBITDAR multiple of 6.9x, which, although is at slight premium to its peers, is well supported by the recovery in Tigerair’s earnings and expansion in its EBITDAR margins to 21% in FY16F (Mar) and 26% in FY17F from 10% in FY15.
P/BV chart
Title:
Source:
Please fill in the values above to have them entered in your report
0.5
1.0
1.5
2.0
2.5
3.0
3.5
4.0
4.5
5.0
5.5
Feb-10 Feb-11 Feb-12 Feb-13 Feb-14 Feb-15
P/BV Avg. P/BV=2.9 -1 std=2.2 +1 std=3.7
Key assumptions
FY15 FY16F FY17F FY18F
No. of passengers 000 5,140 5,246 5,235 5,471
Load factor % 82% 84% 85% 85%
Fare per pax SGD 102 106 110 113
ASK m km 11,834 11,967 11,968 12,692
RPK SGD cents 6.8 6.9 7.0 7.1
CASK SGD cents 6.0 5.7 5.7 5.7
Jet fuel price SGD/bbl 127.6 94.0 89.2 99.3
USDSGD x 1.29 1.40 1.43 1.39
Company description Upside risks Downside risks
Tigerair is a low cost carrier (LCC) based in Singapore, which was originally founded in Dec 2003. The company formerly held stakes in a number of Tigerair branded joint-
ventures (JVs) in the Philippines, Indonesia and Australia. Today, Tigerair is majority owned by the Singapore Airlines (56%) and the LCC only holds a minority (10%) stake in its Tigerair Taiwan JV with China Airlines (2610 TT, NR).
These are: i) better-than-estimated yields, ii) a decline in jet fuel prices, iii) more-than-estimated declines in operational and asset costs, iv) a rapid appreciation of the SGD vs. the USD, and iv) consolidation of LCCs around the region, leading to a less competitive environment.
These are: i) a downturn in regional air travel demand from macroeconomic or geopolitical events, ii) a slowdown in Singapore’s economic growth, iii) a rise in jet fuel prices, iv) continuing weakness in the SGD, and v) capital raising in case of continued losses from operations.
Sensitivity analysis Comparison with consensus
FY16F FY16 FY17 FY17
FYE (Mar) EBITDA profit EBITDA profit
1% increase in passengers booked 7% 22% 6% 12%
1% increase in load factor 8% 26% 7% 14%
1% increase in fare per pax 5% 18% 5% 9%
1% increase in jet fuel price -1% -4% -1% -2%
RHB Consensus
FY16 (Mar) estimate estimate
Revenue SGDm 728 688
EBITDA SGDm 73 85
Net profit SGDm 22 36
Relative comps
P/E P/BV EV/EBITDA Net debt/equity
Dec-15 Dec-16 Dec-15 Dec-16 Dec-15 Dec-16 Dec-15 Dec-16
AirAsia 5.3 4.0 0.62 0.56 6.2 6.3 199% 203%
Asia Aviation 12.3 15.5 1.05 1.01 6.8 8.6 14% 25%
Nok Air 10.6 5.5 1.13 0.97 na 0.6 -80% -84%
Tigerair** - 14.6 2.84 2.35 11.1 5.1 -36% -60%
Note: Tigerair numbers are for four quarters ending December. Prices are as at 14 Sep 2015. More detailed comparisons are provided in Figure 4.
Source: Bloomberg, RHB

Tiger Airways (TGR SP)
15 September 2015
See important disclosures at the end of this report 3
Table of Contents
A Quick Glance ............................................................................................... 2
Investment Thesis – Valuation And Risks ...................................................... 4
Investment thesis ........................................................................................ 4
Valuation and price target ........................................................................... 4
What’s the worst case scenario? ................................................................ 6
Risks to our rating and price target............................................................. 6
Got Rid Of Bleeding Overseas Ventures And Excess Aircraft ....................... 7
Struggling affiliates meant overcapacity in a mature Singapore market .... 7
Tigerair has withdrawn from all overseas loss making operations… ......... 7
…and has reduced its fleet size to a more realistic number ...................... 8
Yield Recovery And Lower Unit Cost To Help Improve Profits .................... 10
Route rationalisation and terminations has reduced capacity .................. 10
Improvement in yields and load factor already visible .............................. 11
Low fuel prices and a decline in high fuel price hedge to keep costs low 12
To Benefit From Its Growing Relationship With SIA .................................... 13
Leveraging on Scoot’s complementary network ....................................... 13
Co-operation with Scoot is not limited to network .................................... 13
It is not all about Scoot, getting help from KrisFlyer too ........................... 13
Witnessing a Financial Turnaround .............................................................. 14
Witnessing a turnaround, growth to sustain for at least two years ........... 14
Re-capitalised balance sheet with a strong shareholder .......................... 15
Costs to increase if SGD continues to weaken against the USD ............. 16
Rise in jet fuel prices could also throw Tigerair off its recovery track ....... 16
Revised aggressive depreciation policy to help keep the fleet young ...... 16
A Quick Comparison With Regional LCCs ................................................... 17
Company Background .................................................................................. 17
Appendix 1 - Tigerair’s Route Map ............................................................... 19
Appendix 2 - Tigerair’s Flight Departures From Singapore .......................... 20
Appendix 3 – History Of (Failed) Overseas Expansions .............................. 21
Overseas expansions gone sour .............................................................. 21
Overseas ventures that never took off ..................................................... 23
Regional partnerships that were later cancelled ...................................... 23
Financial Exhibits .......................................................................................... 24
Financial Exhibits .......................................................................................... 25
SWOT Analysis ............................................................................................ 26
Recommendation Chart ................................................................................ 27

Tiger Airways (TGR SP)
15 September 2015
See important disclosures at the end of this report 4
Investment Thesis – Valuation And Risks
Investment thesis
We believe that Tigerair’s worst years are now in the past and the airline is moving towards strong earnings recovery. We expect the group to report its first full-year profit of SGD22m in FY16 after four consecutive years of losses. The recovery would be driven by a reduction in seat capacity and network rationalisation initiatives undertaken over the last two years.
Tigerair has withdrawn, closed or sold all of its loss-making overseas operations. It has also reduced its fleet size by either selling or sub-leasing aircraft. Most one-time charges related to: i) sales of associates at a loss, ii) sales of aircraft at a loss, iii) sub-lease of aircraft at lower rental rates, iv) increased provisions related to the adoption of an aggressive depreciation policy, and v) higher maintenance costs for leased aircraft have already been booked in last two years. With capacity discipline in place, load factor and yield improvements have started to depict a more visible recovery trend, which makes us believe that there is limited downside risk.
Leveraging on Tigerair’s relationship with SIA and its affiliates, especially Scoot, the latter’s medium- to long-haul budget carrier, would enable the airline to further optimise its network and reduce operating costs. We believe that Tigerair could emerge as one of the stronger LCCs within the ASEAN region over the next 2-3 years, well supported by parent SIA, which is also now its single-largest shareholder.
Valuation and price target
Our SGD0.32 TP for Tigerair is based 6x 2016F EV/EBITDA multiple, which is slightly below the average multiple for its peers. Our TP implies 2.8x 2016F P/BV, which is just below the stock’s historical mean since listing. Our TP implies a target 2016F EV/EBITDAR multiple of 6.9x, which, although at a slight premium to its peers, we believe is well supported by a recovery in Tigerair’s earnings and expansion in its EBITDAR margins to 21% in FY16 and 26% in FY17 from 10% in FY15.
Figure 1: Target price derivation
EV/EBITDA based valuation
Rolling
Quarter ended Mar-16 Jun-16 Sep-16 Dec-16 quarters
EBITDA SGDm 32.5 23.1 18.5 31.5 105.6
Target EV/EBITDA multiple x 6.0
Target EV SGDm 633.7
Estimated net debt SGDm (171.2)
Equity value SGDm 805.0
Year-end (basic) shares o/s m 2,497.5
Year-end price target SGD 0.32
Source: RHB
Figure 2: Implied P/BV valuation Figure 3: Implied P/E valuation
P/BV based valuation
Financial year ended Dec-16
BPS (basic) SGD 0.11
Target P/BV multiple x 2.8
Target price SGD 0.32
PE based valuation
Financial year ended Dec-16
EPS (basic) SGD 0.02
Target PE multiple x 15.0
Target price SGD 0.32
Source: RHB Source: RHB

Tiger Airways (TGR SP)
15 September 2015
See important disclosures at the end of this report 5
Figure 4: Relative comparisons
BBG Price M Cap Last FY ROE N.Margin
Company name ticker (LCY) (USD m) FY0 FY0 FY1 FY2 FY0 FY1 FY2 FY0 FY1 FY2 FY1 FY1
ASEAN low cost carriers
Cebu Air CEB PM 88.35 1,145 Dec-14 62.7 7.5 6.7 9.7 6.0 6.0 2.49 1.98 1.62 27.5% 12.7%
AirAsia AIRA MK 1.23 794 Dec-14 12.5 5.3 4.0 9.2 6.2 6.3 0.75 0.62 0.56 18.4% 15.5%
Asia Aviation AAV TB 4.42 595 Dec-14 108.3 12.3 15.5 25.3 6.8 8.6 1.12 1.05 1.01 8.8% 5.8%
AirAsia X AAX MK 0.19 183 Dec-14 - - - - 39.2 9.3 0.65 1.00 1.05 -40.5% -10.3%
Nok Airlines Co Ltd NOK TB 7.30 127 Dec-14 - 10.6 5.5 - - 0.6 1.24 1.13 0.97 11.2% 3.1%
Weighted average 2,844 57.7 8.1 7.8 13.2 8.4 6.6 1.54 1.31 1.13 19.8% 11.6%
Global low cost carriers
Southwest Airlines LUV US 38.54 25,412 Dec-14 23.4 11.1 10.4 7.9 5.1 4.9 3.84 2.99 2.49 31.6% 11.9%
Ryanair RYA ID 13.60 20,844 Mar-15 21.7 15.4 13.4 12.3 9.4 8.2 4.64 3.89 3.07 27.5% 19.3%
EasyJet EZJ LN 1,774.00 10,886 Sep-14 15.5 13.0 11.9 9.5 8.0 7.4 3.24 2.78 2.51 23.5% 11.6%
JetBlue Airways JBLU US 25.68 8,084 Dec-14 18.9 13.7 12.0 11.0 6.0 5.3 3.15 2.68 2.18 22.6% 10.1%
WestJet WJA CN 24.07 2,277 Dec-14 10.8 8.0 8.0 4.1 3.5 3.4 1.73 1.55 1.33 19.2% 9.3%
Air Arabia AIRARABI DB 1.40 1,779 Dec-14 11.7 10.8 9.5 10.0 8.3 7.3 1.29 1.24 1.18 12.1% 15.9%
GOL Airways GOLL4 BZ 4.30 386 Dec-14 - - - 7.0 10.1 7.2 - - - 119.9% -13.4%
Weighted average 69,668 20.4 12.9 11.6 9.7 7.0 6.4 3.77 3.10 2.56 27.6% 13.9%
Tigerair** TGR SP 0.28 488 Mar-15 - - 14.6 - 11.1 5.1 2.04 2.84 2.35 20.6% 7.1%
P/E EV/EBITDA P/BV
Note: Tigerair numbers are for four quarters ending December. Prices are as at 14 Sep 2015.
Source: Bloomberg, RHB
Figure 5: Tigerair - 1-year forward (unadjusted) EV/EBITDAR Figure 6: Tigerair - 1-year forward P/BV
Title:
Source:
Please fill in the values above to have them entered in your report
-
2.0
4.0
6.0
8.0
10.0
12.0
14.0
16.0
18.0
20.0
Jan-12 Jul-12 Jan-13 Jul-13 Jan-14 Jul-14 Jan-15 Jul-15
EV/ EBITDAR Avg. EV/ EBITDAR=9.1
-1 std=4.6 +1 std=13.6
Title:
Source:
Please fill in the values above to have them entered in your report
0.5
1.0
1.5
2.0
2.5
3.0
3.5
4.0
4.5
5.0
5.5
Feb-10 Feb-11 Feb-12 Feb-13 Feb-14 Feb-15
P/BV Avg. P/BV=2.9 -1 std=2.2 +1 std=3.7
Source: Bloomberg, company data, RHB Source: Bloomberg, company data, RHB

Tiger Airways (TGR SP)
15 September 2015
See important disclosures at the end of this report 6
What’s the worst case scenario?
The infusion of capital from SIA has helped strengthen Tigerair’s balance sheet. However, assuming the airline continues to report losses from its core operations in Singapore and with no fresh capital-raising undertaken, the LCC’s share price could fall to SGD0.13, which is our worst case estimate of its current book value.
Figure 7: Tigerair’s worst case book value estimate
RNAV assessment
Last
reported
Aircraft at market selling price SGDm 9.0 36.0 324.0 Assuming 20% discount to market selling price
Pre-payment, receivables & aircraft deposits (1QFY16) SGDm 159.0
Payables (1QFY16) SGDm (84.8)
Sales in advance (1QFY16) SGDm (67.7)
Net cash/(net debt) (1QFY16) SGDm 2.2
Total SGDm 332.7
Shares outstanding (1QFY16) m 2,497.5
Per share value SGD 0.13
Source: Company data, RHB
Risks to our rating and price target
Key downside risks include: i) a downturn in regional air travel demand from
macroeconomic or geopolitical events, ii) a slowdown in Singapore’s economic growth, iii) a rise in jet fuel prices, iv) continuing weakness in the SGD, and v) capital raising in case of continued losses from operations.
Key upside risks include: i) better-than-estimated yields, ii) a decline in jet fuel
prices, iii) more-than-estimated declines in operational and asset costs, iv) a rapid appreciation of the SGD vs. the USD, and v) consolidation of LCCs around the region, leading to a less-competitive environment.
Tiger Airways (TGR SP)
15 September 2015
See important disclosures at the end of this report 7
Got Rid Of Bleeding Overseas Ventures And Excess Aircraft
Struggling affiliates meant overcapacity in a mature Singapore market
In Jun 2007, Tigerair placed an order for 50 Airbus A320s, which included the purchase of 30 aircraft and the option to purchase another 20. In Dec 2007, the airline announced that it had taken up the options and made further orders to take the fleet of Airbus A320s to 70 in total.
Although the airline was confident that it would be able to establish and rapidly expand JV carriers throughout Asia, the expansion was hindered when – on several occasions – Tigerair was forced to put more-than-initially-anticipated aircraft in the Singapore market. This was because the new affiliates had been slow to launch operations and, subsequently, struggled to gain traction.
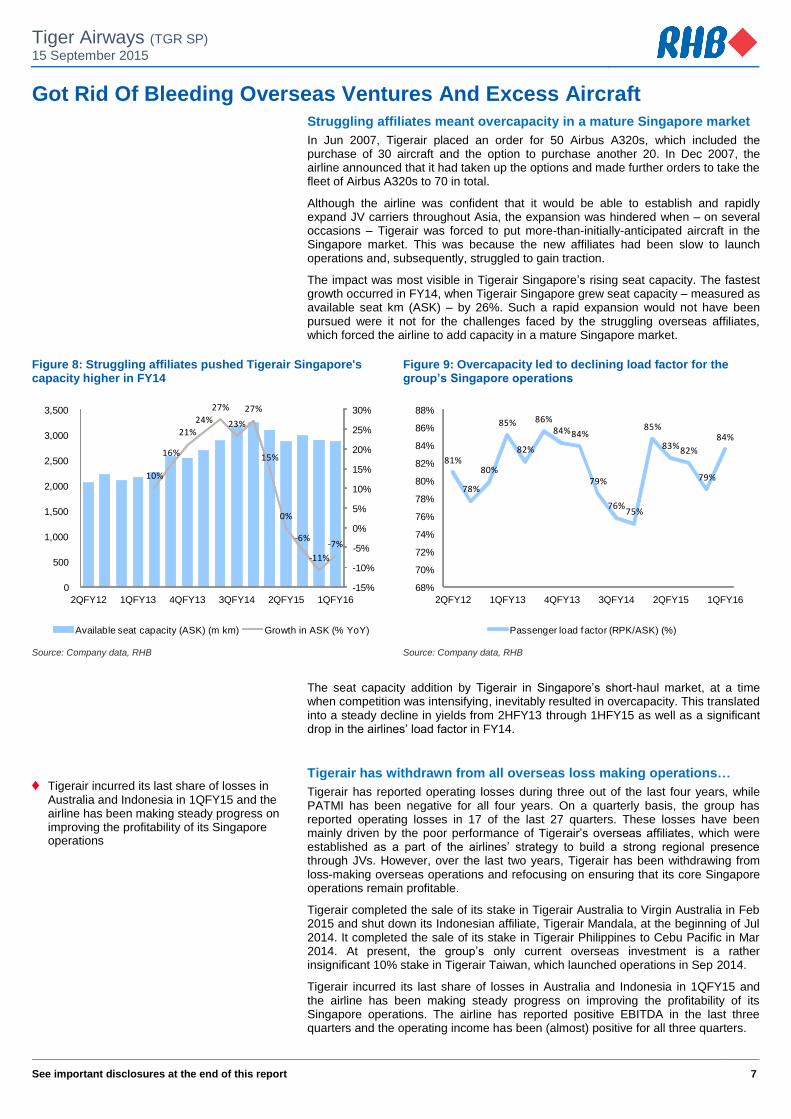
The impact was most visible in Tigerair Singapore’s rising seat capacity. The fastest growth occurred in FY14, when Tigerair Singapore grew seat capacity – measured as available seat km (ASK) – by 26%. Such a rapid expansion would not have been pursued were it not for the challenges faced by the struggling overseas affiliates, which forced the airline to add capacity in a mature Singapore market.
Figure 8: Struggling affiliates pushed Tigerair Singapore's capacity higher in FY14
Figure 9: Overcapacity led to declining load factor for the group’s Singapore operations
Title:
Source:
Please fill in the values above to have them entered in your report
10%
16%
21%
24%
27%
23%
27%
15%
0%
-6%
-11%
-7%
-15%
-10%
-5%
0%
5%
10%
15%
20%
25%
30%
0
500
1,000
1,500
2,000
2,500
3,000
3,500
2QFY12 1QFY13 4QFY13 3QFY14 2QFY15 1QFY16
Available seat capacity (ASK) (m km) Growth in ASK (% YoY)
Title:
Source:
Please fill in the values above to have them entered in your report81%
78%
80%
85%
82%
86%84%84%
79%
76%75%
85%
83%82%
79%
84%
68%
70%
72%
74%
76%
78%
80%
82%
84%
86%
88%
2QFY12 1QFY13 4QFY13 3QFY14 2QFY15 1QFY16
Passenger load factor (RPK/ASK) (%)
Source: Company data, RHB Source: Company data, RHB
The seat capacity addition by Tigerair in Singapore’s short-haul market, at a time when competition was intensifying, inevitably resulted in overcapacity. This translated into a steady decline in yields from 2HFY13 through 1HFY15 as well as a significant drop in the airlines’ load factor in FY14.
Tigerair has withdrawn from all overseas loss making operations…
Tigerair has reported operating losses during three out of the last four years, while PATMI has been negative for all four years. On a quarterly basis, the group has reported operating losses in 17 of the last 27 quarters. These losses have been mainly driven by the poor performance of Tigerair’s overseas affiliates, which were established as a part of the airlines’ strategy to build a strong regional presence through JVs. However, over the last two years, Tigerair has been withdrawing from loss-making overseas operations and refocusing on ensuring that its core Singapore operations remain profitable.
Tigerair completed the sale of its stake in Tigerair Australia to Virgin Australia in Feb 2015 and shut down its Indonesian affiliate, Tigerair Mandala, at the beginning of Jul 2014. It completed the sale of its stake in Tigerair Philippines to Cebu Pacific in Mar 2014. At present, the group’s only current overseas investment is a rather insignificant 10% stake in Tigerair Taiwan, which launched operations in Sep 2014.
Tigerair incurred its last share of losses in Australia and Indonesia in 1QFY15 and the airline has been making steady progress on improving the profitability of its Singapore operations. The airline has reported positive EBITDA in the last three quarters and the operating income has been (almost) positive for all three quarters.
Tigerair incurred its last share of losses in Australia and Indonesia in 1QFY15 and the airline has been making steady progress on improving the profitability of its Singapore operations

Tiger Airways (TGR SP)
15 September 2015
See important disclosures at the end of this report 8
We believe the sale and closure of Tigerair’s affiliates in Australia, Indonesia and the Philippines should improve the group’s outlook over the medium to long term. For a detailed discussion on Tigerair’s failed or abandoned overseas ventures, please look at Appendix 2.
…and has reduced its fleet size to a more realistic number
Subsequent to the overseas venture exits, Tigerair was left with a significant number of surplus aircraft that the Singapore operation could not absorb. In order to manage excess capacity, the airline proactively addressed its surplus aircraft issue through sub-lease arrangements, novation of aircraft leases and the disposal of aircraft.
Tigerair’s FY15 results were impacted by several one-off charges related to fleet adjustments, which became necessary as the group had to take back 14 aircraft that had earlier been operating in Indonesia and the Philippines. While Tigerair had sold its stake in Tigerair Philippines at the end of FY14, the group’s five aircraft that had been operating in the market were only returned to Tigerair in early FY15.
As the Singapore operations could not absorb the surplus aircrafts, Tigerair had to ground several A320s in FY15 while it tried to remarket the surplus aircraft. The group managed to forge a sub-lease agreement with Indigo, an Indian LCC, for 12 A320s, 10 of which were delivered in 2HFY15. The last two were delivered in the early part of FY16. However, because the market for used aircraft is weak, Tigerair had to sub-lease the aircraft at a lower rate and incurred a loss of around SGD110m in the transaction.
Tigerair has already sub-leased or placed three aircraft with Tigerair Australia, which is now owned and operated by Virgin Australia. In addition, the airline managed to sub-lease or place two A320s with Tigerair Taiwan by end-1QFY15. The rental rates for aircraft sub-leased to Tigerair Taiwan and Tigerair Australia are on a “back-to-back” basis, with the head leases entered into between the airline and third party lessors, whereby the sub-lease period matched the head lease duration.
Tigerair also cancelled the order for nine A320ceo (current engine option) aircraft, which were originally slated for delivery in FY15 and FY16. The cancellations were part of a deal with Airbus (AIR FP, NR) that was forged in Mar 2014, which included the placement of new orders for 37 A320neo (new engine option) aircraft plus an option to buy an additional 13 of this variant.
Despite the cancellation of order for the new A320ceos and sub-leasing of 17 aircraft, Tigerair continued to be saddled with excess capacity. The airline announced its plan to dispose of two A320s in FY16 and incurred a one-time charge of SGD17.5m in 4QFY15 to reflect the anticipated sale of these self-owned aircraft.
Tigerair now operates 25 aircraft, which includes 23 A320s and two A319s, one of which is grounded. The carrier plans to reactivate the grounded A319 to replace the two A320s, which have been earmarked for sale in FY16.
Figure 10: Tigerair’s current fleet details Figure 11: Fleet details as estimated at end-FY16
Aircraft In fleet Firm orders Options Passengers
per aircraft
Airbus A319 2 - - 144
Airbus A320ceo 23 - - 180
Airbus A320neo - 39 11
Total 25 39 11
Aircraft In fleet Firm orders Options Passengers
per aircraft
Airbus A319 2 - - 144
Airbus A320ceo 21 - - 180
Airbus A320neo - 39 11
Total 23 39 11
Source: Company data, RHB Source: Company data, RHB
Following the fleet rationalisation exercise, Tigerair’s operating fleet declined to 24 in 1QFY16 from 27 in 1QFY15. The fleet size is to be further reduced to 23 by end-FY16 following the proposed sale of two A320s. We estimate for Tigerair’s fleet strength to remain unchanged at 23 till 2QFY18.
Long-term fleet challenges still remain though
We believe managing a fleet of 23 aircraft in a relatively mature Singapore market seems more realistic when compared to 27 aircraft that Tigerair was operating at the start of 1QFY15 when its elevated capacity levels exceeded demand. However, the airline faces long-term fleet challenges as it is now committed to 39 new A320neo aircraft for delivery from 2018.
12 aircraft were sub-leased to Indigo, an Indian LCC, at a discounted lease rate
Tigerair managed to sub-lease or place two A320s with Tigerair Taiwan by end-1QFY15
Cancelled the order for nine A320ceo aircraft, which were originally slated for delivery in FY15 and FY16
Planned delivery of 39 A320neos in 2018-2025 and return of 11 A320ceos in 2018-2019, which were sub-leased to Indigo, would lead to excess fleet capacity starting FY19
Tiger Airways (TGR SP)
15 September 2015
See important disclosures at the end of this report 9
In addition, the 12 aircraft that have been placed with Indigo have been sub-leased for between 3-4 years and would be returned to Tigerair starting late FY18.
Among the 12 aircraft sub-leased to Indigo, the lease for one is expiring in 2018. Hence, only 11 aircraft are to be returned to Tigerair following the expiry of the sub-lease period. Post their return, the airline plans to induct seven aircraft into its operating fleet, while four are to be stored and progressively reintroduced to the service network within two years.
We believe Tigerair could struggle to find markets for all 39 A320neos. Singapore has limited growth opportunities and is unlikely to support more than 25 aircraft – at most 30 – from the airline.
As Tigerair does not have any plans to re-establish a portfolio of overseas affiliates, we believe the airline is likely to have limited alternatives for placing the excess A320neos. Tigerair no longer has any stakes in Tigerair Australia and Tigerair Philippines, both of which could be rebranded in FY16. Tigerair Taiwan has also indicated that it plans to source its future aircraft outside the group, which only has a 10% stake in Taiwanese carrier and, therefore, has limited influence on its fleet decisions.
Placing the excess A320neos at another SIA subsidiary is also not a possibility as SilkAir is transitioning its fleet to Boeing’s 737s from A320s. Although Vistara, SIA’s latest JV carrier in India, operates a fleet of A320s, it has already committed to acquiring 20 A320s from BOC Aviation Pte Ltd.
Unless Tigerair manages to expand operations beyond Singapore, which is not the plan at present, the airline might have to consider: i) storing excess aircraft until it manages to sub-lease them, and/or ii) the early disposal of its self-owned aircraft or early termination of lease for leased aircraft in order to gradually replace its old A320ceo fleet with new A320neos. However, either of these options would lead to elevated costs or one-time charges, which would drag earnings starting from FY19.
The Singapore market can support a maximum of 30 aircraft from Tigerair
SilkAir, the regional wing of SIA, is transitioning to an all Boeing 737 fleet, while SIA’s Indian JV has already committed to acquiring 20 A320s

Tiger Airways (TGR SP)
15 September 2015
See important disclosures at the end of this report 10
Yield Recovery And Lower Unit Cost To Help Improve Profits
Route rationalisation and terminations has reduced capacity
Tigerair began slowing its expansion in FY14 and this continued into FY15. Capacity and network cuts were implemented throughout FY15, with total ASK declining 9.3% YoY to 11,812m km. The decline in ASK continued into early FY16 with ASK declining 7.2% YoY in 1QFY16.
The Centre for Asia Pacific Aviation (CAPA) reported that, in FY15, Tigerair launched four routes and axed seven as the airline rationalised its network. Although Tigerair began FY15 with 39 routes, it ended the year with 36 and connected Singapore with 13 Asian countries.
In August, the airline announced plans to commence scheduled flights to Quanzhou in China and Lucknow in India from 28 Sep 2015 and 3 Dec 2015 respectively. Based on Tigerair’s year-end operating fleet, and including these newly-announced routes, we estimate for the airline’s year-end seat capacity to be at 6,015 thousand seats, which is 5% lower than end-FY15’s 6,339 thousand seats.
Figure 12: Singapore LCC market share in May 2014 Figure 13: Singapore LCC market share in May 2015
Title:
Source:
Please fill in the values above to have them entered in your report
Tigerair, 33%
Jetstar, 21%
AirAsia, 26%
Scoot, 8%
Lion Air, 5%
Cebu Pacif ic, 4%
Others, 3%
Title:
Source:
Please fill in the values above to have them entered in your report
Tigerair, 29%
Jetstar, 25%
AirAsia, 23%
Scoot, 9%
Lion Air, 7%
Cebu Pacif ic, 5%
Others, 2%
Source: Centre for Asia Pacific Aviation (CAPA), RHB Source: CAPA, RHB
Figure 14: Load factors should gradually improve to 85%... Figure 15: ...while yield could grow at 1.2-1.5% pa over next three years
Title:
Source:
Please fill in the values above to have them entered in your report
81%
86% 86%
81%
84%
79%
82%
84%
85% 85%
74%
76%
78%
80%
82%
84%
86%
88%
0
2,000
4,000
6,000
8,000
10,000
12,000
14,000
FY09 FY10 FY11 FY12 FY13 FY14 FY15 FY16 FY17 FY18
Available seat capacity (m km) Passenger load factor (%)
Title:
Source:
Please fill in the values above to have them entered in your report
-0.3%
5.5%
-5.1%
9.2%
-11.2%
-2.6%
1.2% 1.5% 1.3%
-15%
-10%
-5%
0%
5%
10%
15%
6.2
6.4
6.6
6.8
7.0
7.2
7.4
7.6
7.8
8.0
FY09 FY10 FY11 FY12 FY13 FY14 FY15 FY16 FY17 FY18
Revenue per RPK (SGD cents) Growth (YoY %)
Source: Company data, RHB Source: Company data, RHB
We expect Tigerair to maintain discipline on capacity expansion. Despite the decline in the average number of aircraft to 24 in FY16 and 23 by FY17 from 25 in FY15, we expect unit capacity as defined by ASK (available seat kilometres) to increase by 1.3% in FY16 and remain unchanged in FY17. The increase in ASK will be aided by 3% YoY improvement in average distance flown by an aircraft. Tigerair will offer
Tiger Airways (TGR SP)
15 September 2015
See important disclosures at the end of this report 11
flights to new destinations in China and India in FY16. Note that in 1Q16, Tiger saw an increase in utilisation hours of 8.8% YoY (to 12.2 hours).
Strong capacity discipline should provide a lift to Tigerair’s yield (we estimate an improvement of 1.2% and 1.5% yields for FY16 and FY17 respectively), while load factor is assumed to recover to 84% in FY16 and 85% in FY17 from 82% in FY15.
Improvement in yields and load factor already visible
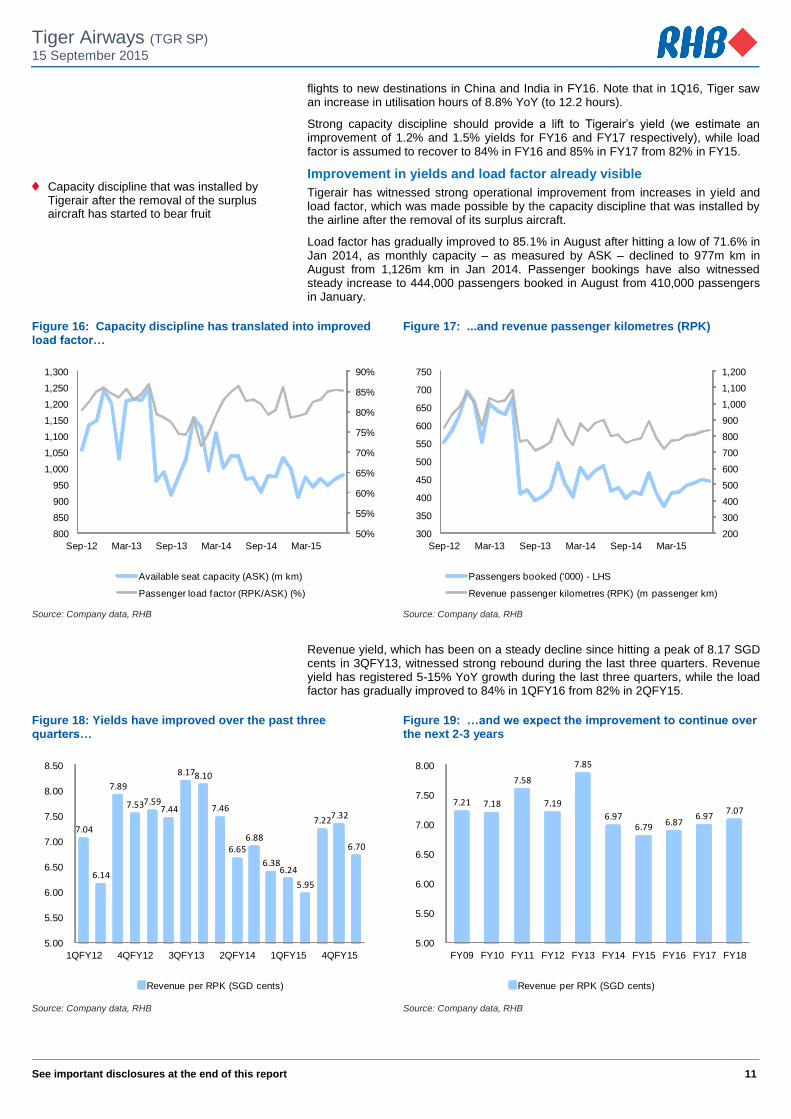
Tigerair has witnessed strong operational improvement from increases in yield and load factor, which was made possible by the capacity discipline that was installed by the airline after the removal of its surplus aircraft.
Load factor has gradually improved to 85.1% in August after hitting a low of 71.6% in Jan 2014, as monthly capacity – as measured by ASK – declined to 977m km in August from 1,126m km in Jan 2014. Passenger bookings have also witnessed steady increase to 444,000 passengers booked in August from 410,000 passengers in January.
Figure 16: Capacity discipline has translated into improved load factor…
Figure 17: ...and revenue passenger kilometres (RPK)
Title:
Source:
Please fill in the values above to have them entered in your report
50%
55%
60%
65%
70%
75%
80%
85%
90%
800
850
900
950
1,000
1,050
1,100
1,150
1,200
1,250
1,300
Sep-12 Mar-13 Sep-13 Mar-14 Sep-14 Mar-15
Available seat capacity (ASK) (m km)
Passenger load factor (RPK/ASK) (%)
Title:
Source:
Please fill in the values above to have them entered in your report
200
300
400
500
600
700
800
900
1,000
1,100
1,200
300
350
400
450
500
550
600
650
700
750
Sep-12 Mar-13 Sep-13 Mar-14 Sep-14 Mar-15
Passengers booked ('000) - LHS
Revenue passenger kilometres (RPK) (m passenger km)
Source: Company data, RHB Source: Company data, RHB
Revenue yield, which has been on a steady decline since hitting a peak of 8.17 SGD cents in 3QFY13, witnessed strong rebound during the last three quarters. Revenue yield has registered 5-15% YoY growth during the last three quarters, while the load factor has gradually improved to 84% in 1QFY16 from 82% in 2QFY15.
Figure 18: Yields have improved over the past three quarters…
Figure 19: …and we expect the improvement to continue over the next 2-3 years
Title:
Source:
Please fill in the values above to have them entered in your report
7.04
6.14
7.89
7.53 7.59 7.44
8.17 8.10
7.46
6.65 6.88
6.38 6.24
5.95
7.22 7.32
6.70
5.00
5.50
6.00
6.50
7.00
7.50
8.00
8.50
1QFY12 4QFY12 3QFY13 2QFY14 1QFY15 4QFY15
Revenue per RPK (SGD cents)
Title:
Source:
Please fill in the values above to have them entered in your report7.21 7.18
7.58
7.19
7.85
6.97 6.79 6.87
6.97 7.07
5.00
5.50
6.00
6.50
7.00
7.50
8.00
FY09 FY10 FY11 FY12 FY13 FY14 FY15 FY16 FY17 FY18
Revenue per RPK (SGD cents)
Source: Company data, RHB Source: Company data, RHB
Capacity discipline that was installed by Tigerair after the removal of the surplus aircraft has started to bear fruit

Tiger Airways (TGR SP)
15 September 2015
See important disclosures at the end of this report 12
Low fuel prices and a decline in high fuel price hedge to keep costs low
In line with global crude oil prices, jet fuel price has been on a decline. Intuitively, this should be positive for the profitability of airline companies. However, most carriers globally maintain a hedging policy and Tigerair is no different. The group only started providing details of its fuel hedging policy in 4QFY15.
As at end of 1QFY16, Tigerair had hedged 40% of its jet fuel requirement for the next 15 months at USD87 per bbl. As the hedged fuel price is higher than spot prices, the carrier would have to incur losses as it unwinds/rolls forward the hedging position. However, management highlighted that the airline would continue to hedge 40-60% of its forward fuel requirements, implying that subsequent fuel hedges would be at a lower price. This should help Tigerair to maintain lower unit fuel costs as it optimises its route network and fleet. We expect total fuel cost as a percentage of reported revenue to decline to 33% in FY16 from 43% in FY15 and eventually drop to 29% in FY17.
Figure 20: Jet fuel prices have dropped and are expected to stay low for some time
Figure 21: Lower jet fuel prices should help improve operating margins
Title:
Source:
Please fill in the values above to have them entered in your report
0
20
40
60
80
100
120
140
160
1QFY09 2QFY10 3QFY11 4QFY12 1QFY14 2QFY15 3QFY16 4QFY17
Jet fuel spot (Singapore) (USD/barrel)
Jet fuel spot (Singapore) - forecast (USD/barrel)
Title:
Source:
Please fill in the values above to have them entered in your report
74 123 199 182 226 289 364 338 293 241 221 233
43%41%
53%
37% 36%
47%
42%45%
43%
33%29% 29%
0%
10%
20%
30%
40%
50%
60%
0
50
100
150
200
250
300
350
400
FY07 FY09 FY11 FY13 FY15 FY17
Fuel cost (SGDm) Fuel cost (% of revenue) (%)
Source: Bloomberg, RHB Source: Company data, RHB
We estimate spot price for jet fuel to decline 26% YoY to SGD94 per bbl in FY16. However, due to Tigerair’s high fuel price hedge, the net jet fuel price paid by the airline would decline only by 23% to SGD108 per bbl. This should translate into 18% YoY decline in fuel costs. The total fuel cost is expected to decline further by 8% in FY17, largely in line with our expectations of further declines in jet fuel prices.
Figure 22: Operating cost split for FY15 Figure 23: Subsequent jet fuel hedges at current low prices should ensure that costs remain under control
Title:
Source:
Please fill in the values above to have them entered in your report
Fuel cost, 41%
Staf f cost, 12%
Aircraf t rental, 10%
Airport & handling, 12%
Maintenance & repair, 11%
Route charges, 3%
Marketing costs, 3% D&A,
5%
Others, 4%
Title:
Source:
Please fill in the values above to have them entered in your report
143
120
135
161 156
152
128
94 89
99
106 111
157
136 133
157 154
151
141
109
101 102 106
109
80
90
100
110
120
130
140
150
160
170
FY09 FY10 FY11 FY12 FY13 FY14 FY15 FY16 FY17 FY18 FY19 FY20
Jet fuel assumption SGD/barrel
Jet fuel price paid (net) SGD/barrel
Source: Company data, RHB Source: Bloomberg, Company data, RHB

Tiger Airways (TGR SP)
15 September 2015
See important disclosures at the end of this report 13
To Benefit From Its Growing Relationship With SIA SIA becoming the largest shareholder of Tigerair is one of the key elements for a decisive turnaround and future sustainable growth for the LCC. The airline would not only benefit from the scale and network connectivity of SIA and its affiliates, but also gain on cost efficiencies by building a deeper cooperation with Scoot, the latter’s LCC for medium- and long-haul routes.
Leveraging on Scoot’s complementary network
The market for budget air travel in Asia has moved past the initial years of high growth and it is becoming increasingly crowded with the entry of new LCCs and expanding fleet size of the existing budget carriers. The abandoning of its “cub strategy” and the selling/closing down its overseas ventures imply that Tigerair is likely to struggle to expand by only providing point-to-point flights from its Singapore base. We believe partnerships would be needed to sustain growth and we see Scoot as a natural partner, since its Singapore base and complimentary medium- to long-haul network provides the greatest potential for connecting traffic.
Since the Competition Commission of Singapore granted anti-trust immunity in Aug 2014, Tigerair and Scoot have been working hard to build revenue synergies, particularly by connecting passengers to each other’s networks. Tigerair highlighted that it has witnessed many travellers connecting from Scoot’s Australia and North-East China points to Tigerair’s South-East Asia points. Without stating the financial impact of the benefits, Tigerair, in a January press release, highlighted that it had witnessed a doubling of passengers connecting between the two airlines due to co-ordinated joint promotions and the launch of new itineraries only available by combining the routes of both Tigerair and Scoot.
We believe that JV agreements on routes that both budget carriers operate, such as Hong Kong and Bangkok, would result in better performances for the two airlines as both would be able to meet the competition with their combined strength.
Co-operation with Scoot is not limited to network
In addition to connecting passengers to each other’s networks, Tigerair and Scoot are also in discussions to leverage on other synergies. Beyond coordination on promotions, distribution and networks, both airlines could also explore opportunities for deeper cooperation, including common ground handling, procurement and service centres.
As both airlines operate out of the same terminal at Singapore’s Changi Airport, we believe it makes sense for the two parties to potentially combine their facilities at the terminal. Tigerair and Scoot both use the same computer reservation system, and management highlighted that the merging of the two systems into one would result in more seamless transactions for its passengers and lead to higher cost efficiencies. We believe benefits from such cost synergies would start becoming visible from FY16 onwards.
It is not all about Scoot, getting help from KrisFlyer too
Tigerair’s integration with SIA is not only with Scoot. The LCC is also benefitting from its participation in SIA’s frequent flyer programme, KrisFlyer. Since April, members of
this programme can redeem miles for vouchers to travel on Tigerair flights.
Figure 24: Redemption of KrisFlyer miles for Tigerair vouchers
KrisFlyer miles required for redemption Value of voucher (SGD)
3,200 30
5,300 50
10,500 100
Source: SIA, RHB
While we believe that Tigerair’s relationship with SIA and its affiliates has started to make positive contributions to the LCC’s operations, management has not yet ascribe a monetary value to the benefits. Tigerair continues to explore additional opportunities for synergies with SIA in commercial, operations and other areas of business, benefits of which are likely to continue to be visible over the next few years.
SIA becoming the largest shareholder of Tigerair is one of the key elements for a decisive turnaround and future sustainable growth of the LCC
Tigerair, in a January press release, highlighted that it has witnessed a doubling of passengers connecting between itself and Scoot
Cost synergies from common ground handling, procurement, service centres and a merged single reservation system will start becoming visible from FY16

Tiger Airways (TGR SP)
15 September 2015
See important disclosures at the end of this report 14
Witnessing A Financial Turnaround
Witnessing a turnaround, growth to sustain for at least two years
Tigerair’s focus on capacity discipline, either through the disposal or sub-leasing of surplus aircraft, has started to pay off. Evidence of this was visible in the last three quarters.
On a full-year basis, the airline has been reporting operating losses for the past two financial years. However, the airline reported operating income of SGD4.1m in 3QFY15, followed by a marginal operating loss of SGD2.3m in 4QFY15 and an operating income of SGD600,000 in 1QFY16. This was in sharp contrast with operating losses of SGD8.8m-24.2m during the same quarters a year ago.
While we expect 2QFY16 to be a weak quarter due to seasonality, we estimate for the airline to return to full-year profitability with operating incomes of SGD31m and SGD65m in FY16 and FY17 respectively.
As most one-time charges have already been booked by the airline during the precious financial years, we expect the operating income to translate into a positive PATMI of SGD22 in FY16. FY16 could be the first profitable year for Tigerair after consecutive years of losses. Consensus estimates are even more bullish, with street expecting the carrier to report a profit of SGD36m in FY16.
Figure 25: After a series of volatile quarters, Tigerair's quarterly EBITDAR has stabilised above SGD25m
Figure 26: Tigerair should witness strong improvement in EBITDAR
Title:
Source:
Please fill in the values above to have them entered in your report
14.7 16.2
44.7
40.4
22.8
8.9
14.2
0.1
10.1
(2.0)
28.0 29.4 30.0
(10.0)
-
10.0
20.0
30.0
40.0
50.0
1QFY13 3QFY13 1QFY14 3QFY14 1QFY15 3QFY15 1QFY16
EBITDAR (SGDm)
Title:
Source:
Please fill in the values above to have them entered in your report
25.6
62.6
13.3
96.4
122.3
9.7
116.1
46.0
65.6
152.3
192.1
212.9
-
50.0
100.0
150.0
200.0
250.0
FY07 FY09 FY11 FY13 FY15 FY17
EBITDAR (SGDm)
Source: Company data, RHB Source: Company data, RHB
Figure 27: FY14 and FY15 were the years of kitchen sinking Figure 28: Tigerair should report profit in FY16 after four consecutive years of losses
Title:
Source:
Please fill in the values above to have them entered in your report(13.7)(18.3)
2.0
(15.4)
(32.8)
23.8
(118.5)
(95.5)
(65.2)
(182.4)
2.2
(18.8)
(1.7)
(200.0)
(150.0)
(100.0)
(50.0)
-
50.0
1QFY13 3QFY13 1QFY14 3QFY14 1QFY15 3QFY15 1QFY16
PATMI (clean) (SGDm)
Title:
Source:
Please fill in the values above to have them entered in your report
(14.8)
9.9
(50.8)
28.2 39.9
(98.8)
(45.4)
(223.0)
(264.2)
21.8
55.0 65.1
(300.0)
(250.0)
(200.0)
(150.0)
(100.0)
(50.0)
-
50.0
100.0
FY07 FY09 FY11 FY13 FY15 FY17
PATMI (clean) (SGDm)
Source: Company data, RHB Source: Company data, RHB
Consensus estimates are even more bullish and street expects Tigerair to report a profit of SGD36m in FY16

Tiger Airways (TGR SP)
15 September 2015
See important disclosures at the end of this report 15
We expect Tigerair to sustain strong earnings growth for at least two years, before the risks related to the overcapacity issue arising from addition of new A320neos and the return of aircraft from Indigo starts impacting yields and load factor.
Re-capitalised balance sheet with a strong shareholder
Tigerair has undertaken multiple rights share issues over the past 5-6 years, raising a total of about SGD675m. The latest rights share issue was undertaken in 2014, which helped to raise SGD27m and ensured that the airline had sufficient balance sheet strength to keep looking at selected growth opportunities in terms of network expansion. As at end 1QFY16, Tigerair has a total cash balance of SGD300m and a net cash position of SGD2.2m. As the group starts reporting positive earnings from FY16 and keeps growing its EBITDA, we expect the airline to gradually grow its net cash position to SGD116m by end FY16.
Figure 29: Aided by strong turnaround in operations, we expect Tigerair's EBITDA to witness strong growth
Figure 30: Tigerair should return to a strong net cash position in the next 2-3 years
Title:
Source:
Please fill in the values above to have them entered in your report
(13.5)
8.0
(47.4)
26.6
59.9
(52.0)
41.3
(17.9)
(3.0)
72.9
108.0 119.3
(80.0)
(60.0)
(40.0)
(20.0)
-
20.0
40.0
60.0
80.0
100.0
120.0
140.0
FY07 FY09 FY11 FY13 FY15 FY17
EBITDA (SGDm)
Title:
Source:
Please fill in the values above to have them entered in your report
31 6 88 5 345 423 397 188
(3) (116)(196)(296)
-58%
-15%
-80%
3%
177%170%
200%
68%
-1%
-46%-64%
-80% -100%
-50%
0%
50%
100%
150%
200%
250%
(400.0)
(300.0)
(200.0)
(100.0)
0.0
100.0
200.0
300.0
400.0
500.0
FY07 FY09 FY11 FY13 FY15 FY17
Net debt/(cash) (SGDm) Net debt or (net cash)/equity %
Source: Company data, RHB Source: Company data, RHB
SIA’s shareholding in Tigerair was diluted to 32.7% post the LCC’s IPO in 2010. The former had earlier held a 49% stake in the latter. In 2013, SIA increased its stake in Tigerair to 40% following the acquisition of 7.3% stake from Temasek Holdings for SGD49m. In Dec 2014, SIA converted 189m of its perpetual securities, raising its stake in Tigerair to 55.8% from the aforementioned 40%, thereby becoming the single largest shareholder of Tigerair. We had earlier, in this note, highlighted the operational and commercial benefits of having SIA as the single-largest shareholder of Tigerair.
A quick history of Tigerair’s capital raising activity:
In 2011, Tigerair issued 273.2m new shares a part of a right share issue that raised gross proceeds of SGD158m. Each rights share was priced at SGD0.58, on the basis of one rights share for every two existing ordinary shares.
In 2013, the airline completed a rights issue and issued 164.2m new shares, raising SGD76m in gross proceeds. The right issue was priced at SGD0.47 for each rights share, on the basis of one rights share for every five ordinary shares.
In 2013, Tigerair also completed a non-renounceable preferential offering and issued 205.3m perpetual convertible securities for a net proceed of SGD218m. The perpetual convertible securities holders had the right to convert their securities into ordinary shares of the company. They also had the right to received ordinary distribution of 2% pa for the first five years.
In 2014, Tigerair announced a renounceable non-underwritten rights issue. Existing shareholders were given the opportunity to subscribe for 85 rights shares for every 100 existing shares at an issue price of SGD0.20. The completion of the rights issue led to an issuance of 1,147m rights shares and helped the airline to raise SGD227m.

Tiger Airways (TGR SP)
15 September 2015
See important disclosures at the end of this report 16
Costs to increase if SGD continues to weaken against the USD
We estimate that at least 60% of Tigerair’s costs are denominated in USD. These include fuel, and aircraft rental and maintenance costs. However, by comparison, as the airline largely operates out of a Singapore hub, the majority of its revenue remains denominated in SGD. As the group reports its financials in the local currency, a weakening of SGD against the USD would further push up costs and could impact its earnings recovery.
Figure 31: The impact of a weaker-than-estimated SGD against the USD
FY16 FY17
USDSGD x 1.40 1.43
PATMI SGDm 21.8 55.0
Aditional 1% weakening SGD 1.41 1.44
Revised PATMI SGDm 19.0 50.6
% change % -13% -8%
Source: RHB
Although we believe our exchange rate assumptions for the SGD against the USD are already quite conservative, we estimate that an additional 1% weakening in the SGD against the greenback would lower our FY16 and FY17 earnings by 13% and 8% respectively. We think that the actual impact might be smaller than our estimate, though, as some of Tigerair’s revenue is denominated in USD while we have assumed all revenue to be denominated in SGD. In addition, the group hedges its USD exposure, but does not publically disclose the hedged price for the SGD against the greenback.
Rise in jet fuel prices could also throw Tigerair off its recovery track
We expect crude oil prices and, hence, the price of jet fuel, to stabilise at around the current levels for rest of the year and to decline further next year. Our regional oil and gas analyst expects crude oil price (Brent) to average at USD53.30/bbl for 2015, and USD50/bbl for 2016. In line with this, we estimate for jet fuel prices (after taking into account the hedge positions) for Tigerair to average at SGD94/bbl (USD67.2/bbl) in FY16 and SGD89.2/bbl (USD62.6/bbl) in FY17.
Our underlying estimation of a turnaround in Tigerair’s fortunes in FY16 is strongly rooted in oil prices remaining low. This is mainly because fuel accounts for 40% of the airline’s total cost. In addition, the group has hedged 40% of its next 15 month’s fuel requirement at USD87/bbl (estimated USD122/bbl). Hence, a sharp rebound in jet fuel prices could throw Tigerair off its strong earnings recovery track. While a 5% rise in jet fuel price from our underlying assumption would lower the airline’s FY16 and FY17 profits by 28% and 10% respectively, we would like to highlight that Tigerair would still continue to remain profitable, albeit with smaller profits. This is thanks to strong improvements in its capacity discipline and operational capabilities.
Figure 32: The impact of higher jet fuel prices
FY16 FY17
Jet fuel price SGD per barrel 94.0 89.2
PATMI SGDm 21.8 55.0
5% rise in jet fuel price 98.7 93.7
Revised PATMI SGDm 15.6 49.4
% change % -28% -10%
Source: RHB
Revised aggressive depreciation policy to help keep the fleet young
Tigerair announced that, at the end of FY15, it changed its accounting policies for the depreciation and maintenance of aircraft. The airline also made changes to the estimated residual value of its aeroplane fleet. The useful life of an owned aircraft was shortened to 15 years (from 23) while the residual value was adjusted to 10% of the original cost (from 15% previously). Tigerair also reassessed and reviewed the provisions for maintenance expenses at a leased aircraft’s return. Although the change in the accounting policies are likely to lead to higher annual costs moving forward, we believe the changes ought to ensure that the airline remains competitive against its regional peers by operating a relatively young and fuel-efficient aircraft fleet.
We think that the actual impact might be smaller than our estimate. This is because some revenue is denominated in USD and, although Tigerair hedges its greenback exposure, it does not publically disclose the hedge price
Tigerair can still generate positive EPS in FY16 if jet fuel prices increase 5% in SGD terms

Tiger Airways (TGR SP)
15 September 2015
See important disclosures at the end of this report 17
A Quick Comparison With Regional LCCs
Figure 33: Available seat capacity measured (in bn km) Figure 34: Load factor comparison among ASEAN LCCs
Title:
Source:
Please fill in the values above to have them entered in your report28
33 35
37 40
41
10 13
15
18 21
23
3 4 5 6 7 7
10 13 13
12 12 12
-
5
10
15
20
25
30
35
40
45
FY12 FY13 FY14 FY15F FY16F FY17F
AirAsia Asia Aviation Nok Air Tigerair
Title:
Source:
Please fill in the values above to have them entered in your report
80%80%
79% 79%79%
80%
82%
84%
81%81%
80%
81%
84% 84% 81% 82% 83% 83%
81%
84%
79%
82%
84%
85%
74%
76%
78%
80%
82%
84%
86%
FY12 FY13 FY14 FY15F FY16F FY17F
AirAsia Asia Aviation Nok Air Tigerair
Source: Company data, RHB Source: Company data, RHB
Company Background Tigerair is a LCC based in Singapore. It was originally founded on 12 Dec 2003 by a consortium that included SIA, Indigo Partners, Irelandia Investments and Temasek Holdings. The group formerly held sizeable majority and minority stakes in a number of Tigerair branded JVs in the Philippines, Indonesia and Australia. As these overseas JVs had been pulling down Tigerair’s performance for several years, the group has withdrawn from such ventures, choosing instead to consolidate its airline operations in Singapore. It has even dropped its regional expansion strategy. Today, Tigerair is majority owned by SIA (56%) and the LCC only holds a minority (10%) stake in Tigerair Taiwan, where China Airlines is the JV partner. The stock has been listed on the Singapore Exchange since 22 Jan 2010.
Tigerair operates two narrow body aircraft types, the Airbus A319 and A320, offering single class economy seating of 144 and 180 seats respectively. As at end 1QFY16, the group operates a fleet of 25 aircraft, of which 23 A320s and one A319 are in operation while one A319 is stored, but would be put into service in the current financial year.
Figure 35: Tigerair's revenue split in FY15 Figure 36: Tigerair’s aircraft fleet details
Title:
Source:
Please fill in the values above to have them entered in your report
Passenger revenue
77%
Ancillary revenue
22%
Lease rental income
1%
Aircraft In fleet Firm orders Options Passengers
per aircraft
Airbus A319 2 - - 144
Airbus A320ceo 23 - - 180
Airbus A320neo - 39 11
Total 25 39 11
Source: Company data, RHB Source: Company data, RHB

Tiger Airways (TGR SP)
15 September 2015
See important disclosures at the end of this report 18
Figure 37: Tigerair’s Top 10 shareholders Figure 38: Tigerair’s key management personnel
Shareholder name % holding
SIA 55.8%
Vanguard Group 0.5%
Low Check Kian 0.3%
Blackrock 0.3%
Teachers Advisors 0.2%
Norges Bank 0.1%
State Street 0.0%
Hsieh Fu Hua 0.0%
Charles Schwab 0.0%
Chin Sak Hin 0.0%
Name Designation Experience in industry
Lee Lik Hsin CEO Previously: SIA Cargo
president and SIA senior
vice president corporate
planning
Vanessa Lau Man Yee CFO Previously: Brightoil
Petroleum oil tanker
business CFO and NOL
group financial controller
Ho Yuen Sang COO 20 years of experience in
the aviation sector
Mui Chee Wai Director: planning Previously: vice president
talent management and
development at SIA
Tommy Ng Yew Chye Director: human resource Over 30 years of experience
Teh Yik Chuan Director: sales & marketing Nine years with SIA in a
variety of functions
David Liew Director: corporate services 43 years of working
experience Source: Bloomberg, RHB Source: Company, RHB
Tiger Airways (TGR SP)
15 September 2015
See important disclosures at the end of this report 19
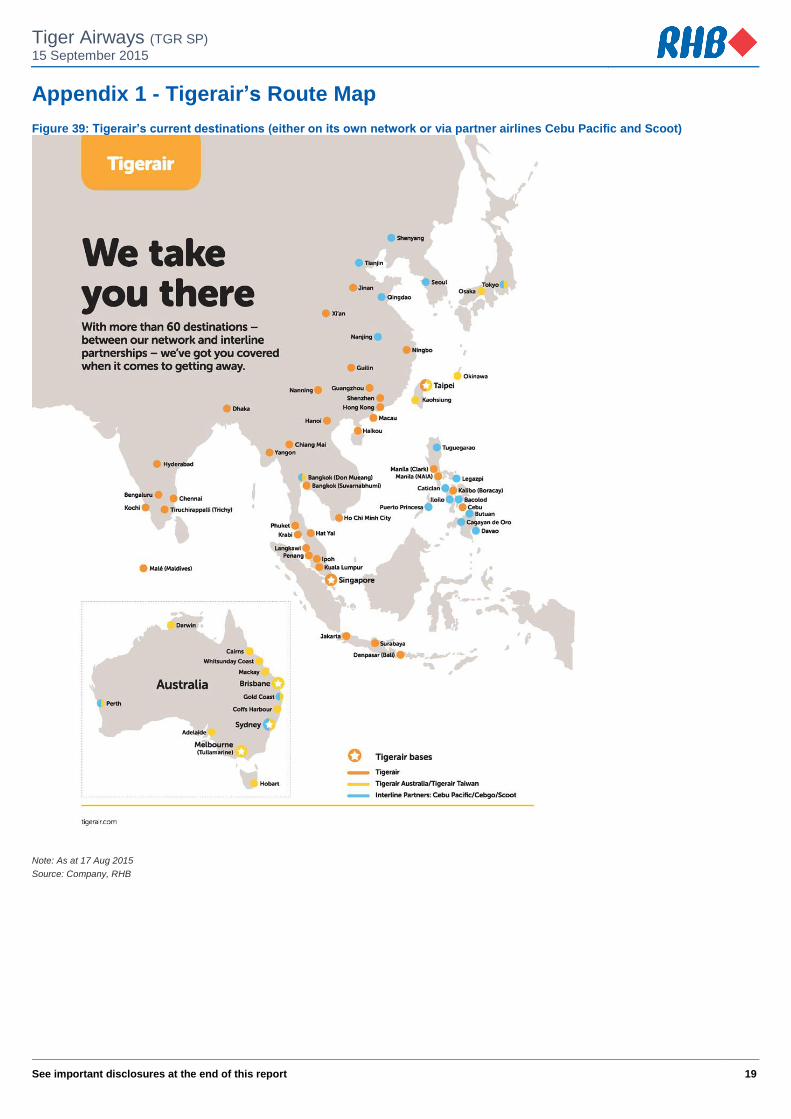
Appendix 1 - Tigerair’s Route Map
Figure 39: Tigerair’s current destinations (either on its own network or via partner airlines Cebu Pacific and Scoot)
Note: As at 17 Aug 2015
Source: Company, RHB

Tiger Airways (TGR SP)
15 September 2015
See important disclosures at the end of this report 20
Appendix 2 - Tigerair’s Flight Departures From Singapore
Figure 40: Tigerair's flight departures from its Singapore hub
Country City Monday Tuesday Wednesday Thursday Friday Saturday Sunday
Bangladesh Dhaka 1.0 1.0 1.0 1.0 1.0 1.0 1.0 7.0
China Guangzhou 2.0 2.0 2.0 2.0 2.0 2.0 2.0 14.0
China Guilin - - - - - 1.0 - 1.0
China Haikou - 1.0 - - - 1.0 - 2.0
China Nanning 1.0 - - - - 1.0 - 2.0
China Ningbo - 1.0 - - - 1.0 - 2.0
China Quanzhou 1.0 - - 1.0 - 1.0 - 3.0 Starting on 28 Sep 2015
China Shenzhen 1.0 1.0 1.0 - 1.0 1.0 - 5.0
China Xi An 1.0 1.0 - 1.0 1.0 1.0 - 5.0
Hong Kong Hong Kong 2.0 3.0 3.0 3.0 3.0 2.0 3.0 19.0
India Bangalore 1.0 1.0 1.0 1.0 1.0 1.0 1.0 7.0
India Chennai 2.0 1.0 2.0 2.0 2.0 1.0 1.0 11.0
India Hyderabad - 1.0 - - 1.0 1.0 1.0 4.0
India Kochi 1.0 - 1.0 - 1.0 - 1.0 4.0
India Lucknow - 1.0 - 1.0 - - 1.0 3.0 Starting on 3 Dec 2015
India Trichy 2.0 1.0 2.0 2.0 1.0 2.0 2.0 12.0
Indonesia Bali 2.0 2.0 2.0 2.0 2.0 2.0 2.0 14.0
Indonesia Jakarta 3.0 3.0 3.0 3.0 3.0 3.0 3.0 21.0
Indonesia Surabaya 1.0 - 1.0 1.0 1.0 - 1.0 5.0
Macau Macau 1.0 1.0 1.0 2.0 1.0 1.0 2.0 9.0
Malaysia Ipoh 1.0 1.0 1.0 - 1.0 - 1.0 5.0
Malaysia Kuala Lumpur 3.0 2.0 2.0 3.0 5.0 3.0 5.0 23.0
Malaysia Langkawi - 1.0 - - 1.0 - 1.0 3.0
Malaysia Penang 2.0 1.0 1.0 2.0 3.0 2.0 3.0 14.0
Maldives Male 1.0 - 1.0 - 1.0 - 1.0 4.0
Myanmar Yangon 1.0 - 1.0 - 1.0 1.0 1.0 5.0
Philippines Cebu 1.0 - - - - - - 1.0
Philippines Clark - 1.0 - 1.0 1.0 1.0 1.0 5.0
Philippines Kalibo 1.0 - 1.0 - 1.0 - 1.0 4.0
Philippines Manila 2.0 2.0 2.0 2.0 2.0 2.0 2.0 14.0
Taiwan Taipei 2.0 1.0 1.0 1.0 1.0 2.0 1.0 9.0
Thailand Bangkok 5.0 5.0 5.0 5.0 5.0 5.0 5.0 35.0
Thailand Chiang Mai - 1.0 - 1.0 - 1.0 - 3.0
Thailand Hat Yai 1.0 1.0 1.0 1.0 1.0 1.0 1.0 7.0
Thailand Krabi 1.0 1.0 1.0 1.0 1.0 1.0 1.0 7.0
Thailand Phuket 2.0 1.0 1.0 2.0 3.0 2.0 3.0 14.0
Vietnam Hanoi - 1.0 - - 1.0 1.0 1.0 4.0
Vietnam Ho Chi Minh City 3.0 2.0 2.0 2.0 4.0 3.0 4.0 20.0
48.0 42.0 40.0 43.0 53.0 48.0 53.0 327.0
Note: As at 31 Aug 2015
Source: RHB

Tiger Airways (TGR SP)
15 September 2015
See important disclosures at the end of this report 21
Appendix 3 – History Of (Failed) Overseas Expansions
Overseas expansions gone sour
Tigerair Australia. Tigerair Australia was formed as an Australian affiliate of Tigerair.
In Feb 2007, the group announced its intention to become Australia’s third full-scale domestic airline, competing with Virgin Australia and Qantas/Jetstar. Following the receipt of approval in Mar 2007, Tigerair Australia commenced operations in Nov 2007.
In 1QFY12, operations were marred by the ash cloud from Chile’s Puyehue-Cordón Caulle volcano, which disrupted Australian domestic air travel. This was followed by the 6-week suspension of Tigerair Australia’s operations by the Civil Aviation Safety Authority of Australia (CASA) between 2 Jul 2011 and 11 Aug 2011. Post removal of this suspension, Tigerair Australia reduced operations as it built up services at a measured pace. With the consolidation of operations into a single base at Tullamarine Airport (also known as Melbourne Airport), bases at Avalon Airport (one of Melbourne’s four airports) and Adelaide Airport (Adelaide) were closed.
Figure 41: Australian operations were hit badly in 2011 following a volcanic eruption in Chile and a 6-week suspension of services
Figure 42: While flight services resumed and grew following the disruptions in 2011, operations remained financially unviable
Title:
Source:
Please fill in the values above to have them entered in your report
0
50
100
150
200
250
300
350
400
450
0
50
100
150
200
250
300
350
May-11 Nov-11 May-12 Nov-12 May-13 Nov-13 May-14
Passengers booked ('000) - LHS
Revenue passenger kilometres (RPK) (m passenger km)
Title:
Source:
Please fill in the values above to have them entered in your report
0%
10%
20%
30%
40%
50%
60%
70%
80%
90%
100%
0
100
200
300
400
500
600
May-11 Dec-11 Jul-12 Feb-13 Sep-13 Apr-14
Available seat capacity (ASK) (m km)
Passenger load factor (RPK/ASK) (%)
Source: Company data, RHB Source: Company data, RHB
In 2012, in light of infrastructure constraints at Tullamarine Airport (and with an intention to develop its network), Tigerair Australia opened a base in Sydney. It also worked with Tullamarine Airport on airport expansion plans to cater for growth out of Melbourne.
However, the group’s Australian operations had always struggled to become financially viable. Therefore, in Jul 2013, Tigerair completed the sale of 60% of Tigerair Australia to Virgin Australia for a cash consideration of AUD35m. Accordingly, Tigerair Australia ceased to be a subsidiary of the group and became a JV instead. A gain on loss of control of subsidiary – which amounted to SGD106.1m – was recorded in the profit and loss statement on the date of divestment.
Amidst continuing difficulties in managing its Australian operations, Tigerair finally divested the balance 40% holding in Tigerair Australia to Virgin Australia in February 2015. Virgin Australia acquired the group’s 40% stake for a cash consideration of AUD1. With this, Tigerair Australia ceased to be a JV for the group. A loss on disposal of JV amounting to SGD37.1m was recorded in the profit and loss statement during the year. As a part of the deal, Virgin Australia would retain the Tigerair name and acquire the brand rights for Tigerair to operate to some international destinations from Australia. Going forward, the group continues to earn franchising income from Tigerair Australia.
Tigerair Mandala. Tigerair Mandala (formerly Mandala Airlines) was a LCC
headquartered in Jakarta, Indonesia. It was an associate company of the group. A former full-service airline, it had repositioned itself as a budget airline/LCC following a year-long grounding in 2011 caused by debt woes.
Tigerair Australia was fully sold to Virgin Australia
Tigerair Mandala’s share of losses in FY13 was SGD8m, which increased to SGD56m in FY14

Tiger Airways (TGR SP)
15 September 2015
See important disclosures at the end of this report 22
Mandala resumed operations in Apr 2012 following an injection of fresh capital by Indonesia’s Saratoga Investment Corp, which took an over 51% stake in the airline. Partner Tigerair took a 33% shareholding while the 16% balance was held by previous shareholders and creditors of Mandala.
Tigerair Mandala started operations in Apr 2012, with one domestic route between its home base in Jakarta and Medan, the capital of North Sumatra. This was followed by its first international destination when it launched the Medan-Singapore route in the same month. In May 2012, Tigerair Mandala flew to Kuala Lumpur from Jakarta.
In FY13, the group recognised its SGD8m in share of losses from Tigerair Mandala. The cumulative share of losses related to this associate amounted to SGD13.3m, as Tigerair’s share of losses had exceeded its net investment in Mandala. In FY14, the share of losses from Tigerair Mandala amounted to SGD56m.
Tigerair Mandala ceased all operations in Jul 2014 as it was not be able to sustain its operations and the airline’s key shareholders decided to cease funding the carrier. Before it ceased operations, Tigerair had a 35.8% stake in Tigerair Mandala.
Figure 43: Decline in number of passengers booked and RPK was in line with reduced capacity before Tigerair Mandala ceased operations
Figure 44: Amidst rising losses, Tigerair Mandala had started to gradually reduce capacity before it ceased operations in Jul 2014
Title:
Source:
Please fill in the values above to have them entered in your report
0
50
100
150
200
250
300
0
50
100
150
200
250
Sep-12 Jan-13 May-13 Sep-13 Jan-14 May-14
Passengers booked ('000) - LHS
Revenue passenger kilometres (RPK) (m passenger km)
Title:
Source:
Please fill in the values above to have them entered in your report
0%
10%
20%
30%
40%
50%
60%
70%
80%
90%
100%
0
50
100
150
200
250
300
350
400
450
Sep-12 Jan-13 May-13 Sep-13 Jan-14 May-14
Available seat capacity (ASK) (m km)
Passenger load factor (RPK/ASK) (%)
Source: Company data, RHB Source: Company data, RHB
Tigerair Philippines. Tigerair Philippines (formerly known as SEAir or South East
Asian Airlines) is a LCC headquartered in Manila, the Philippines. The airline was the Filipino affiliate of Tigerair. In 2006, although a deal was announced in which Tigerair would enter a commercial and operational tie-up with SEAir from Feb 2007, the plan was put into hiatus due to the unfavourable operating environment. Tigerair and SEAir revisited the partnership plan in 2010. In FY13, the group acquired a 40% equity interest in SEAir for a consideration of USD2.5m.
Since this acquisition, Tigerair Philippines has faced hurdles that hampered its expansion plans. Slots were not available at Manila’s Ninoy Aquino International Airport. The airline was also unable to gain traction in the Philippines market with a relatively small fleet of five aircraft. As the group did not foresee Tigerair Philippines turning profitable quickly with its small scale of operation, in Jan 2014, Tigerair entered into a strategic alliance with Cebu Pacific. As part of this alliance, Tigerair Philippines was divested to the latter.
This divestment exercise was completed in Mar 2014 and the group recorded a SGD29m loss on disposal of Tigerair Philippines. In FY13, Tigerair’s share of losses from Tiger Philippines amounted to SGD19m and the amount of losses remained unchanged in FY14.
Tigerair Philippines’ share of losses in FY13 and FY14 was SGD19m each. A loss of SGD29m was recorded on disposal of operations to Cebu Pacific

Tiger Airways (TGR SP)
15 September 2015
See important disclosures at the end of this report 23
Overseas ventures that never took off
Incheon Tiger. In Nov 2007, while Tigerair was looking to expand its presence in the
region under its “cub strategy”, the group announced that it would be starting a South Korea-based budget airline. Incheon Tiger was to have been a JV between Tiger Airways and Incheon Metropolitan City, with flights to destinations in Japan, China, Mongolia and the Russian Far East. The airline was to have been based in South Korea's Incheon International Airport and planned to begin services by 2009. However, the project was abandoned in Dec 2008 due to the worsening global economic situation. Regulatory problems in South Korea were also quoted as one of the reasons behind Tigerair’s decision to abandon the project.
Thai Tiger. Tigerair and Thai Airways International (Thai Airways) (THAI TB,
TRADING BUY, TP: THB15.58) had signed a memorandum of understanding in Aug 2010 with the aim of starting up a Bangkok-based LCC JV that was expected to begin operations by the first quarter of 2011. Thai Airways and Tigerair had expected to own 51% and 39% respectively of the newly-formed airline, while Ryanthai Ltd would hold the remaining 10%. The group subsequently dropped its plan to set up the JV after failing to get the necessary investment approvals from the Thai Government. As a result, in Dec 2011, Thai Airways, Tigerair and Ryanthai decided not to proceed with the incorporation of Thai Tiger.
Regional partnerships that were later cancelled
SpiceJet (India). In Dec 2013, Tigerair announced a 3-year interline agreement with
SpiceJet Ltd, India’s preferred low fare airline, which paved the way for greater connectivity between flights operated by both carriers.
Starting from 1 Jan 2014, customers travelling on SpiceJet’s domestic network from 14 Indian cities could seamlessly connect through Hyderabad’s Rajiv Gandhi International Airport onto Tigerair’s Singapore-bound flights. In the same way, starting from 31 Jan 2014, Tigerair customers from Singapore were able to get easy access to SpiceJet’s wide domestic Indian network. The 14 Indian cities were Ahmadabad, Bhopal, Mumbai, Kolkata, Coimbatore, Delhi, Goa, Indore, Mangalore, Madurai, Pune, Rajahmundry, Tirupati and Visakhapatnam.
However, in less than a year of operations, Tigerair terminated this interline agreement in January. The tie-up with SpiceJet had ended earlier than expected, mainly because the group could not achieve the revenue target that it was seeking from the agreement.
Budget airline projects in South Korea and Thailand that never took off
A 3-year interline agreement with SpiceJet, an Indian LCC, was cancelled with a year as revenue targets were not met

Tiger Airways (TGR SP)
15 September 2015
See important disclosures at the end of this report 24
Financial Exhibits
Profit & Loss (SGDm) Mar-14 Mar-15 Mar-16F Mar-17F Mar-18F
Total turnover 746 677 728 749 803
Gross profit 746 677 728 749 803
Gen & admin expenses - - (8) (7) (8)
Selling expenses (31) (24) (23) (22) (28)
Other operating costs (768) (693) (666) (655) (692)
Operating profit (52) (40) 31 65 75
Operating EBITDA (18) (3) 73 108 119
Depreciation of fixed assets (33) (37) (42) (43) (45)
Amortisation of intangible assets (1) (0) (0) - -
Operating EBIT (52) (40) 31 65 75
Net income from investments (95) (35) - - -
Other recurring income (80) (192) - - -
Interest income 6 2 1 2 2
Interest expense (11) (8) (10) (10) (10)
Pre-tax profit (232) (273) 23 57 67
Taxation 9 8 (1) (2) (2)
Profit after tax & minorities (223) (264) 22 55 65
Reported net profit (223) (264) 22 55 65
Recurring net profit (223) (264) 22 55 65
Source: Company data, RHB
Cash flow (SGDm) Mar-14 Mar-15 Mar-16F Mar-17F Mar-18F
Operating profit (52) (40) 31 65 75
Depreciation & amortisation 34 37 42 43 45
Change in working capital (100) 14 (7) 2 11
Other operating cash flow 27 16 0 - 0
Operating cash flow (91) 28 67 110 130
Interest received 6 2 1 2 2
Tax paid (0) (1) (1) (2) (2)
Cash flow from operations (86) 29 67 110 130
Capex (365) (41) (17) (20) (20)
Other investing cash flow 378 (12) 72 - -
Cash flow from investing activities 13 (53) 55 (20) (20)
Proceeds from issue of shares 292 223 (0) - -
Increase in debt (154) (53) (9) - -
Other financing cash flow (10) (7) (9) (10) (10)
Cash flow from financing activities 127 163 (19) (10) (10)
Cash at beginning of period 117 172 310 413 494
Total cash generated 54 139 103 80 100
Forex effects (0) 0 0 - 0
Implied cash at end of period 172 310 413 494 594
Source: Company data, RHB

Tiger Airways (TGR SP)
15 September 2015
See important disclosures at the end of this report 25
Financial Exhibits
Balance Sheet (SGDm) Mar-14 Mar-15 Mar-16F Mar-17F Mar-18F
Total cash and equivalents 172 310 413 494 594
Accounts receivable 115 30 27 28 29
Other current assets 22 103 28 28 28
Total current assets 309 443 468 549 651
Tangible fixed assets 570 454 428 405 380
Intangible assets 0 0 0 0 0
Total other assets 107 125 120 120 120
Total non-current assets 676 579 548 525 500
Total assets 986 1,022 1,016 1,074 1,151
Short-term debt 53 84 - - -
Accounts payable 158 116 114 116 128
Other current liabilities 112 141 117 117 117
Total current liabilities 324 340 230 233 245
Total long-term debt 307 223 298 298 298
Other liabilities 76 244 238 238 238
Total non-current liabilities 383 467 536 536 536
Total liabilities 707 807 766 769 780
Share capital 703 931 931 931 931
Retained earnings reserve (424) (715) (681) (625) (560)
Shareholders' equity 279 215 250 305 370
Total equity 279 215 250 305 370
Total liabilities & equity 986 1,022 1,016 1,074 1,151
Source: Company data, RHB
Key Ratios (SGD) Mar-14 Mar-15 Mar-16F Mar-17F Mar-18F
Revenue growth (%) (13.8) (9.2) 7.5 2.9 7.1
Operating profit growth (%) (813.5) (23.4) 0.0 108.0 15.3
Net profit growth (%) 391.2 18.5 0.0 153.0 18.2
EPS growth (%) 346.1 (38.5) 0.0 152.9 18.2
BVPS growth (%) 16.8 (69.5) 16.2 22.0 21.3
Operating margin (%) (7.0) (5.9) 4.3 8.6 9.3
Net profit margin (%) (29.9) (39.0) 3.0 7.3 8.1
Return on average assets (%) (21.9) (26.3) 2.1 5.3 5.8
Return on average equity (%) (93.4) (107.0) 9.3 19.8 19.3
Net debt to equity (%) 67.6 (1.5) (46.2) (64.2) (80.0)
Recurrent cash flow per share (0.09) 0.02 0.03 0.04 0.05
Source: Company data, RHB
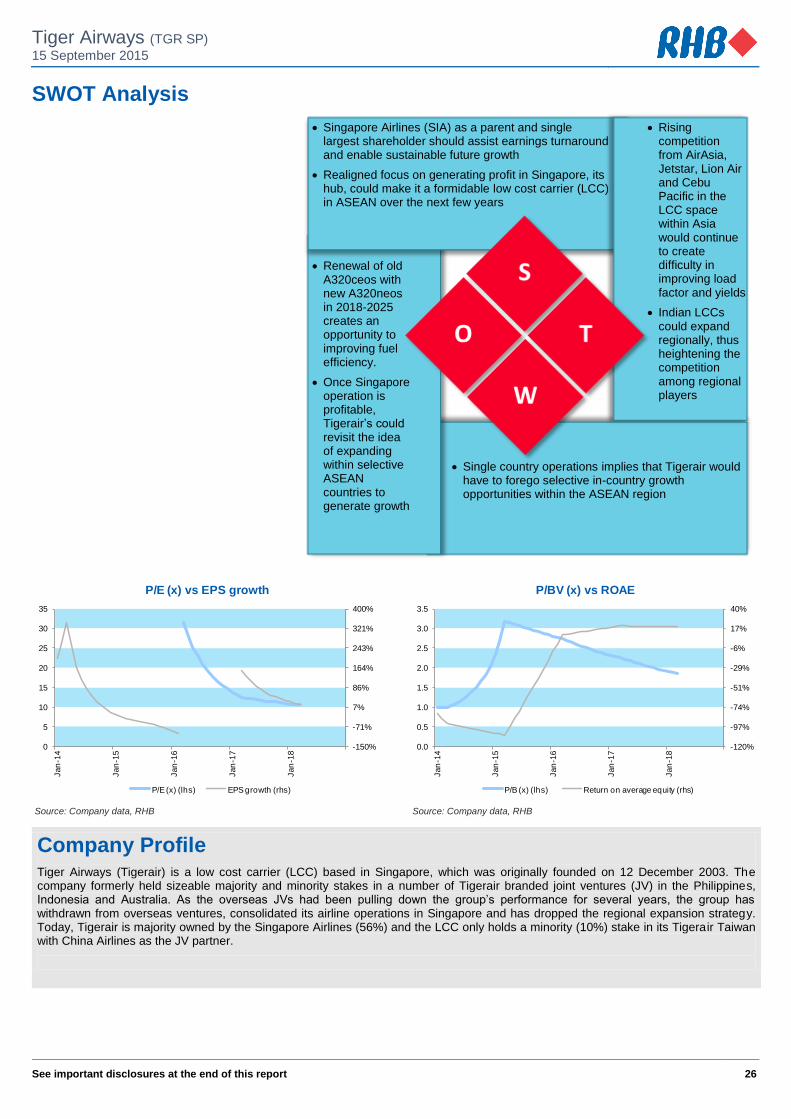
Tiger Airways (TGR SP)
15 September 2015
See important disclosures at the end of this report 26
SWOT Analysis
Singapore Airlines (SIA) as a parent and single largest shareholder should assist earnings turnaround and enable sustainable future growth
Realigned focus on generating profit in Singapore, its hub, could make it a formidable low cost carrier (LCC) in ASEAN over the next few years
Rising competition from AirAsia, Jetstar, Lion Air and Cebu Pacific in the LCC space within Asia would continue to create difficulty in improving load factor and yields
Indian LCCs could expand regionally, thus heightening the competition among regional players
Renewal of old A320ceos with new A320neos in 2018-2025 creates an opportunity to improving fuel efficiency.
Once Singapore operation is profitable, Tigerair’s could revisit the idea of expanding within selective ASEAN countries to generate growth
Single country operations implies that Tigerair would have to forego selective in-country growth opportunities within the ASEAN region
-150%
-71%
7%
86%
164%
243%
321%
400%
0
5
10
15
20
25
30
35
Jan
-14
Jan
-15
Jan
-16
Jan
-17
Jan
-18
P/E (x) vs EPS growth
P/E (x) (lhs) EPS growth (rhs)
-120%
-97%
-74%
-51%
-29%
-6%
17%
40%
0.0
0.5
1.0
1.5
2.0
2.5
3.0
3.5
Jan
-14
Jan
-15
Jan
-16
Jan
-17
Jan
-18
P/BV (x) vs ROAE
P/B (x) (lhs) Return on average equity (rhs)
Source: Company data, RHB Source: Company data, RHB
Company Profile Tiger Airways (Tigerair) is a low cost carrier (LCC) based in Singapore, which was originally founded on 12 December 2003. The company formerly held sizeable majority and minority stakes in a number of Tigerair branded joint ventures (JV) in the Philippines, Indonesia and Australia. As the overseas JVs had been pulling down the group’s performance for several years, the group has withdrawn from overseas ventures, consolidated its airline operations in Singapore and has dropped the regional expansion strategy. Today, Tigerair is majority owned by the Singapore Airlines (56%) and the LCC only holds a minority (10%) stake in its Tigerair Taiwan with China Airlines as the JV partner.

Tiger Airways (TGR SP)
15 September 2015
See important disclosures at the end of this report 27
Recommendation Chart
0.1
0.3
0.5
0.7
0.9
1.1
1.3
1.5
1.7
Sep-10 Dec-11 Mar-13 Jul-14
Price Close
2.1
3
2.0
0
2.2
4
1.6
5
1.4
0
0.9
1
0.7
6
0.6
2
0.5
6
0.7
3
0.8
7
0.8
7
0.7
5
2.4
5
0.7
6
0.8
5
Recommendations & Target Price
Buy Neutral Sell Trading Buy Take Prof it Not Rated
Source: RHB, Bloomberg
Date RecommendationTarget Price Price
2013-05-20 Buy 0.85 0.54
2012-11-02 Buy 0.85 0.58
2012-10-31 Buy 0.85 0.58
2012-10-02 Neutral 0.76 0.59
2012-08-03 Buy 2.45 0.55
2012-07-31 Buy 0.75 0.54
2012-05-22 Buy 0.75 0.50
2012-04-18 Buy 0.87 0.57
2012-03-07 Neutral 0.87 0.61
2012-02-21 Neutral 0.73 0.62
Source: RHB, Bloomberg

28
RHB Guide to Investment Ratings Buy: Share price may exceed 10% over the next 12 months Trading Buy: Share price may exceed 15% over the next 3 months, however longer-term outlook remains uncertain Neutral: Share price may fall within the range of +/- 10% over the next 12 months Take Profit: Target price has been attained. Look to accumulate at lower levels Sell: Share price may fall by more than 10% over the next 12 months Not Rated: Stock is not within regular research coverage
Investment Research Disclaimers
RHB has issued this report for information purposes only. This report is intended for circulation amongst RHB and its affiliates’ clients generally or such
persons as may be deemed eligible by RHB to receive this report and does not have regard to the specific investment objectives, financial situation and
the particular needs of any specific person who may receive this report. This report is not intended, and should not under any circumstances be construed
as, an offer or a solicitation of an offer to buy or sell the securities referred to herein or any related financial instruments.
This report may further consist of, whether in whole or in part, summaries, research, compilations, extracts or analysis that has been prepared by RHB’s
strategic, joint venture and/or business partners. No representation or warranty (express or implied) is given as to the accuracy or completeness of such
information and accordingly investors should make their own informed decisions before relying on the same.
This report is not directed to, or intended for distribution to or use by, any person or entity who is a citizen or resident of or located in any locality, state,
country or other jurisdiction where such distribution, publication, availability or use would be contrary to the applicable laws or regulations. By accepting
this report, the recipient hereof (i) represents and warrants that it is lawfully able to receive this document under the laws and regulations of the jurisdiction
in which it is located or other applicable laws and (ii) acknowledges and agrees to be bound by the limitations contained herein. Any failure to comply with
these limitations may constitute a violation of applicable laws.
All the information contained herein is based upon publicly available information and has been obtained from sources that RHB believes to be reliable and
correct at the time of issue of this report. However, such sources have not been independently verified by RHB and/or its affiliates and this report does not
purport to contain all information that a prospective investor may require. The opinions expressed herein are RHB’s present opinions only and are subject
to change without prior notice. RHB is not under any obligation to update or keep current the information and opinions expressed herein or to provide the
recipient with access to any additional information. Consequently, RHB does not guarantee, represent or warrant, expressly or impliedly, as to the
adequacy, accuracy, reliability, fairness or completeness of the information and opinion contained in this report. Neither RHB (including its officers,
directors, associates, connected parties, and/or employees) nor does any of its agents accept any liability for any direct, indirect or consequential losses,
loss of profits and/or damages that may arise from the use or reliance of this research report and/or further communications given in relation to this report.
Any such responsibility or liability is hereby expressly disclaimed.
Whilst every effort is made to ensure that statement of facts made in this report are accurate, all estimates, projections, forecasts, expressions of opinion
and other subjective judgments contained in this report are based on assumptions considered to be reasonable and must not be construed as a
representation that the matters referred to therein will occur. Different assumptions by RHB or any other source may yield substantially different results
and recommendations contained on one type of research product may differ from recommendations contained in other types of research. The
performance of currencies may affect the value of, or income from, the securities or any other financial instruments referenced in this report. Holders of
depositary receipts backed by the securities discussed in this report assume currency risk. Past performance is not a guide to future performance. Income
from investments may fluctuate. The price or value of the investments to which this report relates, either directly or indirectly, may fall or rise against the
interest of investors.
This report does not purport to be comprehensive or to contain all the information that a prospective investor may need in order to make an investment
decision. The recipient of this report is making its own independent assessment and decisions regarding any securities or financial instruments referenced
herein. Any investment discussed or recommended in this report may be unsuitable for an investor depending on the investor’s specific investment
objectives and financial position. The material in this report is general information intended for recipients who understand the risks of investing in financial
instruments. This report does not take into account whether an investment or course of action and any associated risks are suitable for the recipient. Any
recommendations contained in this report must therefore not be relied upon as investment advice based on the recipient's personal circumstances.
Investors should make their own independent evaluation of the information contained herein, consider their own investment objective, financial situation
and particular needs and seek their own financial, business, legal, tax and other advice regarding the appropriateness of investing in any securities or the
investment strategies discussed or recommended in this report.
This report may contain forward-looking statements which are often but not always identified by the use of words such as “believe”, “estimate”, “intend”
and “expect” and statements that an event or result “may”, “will” or “might” occur or be achieved and other similar expressions. Such forward-looking
statements are based on assumptions made and information currently available to RHB and are subject to known and unknown risks, uncertainties and
other factors which may cause the actual results, performance or achievement to be materially different from any future results, performance or
achievement, expressed or implied by such forward-looking statements. Caution should be taken with respect to such statements and recipients of this
report should not place undue reliance on any such forward-looking statements. RHB expressly disclaims any obligation to update or revise any forward-
looking statements, whether as a result of new information, future events or circumstances after the date of this publication or to reflect the occurrence of
unanticipated events.
29
The use of any website to access this report electronically is done at the recipient’s own risk, and it is the recipient’s sole responsibility to take precautions
to ensure that it is free from viruses or other items of a destructive nature. This report may also provide the addresses of, or contain hyperlinks to,
websites. RHB takes no responsibility for the content contained therein. Such addresses or hyperlinks (including addresses or hyperlinks to RHB own
website material) are provided solely for the recipient’s convenience. The information and the content of the linked site do not in any way form part of this
report. Accessing such website or following such link through the report or RHB website shall be at the recipient’s own risk.
This report may contain information obtained from third parties. Third party content providers do not guarantee the accuracy, completeness, timeliness or
availability of any information and are not responsible for any errors or omissions (negligent or otherwise), regardless of the cause, or for the results
obtained from the use of such content. Third party content providers give no express or implied warranties, including, but not limited to, any warranties of
merchantability or fitness for a particular purpose or use. Third party content providers shall not be liable for any direct, indirect, incidental, exemplary,
compensatory, punitive, special or consequential damages, costs, expenses, legal fees, or losses (including lost income or profits and opportunity costs) in
connection with any use of their content.
The research analysts responsible for the production of this report hereby certifies that the views expressed herein accurately and exclusively reflect his or
her personal views and opinions about any and all of the issuers or securities analysed in this report and were prepared independently and autonomously.
The research analysts that authored this report are precluded by RHB in all circumstances from trading in the securities or other financial instruments
referenced in the report, or from having an interest in the company(ies) that they cover.
RHB and/or its affiliates and/or their directors, officers, associates, connected parties and/or employees, may have, or have had, interests in the securities
or qualified holdings, in subject company(ies) mentioned in this report or any securities related thereto and may from time to time add to or dispose of, or
may be materially interested in, any such securities. Further, RHB and/or its affiliates may have, or have had, business relationships with the subject
company(ies) mentioned in this report and may from time to time seek to provide investment banking or other services to the subject company(ies)
referred to in this research report. As a result, investors should be aware that a conflict of interest may exist.
The contents of this report is strictly confidential and may not be copied, reproduced, published, distributed, transmitted or passed, in whole or in part, to
any other person without the prior express written consent of RHB and/or its affiliates. This report has been delivered to RHB and its affiliates’ clients for
information purposes only and upon the express understanding that such parties will use it only for the purposes set forth above. By electing to view or
accepting a copy of this report, the recipients have agreed that they will not print, copy, videotape, record, hyperlink, download, or otherwise attempt to
reproduce or re-transmit (in any form including hard copy or electronic distribution format) the contents of this report. RHB and/or its affiliates accepts no
liability whatsoever for the actions of third parties in this respect.
The contents of this report are subject to copyright. Please refer to Restrictions on Distribution below for information regarding the distributors of this
report. Recipients must not reproduce or disseminate any content or findings of this report without the express permission of RHB and the distributors.
The securities mentioned in this publication may not be eligible for sale in some states or countries or certain categories of investors. The recipient of this
report should have regard to the laws of the recipient’s place of domicile when contemplating transactions in the securities or other financial instruments
referred to herein. The securities discussed in this report may not have been registered in such jurisdiction. Without prejudice to the foregoing, the
recipient is to note that additional disclaimers, warnings or qualifications may apply based on geographical location of the person or entity receiving this
report.
RESTRICTIONS ON DISTRIBUTION
Malaysia
This report is issued and distributed in Malaysia by RHB Research Institute Sdn Bhd. The views and opinions in this report are our own as of the date
hereof and is subject to change. If the Financial Services and Markets Act of the United Kingdom or the rules of the Financial Conduct Authority apply to a
recipient, our obligations owed to such recipient therein are unaffected. RHB Research Institute Sdn Bhd has no obligation to update its opinion or the
information in this report.
Thailand
This report is issued and distributed in the Kingdom of Thailand by RHB OSK Securities (Thailand) PCL, a licensed securities company that is authorised
by the Ministry of Finance, regulated by the Securities and Exchange Commission of Thailand and is a member of the Stock Exchange of Thailand. The
Thai Institute of Directors Association has disclosed the Corporate Governance Report of Thai Listed Companies made pursuant to the policy of the
Securities and Exchange Commission of Thailand. RHB OSK Securities (Thailand) PCL does not endorse, confirm nor certify the result of the Corporate
Governance Report of Thai Listed Companies.
Indonesia
This report is issued and distributed in Indonesia by PT RHB OSK Securities Indonesia. This research does not constitute an offering document and it
should not be construed as an offer of securities in Indonesia. Any securities offered or sold, directly or indirectly, in Indonesia or to any Indonesian citizen
or corporation (wherever located) or to any Indonesian resident in a manner which constitutes a public offering under Indonesian laws and regulations
must comply with the prevailing Indonesian laws and regulations.

30
Singapore
This report is issued and distributed in Singapore by RHB Research Institute Singapore Pte Ltd and it may only be distributed in Singapore to accredited
investors, expert investors and institutional investors as defined in the Financial Advisers Regulations and the Securities and Futures Act (Chapter 289), as
amended from time to time. By virtue of distribution to these categories of investors, RHB Research Institute Singapore Pte Ltd and its representatives are
not required to comply with Section 36 of the Financial Advisers Act (Chapter 110) (Section 36 relates to disclosure of RHB Research Institute Singapore
Pte Ltd ’s interest and/or its representative's interest in securities). Recipients of this report in Singapore may contact RHB Research Institute Singapore
Pte Ltd in respect of any matter arising from or in connection with the report.
Hong Kong
This report is issued and distributed in Hong Kong by RHB OSK Securities Hong Kong Limited (興業僑豐證券有限公司) (CE No.: ADU220) (“RHBSHK”)
which is licensed in Hong Kong by the Securities and Futures Commission for Type 1 (dealing in securities) and Type 4 (advising on securities) regulated
activities. Any investors wishing to purchase or otherwise deal in the securities covered in this report should contact RHB OSK Securities Hong Kong
Limited.
United States
This report was prepared by RHB and is being distributed solely and directly to “major” U.S. institutional investors as defined under, and pursuant to, the
requirements of Rule 15a-6 under the U.S. Securities and Exchange Act of 1934, as amended (the “Exchange Act”). RHB is not registered as a broker-
dealer in the United States and does not offer brokerage services to U.S. persons. Any order for the purchase or sale of the securities discussed herein
that are listed on Bursa Malaysia Securities Berhad must be placed with and through Auerbach Grayson (“AG”). Any order for the purchase or sale of all
other securities discussed herein must be placed with and through such other registered U.S. broker-dealer as appointed by RHB from time to time as
required by the Exchange Act Rule 15a-6.
This report is confidential and not intended for distribution to, or use by, persons other than the recipient and its employees, agents and advisors, as
applicable.
Additionally, where research is distributed via Electronic Service Provider, the analysts whose names appear in this report are not registered or qualified
as research analysts in the United States and are not associated persons of Auerbach Grayson AG or such other registered U.S. broker-dealer as
appointed by RHB from time to time and therefore may not be subject to any applicable restrictions under Financial Industry Regulatory Authority
(“FINRA”) rules on communications with a subject company, public appearances and personal trading.
Investing in any non-U.S. securities or related financial instruments discussed in this research report may present certain risks. The securities of non-U.S.
issuers may not be registered with, or be subject to the regulations of, the U.S. Securities and Exchange Commission. Information on non-U.S. securities
or related financial instruments may be limited. Foreign companies may not be subject to audit and reporting standards and regulatory requirements
comparable to those in the United States.
The financial instruments discussed in this report may not be suitable for all investors.
Transactions in foreign markets may be subject to regulations that differ from or offer less protection than those in the United States.
OWNERSHIP AND MATERIAL CONFLICTS OF INTEREST
Malaysia
RHB does not have qualified shareholding (1% or more) in the subject company (ies) covered in this report except for:
a) -
RHB and/or its subsidiaries are not liquidity providers or market makers for the subject company (ies) covered in this report except for:
a) -
RHB and/or its subsidiaries have not participated as a syndicate member in share offerings and/or bond issues in securities covered in this report in the
last 12 months except for:
a) -
RHB has not provided investment banking services to the company/companies covered in this report in the last 12 months except for:
a) -
Thailand
RHB OSK Securities (Thailand) PCL and/or its directors, officers, associates, connected parties and/or employees, may have, or have had, interests
and/or commitments in the securities in subject company(ies) mentioned in this report or any securities related thereto. Further, RHB OSK Securities
(Thailand) PCL may have, or have had, business relationships with the subject company(ies) mentioned in this report. As a result, investors should
exercise their own judgment carefully before making any investment decisions.

31
Indonesia
PT RHB OSK Securities Indonesia is not affiliated with the subject company(ies) covered in this report both directly or indirectly as per the definitions of
affiliation above.
Pursuant to the Capital Market Law (Law Number 8 Year 1995) and the supporting regulations thereof, what constitutes as affiliated parties are as follows:
1. Familial relationship due to marriage or blood up to the second degree, both horizontally or vertically;
2. Affiliation between parties to the employees, Directors or Commissioners of the parties concerned;
3. Affiliation between 2 companies whereby one or more member of the Board of Directors or the Commissioners are the same;
4. Affiliation between the Company and the parties, both directly or indirectly, controlling or being controlled by the Company;
5. Affiliation between 2 companies which are controlled, directly or indirectly, by the same party; or
6. Affiliation between the Company and the main Shareholders.
PT RHB OSK Securities Indonesia is not an insider as defined in the Capital Market Law and the information contained in this report is not considered as
insider information prohibited by law.
Insider means:
a. a commissioner, director or employee of an Issuer or Public Company;
b. a substantial shareholder of an Issuer or Public Company;
c. an individual, who because of his position or profession, or because of a business relationship with an Issuer or Public Company, has access to
inside information; and
d. an individual who within the last six months was a Person defined in letters a, b or c, above.
Singapore
RHB Research Institute Singapore Pte Ltd and/or its subsidiaries and/or associated companies do not make a market in any securities covered in this
report, except for:
(a) -
The staff of RHB Research Institute Singapore Pte Ltd and its subsidiaries and/or its associated companies do not serve on any board or trustee positions
of any issuer whose securities are covered in this report, except for:
(a) -
RHB Research Institute Singapore Pte Ltd and/or its subsidiaries and/or its associated companies do not have and have not within the last 12 months had
any corporate finance advisory relationship with the issuer of the securities covered in this report or any other relationship (including a shareholding of 1%
or more in the securities covered in this report) that may create a potential conflict of interest, except for:
(a) -
Hong Kong
RHBSHK or any of its group companies may have financial interests in in relation to an issuer or a new listing applicant (as the case may be) the securities
in respect of which are reviewed in the report, and such interests aggregate to an amount equal to or more than (a) 1% of the subject company’s market
capitalization (in the case of an issuer as defined under paragraph 16 of the Code of Conduct for Persons Licensed by or Registered with the Securities
and Futures Commission (the “Code of Conduct”); and/or (b) an amount equal to or more than 1% of the subject company’s issued share capital, or issued
units, as applicable (in the case of a new listing applicant as defined in the Code of Conduct). Further, the analysts named in this report or their associates
may have financial interests in relation to an issuer or a new listing applicant (as the case may be) in the securities which are reviewed in the report.
RHBSHK or any of its group companies may make a market in the securities covered by this report.
RHBSHK or any of its group companies may have analysts or their associates, individual(s) employed by or associated with RHBSHK or any of its group
companies serving as an officer of the company or any of the companies covered by this report.
RHBSHK or any of its group companies may have received compensation or a mandate for investment banking services to the company or any of the
companies covered by this report within the past 12 months.
Note: The reference to “group companies” above refers to a group company of RHBSHK that carries on a business in Hong Kong in (a) investment
banking; (b) proprietary trading or market making; or (c) agency broking, in relation to securities listed or traded on The Stock Exchange of Hong Kong
Limited.

32
Kuala Lumpur Hong Kong Singapore
RHB Research Institute Sdn Bhd Level 11, Tower One, RHB Centre
Jalan Tun Razak Kuala Lumpur
Malaysia Tel : +(60) 3 9280 2185 Fax : +(60) 3 9284 8693
RHB OSK Securities Hong Kong Ltd.
12th Floor
World-Wide House 19 Des Voeux Road Central, Hong Kong
Tel : +(852) 2525 1118 Fax : +(852) 2810 0908
RHB Research Institute Singapore
Pte Ltd (formerly known as DMG & Partners Research Pte Ltd)
10 Collyer Quay #09-08 Ocean Financial Centre
Singapore 049315 Tel : +(65) 6533 1818 Fax : +(65) 6532 6211
Jakarta Shanghai Phnom Penh
PT RHB OSK Securities Indonesia
Wisma Mulia, 20th Floor Jl. Jend. Gatot Subroto No. 42
Jakarta 12710, Indonesia Tel : +(6221) 2783 0888 Fax : +(6221) 2783 0777
RHB OSK (China) Investment Advisory Co. Ltd.
Suite 4005, CITIC Square 1168 Nanjing West Road
Shanghai 20041 China
Tel : +(8621) 6288 9611 Fax : +(8621) 6288 9633
RHB OSK Indochina Securities Limited
No. 1-3, Street 271 Sangkat Toeuk Thla, Khan Sen Sok
Phnom Penh Cambodia
Tel: +(855) 23 969 161 Fax: +(855) 23 969 171
Bangkok
RHB OSK Securities (Thailand) PCL
10th Floor, Sathorn Square Office Tower 98, North Sathorn Road, Silom
Bangrak, Bangkok 10500 Thailand
Tel: +(66) 2 862 9999 Fax : +(66) 2 862 9799