Embed Size (px)
Citation preview

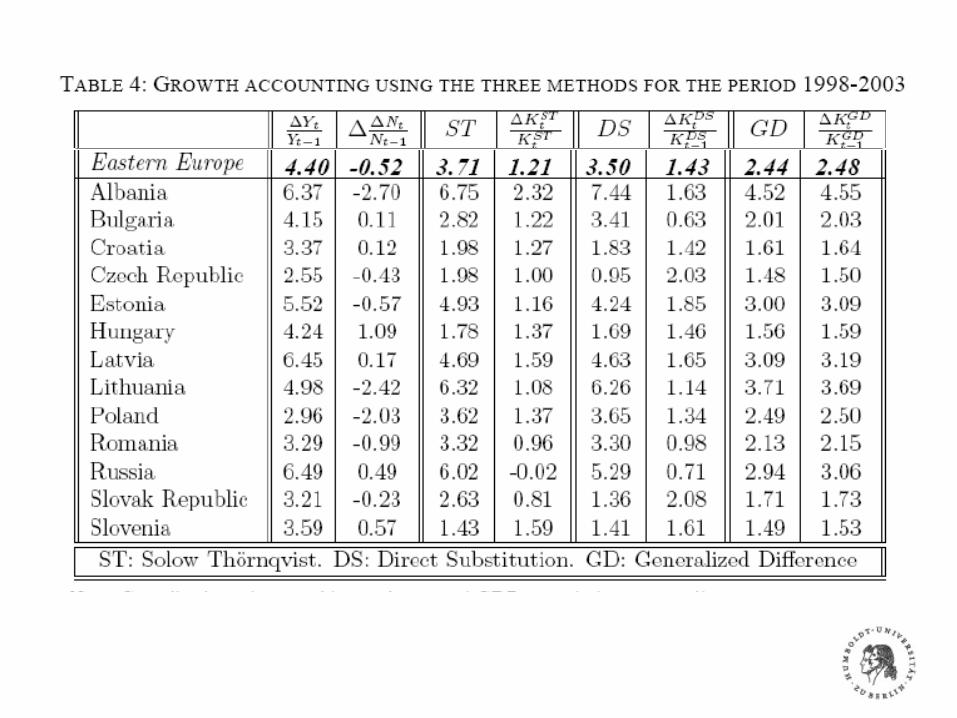
TFP Growth in Old and New Europe
Michael C. BurdaHumboldt-Universität zu Berlin
14th Dubrovinik Economic Conference
Dubrovnik, 25-27 June 2008

Summary
• The European Integration Episode and Paths of Integration
• TFP and Measurement Issues
• Alternative TFP measurements in Old and New Europe
• Findings

How to achieve most efficient use of resources among the European regions?
• Solow growth • Migration • Capital mobility• Factor proportions (Heckscher-Ohlin) trade• Adoption of leading edge technologies• Elimination of inefficiencies; establishment of property
rights and rule of law
The Great European Integration Episode

• Remember: Ultimately, growth in total factor productivity (TFP) is the source of all per capita economic growth
• The role of product and labor market regulations for the form and speed of implementation of new innovations, especially ICT (van Ark et al. 2008)
TFP and Measurement Issues
Old Europe v. New Europe
Now, you're thinking of Europe as Germany and France. I don't. I think that's old Europe. If you look at the entire NATO Europe today, the center of gravity is shifting to the east. And there are a lot of new members. And if you just take the list of all the members of NATO and all of those who have been invited in recently -- what is it? Twenty-six, something like that? -- you're right.

• Cost of starting businesses, regulation
• Employment protection, firing costs
• Result: Different internet penetration levels, ICT adoption, especially in retail services, communication, business services
• Old Europe v. New Europe
• What about Central and Eastern Europe?
Old Europe v. New Europe
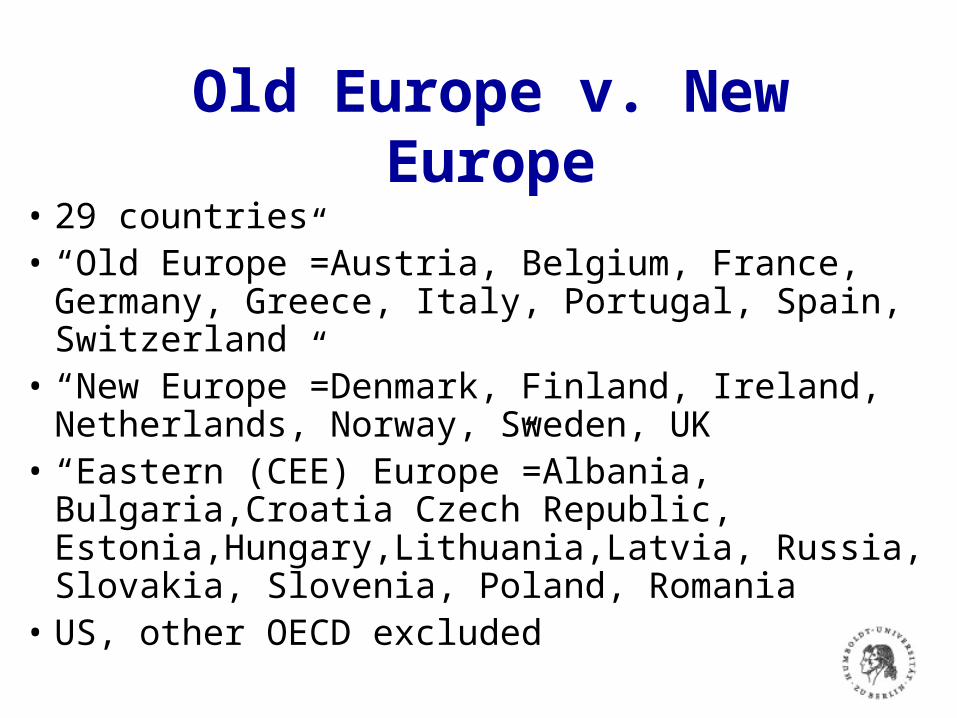
• 29 countries• “Old Europe”=Austria, Belgium, France, Germany,
Greece, Italy, Portugal, Spain, Switzerland • “New Europe”=Denmark, Finland, Ireland,
Netherlands, Norway, Sweden, UK • “Eastern (CEE) Europe”=Albania, Bulgaria,Croatia
Czech Republic, Estonia,Hungary,Lithuania,Latvia, Russia, Slovakia, Slovenia, Poland, Romania
• US, other OECD excluded
Old Europe v. New Europe

• Solow residual measure of TFP growth
• In words: What´s left of real growth after observable reasons for growth are subtracted
• Problems with Solow residual: Capital stock measurement (Burda/Severgnini 2008)
Measurement of TFP Growth
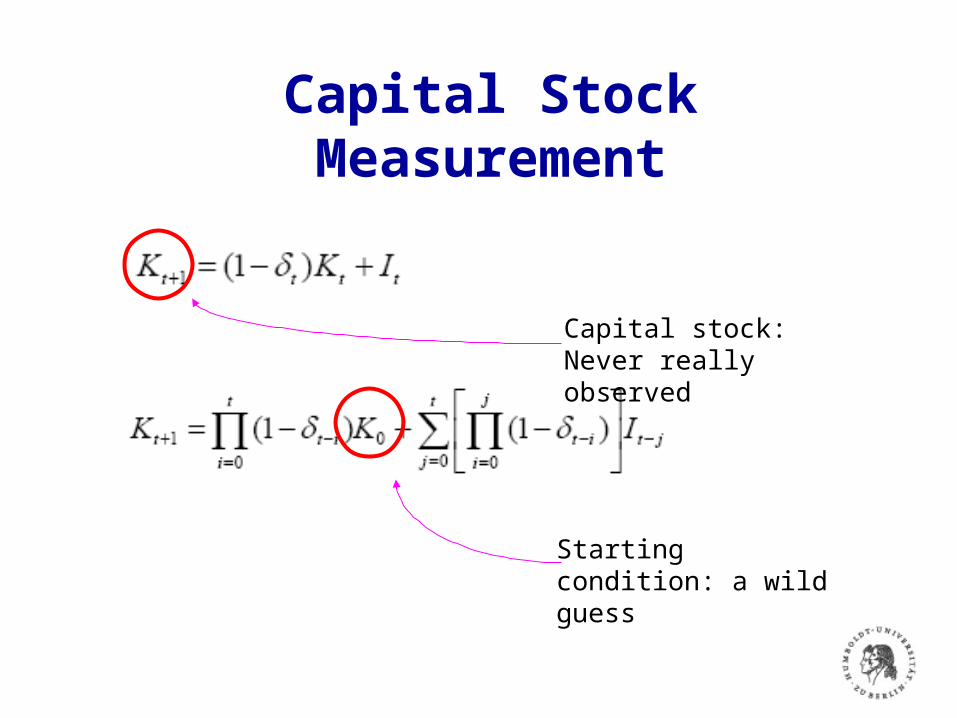
Capital Stock Measurement
Capital stock: Never really observed
Starting condition: a wild guess

Synthetic Data: DSGE Model
subject to K0 given and, for t0
Households choose sequences of consumption, labor supply, future capital and current utilization of existing capital to maximize expected utility :
Firms maximize profits, renting capital and hiring labor supplied by the households using a standard neoclassical CRS production function
Equilibrium achieves the social planner‘s optimum


Sample Size (quarters)
RMSE
RMSE RMSE
RMSE
Measurement error: Results from a Monte-Carlo Study
Source: Burda/Severgnini (2008)
Sample Size (quarters)
Sample Size (quarters)
Sample Size (quarters)
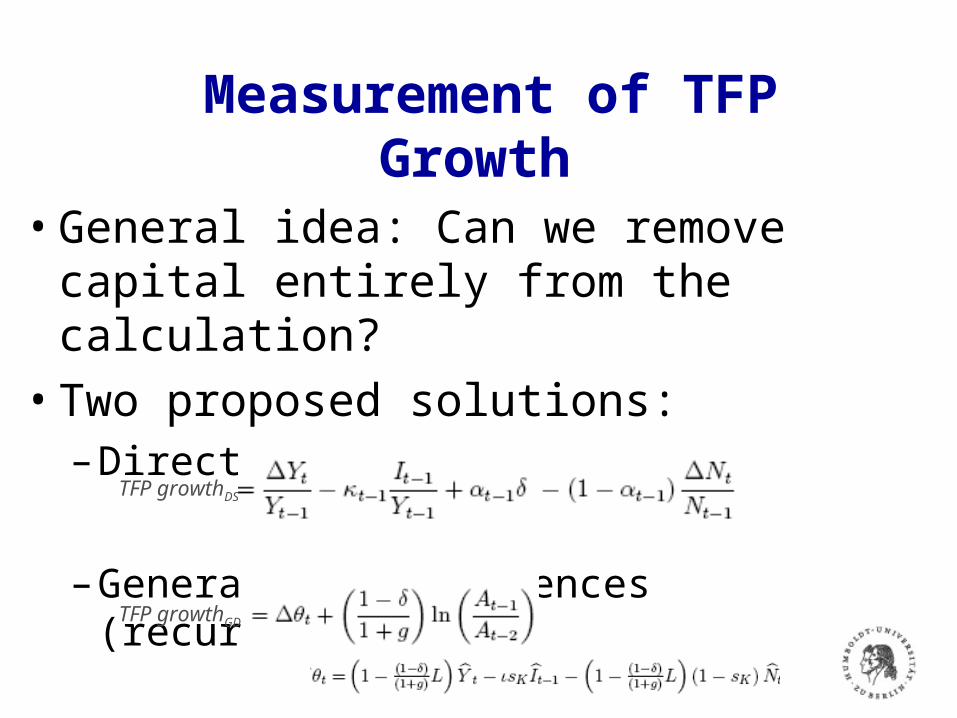
• General idea: Can we remove capital entirely from the calculation?
• Two proposed solutions: – Direct Substitution:
– Generalized Differences (recursive):
Measurement of TFP Growth
TFP growthGD
TFP growthDS

1994-2003 1998-2003
ST DS GD ST DS GD
Old Europe
0.1 0.2 0.7 0.1 -0.2 0.6
New Europe
0.8 1.3 1.1 0.6 0.7 0.9
CEE 2.8 3.0 2.1 3.7 3.5 2.4
Summary: Averages of TFP Growth Estimates

1994-2003 1998-2003
ST DS GD ST DS GD
Old Europe
0.6 0.6 0.3 0.9 1.0 0.5
New Europe
0.9 1.0 0.5 1.0 1.2 0.6
CEE 1.7 2.0 1.0 1.9 2.0 1.0
Summary: Standard Deviation of TFP Growth Estimates

Summary of Results
• Impact effect of PMR on TFP growth is always negative
• Impact effect of EPL on TPF growth is always insignificant
• Long-run effect of both PMR and EPL on TFP is always negative, not always significant
• Interactions not significant • More to be done, but consistent with evidence of
Nicoletti and Scarpetta and others
Old Europe v. New Europe
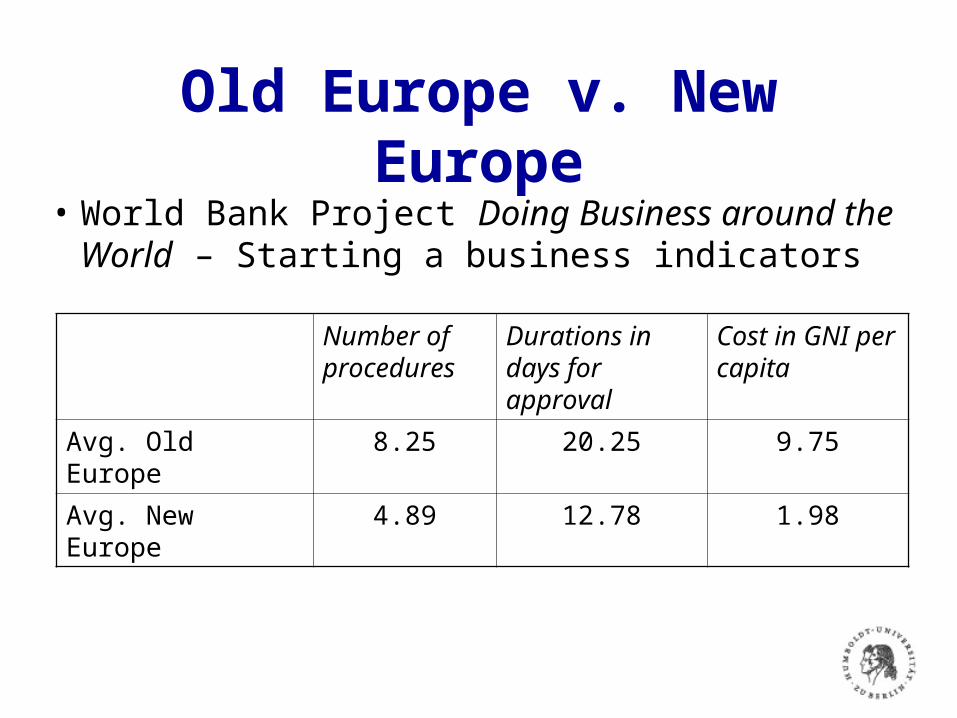
• World Bank Project Doing Business around the World – Starting a business indicators
Number of procedures
Durations in days for approval
Cost in GNI per capita
Avg. Old Europe 8.25 20.25 9.75
Avg. New Europe 4.89 12.78 1.98

Old Europe v. New Europe
• World Bank Project Doing Business around the World – Starting a business indicators
Number of procedures
Durations in days for approval
Cost in GNI per capita
Avg. Old Europe 8.25 20.25 9.75
Avg. New Europe 4.89 12.78 1.98
Avg. CEE Europe 8.27 29.82 10.2

Old Europe v. New Europe
• World Bank Project Doing Business around the World – Starting a business indicators
Number of procedures
Durations in days for approval
Cost in GNI per capita
Avg. Old Europe 8.3 20.3 9.8
Avg. New Europe 4.9 12.8 2.0
Avg. CEE Europe 8.3 29.8 10.2
Croatia 8 40 11.1
Estonia 5 7 2.0

Conclusions
• Large TFP growth gains in CEE, against trend of both Old and New Europe
• Should be interpreted as low-lying fruit after transformation, moving to the frontier
• Quo vadis, Central and Eastern Europe?• Benefit of competition via entry from established
(Old and New) European firms • Backwash to Old Europe? Let´s hope so