Embed Size (px)
Citation preview

TfN Northern Freight & Logistics Strategy
Conference Thursday 1st October 2015

Introduction from the Chair
• Introduction - Richard Brown, Mott MacDonald (Chair)

Welcome and opening remarks
• Bernard Molloy – Chair of TfN Freight Strategy’s Private Sector Reference Group

Study overview, approach and format for today Richard Brown, Mott MacDonald

Summary
• Study context
• Study objectives
• The team
• Approach to strategy development
• Programme for the rest of the conference

Study context (1)
• ‘Northern Powerhouse’ – boost economic growth and rebalance the economy
• Freight and logistics industry in the North– 34% GB large
warehouse capacity
– 38% mainland port throughput

Study context (2)
• Major freight enterprises committed to the North with strong investment records and plans
• Opportunities potentially limited by:– road and rail network capacity
– land use strategies and policies
• Study commissioned by Transport for the North (TfN), together with other work streams
• TfN becoming a statutory body in 2017

Objectives of the strategy
• Develop freight & logistics proposals to support the Northern Powerhouse (with report to be presented to the Chancellor in Spring 2016)
• Produce strategy with an Action Plan for progression of plans and implementation of practical measures
• Developing a comprehensive strategy to allow the industry to:
– Maximise returns on its current & future investments
– Generate additional employment & prosperity
– Improve the competitiveness of the North

Strategy Characteristics
• Accessible and persuasive strategy that makes the case for freight development in the North
• Delivery through optimised investment in road & rail networks & modifying planning & other policies
• An opportunity to develop a shared vision for the industry for the private and public sector
• Must be attractive to the market – transport operators, ports, developers and their customers

The team
• Client lead for Transport for the North: Merseytravel (leader of F&L Workstream)
• Mott MacDonald – policy, appraisal and economics
• MDS Transmodal – freight, freight policy, logistics and modelling
• Technical Board of Excellence
– Prof. Alan Braithwaite, LCP Consulting/Cranfield University
– Barry Allen, Savills
– Tom Van Vuren, Mott MacDonald
– Dr James Laird, Peak Economics/ITS Leeds University

Approach
• Phase 1: Development of base line– Freight demand & assets in the North
– Freight flows, including “Do Minimum” baseline
– Policy context
• Phase 2: Scenario development & forecasting– Factors affecting future business environment
– Scenario development and testing
– Forecasting of freight demand, freight flows & strategy outcomes
– Evaluating impact of measures
• Phase 3: Development of Strategy with Action Plan– Recommend a draft strategy in January 2016
• Private sector input to approach is vital, supported with necessary process and evidence to support public investment

Conference Programme
• Presentations from the team:– Northern freight demand & assets
– Northern freight flows: present & future
– Northern investment plans – planned investment in transport networks
– Developing a strategy within the policy context
• Opportunities for questions, comments & discussion – Questions & comments after each presentation
– Further extended discussion this afternoon
– Written feedback after event
Questions / comments?
• Richard Brown (Chair)

Mike GarrattMDS Transmodal

The freight industry in Northern England
First two presentations will cover:
• Freight demand
• Freight industry assets
• Asset utilization and network loadings– In an attempt to set out an agreed base line from
which strategies can be developed
15

Study area and geographical context
16
• Strategy for the TfN northern regions
• Taking account of infrastructure and development in the immediate periphery
• Forecasting and modelling in a national and international context
• North clearly needs to ‘connect’ to the widest possible market
Baseline 1: Northern freight & logistics assets Mike Garratt, MDS Transmodal
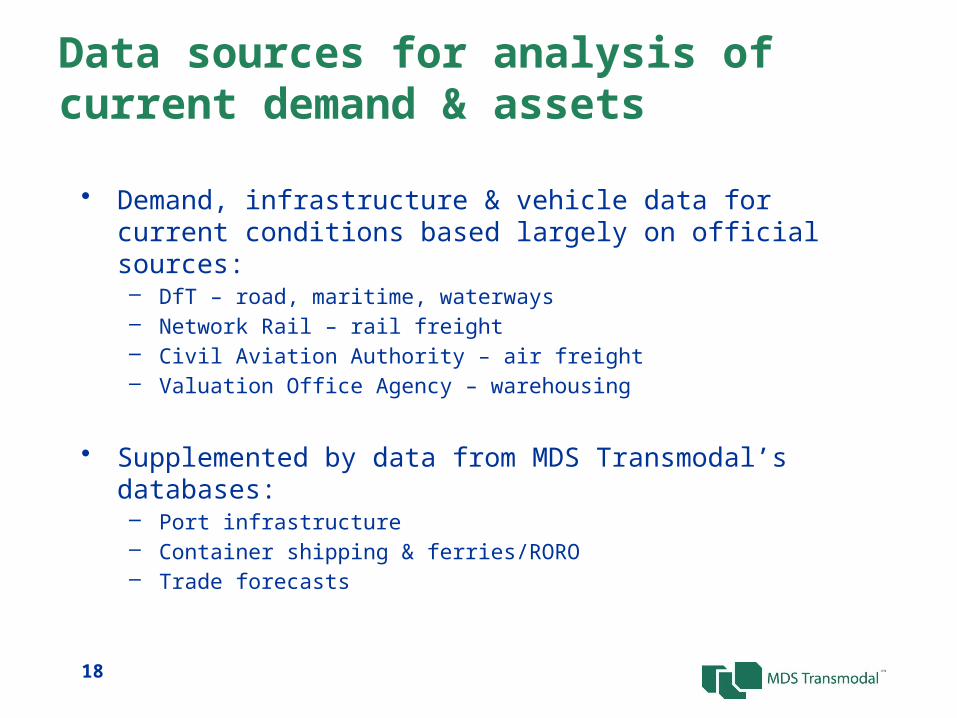
Data sources for analysis of current demand & assets
• Demand, infrastructure & vehicle data for current conditions based largely on official sources:– DfT – road, maritime, waterways– Network Rail – rail freight– Civil Aviation Authority – air freight– Valuation Office Agency – warehousing
• Supplemented by data from MDS Transmodal’s databases:
– Port infrastructure– Container shipping & ferries/RORO– Trade forecasts
18

Demand: overall freight moved 2014• Total road & rail freight lifted in GB: 1,642 m tonnes of which to/from/within the North: 600 m tonnes
(37% share)
and of that Northern tonnage• Freight lifted by road: 538 m tonnes• Freight lifted by rail: 62 m tonnes
Northern port & waterway throughput: 162 m tonnes
19

Demand: GB & Northern freight lifted• Total tonnes lifted in GB: 2,111 m tonnes per annum
– 111 m by rail– 1,531 m by road– 467 m through sea ports and waterways– 2.3 m through airports– 214 billion tonne kms by road, rail and water
• Of which to/from/within Northern Britain:– 762 m (36%) of tonnes lifted– 56% of rail tonnes lifted– 35% of road tonnes lifted– 35% of port throughput– 4% of airport tonnes– 27% of both road and rail network tonne km
• North of England represents a substantial proportion of GB freight transport
20
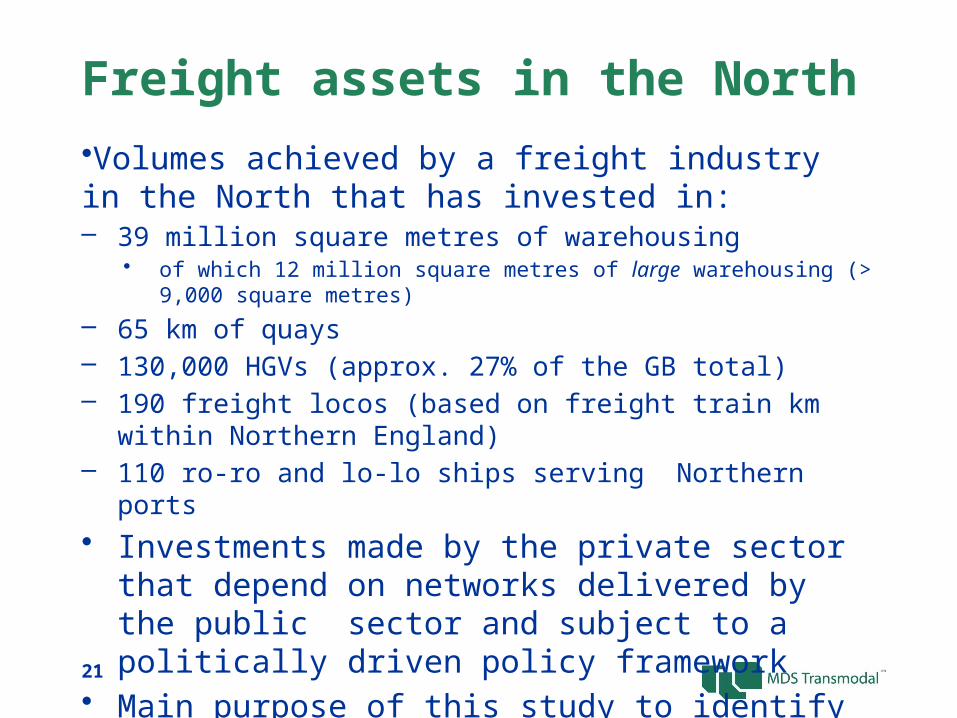
Freight assets in the North •Volumes achieved by a freight industry in the North that has invested in:– 39 million square metres of warehousing
• of which 12 million square metres of large warehousing (> 9,000 square metres)– 65 km of quays– 130,000 HGVs (approx. 27% of the GB total)– 190 freight locos (based on freight train km within Northern England)– 110 ro-ro and lo-lo ships serving Northern ports• Investments made by the private sector that depend on
networks delivered by the public sector and subject to a politically driven policy framework
• Main purpose of this study to identify a strategy which brings these interests together
21
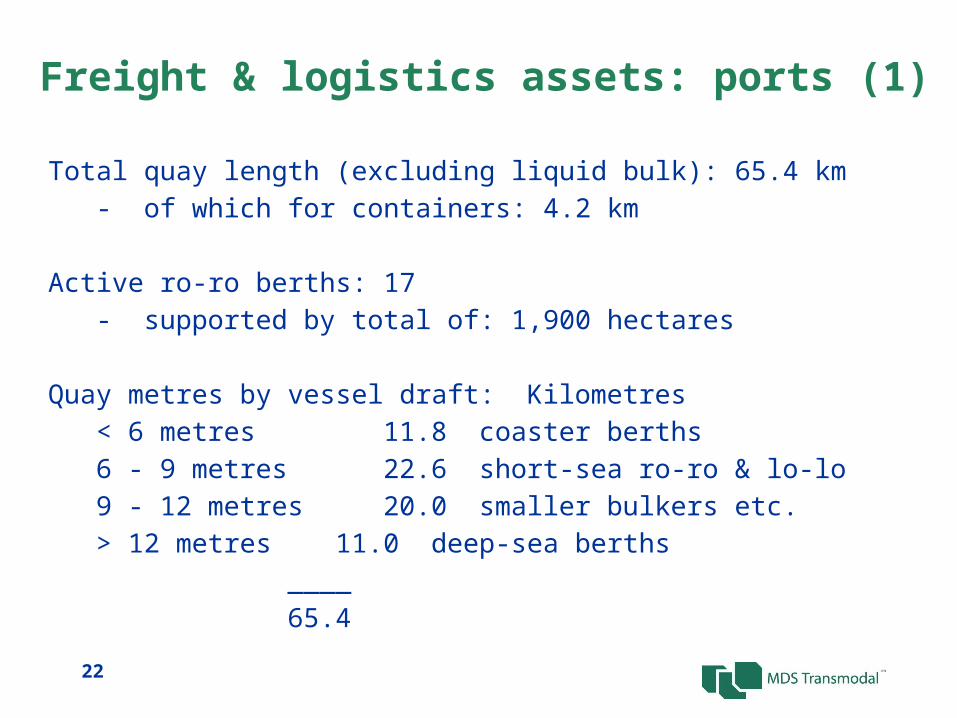
Freight & logistics assets: ports (1)
Total quay length (excluding liquid bulk): 65.4 km- of which for containers: 4.2 km
Active ro-ro berths: 17- supported by total of: 1,900 hectares
Quay metres by vessel draft: Kilometres< 6 metres 11.8 coaster berths6 - 9 metres 22.6 short-sea ro-ro & lo-lo9 - 12 metres 20.0 smaller bulkers etc.> 12 metres 11.0 deep-sea berths
____65.4
22
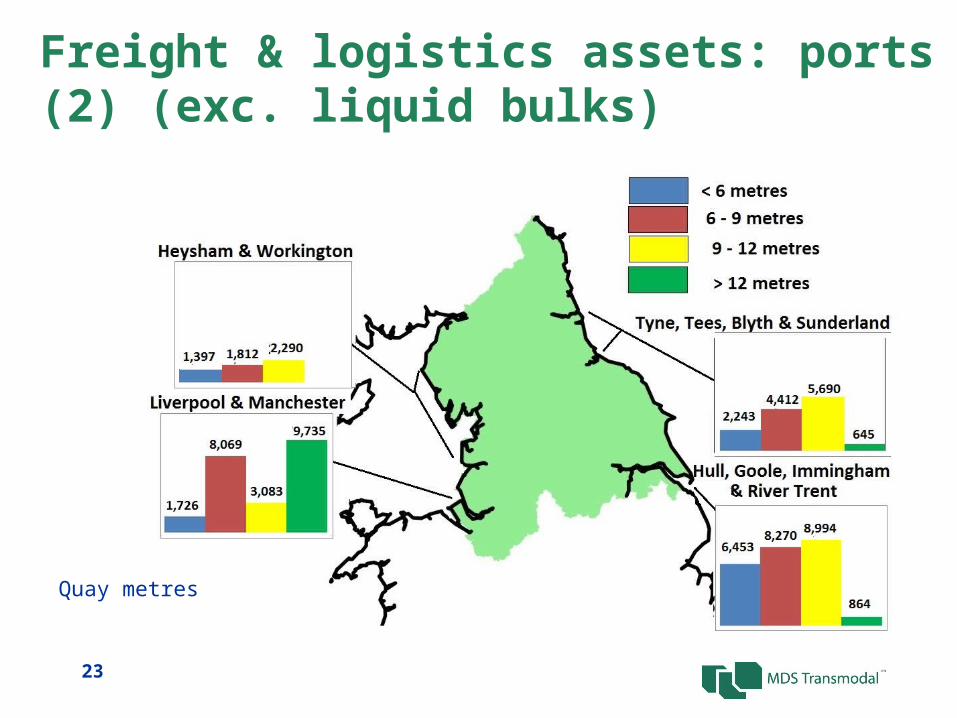
Freight & logistics assets: ports (2) (exc. liquid bulks)
23
Quay metres

Freight & logistics assets: warehousing
• Concentration of warehousing in Midlands (“Golden Triangle”)
• But also major concentrations along M62 Corridor reflecting competitive location24

Freight & logistics assets: rail terminals
• Terminals handling >1000 tonnes since 2013
• SRFIs at Ditton, Wakefield & Selby– new sites
emerging at Salford, Doncaster and Knowsley
• Intermodal terminals at Garston, Leeds, Knowsley, Trafford Park & ports
• Terminals for a wide variety of bulk products
25

Summary• The population of the North of England represents 24% of
the GB total yet…• North of England handles:
– 56% of rail tonnes lifted– 35% of port throughput– 35% of road tonnes lifted– 27% of both road and rail tonne km
• The North already “punches above its weight”• Already a competitive location for distribution centres
Observations welcome on the evidence we are employing
26

Questions / comments?
• Richard Brown (Chair)
Baseline 2: Northern freight flows – present & future Mike Garratt, MDS Transmodal
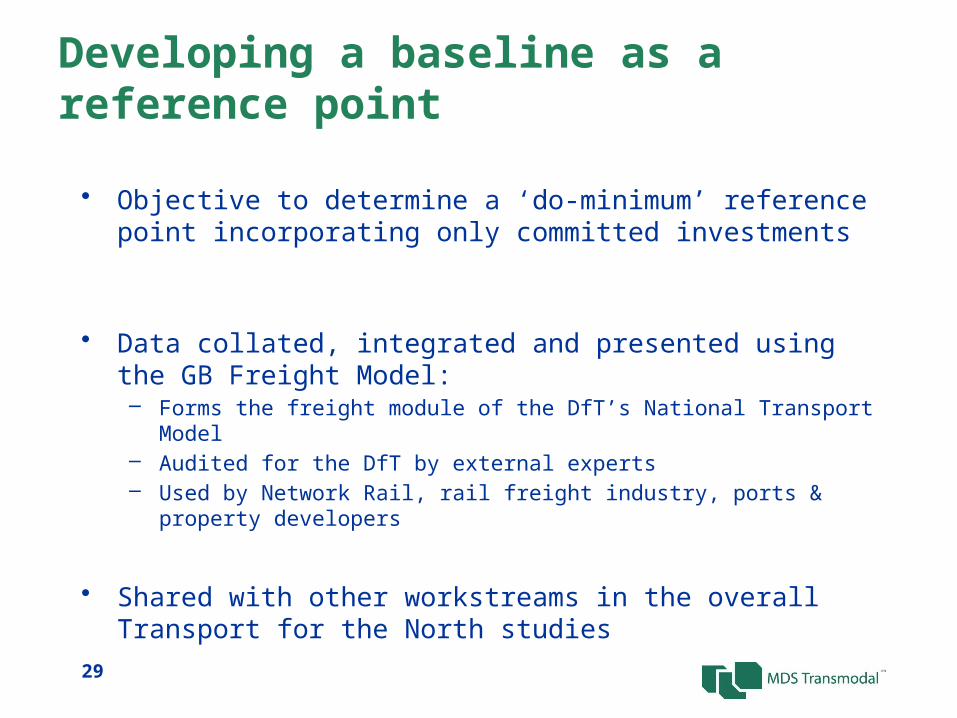
Developing a baseline as a reference point
• Objective to determine a ‘do-minimum’ reference point incorporating only committed investments
• Data collated, integrated and presented using the GB Freight Model:– Forms the freight module of the DfT’s National Transport Model – Audited for the DfT by external experts– Used by Network Rail, rail freight industry, ports & property developers
• Shared with other workstreams in the overall Transport for the North studies
29
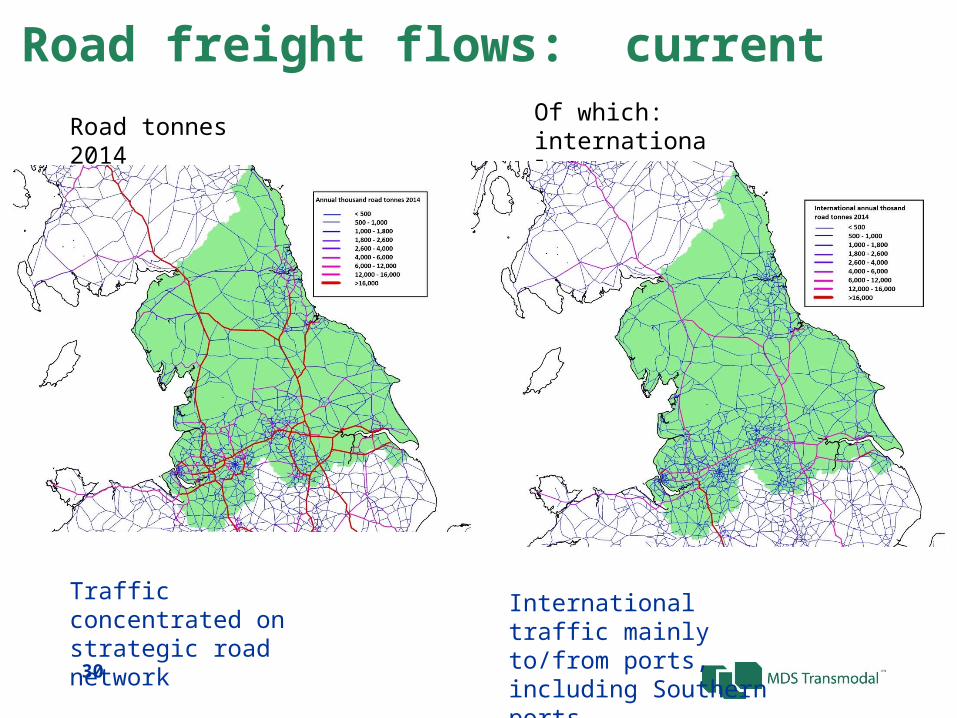
Road freight flows: current
Road tonnes 2014 Of which: international
Traffic concentrated on strategic road network
International traffic mainly to/from ports, including Southern ports30

Road freight flows: forecast to 2033
31
HGVs 2014 – 2033 change concentrated on corridors from the ports- reflecting increasing levels of international sourcing
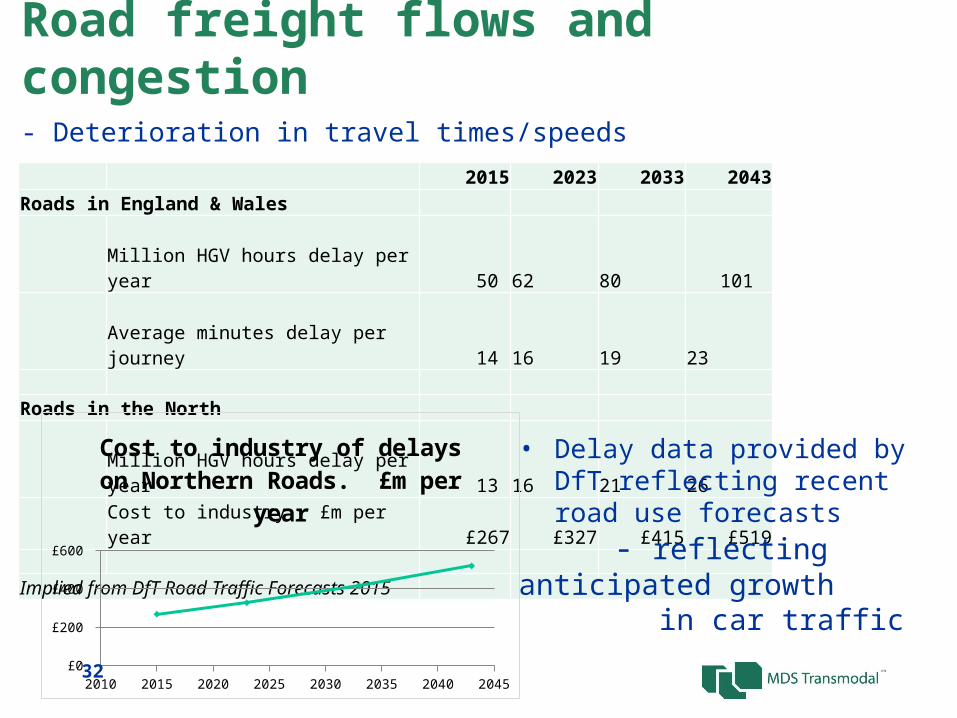
Road freight flows and congestion
- Deterioration in travel times/speeds
2015 2023 2033 2043Roads in England & Wales
Million HGV hours delay per year 50 62 80 101 Average minutes delay per journey 14 16 19 23
Roads in the NorthMillion HGV hours delay per year 13 16 21 26 Cost to industry. £m per year £267 £327 £415 £519
Implied from DfT Road Traffic Forecasts 2015
2010 2015 2020 2025 2030 2035 2040 2045£0
£100
£200
£300
£400
£500
£600
Cost to industry of delays on Northern Roads. £m per year
32
• Delay data provided by DfT reflecting recent road use forecasts
- reflecting anticipated growth in car traffic

HGV average speeds AM peak
Highways England network in the North- increased delays concentrated on east-west corridors- a hurdle for both connectivity and access to the ports
33

Rail freight flows – current tonnageRail tonnages by county by origin/destination (intra and extra North)
34
• Current rail freight tonnes concentrated on Humber, Derbyshire and power stations
• Decline in coal switches emphasis

Road & rail Do-minimum forecasts
• Network Rail’s Freight Market Study, GB forecast for 2033: 161 m tonnes
• But depends upon extensive rail linked DC development
• Without SRFI development forecast for 2033 drops to 100m tonnes
• Rail volumes would fall (loss of coal)
Current 2023 2033 2043GB (million tonnes)Rail 111 93 100 108 Road 1,531 1,630 1,756 1,895
of which to/from/within the North (million tonnes)Rail 62 49 51 55 Road 538 575 627 678
2010 2015 2020 2025 2030 2035 2040 20450
20
40
60
80
100
120
140
Rail
Road
35
Inde
xed
to 1
00

Rail freight flows on network: current
36
Current rail flows Of which: intermodal
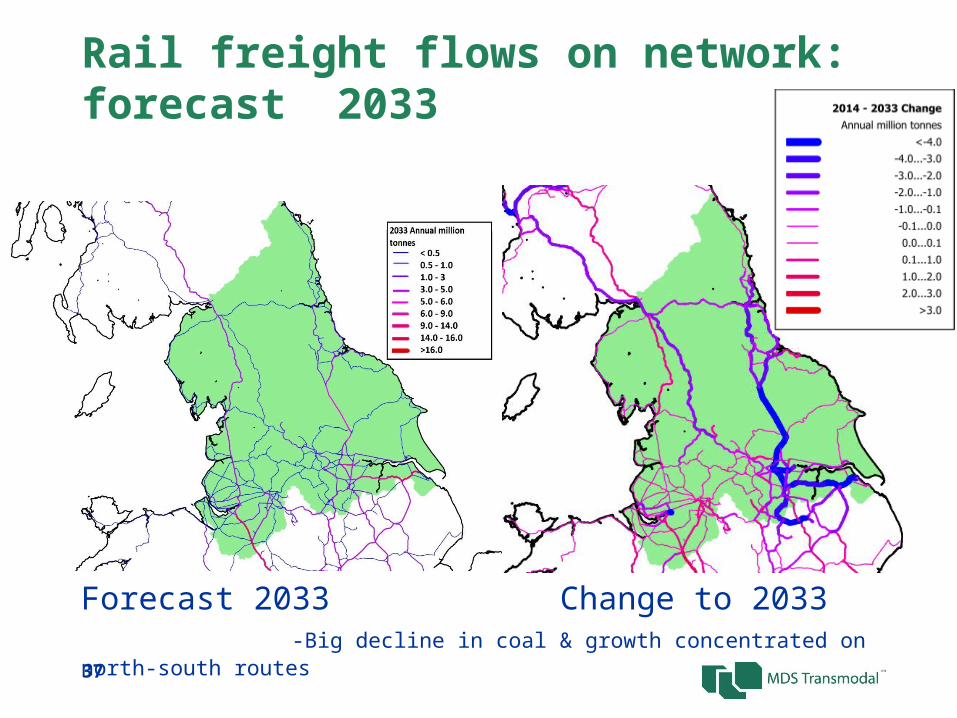
Rail freight flows on network: forecast 2033
37
Forecast 2033 Change to 2033 -Big decline in coal & growth concentrated on north-south routes

Transpennine capacity: rail network junction utilization
38
Principal congestion around Manchester

Transpennine capacity: M62
39
• Severe congestion points in extended peak periods
• Impacts on northern port competitiveness and connectivity
0 20 40 60 80 100 120 140 16030
40
50
60
70
80
90
100
AM Peak Eastbound
AM Peak Westbound
Aver
age
Spee
d (k
m/h
)
Liverpool Manchester Leeds Hull

Port throughputs – tonnages by cargo categories
40
Thousand tonnes
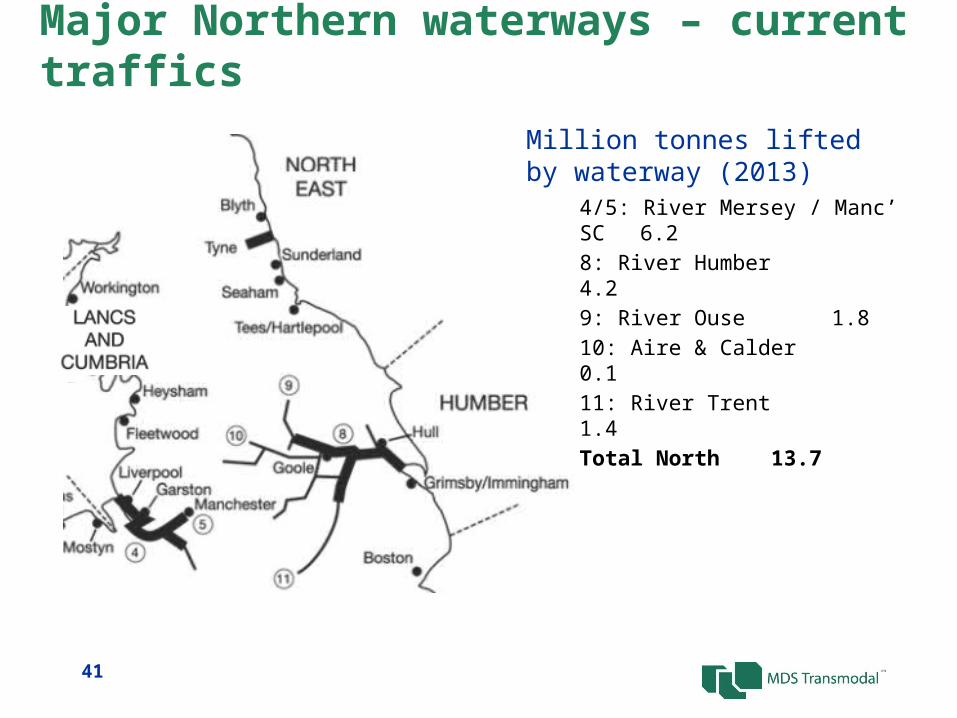
Major Northern waterways – current traffics
4/5: River Mersey / Manc’ SC 6.28: River Humber 4.29: River Ouse 1.810: Aire & Calder 0.111: River Trent 1.4Total North13.7
Million tonnes lifted by waterway (2013)
41

Short sea ro-ro shipping services
Area Proportion of totalChannel 35.5%Haven 5.7%Lancashire Coast 10.4%Humber 13.7%Wales 8.7%Thames 7.7%East Scotland 0.4%West Scotland 10.3%South Coast 5.8%Tyne & Tees 1.9%Total 100%
RoRo capacity by port regionby lane metres
42

Deep sea lo-lo shipping services
Capacity of services byport areas (TEU)
43

Short sea lo-lo shipping services
Capacity of services by port area (TEU)
44

Air freight
• London airports account for 78% of all UK air freight
• Heathrow dominated by long haul belly-hold traffic
• Manchester dominates air freight in the North
• But a very low national market share
45
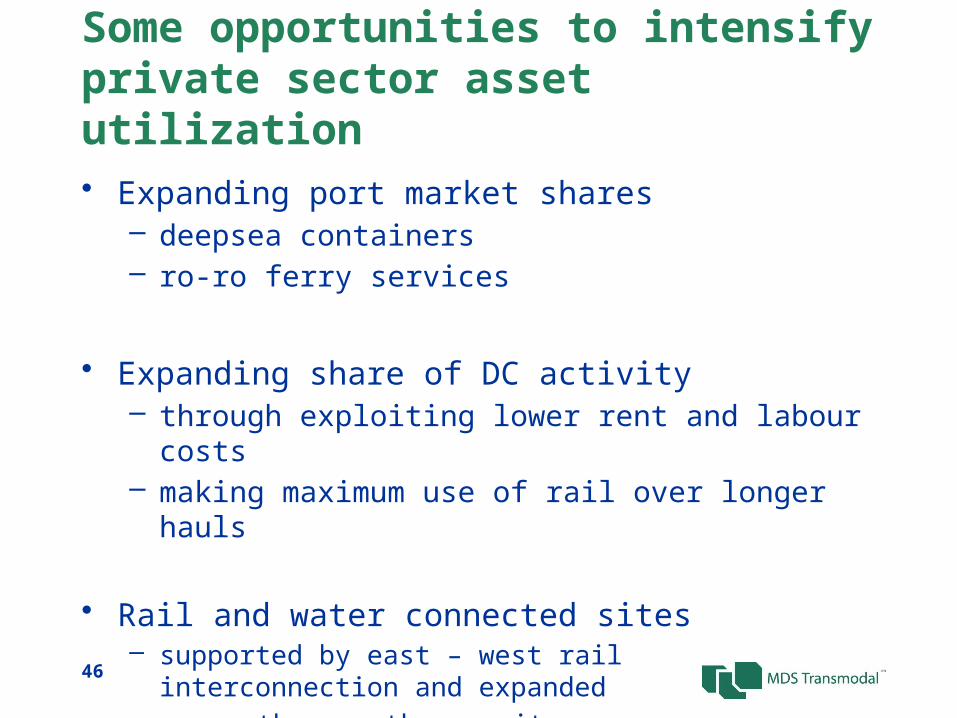
Some opportunities to intensify private sector asset utilization
• Expanding port market shares– deepsea containers– ro-ro ferry services
• Expanding share of DC activity– through exploiting lower rent and labour costs– making maximum use of rail over longer hauls
• Rail and water connected sites– supported by east – west rail interconnection and expanded north – south capacity
46
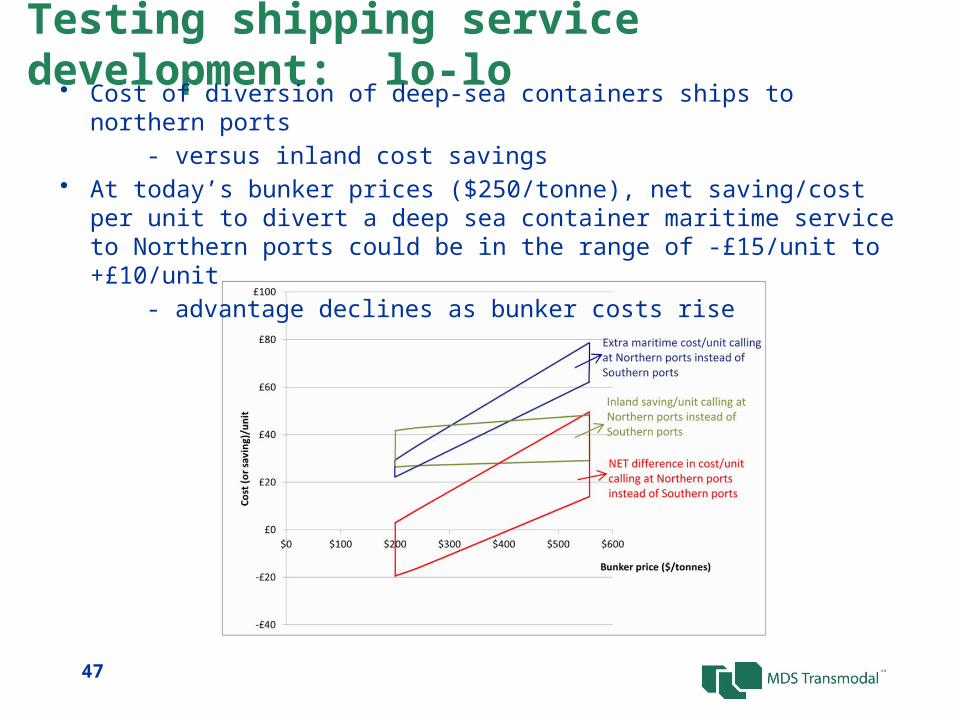
Testing shipping service development: lo-lo
47
• Cost of diversion of deep-sea containers ships to northern ports - versus inland cost savings• At today’s bunker prices ($250/tonne), net saving/cost per unit to divert a deep sea
container maritime service to Northern ports could be in the range of -£15/unit to +£10/unit
- advantage declines as bunker costs rise

For ro-ro containers• Extra maritime cost: £12/box
– versus inland saving to Manchester: £94/box• Net saving: £82/box• Advantage disappears if receivers use accompanied
haulage - favouring Channel routes
Testing shipping service development: ro-ro- Humber/Tees v. Thames ex Benelux ports
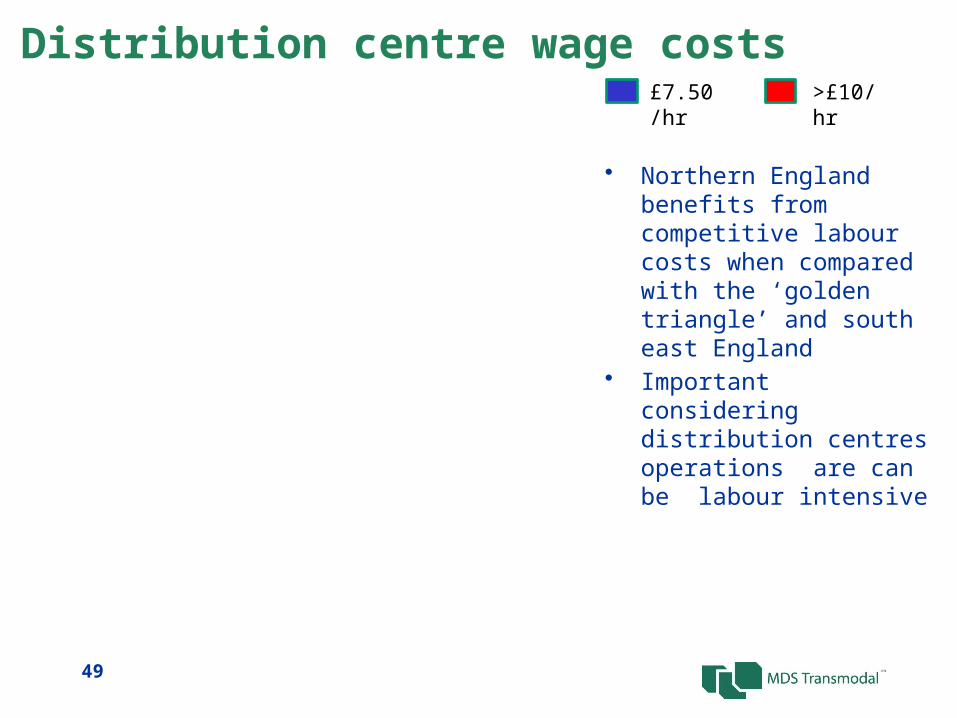
Distribution centre wage costs
• Northern England benefits from competitive labour costs when compared with the ‘golden triangle’ and south east England
• Important considering distribution centres operations are can be labour intensive
£7.50/hr >£10/hr
49

Distribution centre rental costs
• Northern England benefits from competitive rental costs when compared with the ‘golden triangle’ and south east England
£5.50/sq ft >£9/sq ft
50

Transport costs to/from distribution centres
• Assumes inbound cargo is from a combination of domestic, European and deep-sea origins
• ‘Golden triangle’, on this measure, performs well
51
Low High

Total supply chain costs at distribution centres
• Northern England offers a competitive location for a large distribution centre when sourcing and re-distributing on a national basis.
• Lower wage and rental costs mitigate higher transports costs
• Infrastructure and policy interventions maybe to maintain and enhance this position
Assumes cargo sourced from mix of domestic, European and deep-sea origins
Low High
52

Summary• Data collated and integrated through GB Freight Model ‘explaining’
current routeing and mode split• Baseline takes account of ‘known’ events such as:
– Closure of coal fired power stations– Committed infrastructure (L2, Mersey Gateway etc.)
• Baseline generally adopts Government forecasts on wage rates/energy prices etc.
• Output therefore ‘do-nothing’• Potential actions will examine opportunities to shift market shares in
ports and DC sectors
53

Questions / comments?
• Richard Brown (Chair)

Baseline 3: Northern investment plans – planned investment in transport networks Chris Hardwick, Mott MacDonald

Task
Updating the GB Freight Model (GBFM) to account for major
committed road schemes and rail projects which will influence
the 2033 baseline freight volume scenario
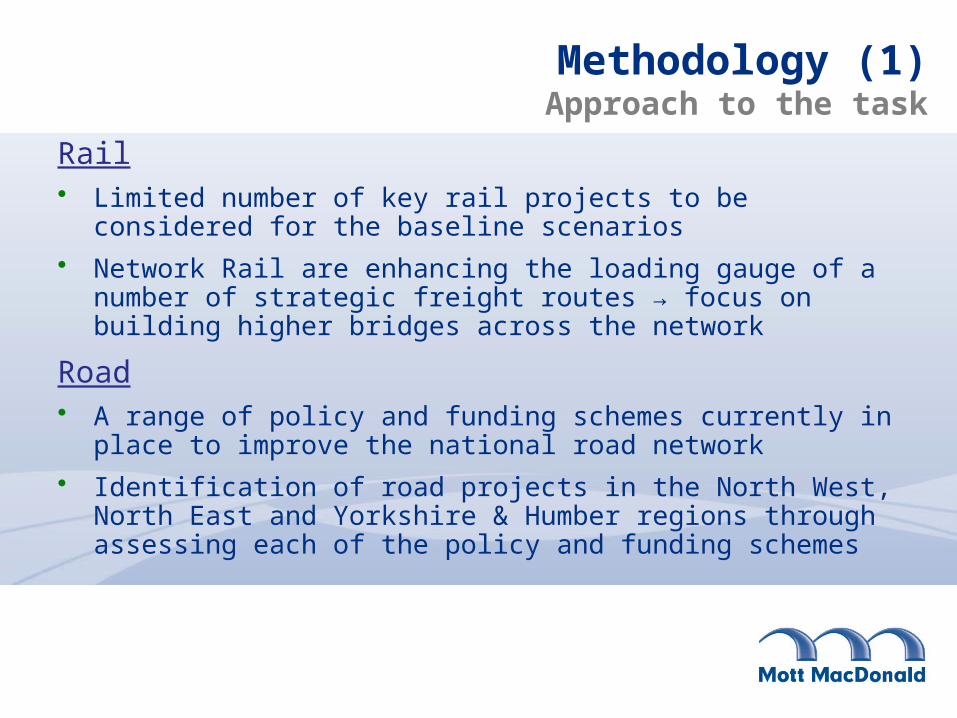
Methodology (1)Approach to the task
Rail• Limited number of key rail projects to be considered for the baseline
scenarios
• Network Rail are enhancing the loading gauge of a number of strategic freight routes → focus on building higher bridges across the network
Road• A range of policy and funding schemes currently in place to improve
the national road network
• Identification of road projects in the North West, North East and Yorkshire & Humber regions through assessing each of the policy and funding schemes

Methodology (2)Initial identification of major road schemes
DfT Pinch Point
Programme
Combined Authority transport funding
Local Growth
Funding
DfT Pinch Point
Funding (Tranche 1-
4)
Local Enterprise
Partnership transport
deals
Road Investment Strategy 1
(DfT)
Major Road Scheme
Investment Policies/ Funding
• Total of 94 schemes identified in initial analysis of current and future road schemes across the North
• Ranging from £1.5m to £500m estimated cost
• Problem - Too many schemes to factor into the model. Many schemes focused on road reconfiguration as opposed to increasing network capacity

Methodology (3)Development of road scheme shortlist
Initial shortlist narrowed down to schemes whereby the principal expected benefit is an increase in road capacity i.e. new road, road
widening/extension of existing carriageway
Input from Mott MacDonald’s offices in Leeds, Newcastle and Manchester to reaffirm key schemes and alert Liverpool office to
potential missing schemes
Proposed schemes which have not yet been granted Programme Entry are removed from the shortlist

Methodology (4)Output
32 schemes to be included in the updated GBFM. These schemes are currently in one of a number of development
stages:
1) Programme entry sort
2) Business case/funding
approved
3) Contractor appointed
4) Construction
underway
5) Construction finished (scheme not accounted for in
GBFM)

North West
Port of Workington
access improvements
(Stage 1)
Wigan Gateway A49
Link (Stage 3)
Mersey Gateway Bridge (Stage 4)
Heysham M6 Link Road (Stage 4)
Yorkshire and Humber
East Leeds Orbital Road
(Stage 1)
M621 upgrade
between J1-7 (Stage 2)
Wakefield Eastern
Relief Road (Stage 4)
Northern Link Road, Pontefract (Stage 5)
North East
Sunderland Strategic Transport Corridor (Stage 1)
A19 Testos Junction upgrade (Stage 1)
19/A1058 coast road nr
Newcastle (Stage 3)
Morpeth Northern Bypass
(Stage 4)
Scheme examples

Case Study (1)Heysham M6 Link Road
• Creation of a new 4.8km dual carriageway to link Heysham/Morecambe to the M6
• £111m DfT funding contribution secured in 2011
• Construction underway in mid 2014
• Scheme aims to increase access to Morecambe and the surrounding industrial areas including the Port of Heysham and power stations in Heysham.
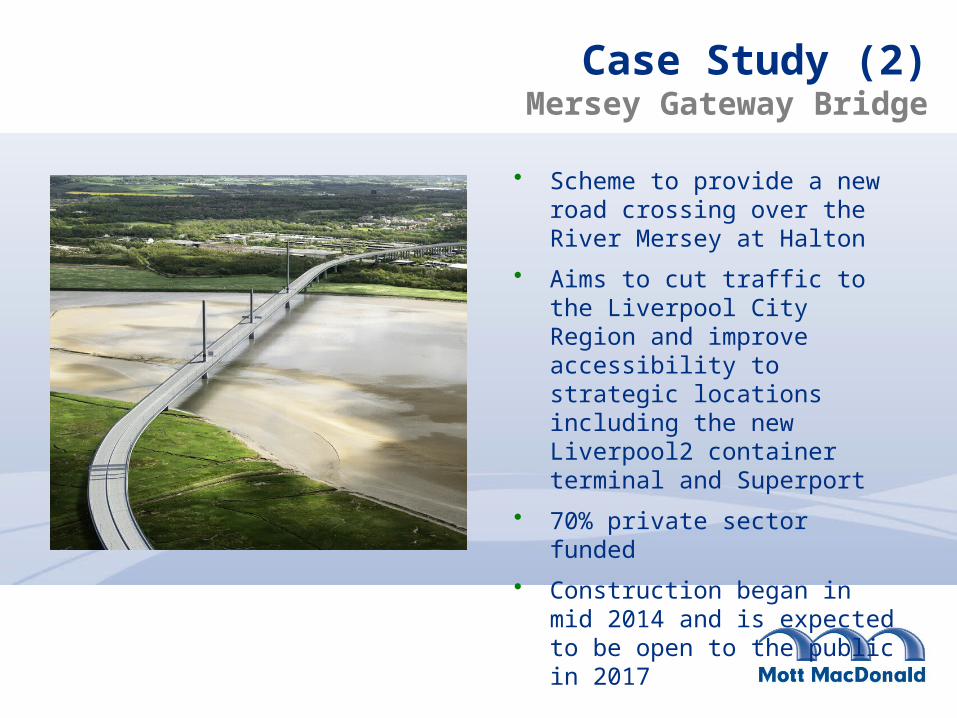
Case Study (2)Mersey Gateway Bridge
• Scheme to provide a new road crossing over the River Mersey at Halton
• Aims to cut traffic to the Liverpool City Region and improve accessibility to strategic locations including the new Liverpool2 container terminal and Superport
• 70% private sector funded
• Construction began in mid 2014 and is expected to be open to the public in 2017

Case Study (3)Sunderland Strategic Transport Corridor
• New dual carriageway link between the A19 and the Port of Sunderland including the construction of a new road bridge over the River Wear
• Provisional £40.5m funding agreed through the North Eastern LEP of the estimated £117m cost
• Scheme will be the subject of a planning application in 2016

Case Study (4)A19/A1058 coast road nr Newcastle
• Upgrade of the existing junction roundabout to a three level interchange; A19 to be placed in an open cut underpass
• Contractor has been appointed, site clearance is now underway
• Scheme aims to improve access to the Port of Tyne, Newcastle and major employment sites as well as alleviate congestion on the A19

Strategic rail schemes
• Electrification benefits introducing load gauge upgrade
– Manchester – Leeds (Diggle)
– Manchester – Leeds (Calder Valley)
– Leeds – York
– Blackpool – Preston – Manchester
• HS2 phase two relieving main line capacity:
– Crewe – Wigan/Manchester
– Lichfield – Toton – Sheffield – Leeds
• Remote investments improving accessibility for Northern England
– Felixstowe – Ipswich doubling
– Ipswich – Nuneaton capacity upgrade
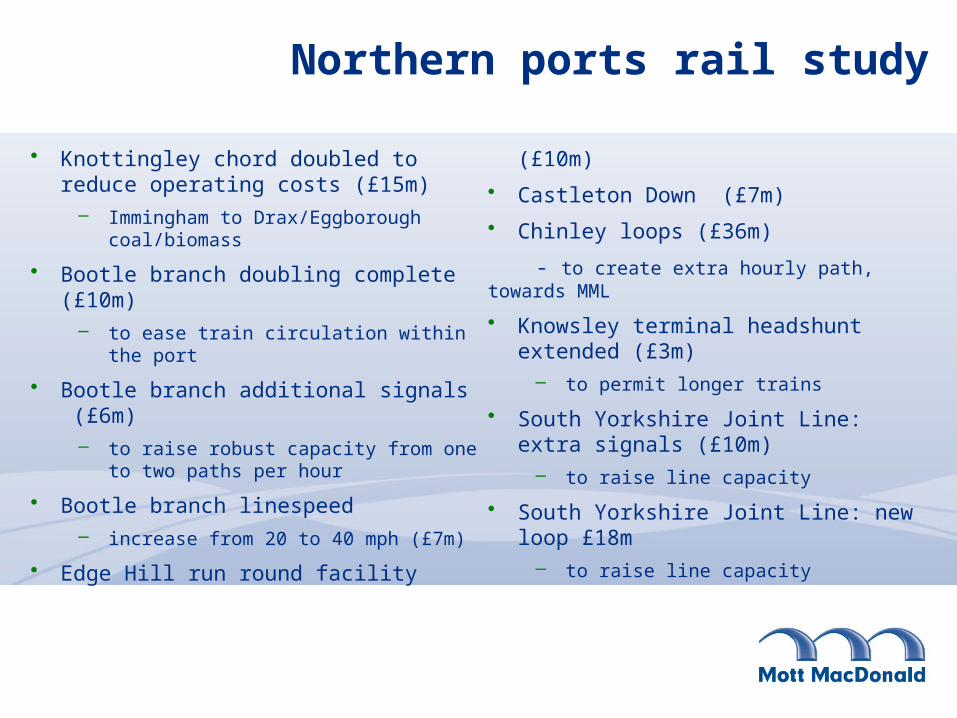
Northern ports rail study
• Knottingley chord doubled to reduce operating costs (£15m)
– Immingham to Drax/Eggborough coal/biomass
• Bootle branch doubling complete (£10m)– to ease train circulation within the port
• Bootle branch additional signals (£6m)– to raise robust capacity from one to two
paths per hour
• Bootle branch linespeed – increase from 20 to 40 mph (£7m)
• Edge Hill run round facility (£10m)
• Castleton Down (£7m)
• Chinley loops (£36m)
- to create extra hourly path, towards MML
• Knowsley terminal headshunt extended (£3m)
– to permit longer trains
• South Yorkshire Joint Line: extra signals (£10m)
– to raise line capacity
• South Yorkshire Joint Line: new loop £18m– to raise line capacity

Supporting private sector investments
• Significant private sector investment mirrors public investment in road and rail infrastructure– Port Infrastructure
– Distribution Parks
– Equipment and Plant
• A key aim for today is to understand how to support your investment priorities and plans!!

Questions / comments?
• Richard Brown (Chair)

Break
• 1225-1315 Enjoy your lunch!
Baseline 4: Developing a strategy within the policy contextChris Rowland (MDST) and Chris Hardwick (Mott MacDonald)

Introduction to the presentation
• The policy framework
• The strategy development process
• Scenario testing & development
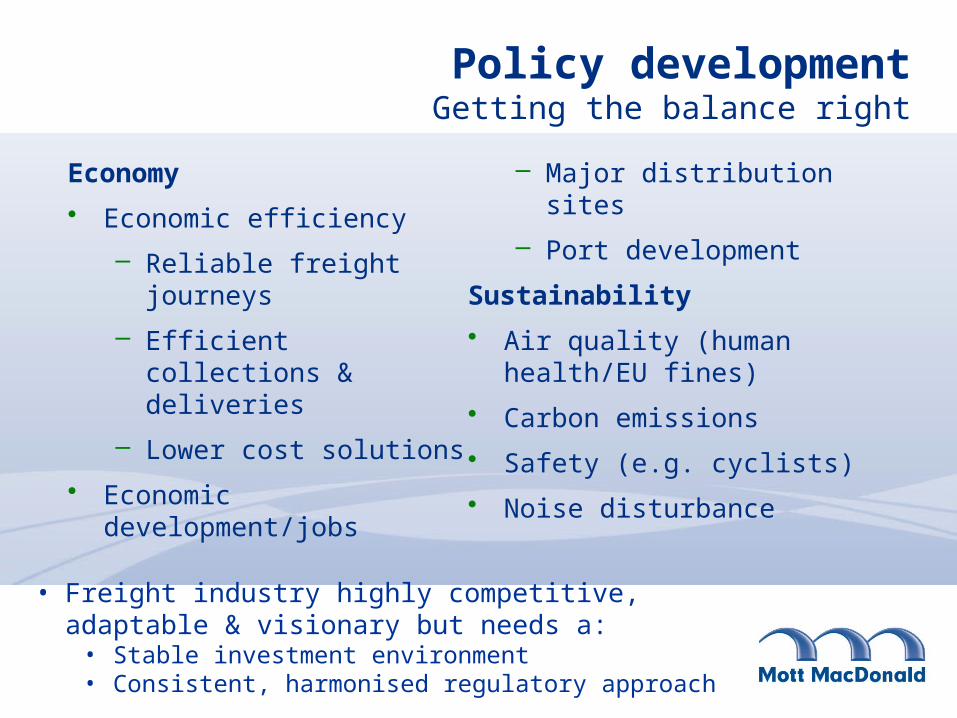
Policy developmentGetting the balance right
Economy
• Economic efficiency
– Reliable freight journeys
– Efficient collections & deliveries
– Lower cost solutions
• Economic development/jobs
– Major distribution sites
– Port development
Sustainability
• Air quality (human health/EU fines)
• Carbon emissions
• Safety (e.g. cyclists)
• Noise disturbance
• Freight industry highly competitive, adaptable & visionary but needs a:
• Stable investment environment• Consistent, harmonised regulatory approach
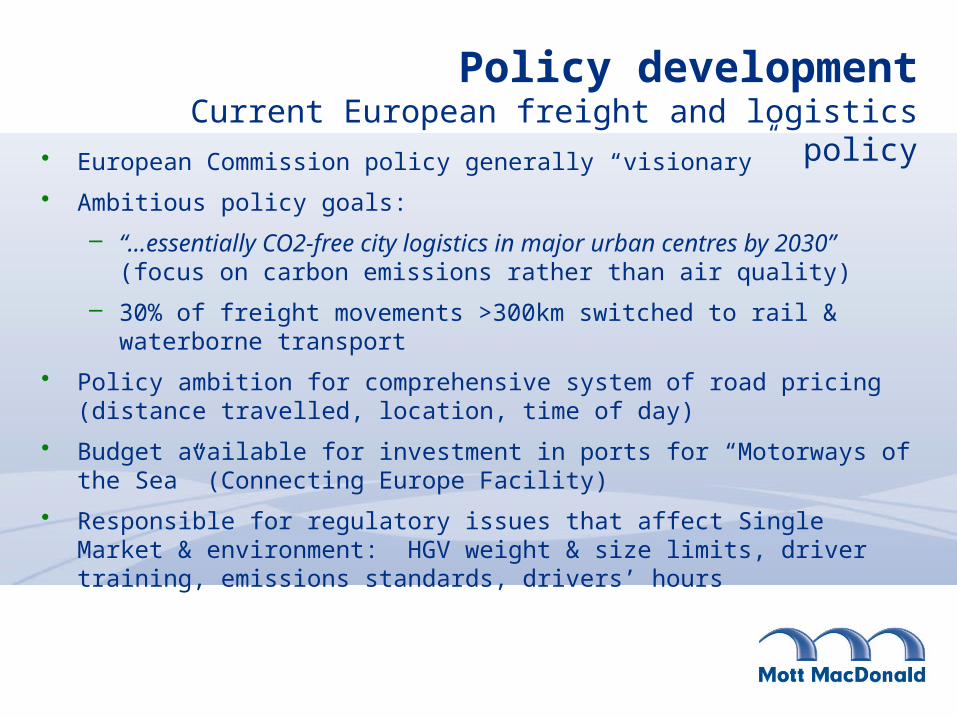
Policy developmentCurrent European freight and logistics policy
• European Commission policy generally “visionary”
• Ambitious policy goals:
– “…essentially CO2-free city logistics in major urban centres by 2030” (focus on carbon emissions rather than air quality)
– 30% of freight movements >300km switched to rail & waterborne transport
• Policy ambition for comprehensive system of road pricing (distance travelled, location, time of day)
• Budget available for investment in ports for “Motorways of the Sea” (Connecting Europe Facility)
• Responsible for regulatory issues that affect Single Market & environment: HGV weight & size limits, driver training, emissions standards, drivers’ hours

Policy developmentCurrent UK National freight and logistics policy
• Key document: Logistics Growth Review (2011)
• No policy to introduce road pricing, but introduced HGV Road User Levy to help domestic road haulage industry
• Some limited interventions to encourage take-up of low emission vehicles & piloting longer semi-trailers
• Some funding for modal switch to rail freight
• Main focus on managing demand for scarce network capacity & funding some additional capacity
• Support for sustainable distribution through planning policy (National Planning Policy Framework)
• More direct approach on planning guidance to support development of SRFIs & port facilities (National Policy Statements)

Policy developmentNational Networks NPS
• “Vision and policy for the future development of nationally significant infrastructure projects on the national road and rail networks”:
– National road
– National rail
– Strategic Rail Freight Interchanges (SRFIs)
• Allows the Government to develop suitable national infrastructure (and meet requirements of EC Habitats Directives) by showing there is a “compelling need” for development
• SRFIs in the North need rail linked facilities in London/SE, so the trains “have somewhere to go”
Location of SRFIs
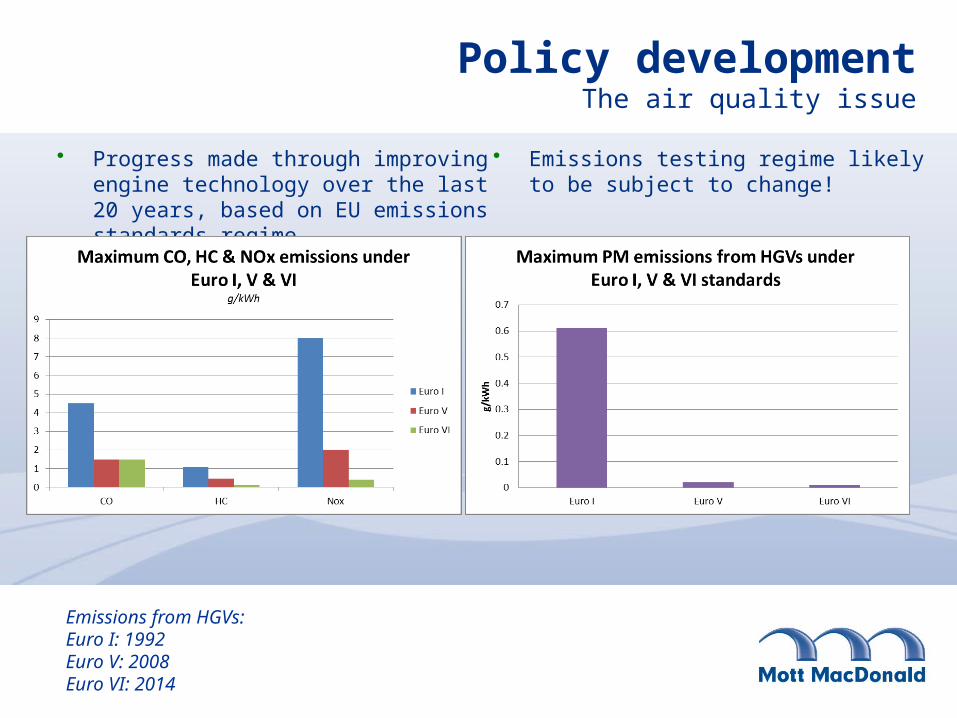
Policy developmentThe air quality issue
• Progress made through improving engine technology over the last 20 years, based on EU emissions standards regime
• Emissions testing regime likely to be subject to change!
Emissions from HGVs:Euro I: 1992Euro V: 2008Euro VI: 2014

Policy developmentThe air quality Issue
• Poor air quality leads to an estimated 52,500 premature deaths each year in the UK:– 29,000 from particulate matter (PM)
– 23,500 from nitrogen dioxide
– 9% of all deaths in UK
• Defra response to UK Supreme Court judgment on failure to meet EU law on air quality (September 2015):– Road transport is source of 80% of NOx in problem areas
– Based on modelling 8 areas will not be compliant with EU law by 2020, including Leeds
• Suggested approaches by Defra for 8 areas (subject to consultation):– Electrification of vehicle fleet
– Access restrictions
• Challenge is to identify win-win solutions that are commercially sustainable

The strategy development process
Scenario Development
GB Freight Model / Strategic Highway Models
Impacts Evaluation (e.g. job creation / GVA / network performance)
The Strategy

Use of the GB Freight Model
• Forecasting will rely on transport cost model using GB Freight Model and ‘End-to-End’ Shipping Cost Model
• Forecasts mainly for the year 2033
• Forecasts will take into account the impact of infrastructure, planning and other policy measures on transport costs
• Scenarios can be developed to test the impact of changes in the policy and market environment for a future year
• This then allows evaluation of the impact of changes on GVA, job creation, environmental performance etc.

Scenario testing – infrastructureRoad schemes
Understand Congestion
and Network Capacity Issues
Development and testing of interventions
against economic growth
criteria
Capture calculated changes in
network performance for
scenarios
Understand additional job creation and GVA benefits
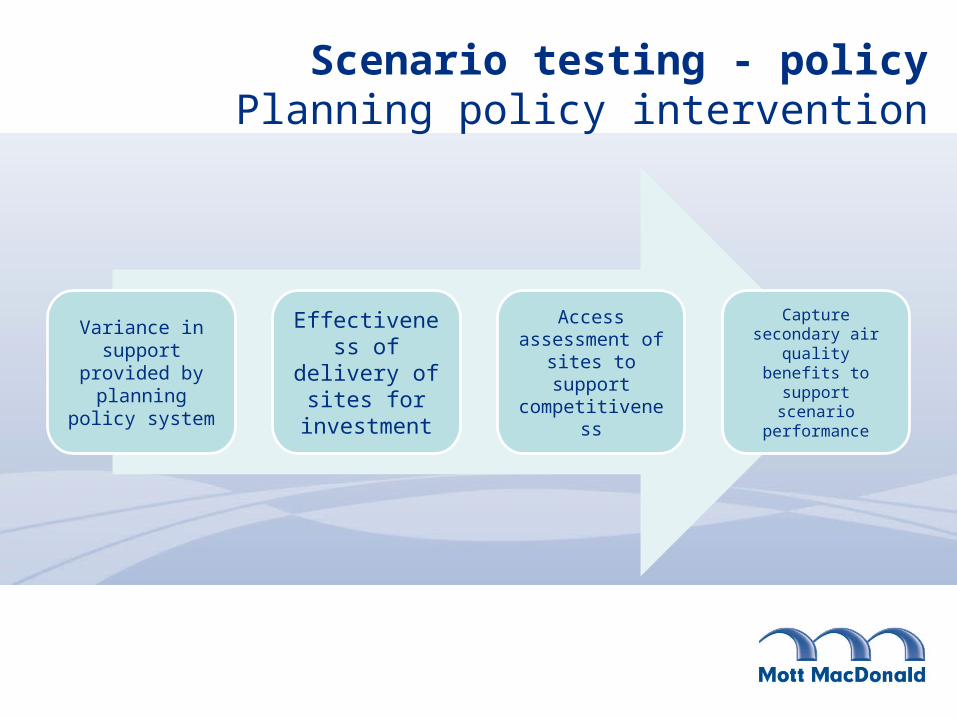
Scenario testing - policyPlanning policy intervention
Variance in support
provided by planning
policy system
Effectiveness of delivery of sites for investment
Access assessment of sites to support competitivenes
s
Capture secondary air
quality benefits to support scenario
performance
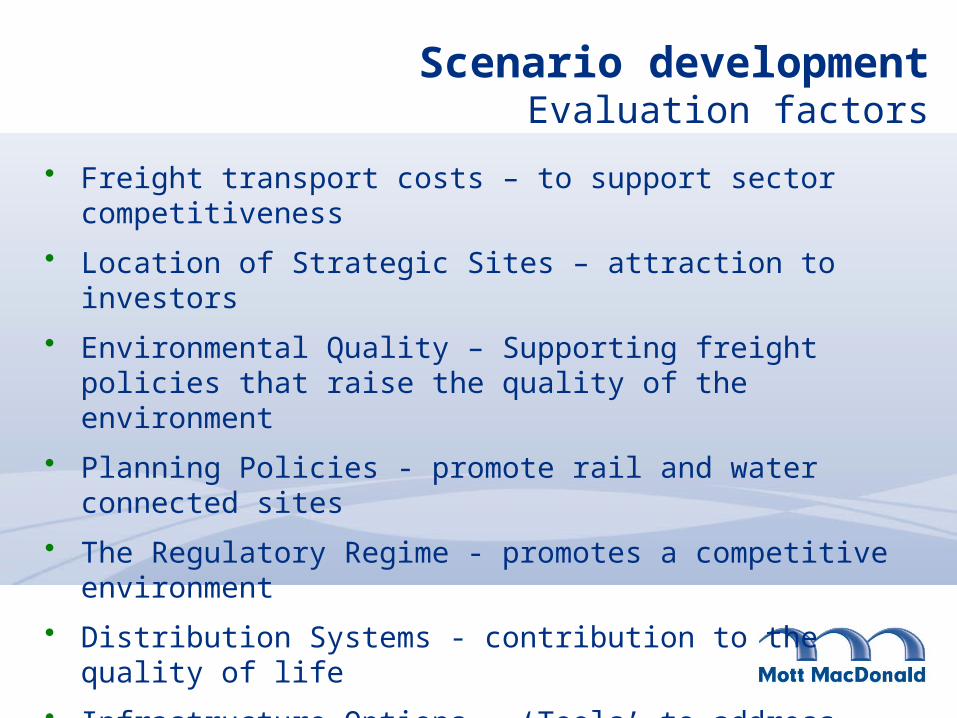
Scenario developmentEvaluation factors
• Freight transport costs – to support sector competitiveness
• Location of Strategic Sites – attraction to investors
• Environmental Quality – Supporting freight policies that raise the quality of the environment
• Planning Policies - promote rail and water connected sites
• The Regulatory Regime - promotes a competitive environment
• Distribution Systems - contribution to the quality of life
• Infrastructure Options – ‘Tools’ to address network performance

Questions / comments?
• Richard Brown (Chair)

Introduction to discussion activities Kerry Scott, Mott MacDonald

Getting your input into strategy development
• Stakeholder engagement is essential
• This is your opportunity to contribute to the shape of the strategy
• We want to get an insight into your:– Experience
– Expertise
– Priorities for the future of freight and logistics in the North
The discussion sessions
• Facilitated table discussions
• Three main areas for consideration:– Key strengths and opportunities
– Key constraints and challenges
– Interventions, developments, investments needed
• Plenary session to share and receive comments on your top priorities

Engagement: next steps
• Your first opportunity to contribute … but not your last
• Filling any stakeholder gaps
• Online survey to capture:
– More detailed evidence
– Further thoughts on key questions
– Additional data or information
– Investment plans
Group discussionsTopics to discuss
• What are the current key strengths and opportunities for the freight and logistics sector in the North?
• What are the key issues and constraints that pose challenges to the freight and logistics sector across the North?
• What changes and developments are necessary in order for the freight and logistics industry to invest more in the North so that it can help with geographically rebalancing the economy?
Refreshment break

Feedback and key messages from discussion groupsKerry Scott, Mott MacDonald

Questions / comments?
• Richard Brown (Chair)

Next steps and conference closeRichard Brown, Mott MacDonald

Programme Reminder
Phase 1 – Completion of baseline and evidence capture
Phase 2 – Scenario Development and Testing – to Christmas
Phase 3 – Draft Strategy end of January, Final Strategy March 2016

Online stakeholder survey
Now live via the website
http://www.tfnfreight.org/
Closes at midnight on Sunday 18th October

Summary
• A Northern Freight and Logistics Strategy – A shared vision
– Supporting action plan
– A prospectus for co-ordinated investment to maximise the growth potential and economic impact of Northern freight and logistics sector

Thank you for attending