Embed Size (px)
Citation preview
Draft Not To Be Quoted 1.A.2 Manufacturing industries and construction (combustion)
Category Title
NFR: 1.A.2 Manufacturing industries and construction (combustion)
SNAP: 03 Combustion in manufacturing industry
ISIC:
Version Guidebook 20136
Update history
Updated September 2013 and 2016
For details of past updates please refer to the chapter update log available at the online Guidebook website http://www.eea.europa.eu/publications/emep-eea-guidebook-2013/
CoordinatorsCarlo Trozzi and Jeroen Kuenen
Contributing authors (including to earlier versions of this chapter)Ole-Kenneth Nielsen, Otto Rentz, Dagmar Oertel, Mike Woodfield and Robert Stewart
Draft Not To Be Quoted
1123
456789
10111213141516171819202122232425262728293031
2

Draft Not To Be Quoted 1.A.2 Manufacturing industries and construction (combustion)
Contents1 Overview...................................................................................................................................32 Description of sources...............................................................................................................5
2.1 Process description..............................................................................................................52.2 1.A.2.a — Iron and steel.....................................................................................................62.3 1.A.2.b — Non-ferrous metals............................................................................................72.4 1.A.2.c — Chemicals..........................................................................................................72.5 1.A.2.d — Pulp, paper and print..........................................................................................72.6 1.A.2.e — Food processing, beverages and tobacco...........................................................72.7 1.A.2.f — Other..................................................................................................................82.8 Techniques........................................................................................................................102.9 Emissions..........................................................................................................................102.10 Controls.............................................................................................................................11
3 Methods..................................................................................................................................123.1 Choice of method..............................................................................................................123.2 Tier 1 default approach.....................................................................................................133.3 Tier 2 technology-specific approach.................................................................................193.4 Tier 3 use of facility data...................................................................................................32
4 Data quality.............................................................................................................................334.1 Completeness....................................................................................................................334.2 Avoiding double counting with other sectors....................................................................334.3 Verification.......................................................................................................................334.4 Developing a consistent time series and recalculation......................................................344.5 Uncertainty assessment.....................................................................................................344.6 Inventory quality assurance/quality control QA/QC.........................................................344.7 Mapping............................................................................................................................344.8 Reporting and documentation...........................................................................................34
5 Glossary..................................................................................................................................346 References...............................................................................................................................357 Point of enquiry......................................................................................................................37
Draft Not To Be Quoted
11
2
3456789
1011121314151617181920212223242526272829303132
2
Draft Not To Be Quoted 1.A.2 Manufacturing industries and construction (combustion)
1 OverviewThis chapter covers the methods and data needed to estimate emissions associated with fuel combustion in manufacturing industries and construction (Nomenclature for Reporting (NFR) source categories 1.A.2). The sub-sectors cover combustion installations activities in the following source categories:
1.A.2.a — Iron and steel
1.A.2.b — Non-ferrous metals
1.A.2.c — Chemicals
1.A.2.d — Pulp, paper and print
1.A.2.e — Food processing, beverages and tobacco
1.A.2.f — Other
The activities essentially cover combustion activities in industry. The technologies applied can often be the same or very similar to those applied in source categories 1.A.1 and 1.A.4.
Where combustion activities essentially relate to the use of fuels in conventional boilers, furnace, gas turbine, engine or other combustion devices the user is guided to Chapters 1.A.1 Energy industries and 1.A.4 Small combustion for information on technologies and emissions.
This sub-sector provides guidance on estimating emissions where the combustion process is an integral part of the manufacturing process (for example where fuels are process by-products or where combustion products and the process materials directly mix) and, where combustion products may be modified by the interaction with the production activity.
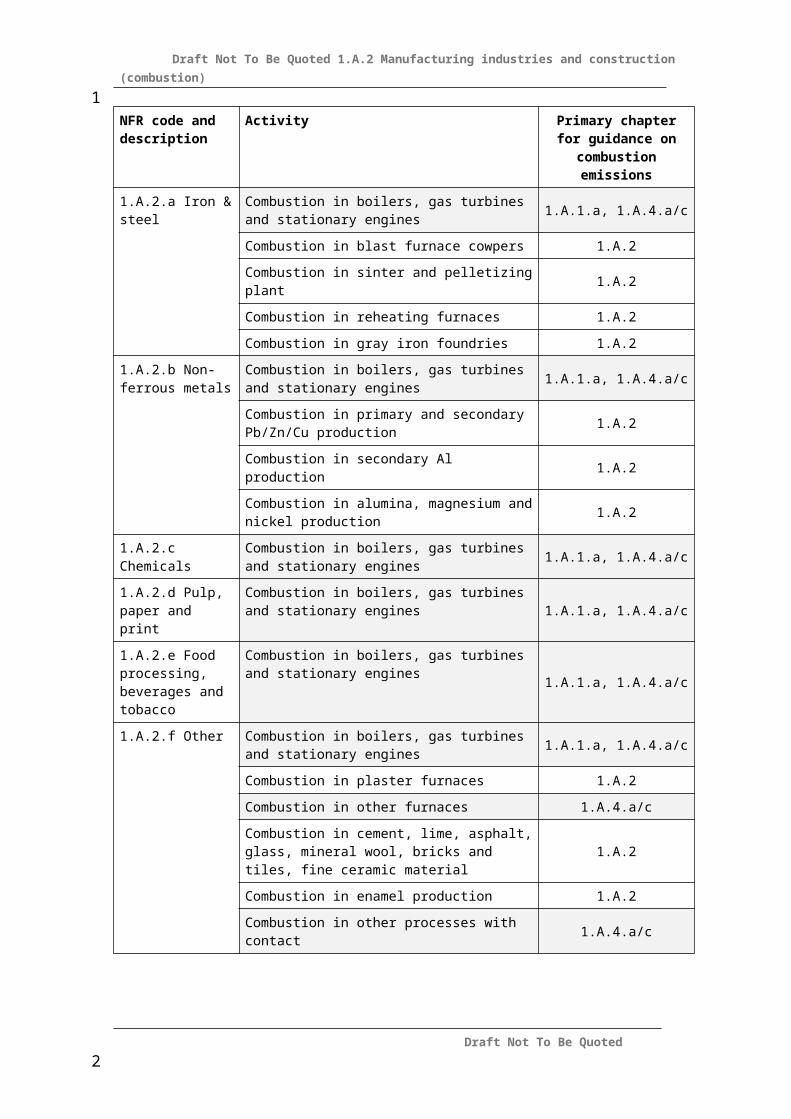
Guidance on where to find emission guidance for the combustion emissions is provided in Table 1-1.
In many instances release of pollutants can occur due to both the process and combustion activities. Guidance on estimating process emissions is provided within section 2 of this chapter (see section 2, Table 2-2). It is generally not possible to allocate an emission between the process and combustion processes. Furthermore, inclusion of a mechanism which could allocate the emission between the process and combustion activity adds complexity to the inventory, leads to loss of transparency and perhaps double-counting.
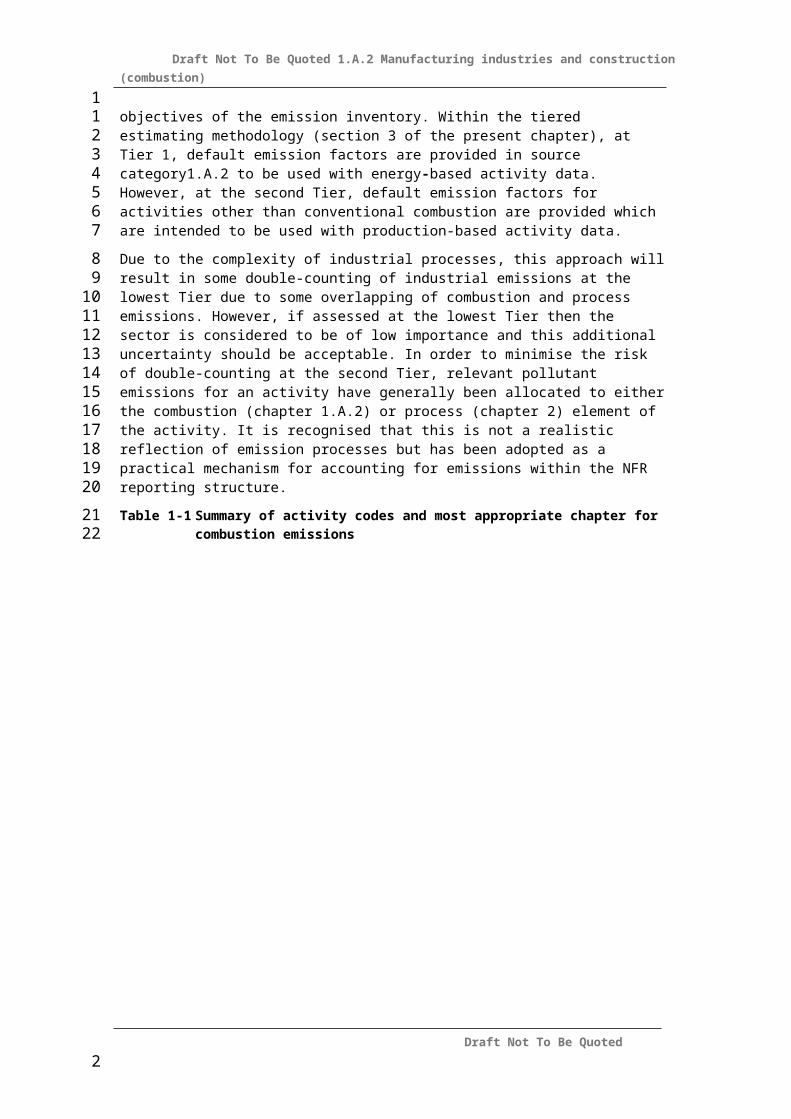
The Guidebook adopts a pragmatic approach to apply the most appropriate emission factors consistent with the quality objectives of the emission inventory. Within the tiered estimating methodology (section 3 of the present chapter), at Tier 1, default emission factors are provided in source category1.A.2 to be used with energy-based activity data. However, at the second Tier, default emission factors for activities other than conventional combustion are provided which are intended to be used with production-based activity data.
Due to the complexity of industrial processes, this approach will result in some double-counting of industrial emissions at the lowest Tier due to some overlapping of combustion and process emissions. However, if assessed at the lowest Tier then the sector is considered to be of low importance and this additional uncertainty should be acceptable. In order to minimise the risk of double-counting at the second Tier, relevant pollutant emissions for an activity have generally been allocated to either the combustion (chapter 1.A.2) or process (chapter 2) element of the
Draft Not To Be Quoted
1
1
2345
6789
1011
1213
141516
17181920
2122
232425262728
293031323334
353637383940
2
Draft Not To Be Quoted 1.A.2 Manufacturing industries and construction (combustion)
activity. It is recognised that this is not a realistic reflection of emission processes but has been adopted as a practical mechanism for accounting for emissions within the NFR reporting structure.
Table 1-1 Summary of activity codes and most appropriate chapter for combustion emissions
NFR code and description
Activity Primary chapter for guidance on combustion
emissions
1.A.2.a Iron & steel Combustion in boilers, gas turbines and stationary engines 1.A.1.a, 1.A.4.a/c
Combustion in blast furnace cowpers 1.A.2
Combustion in sinter and pelletizing plant 1.A.2
Combustion in reheating furnaces 1.A.2
Combustion in gray iron foundries 1.A.2
1.A.2.b Non-ferrous metals
Combustion in boilers, gas turbines and stationary engines 1.A.1.a, 1.A.4.a/c
Combustion in primary and secondary Pb/Zn/Cu production 1.A.2
Combustion in secondary Al production 1.A.2
Combustion in alumina, magnesium and nickel production 1.A.2
1.A.2.c Chemicals Combustion in boilers, gas turbines and stationary engines 1.A.1.a, 1.A.4.a/c
1.A.2.d Pulp, paper and print
Combustion in boilers, gas turbines and stationary engines 1.A.1.a, 1.A.4.a/c
1.A.2.e Food processing, beverages and tobacco
Combustion in boilers, gas turbines and stationary engines 1.A.1.a, 1.A.4.a/c
1.A.2.f Other Combustion in boilers, gas turbines and stationary engines 1.A.1.a, 1.A.4.a/c
Combustion in plaster furnaces 1.A.2
Combustion in other furnaces 1.A.4.a/c
Combustion in cement, lime, asphalt, glass, mineral wool, bricks and tiles, fine ceramic material 1.A.2
Combustion in enamel production 1.A.2
Combustion in other processes with contact 1.A.4.a/c
Combustion in other mobile machinery/industry 1.A.2.f.ii(Other non-road mobile
machinery)
Draft Not To Be Quoted
112
3
45
2
Draft Not To Be Quoted 1.A.2 Manufacturing industries and construction (combustion)
2 Description of sources
2.1 Process descriptionThe combustion activities undertaken in manufacturing industries generally provide process heat (directly or indirectly usually via steam, water or oil), electricity, or the fuel may be transformed in the production activity.
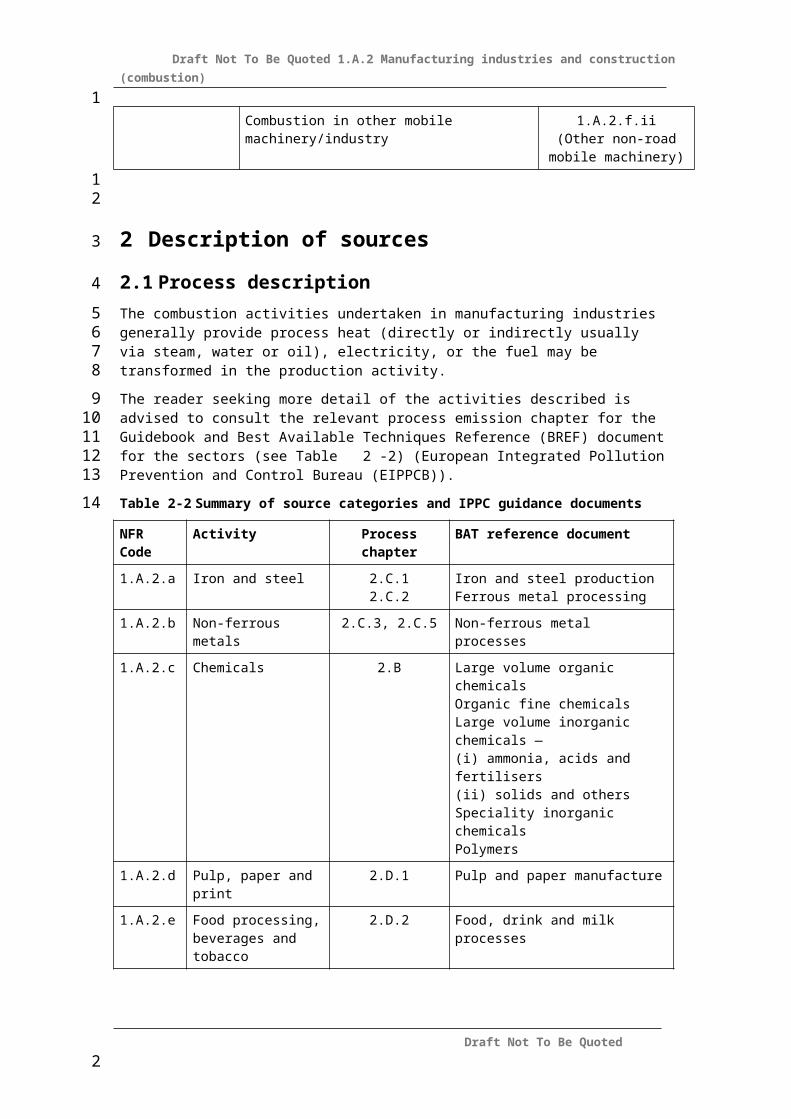
The reader seeking more detail of the activities described is advised to consult the relevant process emission chapter for the Guidebook and Best Available Techniques Reference (BREF) document for the sectors (see Table 2-2) (European Integrated Pollution Prevention and Control Bureau (EIPPCB)).
Table 2-2 Summary of source categories and IPPC guidance documents
NFR Code Activity Process chapter BAT reference document
1.A.2.a Iron and steel 2.C.12.C.2
Iron and steel productionFerrous metal processing
1.A.2.b Non-ferrous metals 2.C.3, 2.C.5 Non-ferrous metal processes
1.A.2.c Chemicals 2.B Large volume organic chemicalsOrganic fine chemicalsLarge volume inorganic chemicals —(i) ammonia, acids and fertilisers(ii) solids and othersSpeciality inorganic chemicalsPolymers
1.A.2.d Pulp, paper and print 2.D.1 Pulp and paper manufacture
1.A.2.e Food processing, beverages and tobacco
2.D.2 Food, drink and milk processes
1.A.2.f Other 2.A.1, 2.A.2, 2.A.62.G
Cement and lime productionGlass manufacture
Additional information is also available in the US Environmental Protection Agency (US EPA) Emission Factor Handbook (US EPA, AP-42). Emissions from industrial combustion installations are significant due to their size and numbers, different type of combustion techniques employed, and range of efficiencies and emissions. In some countries, particularly those with economies in transition, combustion plant and equipment may be outdated, polluting and inefficient.
Draft Not To Be Quoted
11
2
345
6789
10
1112131415
2
Draft Not To Be Quoted 1.A.2 Manufacturing industries and construction (combustion)
Process Emissions Chapter 2
Combustion
Fuel
ProductRaw Materials
Combustion Emissions
Process Emissions Chapter 2
Combustion
Fuel
ProductRaw Materials
Combustion Emissions
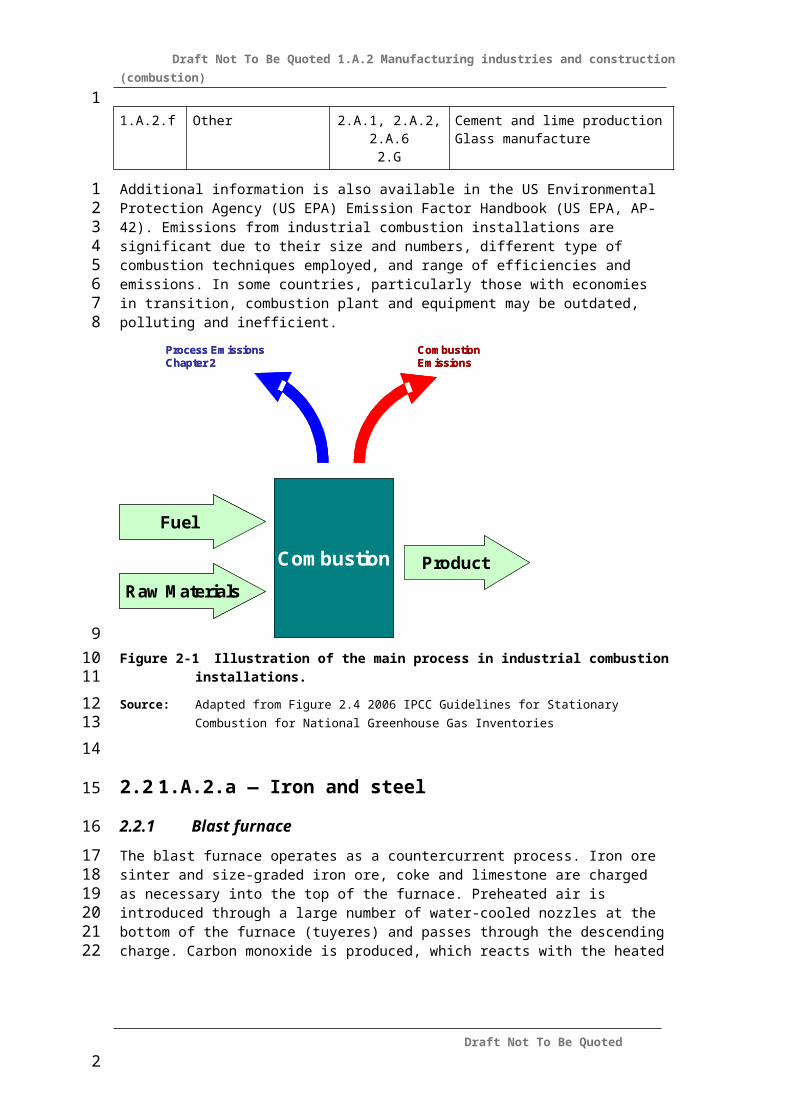
Figure 2-1 Illustration of the main process in industrial combustion installations.
Source: Adapted from Figure 2.4 2006 IPCC Guidelines for Stationary Combustion for National Greenhouse Gas Inventories
2.2 1.A.2.a — Iron and steel
2.2.1 Blast furnace
The blast furnace operates as a countercurrent process. Iron ore sinter and size-graded iron ore, coke and limestone are charged as necessary into the top of the furnace. Preheated air is introduced through a large number of water-cooled nozzles at the bottom of the furnace (tuyeres) and passes through the descending charge. Carbon monoxide is produced, which reacts with the heated charge to form molten high-carbon iron, slag and blast furnace gas. The molten iron and slag are periodically discharged.
2.2.2 Sintering and pelletizing plants
The sintering process is a pretreatment step in the production of iron in which metal ores, coke and other materials are roasted under burners (using gaseous fuels derived from other activities in the iron production). Agglomeration of the fine particles is necessary to increase the passageway for the gases during the blast furnace process. The strength of the particles is also increased by agglomeration.
2.2.3 Reheating furnaces
Reheating furnaces prepare cool iron material for further processing by an appropriate temperature increase. In soaking pits, ingots are heated until the temperature distribution over the cross section of the ingots is acceptable and the surface temperature is uniform for further rolling into semifinished products (blooms, billets and slabs). In slab furnaces, a slab is heated before being rolled into finished products (plates, sheets or strips).
Draft Not To Be Quoted
1
12
34
5
6
7
89
10111213
14
1516171819
20
2122232425
2
Draft Not To Be Quoted 1.A.2 Manufacturing industries and construction (combustion)
2.2.4 Grey iron foundries
Combustion in foundries includes heating of moulds, castings and the melting furnace.
2.3 1.A.2.b — Non-ferrous metals
2.3.1 Primary metal production
Combustion is relevant to primary production of many metals. Use of coke, carbon monoxide and carbonyl formation are relevant to several production schemes. Apart from primary metal production there are combustion activities used for melting, casting and heat-treatment furnaces.
2.3.2 Secondary metal recovery
Use of melting furnaces for scrap recovery and subsequent purification is typical of many secondary metal recovery activities.
2.4 1.A.2.c — ChemicalsCombustion in the chemicals sector ranges from conventional fuels in boiler plant and recovery of process by-products using thermal oxidisers to process-specific combustion activities (for example catalytic oxidation of ammonia during nitric acid manufacture).
2.5 1.A.2.d — Pulp, paper and printThe production of pulp and paper requires considerable amounts of steam and power. Most pulp and paper mills produce their own steam in one or more industrial boilers or combined heat and power (CHP) units which burn fossil fuels and/or wood residues. Mills that pulp wood with a chemical process (Kraft, sulphite, soda, semi-chemical) normally combust their spent pulping liquor in a combustion unit, for example a Kraft recovery furnace, to recover pulping chemicals for subsequent reuse. These units are also capable of providing process steam and power for mill operations.
2.6 1.A.2.e — Food processing, beverages and tobaccoFood processing can require considerable amounts of heat, steam and power. Many food and beverage processes produce their own steam in one or more industrial boilers which burn fossil fuel and/or biomass. Process residues may often be dried for fuel use or prepared for animal feed.
Draft Not To Be Quoted
11
2
3
4
5
678
9
1011
12
13
141516
17
18
19202122232425
26
27
282930
31
2
Draft Not To Be Quoted 1.A.2 Manufacturing industries and construction (combustion)
2.7 1.A.2.f — Other
2.7.1 Range of activities
The 1.A.2.f category includes a variety of activities in industries not covered in 1.A.2.a–e including:
combustion in boilers, gas turbines and stationary engines,
plaster furnaces,
other furnaces,
cement, lime, asphalt, glass, mineral wool, bricks and tiles, fine ceramic material,
enamel production,
other processes with contact,
other mobile machinery/industry.
Emissions for mobile machinery are presented elsewhere. In common with other 1.A.2 activities, information on general combustion in boilers, gas turbines and engines can be found in 1.A.1 and 1.A.4. The other activities are described briefly below.
2.7.2 Cement manufacture
Portland cement can be produced either by dry or wet processes (there are also semi-dry and semi- wet processes). In the wet process, the raw material is a chalk which is first slurried with water; this slurry is passed with other constituents into a rotary kiln for calcining and cement clinker formation. In the dry process, limestone is dry-mixed with other constituents, milled and typically passed to a pre-heater tower and/or a precalciner furnace before a rotary kiln. The dry process requires less energy than the wet process. In all processes the clinker is cooled after leaving the kiln, milled and blended with additives to form various grades of cement.
Combustion occurs in the kiln and, where relevant, the pre-calciner furnace. A key feature of modern cement plant operation is that a wide range of wastes are recovered for energy in cement manufacture. The waste fuels cover a wide variety of materials including tyres, recovered liquid fuel, household waste, meat and bone meal, sewage sludge, plastics and paper waste. In addition, greater use is made of waste-derived materials (fly ash and ground blast furnace slag) to blend with cement.
2.7.3 Lime manufacture
Lime is heated in a kiln to decarbonise (calcine). Two major types of kilns are in use: vertical and rotary kilns. The vertical kilns, because of larger size of charge material, lower air velocities, and less agitation emit lower amounts of particles but higher amounts of sulphur dioxide and carbon monoxide.
2.7.4 Asphalt manufacture
Combustion in a roadstone coating plant is mainly associated with drying of aggregates which generally occurs in a rotary dryer. Plants produce asphalt and other road coatings through either batch or continuous aggregate operations. In either operation the aggregate is transported first to a gas- or oil-fired rotary dryer, hot dry aggregate is blended and passed to a mixing chamber where
Draft Not To Be Quoted
11
2
34
56789
1011
121314
15
16171819202122
232425262728
29
30313233
34
35363738
2
Draft Not To Be Quoted 1.A.2 Manufacturing industries and construction (combustion)
bitumen is added and mixed to produce the hot asphalt mix which then passes to storage bins prior to discharge to delivery lorries.
2.7.5 Glass
Combustion occurs in the melting and subsequent processing of glass. In the melting furnaces, the glass is melted at high temperature; furnaces are generally large, shallow, and well-insulated vessels that are heated from above. In operation, raw materials are introduced continuously on top of a bed of molten glass, where they are heated and start to fuse, melt and dissolve to form a molten glass.
In order to achieve higher energy efficiency and a higher flame temperature, the combustion air is preheated. Glass-melting furnaces can use electric heating or use natural gas and/or oil as a fuel, since the use of hard coal or lignite would import ash contaminants into the glass phase. A number of different product groups are included; flat glass, container glass, domestic glass, special glass and continuous filament glass fibre (CFGF). Flat and container glass are the main product groups.
2.7.6 Mineral wool
In the manufacture of mineral wool, glass and stone wool fibres are made from molten glass, and a chemical binder is simultaneously sprayed on the fibres as they are created. Two methods of creating fibres are used by the industry. In the rotary spin process, centrifugal force causes molten glass to flow through small holes in the wall of a rapidly rotating cylinder to create fibres that are broken into pieces by an air stream. This is the newer of the two processes and dominates the industry today.
2.7.7 Bricks, tiles and ceramics
2.7.7.1 Brick and tiles manufacture
Formed clay is dried and then fired at high temperature in a kiln; the drying process can be in a separate oven but is often part of the firing kiln.
2.7.7.2 Ceramic manufacture
Various combustion processes are undertaken in ceramic manufacture. Clay is heated to calcine it; there are drying activities, heat treatment and the firing process.
2.7.8 Enamel manufacture
Enamel is prepared by fusing a variety of minerals in a furnace and then rapidly quenching the molten material. The constituents vary depending on the intended use. The components are measured and mixed before passing to a melting furnace. The cast frit is broken by quenching with water and, if required, is then dried in an oven.
Draft Not To Be Quoted
112
3
45678
910111213
14
151617181920
21
22
2324
25
2627
28
29303132
2
Draft Not To Be Quoted 1.A.2 Manufacturing industries and construction (combustion)
2.8 Techniques
2.8.1 Conventional combustion
2.8.1.1 Combustion plant > 50 MWth
Please refer to chapter 1.A.1 (NFR 1.A.1.a) and the Best Available Techniques Reference (BREF) note on Large Combustion Plant for detailed information on boilers, furnaces, stationary engines and gas turbines.
2.8.1.2 Combustion plant < 50 MWth
Please refer to chapter 1.A.4 (NFR 1.A.4.a/c) for detailed information on boilers, furnaces, stationary engines and gas turbines.
2.8.2 Other combustion processes
Several combustion activities involve the mixing of combustion products and/or the fuel with the product or raw materials. This can modify the emissions from combustion, for example adding or removing particulate matter (PM), SO2, non-methane volatile organic compounds (NMVOC). The potential for modification of the emissions is important if trying to separate combustion and process emissions.
A number of processes can be involved:
attrition/suspension of PM (and PM fractions) from contact between combustion gases and a solid phase product;
evolution of NMVOC from heating of material;
absorption or desorption of acid gases;
combustion of raw materials or product;
gasification or pyrolysis of fuel and other raw products;
modification of pollutant evolution due to atypical conditions compared to normal combustion activities (higher temperature, reducing furnace, oxygen enhancement).
The actual mechanisms will depend on the activity undertaken. However, for the purposes of inventory guidance, each pollutant is assigned to either a combustion or a process source — no apportioning of the emission between process and combustion activities is considered. It is recognised that this is not a realistic reflection of emission processes but has been adopted as a practical mechanism for accounting for emissions within the NFR-reporting structure.
2.9 EmissionsThe emissions will depend on the fuel and process activity. Relevant pollutants are generally as described for combustion: SO2, NOx, CO, NMVOC, particulate matter (TSP, PM10, PM2.5), black carbon (BC), heavy metals (HM), polycyclic aromatic hydrocarbons (PAH), polychlorinated dibenzo-dioxin and polychlorinated dibenzo-furans (PCDD/F) and, for some activities, polychlorinated biphenyls (PCB) and hexachlorobenzene (HCB).
Note that the inventory methodologies for Greenhouse gas emissions (carbon dioxide, methame and nitrous oxide) are not included – refer to IPCC guidance [IPCC, 2006].
Draft Not To Be Quoted 10
11
2
3
456
7
89
10
1112131415
16
1718192021222324
2526272829
30
3132333435
3637
2
Draft Not To Be Quoted 1.A.2 Manufacturing industries and construction (combustion)
Sulphur oxides — in the absence of emission abatement, the emission of SO2 is dependent on the sulphur content of the fuel. For cement manufacture, some of the SO2 (and other acid gases) is absorbed through contact with alkaline media in the cement kiln and, in the dry process, the raw meal.
Nitrogen oxides — emission of NOx is generally in the form of nitric oxide (NO) with a small proportion present as nitrogen dioxide (NO2). Nitric acid manufacture includes catalytic combustion of ammonia to provide NO2 for subsequent absorption.
TSP, PM10, PM2.5, BC — particulate matter in flue gases from combustion of fuels can also include entrained material from product or feedstock. Drying activities can generate significant non-combustion PM; for example, drying of cement feedstock, aggregate in roadstone plants, china clay, dark grains, other vegetable matter, pulp and wood. A part of the particulate matter from the combustion of fuels will be emitted in the form of black carbon (BC)1 .
A number of factors influence the measurement and determination of primary PM emissions from activities and, the quantity of PM determined in an emission measurement depends to a large extent on the measurement conditions. This is particularly true of activities involving high temperature and semi-volatile emission components – in such instances the PM emission may be partitioned between a solid/aerosol phase and material which is gaseous at the sampling point but which can condense in the atmosphere. The proportion of filterable and condensable material will vary depending on the temperature of the flue gases and in sampling equipment.
A range of filterable PM measurement methods are applied around the world typically with filter temperatures of 70-160°C (the temperature is set by the test method). Condensable fractions can be determined directly by recovering condensed material from chilled impinger systems downstream of a filter – note that this is condensation without dilution and can require additional processing to remove sampling artefacts. Another approach for total PM includes dilution where sampled flue or exhaust gases are mixed with ambient air (either using a dilution tunnel or dilution sampling systems) and the filterable and condensable components are collected on a filter at lower temperatures (but depending on the method this can be 15-52°C). The use of dilution methods, however, may be limited due to practical constraints with weight and/or size of the equipment.
The PM emission factors (for TSP, PM10 and PM2.5) can represent the total primary PM emission, or the filterable PM fraction. The basis of the emission factor is described (see individual emission factor tables).
Heavy metals (HM) — the emission of heavy metals strongly depends on their contents in the fuels and process feedstock.
PCDD/F — the emissions of dioxins and furans are highly dependent on the conditions under which combustion and subsequent treatment of exhaust gases is carried out. The sintering process in iron and steel manufacture has been identified as a significant source of dioxins.
HCB — in general, processes leading to PCDD/F formation also lead to emissions of HCB but emission factors for combustion are very uncertain.
1 For the purposes of this guidance, BC emission factors are assumed to equal those for elemental carbon (EC). For further information please refer to Chapter 1.A.1 Energy Industries
Draft Not To Be Quoted 11
11234
567
89
101112
131415161718192021222324252627282930
313233
3435
363738
3940
23
4
Draft Not To Be Quoted 1.A.2 Manufacturing industries and construction (combustion)
PAH — emissions of polycyclic aromatic hydrocarbons results from incomplete (intermediate) conversion of fuels. Emissions of PAH depend on the combustion process, particularly on the temperature (too low temperature favourably increases their emission), the residence time in the reaction zone and the availability of oxygen.
CO — carbon monoxide is found in gas combustion products of all carbonaceous fuels, as an intermediate product of the combustion process and in particular for under-stoichiometric conditions. CO is the most important intermediate product of fuel conversion to CO2; it is oxidized to CO2 under appropriate temperature and oxygen availability. Thus, CO can be considered as a good indicator of the combustion quality. The mechanisms of CO formation, thermal-NO, NMVOC and PAH are, in general, similarly influenced by the combustion conditions.
NMVOC — apart from combustion emission, the heating of plant feedstock and product can lead to substantial NMVOC emission.
Carbon dioxide — refer to Intergovernmental Panel on Climate Change (IPCC) guidance.
Nitrous oxide — refer to IPCC guidance.
Methane — refer to IPCC guidance.
2.10ControlsReduction of emissions from combustion process can be achieved by either avoiding formation of such substances (primary measures) or by removal of pollutants from exhaust gases (secondary measures). Primary measures include measures to avoid pollutant formation and could include use of low sulphur fuel or feedstock.
Secondary emission reduction measures are generally abatement technologies.
3 Methods
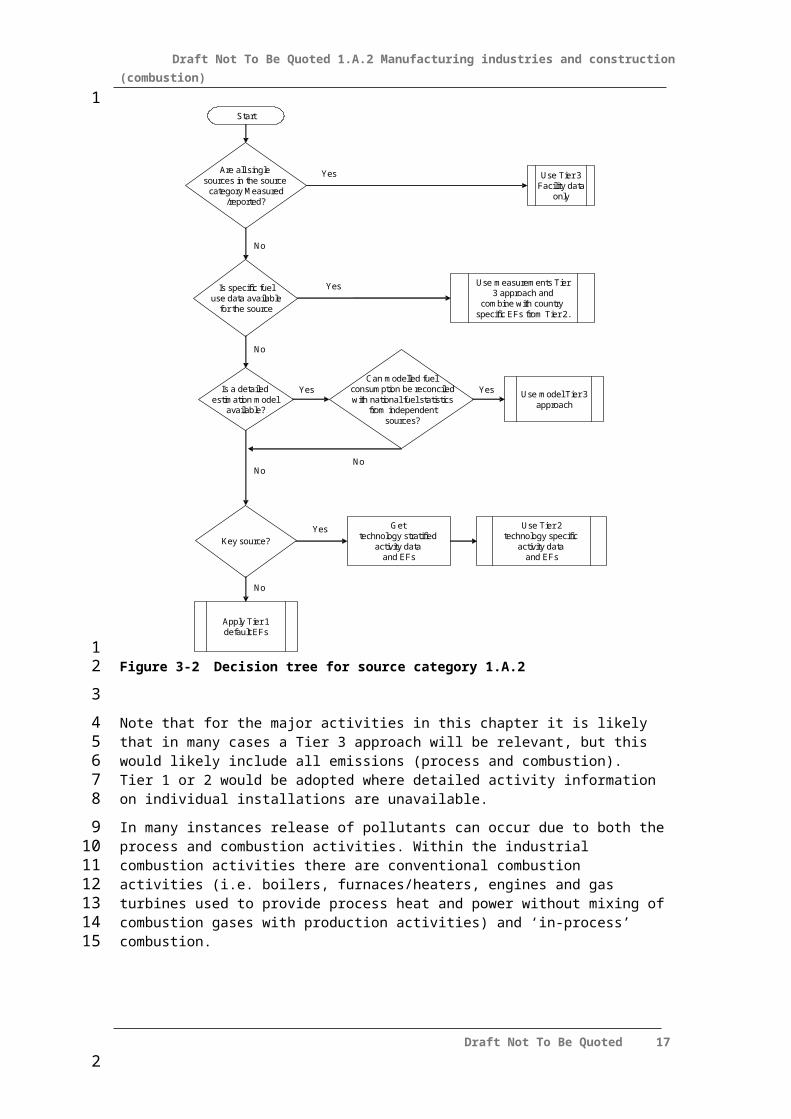
3.1 Choice of methodFigure 3-2 presents the procedure to select the methods for estimating process emissions from the relevant activities. The main ideas behind the decision tree are:
if detailed information is available, use it;
if the source category is a key source, a Tier 2 or better method must be applied and detailed input data must be collected. The decision tree directs the user in such cases to the Tier 2 method, since it is expected that it is more easy to obtain the necessary input data for this approach than to collect facility level data needed for a Tier 3 estimate.
Draft Not To Be Quoted 12
11234
56789
10
1112
13
14
15
16
17181920
21
22
23
2425
26
27282930
2
Draft Not To Be Quoted 1.A.2 Manufacturing industries and construction (combustion)
Start
Are all single sources in the source
category Measured/reported?
Use Tier 3Facility data
only
Is a detailed estimation model
available?
Use Tier 2technology specific
activity data and EFs
Key source?
Get technology stratified
activity data and EFs
Apply Tier 1default EFs
Yes
Yes
Yes
Yes
No
No
Is specific fueluse data available
for the source
Use measurements Tier3 approach and
combine with country specific EFs from Tier 2.
Can modelled fuelconsumption be reconciledwith national fuel statistics
from independentsources?
Use model Tier 3approach
No
No
No
Yes
Figure 3-2 Decision tree for source category 1.A.2
Note that for the major activities in this chapter it is likely that in many cases a Tier 3 approach will be relevant, but this would likely include all emissions (process and combustion). Tier 1 or 2 would be adopted where detailed activity information on individual installations are unavailable.
In many instances release of pollutants can occur due to both the process and combustion activities. Within the industrial combustion activities there are conventional combustion activities (i.e. boilers, furnaces/heaters, engines and gas turbines used to provide process heat and power without mixing of combustion gases with production activities) and ‘in-process’ combustion.
It is generally not possible to allocate an emission between the process and combustion processes and this is particularly the case for the ‘in-process’ combustion activities. Furthermore, inclusion of a mechanism which could allocate the emission between the process and combustion activity adds complexity to the inventory, leads to loss of transparency and perhaps double-counting.
The Guidebook adopts a pragmatic approach to apply the most appropriate emission factors consistent with the Tiers. At the lowest Tier (Tier 1), default emission factors are provided to be
Draft Not To Be Quoted 13
1
12
3
456
789
10
11121314
1516
2
Draft Not To Be Quoted 1.A.2 Manufacturing industries and construction (combustion)
used with energy-based activity data. In effect, these emission factors assign all fuel use to conventional combustion plant. This approach, used with Tier 1 process emission factors for industrial processes (section 2 of the present chapter) will result in some double-counting of industrial emissions at the lowest Tier due to some overlap of combustion and process emissions. However, if a Tier 1 approach is appropriate, then the sector is considered to be of low significance and this additional uncertainty should be acceptable.
At Tier 2, default emission factors are provided for conventional combustion activities (on an energy input basis) and for in-process combustion activities which are intended to be used with production-based activity data. In order to minimise the risk of double-counting between combustion and process emissions at Tier 2, relevant pollutant emissions for an in-process combustion activity have generally been allocated to either the combustion (source category 1.A.2) or process (section 2 of the present chapter) element of the activity. Clearly for some processes the inventory compiler would need to have activity data which allows allocation of fuel input between process and conventional combustion.
In general, NOx, SO2 and CO emissions are assigned to combustion and all other pollutants are assigned to process emissions. Note that to avoid underestimating emissions of other pollutants, the user should refer to emission factors provided for other pollutants in the relevant process activity in section 2 of the present chapter (2). An exception to this is the cement manufacture in which all emissions except particulate matter are assigned to combustion.
3.2 Tier 1 default approach
3.2.1 Algorithm
The Tier 1 approach for process emissions from industrial combustion installations uses the general equation:
(1)
where:
EPollutant = emissions of pollutant (kg),
ARfuel consumption = fuel used in the industrial combustion (TJ) for each fuel,
EFfuel,pollutant = an average emission factor (EF) for each pollutant for each unit of fuel type used (kg/TJ).
This equation is applied at the national level, using annual national fuel consumption for combustion installations in various activities.
In cases where specific abatement options are to be taken into account, a Tier 1 method is not applicable and a Tier 2 or, if practical, Tier 3 approach must be used.
2(?) It is recognised that in an individual process, a pollutant may be more correctly attributed to combustion (or process) but at Tier 2 such issues are largely unimportant. The approach adopted is intended to assure that the emission is included in the combustion or process NFR rather than being omitted or included twice.
Draft Not To Be Quoted 14
1123456
789
1011121314
1516171819
20
21
2223
24
25
26
27
2829
3031
3233
234
5
Draft Not To Be Quoted 1.A.2 Manufacturing industries and construction (combustion)
3.2.2 Default emission factors
Information on the use of energy suitable for estimating emissions using the Tier 1 simpler estimation methodology is available from national statistics agencies or the International Energy Agency (IEA).
Further guidance is provided in the 2006 IPCC Guidelines for National Greenhouse Gas Inventories, volume 2 on Stationary Combustion www.ipcc-nggip.iges.or.jp/public/2006gl/pdf/2_Volume2/V2_2_Ch2_Stationary_Combustion.pdf
The Tier 1 emission factors are energy based (g pollutant per GJ net thermal input) as are those provided in chapter 1.A.1.a and 1.A.4.a/c at Tier 1. In general, industrial combustion processes are on a smaller scale than provided in chapter 1.A.1.a and use of default factors provided for chapter 1.A.4.a/c (commercial/institutional/agricultural heating) are recommended. If knowledge exists that the industrial plants are larger, it is recommended to consider using the EFs presented in Chapter 1A1. Especially, for biomass combustion there are very few data between the very small plants and the very large plants. Special attention should therefore be given to selecting the proper EFs for biomass combustion. These Tier 1 default emission factors are provided for aggregated fuel types summarised in Table 3-3 below. The default 1.A.4.a/c Tier 1 emission factors for these fuel types are provided in Table 3-4 to Table 3-7 below.
Please note that the fuel groupings presented in Table 3-1 are not consistent with the definitions of the fuels, but are based on the emission characteristics of fuels rather than the original physical state of the fuel.
Where ‘Guidebook 2006’ is referenced in the tables, the emissions factor has been taken from chapter B216 of the 2006 Guidebook. The original reference could not be determined and the factor represents an expert judgement based on the available data.
In NFR sectors where large (> 50 MWth) combustion plant are known to be used, then the default Tier 1 emission factors provided at chapter 1.A.1.a may be more appropriate (for example combustion activities in iron and steel production).
Black carbon (BC) emission factors are assumed to equal those for elemental carbon (EC). For further information please refer to Chapter 1.A.1 Energy Industries.
Draft Not To Be Quoted 15
11
234
567
89
1011121314151617
181920
212223
242526
2728
2
Draft Not To Be Quoted 1.A.2 Manufacturing industries and construction (combustion)
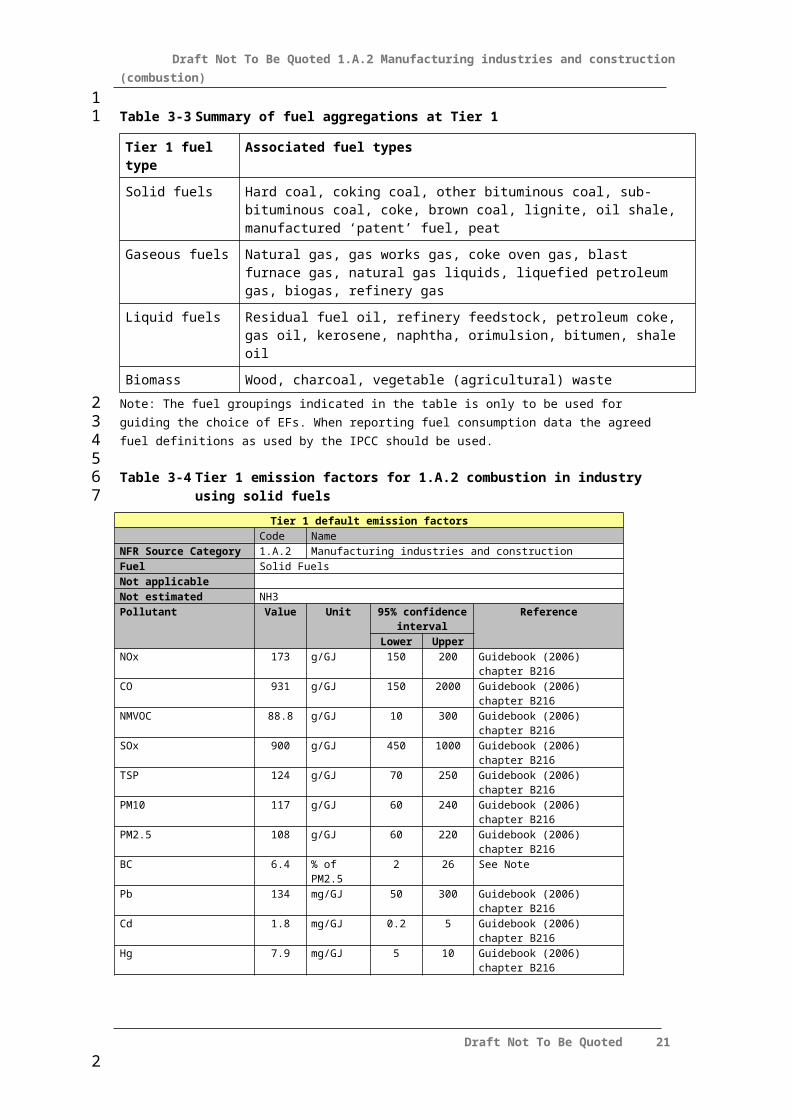
Table 3-3 Summary of fuel aggregations at Tier 1
Tier 1 fuel type Associated fuel types
Solid fuels Hard coal, coking coal, other bituminous coal, sub-bituminous coal, coke, brown coal, lignite, oil shale, manufactured ‘patent’ fuel, peat
Gaseous fuels Natural gas, gas works gas, coke oven gas, blast furnace gas, natural gas liquids, liquefied petroleum gas, biogas, refinery gas
Liquid fuels Residual fuel oil, refinery feedstock, petroleum coke, gas oil, kerosene, naphtha, orimulsion, bitumen, shale oil
Biomass Wood, charcoal, vegetable (agricultural) waste
Note: The fuel groupings indicated in the table is only to be used for guiding the choice of EFs. When reporting fuel consumption data the agreed fuel definitions as used by the IPCC should be used.
Table 3-4 Tier 1 emission factors for 1.A.2 combustion in industry using solid fuels
Tier 1 default emission factors Code NameNFR Source Category 1.A.2 Manufacturing industries and constructionFuel Solid FuelsNot applicableNot estimated NH3 Pollutant Value Unit 95% confidence
intervalReference
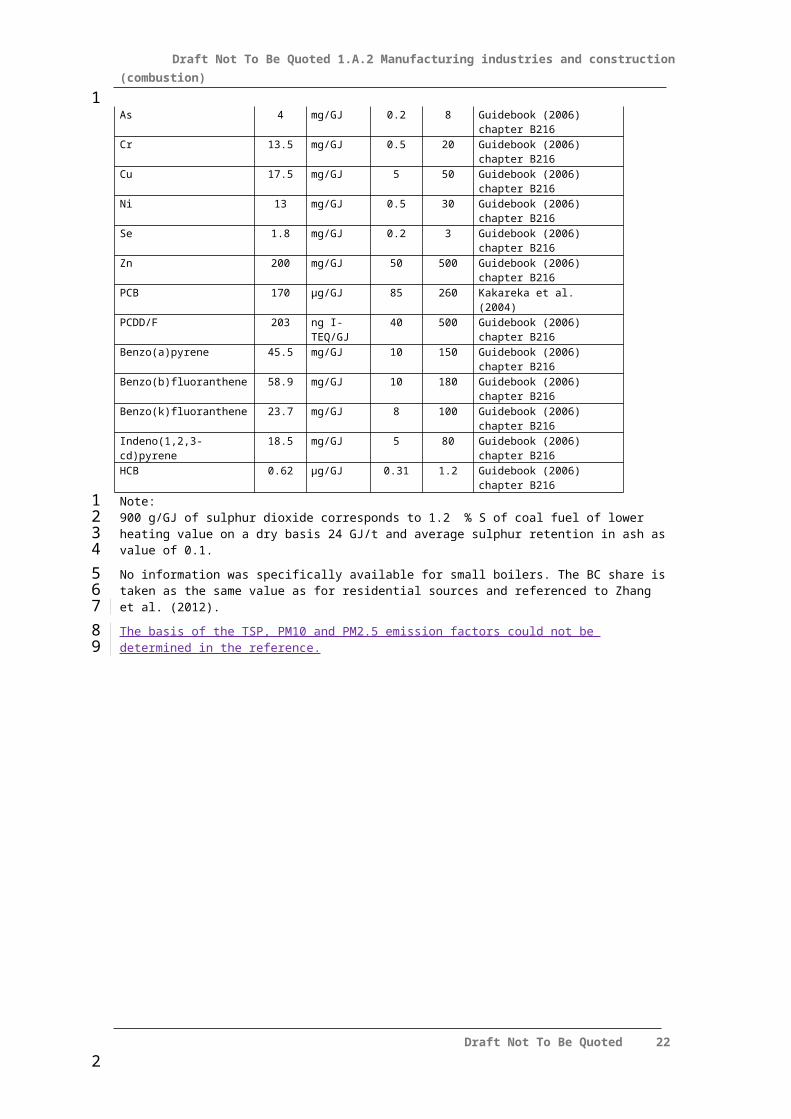
Lower UpperNOx 173 g/GJ 150 200 Guidebook (2006) chapter B216CO 931 g/GJ 150 2000 Guidebook (2006) chapter B216NMVOC 88.8 g/GJ 10 300 Guidebook (2006) chapter B216SOx 900 g/GJ 450 1000 Guidebook (2006) chapter B216TSP 124 g/GJ 70 250 Guidebook (2006) chapter B216PM10 117 g/GJ 60 240 Guidebook (2006) chapter B216PM2.5 108 g/GJ 60 220 Guidebook (2006) chapter B216BC 6.4 % of PM2.5 2 26 See NotePb 134 mg/GJ 50 300 Guidebook (2006) chapter B216Cd 1.8 mg/GJ 0.2 5 Guidebook (2006) chapter B216Hg 7.9 mg/GJ 5 10 Guidebook (2006) chapter B216As 4 mg/GJ 0.2 8 Guidebook (2006) chapter B216Cr 13.5 mg/GJ 0.5 20 Guidebook (2006) chapter B216Cu 17.5 mg/GJ 5 50 Guidebook (2006) chapter B216Ni 13 mg/GJ 0.5 30 Guidebook (2006) chapter B216Se 1.8 mg/GJ 0.2 3 Guidebook (2006) chapter B216Zn 200 mg/GJ 50 500 Guidebook (2006) chapter B216PCB 170 µg/GJ 85 260 Kakareka et al. (2004)PCDD/F 203 ng I-TEQ/GJ 40 500 Guidebook (2006) chapter B216Benzo(a)pyrene 45.5 mg/GJ 10 150 Guidebook (2006) chapter B216Benzo(b)fluoranthene 58.9 mg/GJ 10 180 Guidebook (2006) chapter B216Benzo(k)fluoranthene 23.7 mg/GJ 8 100 Guidebook (2006) chapter B216Indeno(1,2,3-cd)pyrene 18.5 mg/GJ 5 80 Guidebook (2006) chapter B216HCB 0.62 µg/GJ 0.31 1.2 Guidebook (2006) chapter B216Note: 900 g/GJ of sulphur dioxide corresponds to 1.2 % S of coal fuel of lower heating value on a dry basis 24 GJ/t and average sulphur retention in ash as value of 0.1.
No information was specifically available for small boilers. The BC share is taken as the same value as for residential sources and referenced to Zhang et al. (2012).
The basis of the TSP, PM10 and PM2.5 emission factors could not be determined in the reference.
Draft Not To Be Quoted 16
11
2345
678
910
11
2
Draft Not To Be Quoted 1.A.2 Manufacturing industries and construction (combustion)
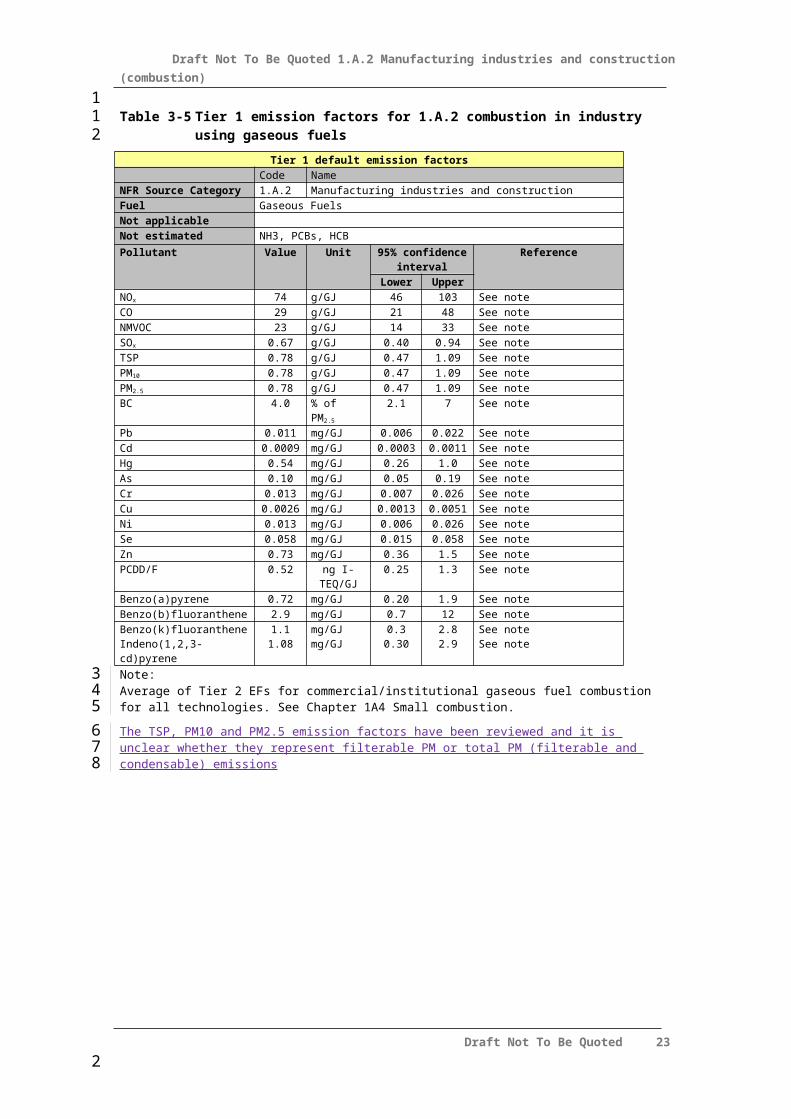
Table 3-5 Tier 1 emission factors for 1.A.2 combustion in industry using gaseous fuels
Tier 1 default emission factors Code NameNFR Source Category 1.A.2 Manufacturing industries and constructionFuel Gaseous FuelsNot applicableNot estimated NH3, PCBs, HCBPollutant Value Unit 95% confidence
intervalReference
Lower UpperNOx 74 g/GJ 46 103 See noteCO 29 g/GJ 21 48 See noteNMVOC 23 g/GJ 14 33 See noteSOx 0.67 g/GJ 0.40 0.94 See noteTSP 0.78 g/GJ 0.47 1.09 See notePM10 0.78 g/GJ 0.47 1.09 See notePM2.5 0.78 g/GJ 0.47 1.09 See noteBC 4.0 % of PM2.5 2.1 7 See notePb 0.011 mg/GJ 0.006 0.022 See noteCd 0.0009 mg/GJ 0.0003 0.0011 See noteHg 0.54 mg/GJ 0.26 1.0 See noteAs 0.10 mg/GJ 0.05 0.19 See noteCr 0.013 mg/GJ 0.007 0.026 See noteCu 0.0026 mg/GJ 0.0013 0.0051 See noteNi 0.013 mg/GJ 0.006 0.026 See noteSe 0.058 mg/GJ 0.015 0.058 See noteZn 0.73 mg/GJ 0.36 1.5 See notePCDD/F 0.52 ng I-TEQ/GJ 0.25 1.3 See noteBenzo(a)pyrene 0.72 mg/GJ 0.20 1.9 See noteBenzo(b)fluoranthene 2.9 mg/GJ 0.7 12 See noteBenzo(k)fluoranthene 1.1 mg/GJ 0.3 2.8 See noteIndeno(1,2,3-cd)pyrene 1.08 mg/GJ 0.30 2.9 See noteNote: Average of Tier 2 EFs for commercial/institutional gaseous fuel combustion for all technologies. See Chapter 1A4 Small combustion.
The TSP, PM10 and PM2.5 emission factors have been reviewed and it is unclear whether they represent filterable PM or total PM (filterable and condensable) emissions
Draft Not To Be Quoted 17
11
234
56
2
Draft Not To Be Quoted 1.A.2 Manufacturing industries and construction (combustion)
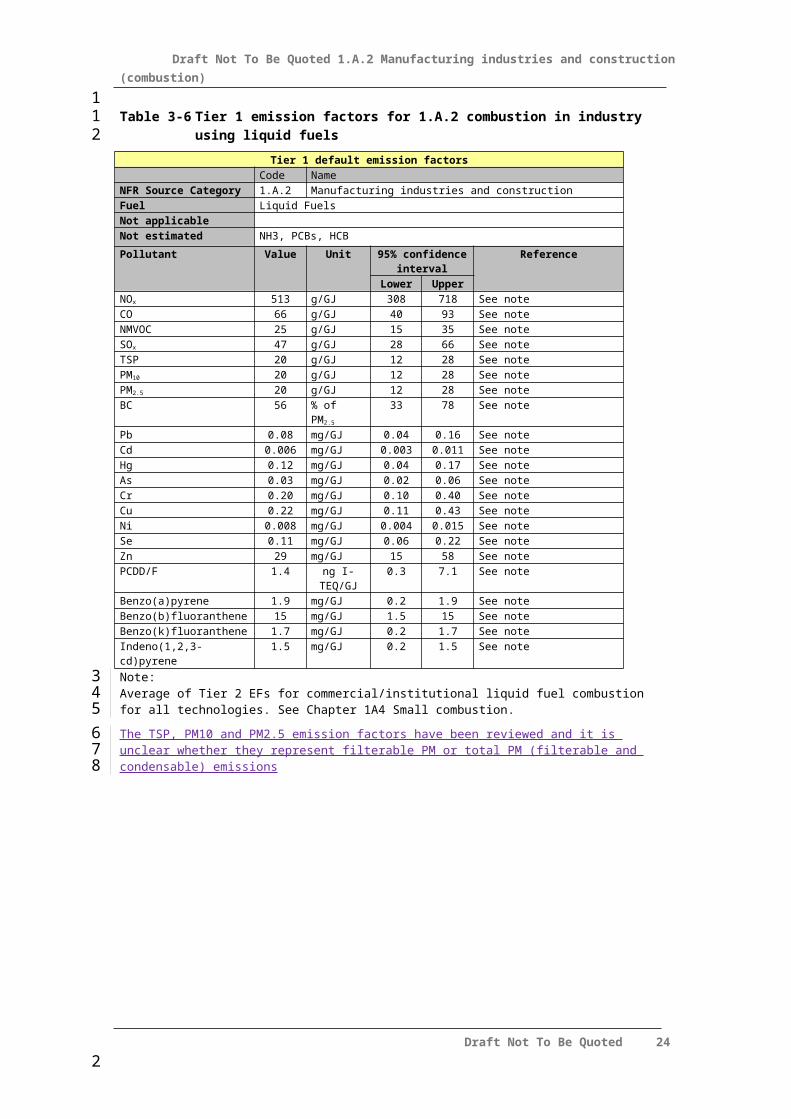
Table 3-6 Tier 1 emission factors for 1.A.2 combustion in industry using liquid fuels
Tier 1 default emission factors Code NameNFR Source Category 1.A.2 Manufacturing industries and constructionFuel Liquid FuelsNot applicableNot estimated NH3, PCBs, HCB
Pollutant Value Unit 95% confidence interval
Reference
Lower UpperNOx 513 g/GJ 308 718 See noteCO 66 g/GJ 40 93 See noteNMVOC 25 g/GJ 15 35 See noteSOx 47 g/GJ 28 66 See noteTSP 20 g/GJ 12 28 See notePM10 20 g/GJ 12 28 See notePM2.5 20 g/GJ 12 28 See noteBC 56 % of PM2.5 33 78 See notePb 0.08 mg/GJ 0.04 0.16 See noteCd 0.006 mg/GJ 0.003 0.011 See noteHg 0.12 mg/GJ 0.04 0.17 See noteAs 0.03 mg/GJ 0.02 0.06 See noteCr 0.20 mg/GJ 0.10 0.40 See noteCu 0.22 mg/GJ 0.11 0.43 See noteNi 0.008 mg/GJ 0.004 0.015 See noteSe 0.11 mg/GJ 0.06 0.22 See noteZn 29 mg/GJ 15 58 See notePCDD/F 1.4 ng I-TEQ/GJ 0.3 7.1 See noteBenzo(a)pyrene 1.9 mg/GJ 0.2 1.9 See noteBenzo(b)fluoranthene 15 mg/GJ 1.5 15 See noteBenzo(k)fluoranthene 1.7 mg/GJ 0.2 1.7 See noteIndeno(1,2,3-cd)pyrene 1.5 mg/GJ 0.2 1.5 See noteNote: Average of Tier 2 EFs for commercial/institutional liquid fuel combustion for all technologies. See Chapter 1A4 Small combustion.
The TSP, PM10 and PM2.5 emission factors have been reviewed and it is unclear whether they represent filterable PM or total PM (filterable and condensable) emissions
Draft Not To Be Quoted 18
11
234
56
2
Draft Not To Be Quoted 1.A.2 Manufacturing industries and construction (combustion)
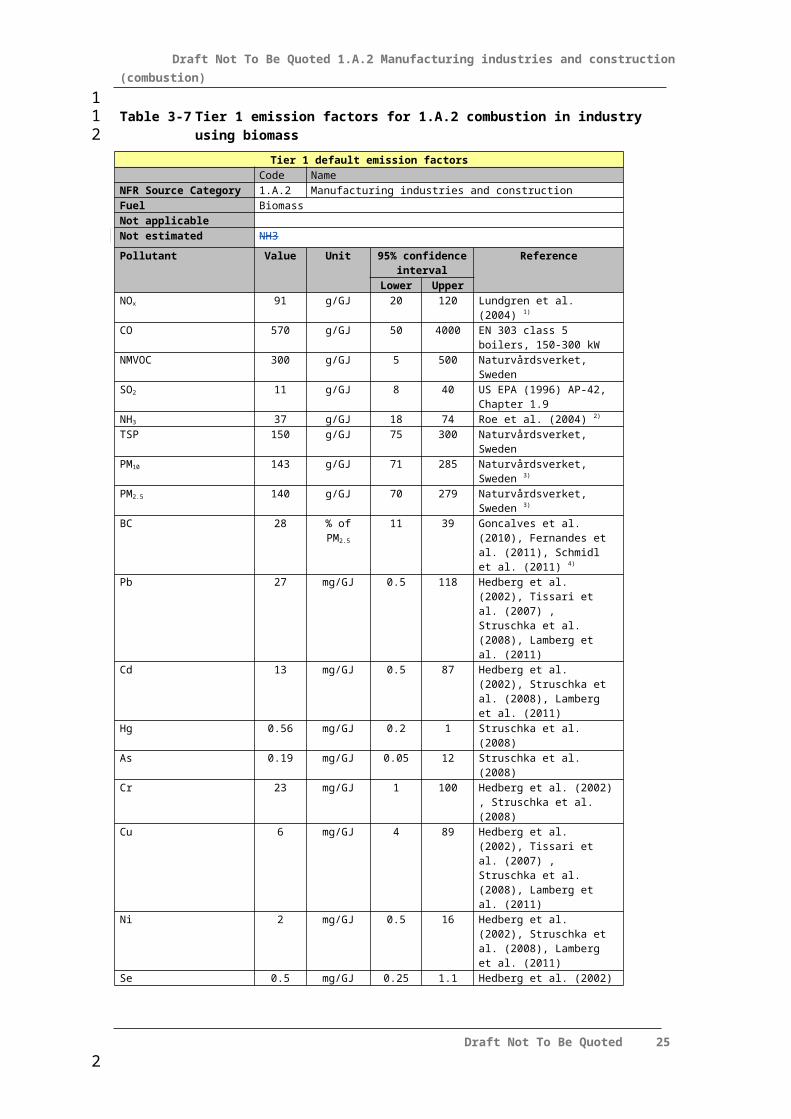
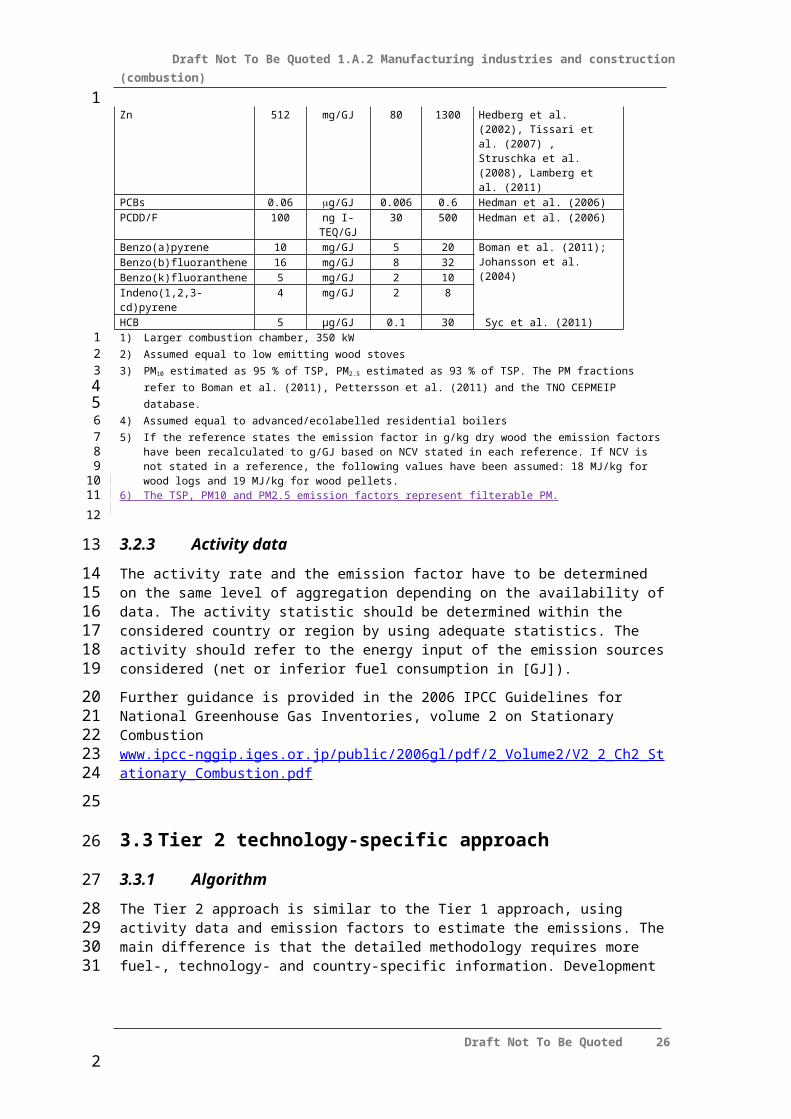
Table 3-7 Tier 1 emission factors for 1.A.2 combustion in industry using biomass
Tier 1 default emission factors Code NameNFR Source Category 1.A.2 Manufacturing industries and constructionFuel BiomassNot applicableNot estimated NH3
Pollutant Value Unit 95% confidence interval
Reference
Lower UpperNOx 91 g/GJ 20 120 Lundgren et al. (2004) 1)
CO 570 g/GJ 50 4000 EN 303 class 5 boilers, 150-300 kW
NMVOC 300 g/GJ 5 500 Naturvårdsverket, SwedenSO2 11 g/GJ 8 40 US EPA (1996) AP-42, Chapter
1.9 NH3 37 g/GJ 18 74 Roe et al. (2004) 2) TSP 150 g/GJ 75 300 Naturvårdsverket, SwedenPM10 143 g/GJ 71 285 Naturvårdsverket, Sweden 3)
PM2.5 140 g/GJ 70 279 Naturvårdsverket, Sweden 3)
BC 28 % of PM2.5 11 39 Goncalves et al. (2010), Fernandes et al. (2011), Schmidl et al. (2011) 4)
Pb 27 mg/GJ 0.5 118 Hedberg et al. (2002), Tissari et al. (2007) , Struschka et al. (2008), Lamberg et al. (2011)
Cd 13 mg/GJ 0.5 87 Hedberg et al. (2002), Struschka et al. (2008), Lamberg et al. (2011)
Hg 0.56 mg/GJ 0.2 1 Struschka et al. (2008)As 0.19 mg/GJ 0.05 12 Struschka et al. (2008)Cr 23 mg/GJ 1 100 Hedberg et al. (2002) ,
Struschka et al. (2008)Cu 6 mg/GJ 4 89 Hedberg et al. (2002), Tissari et
al. (2007) , Struschka et al. (2008), Lamberg et al. (2011)
Ni 2 mg/GJ 0.5 16 Hedberg et al. (2002), Struschka et al. (2008), Lamberg et al. (2011)
Se 0.5 mg/GJ 0.25 1.1 Hedberg et al. (2002)Zn 512 mg/GJ 80 1300 Hedberg et al. (2002), Tissari et
al. (2007) , Struschka et al. (2008), Lamberg et al. (2011)
PCBs 0.06 g/GJ 0.006 0.6 Hedman et al. (2006) PCDD/F 100 ng I-TEQ/GJ 30 500 Hedman et al. (2006) Benzo(a)pyrene 10 mg/GJ 5 20 Boman et al. (2011); Johansson
et al. (2004)
Benzo(b)fluoranthene 16 mg/GJ 8 32Benzo(k)fluoranthene 5 mg/GJ 2 10Indeno(1,2,3-cd)pyrene 4 mg/GJ 2 8HCB 5 µg/GJ 0.1 30 Syc et al. (2011)1) Larger combustion chamber, 350 kW2) Assumed equal to low emitting wood stoves3) PM10 estimated as 95 % of TSP, PM2.5 estimated as 93 % of TSP. The PM fractions refer to Boman et al. (2011), Pettersson
et al. (2011) and the TNO CEPMEIP database.4) Assumed equal to advanced/ecolabelled residential boilers5) If the reference states the emission factor in g/kg dry wood the emission factors have been recalculated to g/GJ based on
NCV stated in each reference. If NCV is not stated in a reference, the following values have been assumed: 18 MJ/kg for wood logs and 19 MJ/kg for wood pellets.
6) The TSP, PM10 and PM2.5 emission factors represent filterable PM.
Draft Not To Be Quoted 19
11
23456789
1011
2
Draft Not To Be Quoted 1.A.2 Manufacturing industries and construction (combustion)
3.2.3 Activity data
The activity rate and the emission factor have to be determined on the same level of aggregation depending on the availability of data. The activity statistic should be determined within the considered country or region by using adequate statistics. The activity should refer to the energy input of the emission sources considered (net or inferior fuel consumption in [GJ]).
Further guidance is provided in the 2006 IPCC Guidelines for National Greenhouse Gas Inventories, volume 2 on Stationary Combustion www.ipcc-nggip.iges.or.jp/public/2006gl/pdf/2_Volume2/V2_2_Ch2_Stationary_Combustion.pdf
3.3 Tier 2 technology-specific approach
3.3.1 Algorithm
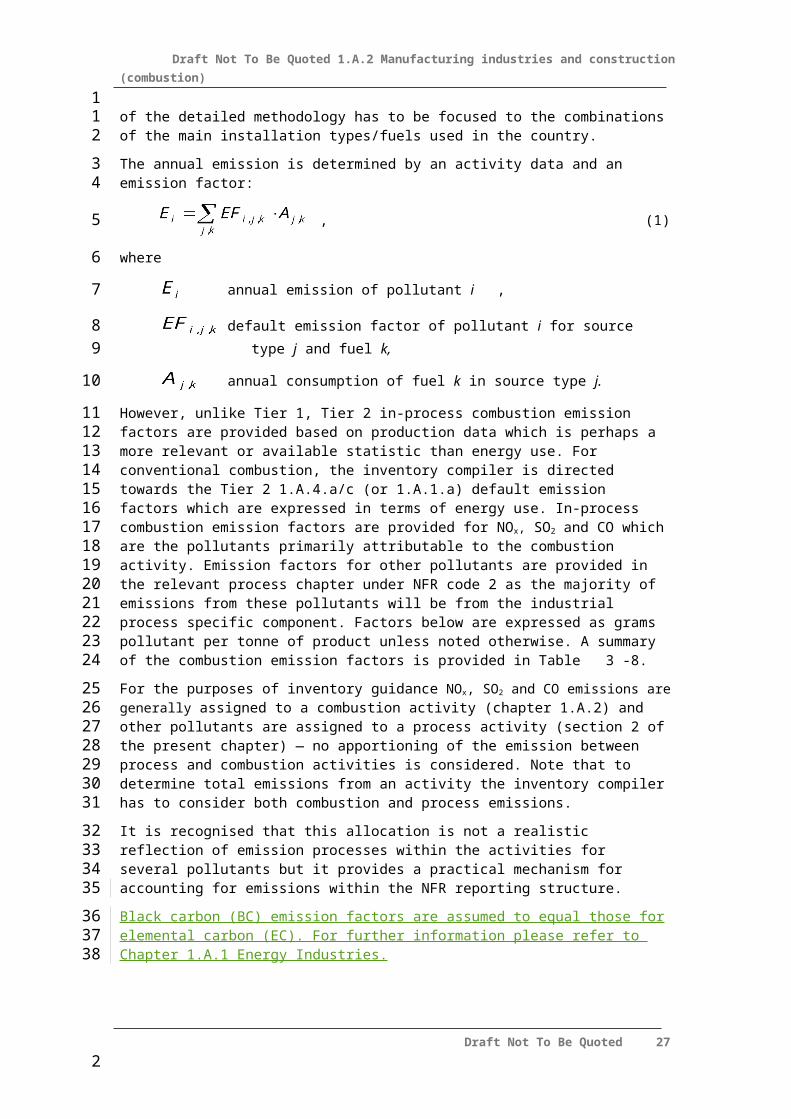
The Tier 2 approach is similar to the Tier 1 approach, using activity data and emission factors to estimate the emissions. The main difference is that the detailed methodology requires more fuel-, technology- and country-specific information. Development of the detailed methodology has to be focused to the combinations of the main installation types/fuels used in the country.
The annual emission is determined by an activity data and an emission factor:
, (1)
where
annual emission of pollutant i ,
default emission factor of pollutant i for source type j and fuel k,
annual consumption of fuel k in source type j.
However, unlike Tier 1, Tier 2 in-process combustion emission factors are provided based on production data which is perhaps a more relevant or available statistic than energy use. For conventional combustion, the inventory compiler is directed towards the Tier 2 1.A.4.a/c (or 1.A.1.a) default emission factors which are expressed in terms of energy use. In-process combustion emission factors are provided for NOx, SO2 and CO which are the pollutants primarily attributable to the combustion activity. Emission factors for other pollutants are provided in the relevant process chapter under NFR code 2 as the majority of emissions from these pollutants will be from the industrial process specific component. Factors below are expressed as grams pollutant per tonne of product unless noted otherwise. A summary of the combustion emission factors is provided in Table 3-8.
For the purposes of inventory guidance NOx, SO2 and CO emissions are generally assigned to a combustion activity (chapter 1.A.2) and other pollutants are assigned to a process activity (section 2 of the present chapter) — no apportioning of the emission between process and combustion activities is considered. Note that to determine total emissions from an activity the inventory compiler has to consider both combustion and process emissions.
Draft Not To Be Quoted 20
11
2345
678
9
10
11
12131415
16
17
18
19
20
21
22232425262728293031
3233343536
2
Draft Not To Be Quoted 1.A.2 Manufacturing industries and construction (combustion)
It is recognised that this allocation is not a realistic reflection of emission processes within the activities for several pollutants but it provides a practical mechanism for accounting for emissions within the NFR reporting structure.
Black carbon (BC) emission factors are assumed to equal those for elemental carbon (EC). For further information please refer to Chapter 1.A.1 Energy Industries.
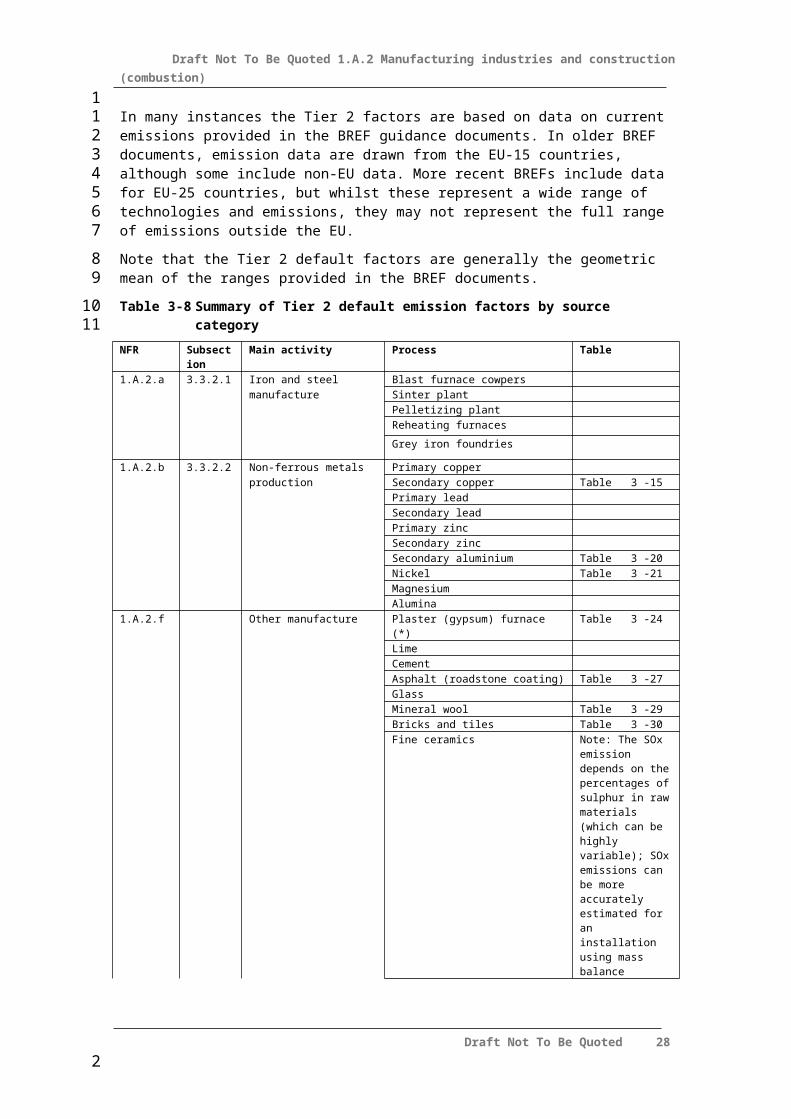
In many instances the Tier 2 factors are based on data on current emissions provided in the BREF guidance documents. In older BREF documents, emission data are drawn from the EU-15 countries, although some include non-EU data. More recent BREFs include data for EU-25 countries, but whilst these represent a wide range of technologies and emissions, they may not represent the full range of emissions outside the EU.
Note that the Tier 2 default factors are generally the geometric mean of the ranges provided in the BREF documents.
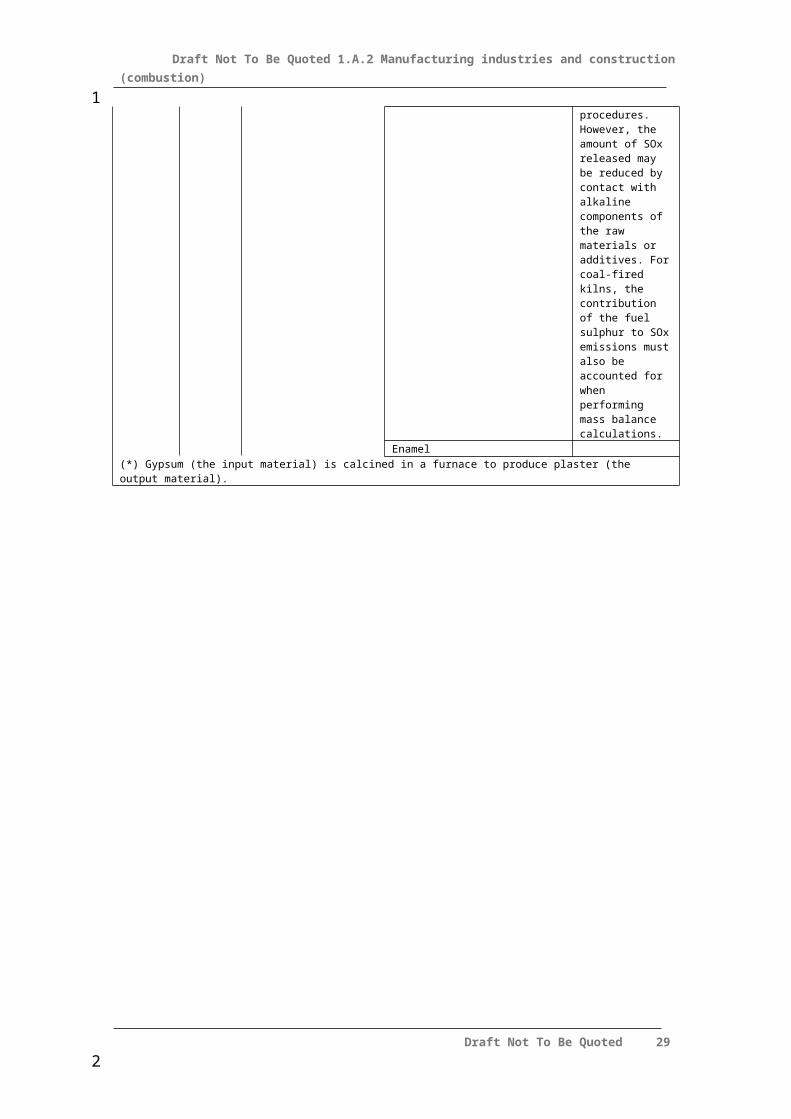
Table 3-8 Summary of Tier 2 default emission factors by source category
NFR Subsection Main activity Process Table1.A.2.a 3.3.2.1 Iron and steel Blast furnace cowpers
manufacture Sinter plantPelletizing plantReheating furnaces
Grey iron foundries
1.A.2.b 3.3.2.2 Non-ferrous metals Primary copperproduction Secondary copper Table 3-15
Primary leadSecondary leadPrimary zincSecondary zincSecondary aluminium Table 3-20Nickel Table 3-21MagnesiumAlumina
1.A.2.f Other manufacture Plaster (gypsum) furnace (*) Table 3-24Lime Cement Asphalt (roadstone coating) Table 3-27GlassMineral wool Table 3-29Bricks and tiles Table 3-30Fine ceramics Note: The SOx
emission depends onthe percentages of sulphur in raw materials (which can be highly variable); SOx emissions can bemore accurately estimated for an installation using mass balance procedures. However, the amount of SOx released may be reduced by contact with alkaline components of the raw materials or
Draft Not To Be Quoted 21
1123
45
6789
10
1112
13
2
Draft Not To Be Quoted 1.A.2 Manufacturing industries and construction (combustion)
Enamel(*) Gypsum (the input material) is calcined in a furnace to produce plaster (the output material).
Draft Not To Be Quoted 22
1
2
Draft Not To Be Quoted 1.A.2 Manufacturing industries and construction (combustion)
3.3.2 Technology-specific emission factors
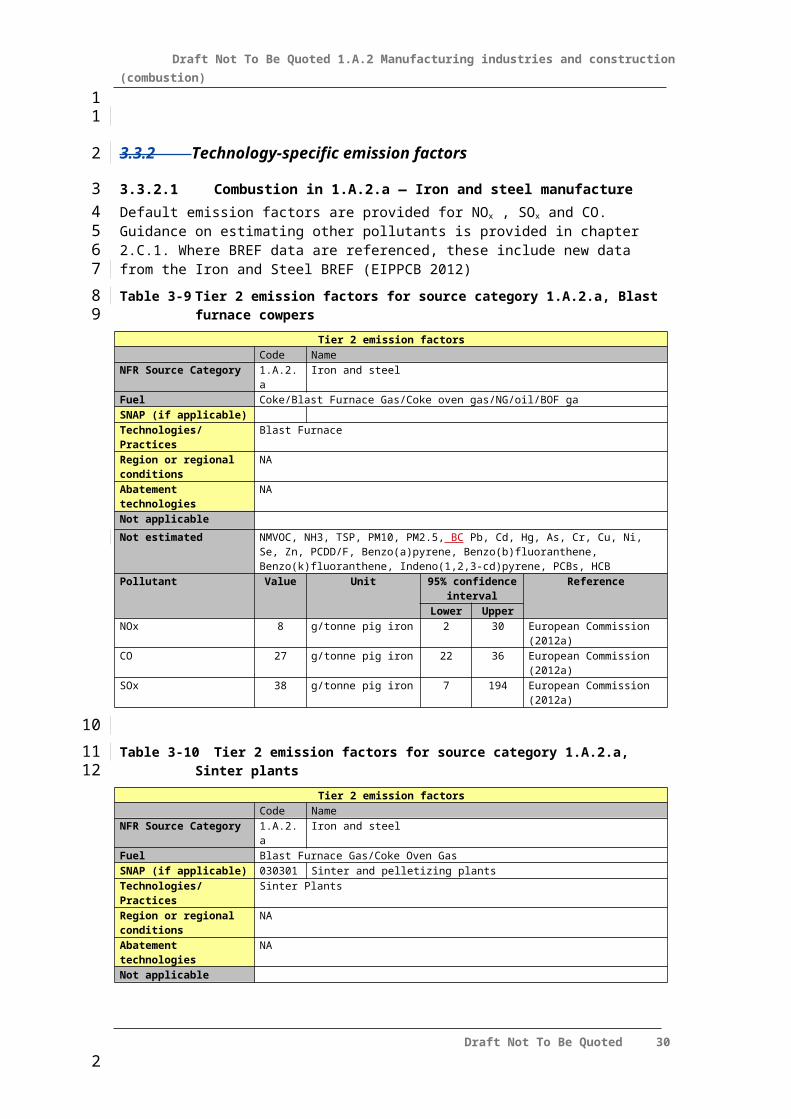
3.3.2.1 Combustion in 1.A.2.a — Iron and steel manufactureDefault emission factors are provided for NOx , SOx and CO. Guidance on estimating other pollutants is provided in chapter 2.C.1. Where BREF data are referenced, these include new data from the Iron and Steel BREF (EIPPCB 2012)
Table 3-9 Tier 2 emission factors for source category 1.A.2.a, Blast furnace cowpers
Tier 2 emission factors Code NameNFR Source Category 1.A.2.a Iron and steelFuel Coke/Blast Furnace Gas/Coke oven gas/NG/oil/BOF gaSNAP (if applicable) Technologies/Practices Blast FurnaceRegion or regional conditions NAAbatement technologies NANot applicable
Not estimated NMVOC, NH3, TSP, PM10, PM2.5, BC Pb, Cd, Hg, As, Cr, Cu, Ni, Se, Zn, PCDD/F, Benzo(a)pyrene, Benzo(b)fluoranthene, Benzo(k)fluoranthene, Indeno(1,2,3-cd)pyrene, PCBs, HCB
Pollutant Value Unit 95% confidence interval
Reference
Lower UpperNOx 8 g/tonne pig iron 2 30 European Commission (2012a)CO 27 g/tonne pig iron 22 36 European Commission (2012a)SOx 38 g/tonne pig iron 7 194 European Commission (2012a)
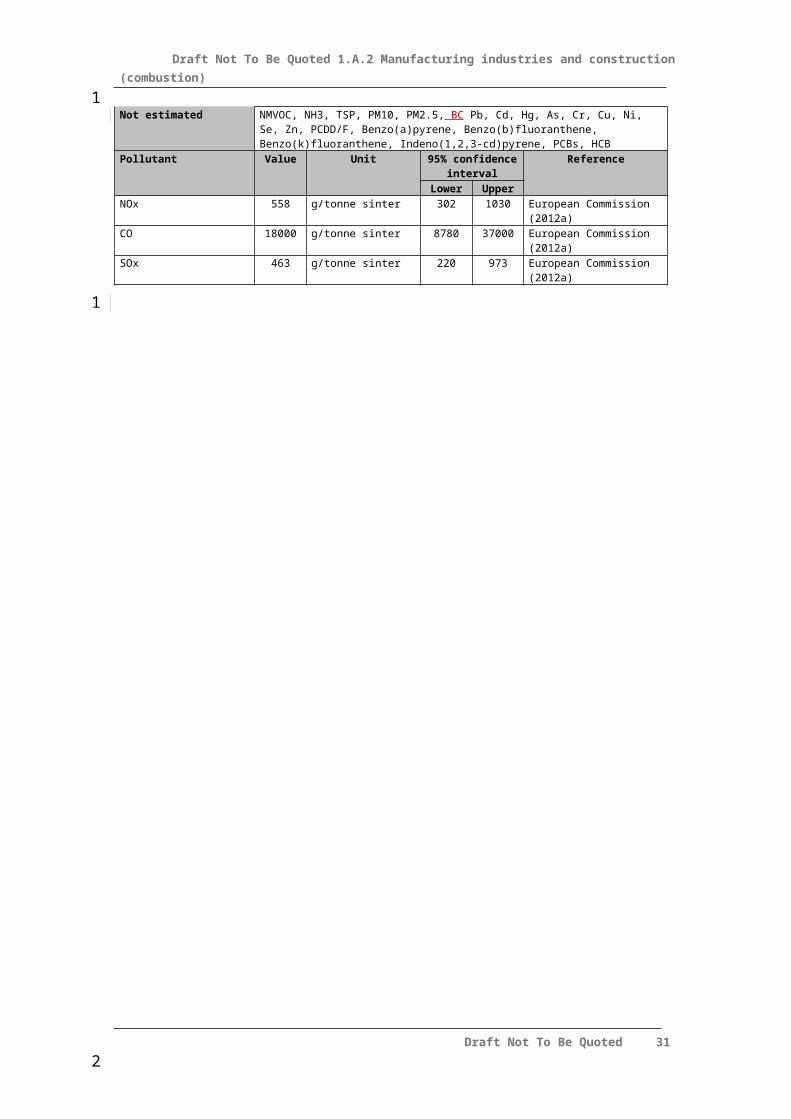
Table 3-10 Tier 2 emission factors for source category 1.A.2.a, Sinter plants
Tier 2 emission factors Code NameNFR Source Category 1.A.2.a Iron and steelFuel Blast Furnace Gas/Coke Oven GasSNAP (if applicable) 030301 Sinter and pelletizing plantsTechnologies/Practices Sinter PlantsRegion or regional conditions NAAbatement technologies NANot applicableNot estimated NMVOC, NH3, TSP, PM10, PM2.5, BC Pb, Cd, Hg, As, Cr, Cu, Ni, Se, Zn, PCDD/F,
Benzo(a)pyrene, Benzo(b)fluoranthene, Benzo(k)fluoranthene, Indeno(1,2,3-cd)pyrene, PCBs, HCB
Pollutant Value Unit 95% confidence interval
Reference
Lower UpperNOx 558 g/tonne sinter 302 1030 European Commission (2012a)
CO 18000 g/tonne sinter 8780 37000 European Commission (2012a)SOx 463 g/tonne sinter 220 973 European Commission (2012a)
Draft Not To Be Quoted 23
11
2
3456
7
8
9
10
2
Draft Not To Be Quoted 1.A.2 Manufacturing industries and construction (combustion)
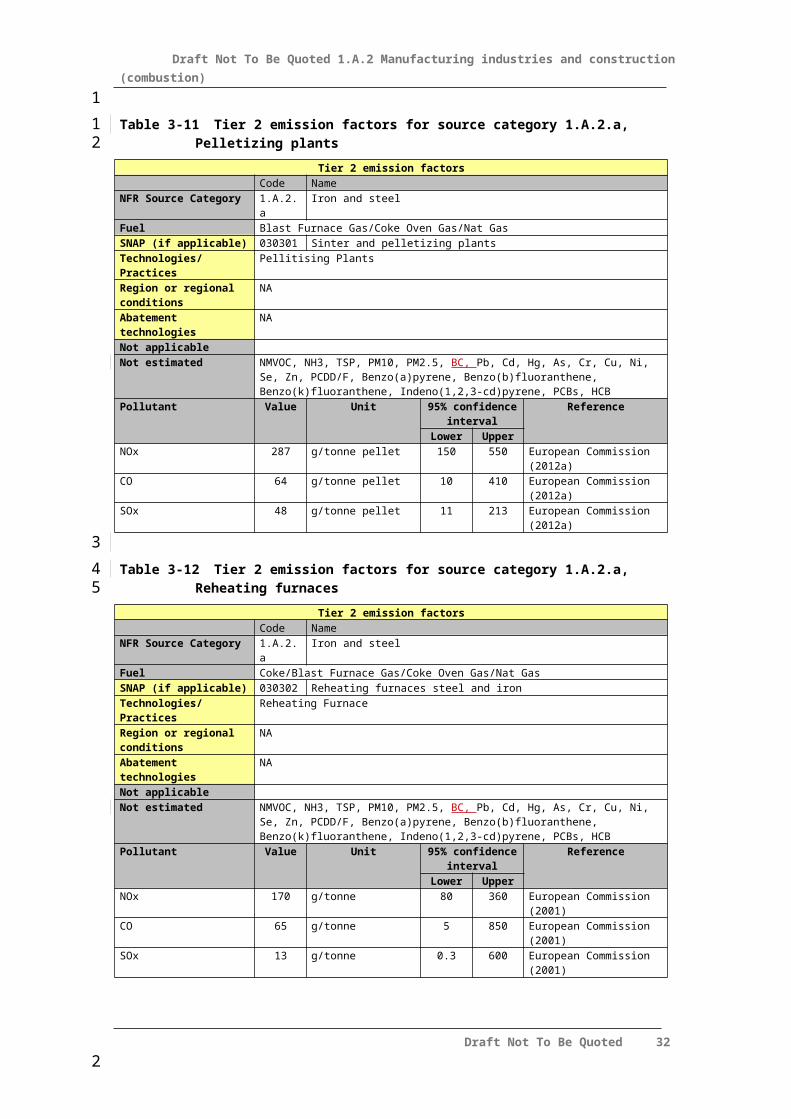
Table 3-11 Tier 2 emission factors for source category 1.A.2.a, Pelletizing plants
Tier 2 emission factors Code NameNFR Source Category 1.A.2.a Iron and steelFuel Blast Furnace Gas/Coke Oven Gas/Nat GasSNAP (if applicable) 030301 Sinter and pelletizing plantsTechnologies/Practices Pellitising PlantsRegion or regional conditions NAAbatement technologies NANot applicableNot estimated NMVOC, NH3, TSP, PM10, PM2.5, BC, Pb, Cd, Hg, As, Cr, Cu, Ni, Se, Zn, PCDD/F,
Benzo(a)pyrene, Benzo(b)fluoranthene, Benzo(k)fluoranthene, Indeno(1,2,3-cd)pyrene, PCBs, HCB
Pollutant Value Unit 95% confidence interval
Reference
Lower UpperNOx 287 g/tonne pellet 150 550 European Commission (2012a)
CO 64 g/tonne pellet 10 410 European Commission (2012a)SOx 48 g/tonne pellet 11 213 European Commission (2012a)
Table 3-12 Tier 2 emission factors for source category 1.A.2.a, Reheating furnaces
Tier 2 emission factors Code NameNFR Source Category 1.A.2.a Iron and steelFuel Coke/Blast Furnace Gas/Coke Oven Gas/Nat GasSNAP (if applicable) 030302 Reheating furnaces steel and ironTechnologies/Practices Reheating FurnaceRegion or regional conditions NAAbatement technologies NANot applicableNot estimated NMVOC, NH3, TSP, PM10, PM2.5, BC, Pb, Cd, Hg, As, Cr, Cu, Ni, Se, Zn, PCDD/F,
Benzo(a)pyrene, Benzo(b)fluoranthene, Benzo(k)fluoranthene, Indeno(1,2,3-cd)pyrene, PCBs, HCB
Pollutant Value Unit 95% confidence interval
Reference
Lower UpperNOx 170 g/tonne 80 360 European Commission (2001)CO 65 g/tonne 5 850 European Commission (2001)SOx 13 g/tonne 0.3 600 European Commission (2001)
Draft Not To Be Quoted 24
1
1
2
3
4
2
Draft Not To Be Quoted 1.A.2 Manufacturing industries and construction (combustion)
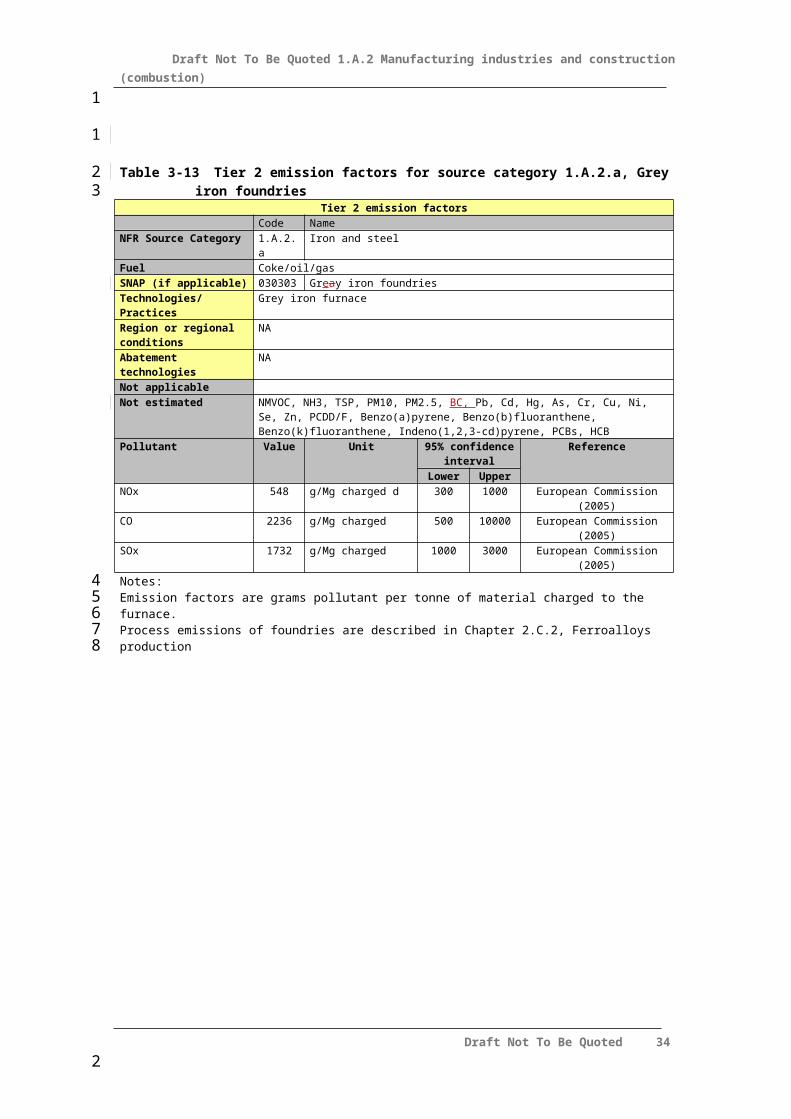
Table 3-13 Tier 2 emission factors for source category 1.A.2.a, Grey iron foundriesTier 2 emission factors
Code NameNFR Source Category 1.A.2.a Iron and steelFuel Coke/oil/gasSNAP (if applicable) 030303 Greay iron foundriesTechnologies/Practices Grey iron furnaceRegion or regional conditions
NA
Abatement technologies NANot applicableNot estimated NMVOC, NH3, TSP, PM10, PM2.5, BC, Pb, Cd, Hg, As, Cr, Cu, Ni, Se, Zn, PCDD/F,
Benzo(a)pyrene, Benzo(b)fluoranthene, Benzo(k)fluoranthene, Indeno(1,2,3-cd)pyrene, PCBs, HCB
Pollutant Value Unit 95% confidence interval
Reference
Lower UpperNOx 548 g/Mg charged d 300 1000 European Commission (2005)CO 2236 g/Mg charged 500 10000 European Commission (2005)SOx 1732 g/Mg charged 1000 3000 European Commission (2005)Notes:Emission factors are grams pollutant per tonne of material charged to the furnace.Process emissions of foundries are described in Chapter 2.C.2, Ferroalloys production
Draft Not To Be Quoted 25
1
1
2
345
2
Draft Not To Be Quoted 1.A.2 Manufacturing industries and construction (combustion)
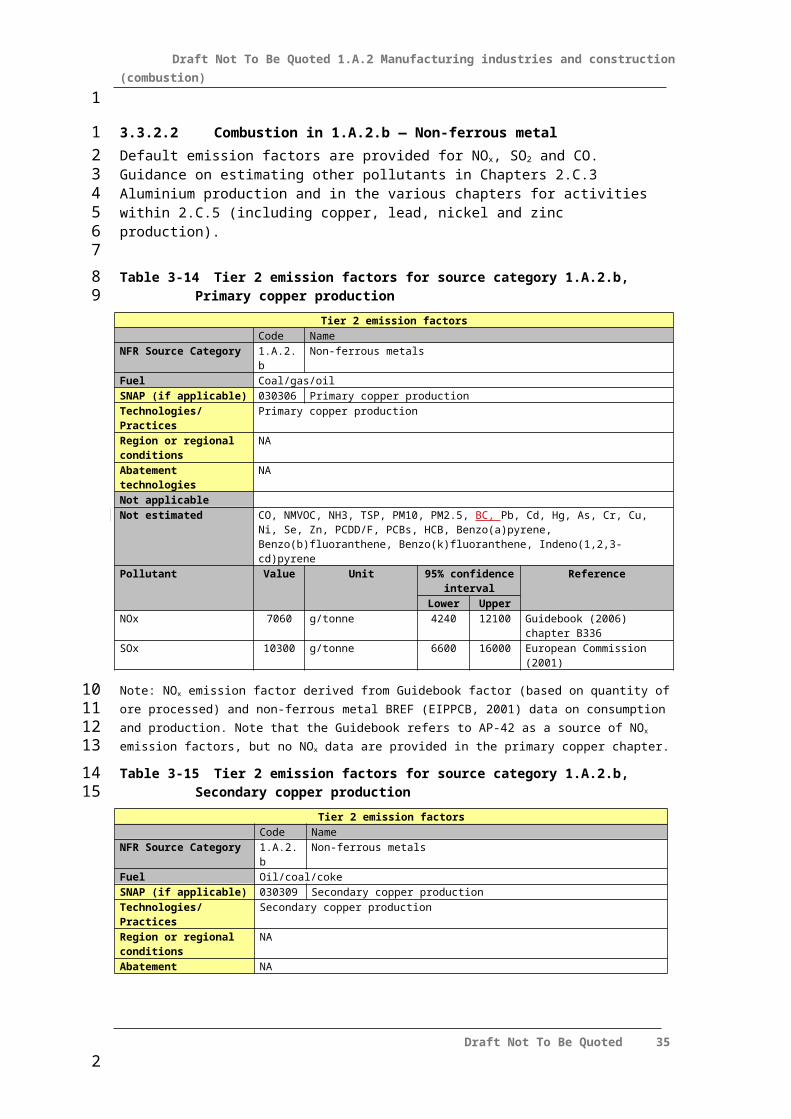
3.3.2.2 Combustion in 1.A.2.b — Non-ferrous metalDefault emission factors are provided for NOx, SO2 and CO. Guidance on estimating other pollutants in Chapters 2.C.3 Aluminium production and in the various chapters for activities within 2.C.5 (including copper, lead, nickel and zinc production).
Table 3-14 Tier 2 emission factors for source category 1.A.2.b, Primary copper production
Tier 2 emission factors Code NameNFR Source Category 1.A.2.b Non-ferrous metalsFuel Coal/gas/oilSNAP (if applicable) 030306 Primary copper productionTechnologies/Practices Primary copper productionRegion or regional conditions
NA
Abatement technologies NANot applicableNot estimated CO, NMVOC, NH3, TSP, PM10, PM2.5, BC, Pb, Cd, Hg, As, Cr, Cu, Ni, Se, Zn, PCDD/F, PCBs, HCB,
Benzo(a)pyrene, Benzo(b)fluoranthene, Benzo(k)fluoranthene, Indeno(1,2,3-cd)pyrene
Pollutant Value Unit 95% confidence interval
Reference
Lower UpperNOx 7060 g/tonne 4240 12100 Guidebook (2006) chapter B336SOx 10300 g/tonne 6600 16000 European Commission (2001)
Note: NOx emission factor derived from Guidebook factor (based on quantity of ore processed) and non-ferrous metal BREF (EIPPCB, 2001) data on consumption and production. Note that the Guidebook refers to AP-42 as a source of NOx emission factors, but no NOx data are provided in the primary copper chapter.
Table 3-15 Tier 2 emission factors for source category 1.A.2.b, Secondary copper production
Tier 2 emission factors Code NameNFR Source Category 1.A.2.b Non-ferrous metalsFuel Oil/coal/cokeSNAP (if applicable) 030309 Secondary copper productionTechnologies/Practices Secondary copper productionRegion or regional conditions NAAbatement technologies NANot applicableNot estimated NMVOC, NH3, TSP, PM10, PM2.5, BC, Pb, Cd, Hg, As, Cr, Cu, Ni, Se, Zn, PCDD/F,
Benzo(a)pyrene, Benzo(b)fluoranthene, Benzo(k)fluoranthene, Indeno(1,2,3-cd)pyrene, PCBs, HCB
Pollutant Value Unit 95% confidence interval
Reference
Lower UpperNOx 400 g/tonne 73.9 1570 US EPA (1990)CO 4690 g/tonne 2000 11000 European Commission (2001)SOx 1230 g/tonne 500 3000 European Commission (2001)
Draft Not To Be Quoted 26
1
12345
6
789
10
11
2
Draft Not To Be Quoted 1.A.2 Manufacturing industries and construction (combustion)
Table 3-16 Tier 2 emission factors for source category 1.A.2.b, Primary lead production
Tier 2 emission factors Code NameNFR Source Category 1.A.2.b Non-ferrous metalsFuel Coke/gas/oilSNAP (if applicable) 030304 Primary lead productionTechnologies/Practices Primary lead productionRegion or regional conditions NAAbatement technologies NANot applicableNot estimated NOx, CO, NMVOC, NH3, TSP, PM10, PM2.5, BC, Pb, Cd, Hg, As, Cr, Cu, Ni, Se, Zn, PCDD/F,
PCBs, HCB, Benzo(a)pyrene, Benzo(b)fluoranthene, Benzo(k)fluoranthene, Indeno(1,2,3-cd)pyrene,
Pollutant Value Unit 95% confidence interval
Reference
Lower UpperSOx 6190 g/tonne 1000 45000 European Commission (2001)
Table 3-17 Tier 2 emission factors for source category 1.A.2.b, Secondary lead production
Tier 2 emission factors Code NameNFR Source Category 1.A.2.b Non-ferrous metalsFuel Oil/gasSNAP (if applicable) 030307 Secondary lead productionTechnologies/Practices Secondary lead productionRegion or regional conditions NAAbatement technologies NANot applicableNot estimated CO, NMVOC, NH3, TSP, PM10, PM2.5, BC, Pb, Cd, Hg, As, Cr, Cu, Ni, Se, Zn, PCDD/F, PCBs,
HCB, Benzo(a)pyrene, Benzo(b)fluoranthene, Benzo(k)fluoranthene, Indeno(1,2,3-cd)pyrene,
Pollutant Value Unit 95% confidence interval
Reference
Lower UpperNOx 186 g/tonne 108 323 US EPA (1990)SOx 2200 g/tonne 210 7800 European Commission (2001)
Table 3-18 Tier 2 emission factors for source category 1.A.2.b, Primary zinc production
Tier 2 emission factors Code NameNFR Source Category 1.A.2.b Non-ferrous metalsFuel Coke/gas/oilSNAP (if applicable) 030305 Primary zinc productionTechnologies/Practices Primary zinc productionRegion or regional conditions NAAbatement technologies NANot applicableNot estimated NOx, CO, NMVOC, NH3, TSP, PM10, PM2.5, BC, Pb, Cd, Hg, As, Cr, Cu, Ni, Se, Zn, PCDD/F,
PCBs, HCB, Benzo(a)pyrene, Benzo(b)fluoranthene, Benzo(k)fluoranthene, Indeno(1,2,3-cd)pyrene,
Pollutant Value Unit 95% confidence interval
Reference
Lower UpperSOx 5290 g/tonne 2500 9000 European Commission (2001)
Draft Not To Be Quoted 27
11
2
3
4
5
6
2
Draft Not To Be Quoted 1.A.2 Manufacturing industries and construction (combustion)
Table 3-19 Tier 2 emission factors for source category 1.A.2.b, Secondary zinc production
Tier 2 emission factors Code NameNFR Source Category 1.A.2.b Non-ferrous metalsFuel Coke/gas/oilSNAP (if applicable) 030308 Secondary zinc productionTechnologies/Practices Secondary zinc productionRegion or regional conditions NAAbatement technologies NANot applicableNot estimated CO, NMVOC, NH3, TSP, PM10, PM2.5, BC, Pb, Cd, Hg, As, Cr, Cu, Ni, Se, Zn, PCDD/F, PCBs,
HCB, Benzo(a)pyrene, Benzo(b)fluoranthene, Benzo(k)fluoranthene, Indeno(1,2,3-cd)pyrene,
Pollutant Value Unit 95% confidence interval
Reference
Lower UpperNOx 1500 g/tonne 100 3950 European Commission (2001)
SOx 12200 g/tonne 9150 20000 European Commission (2001)
Table 3-20 Tier 2 emission factors for source category 1.A.2.b, Secondary aluminium production
Tier 2 emission factors Code NameNFR Source Category 1.A.2.b Non-ferrous metalsFuel Oil/gasSNAP (if applicable) 030310 Secondary aluminium productionTechnologies/Practices Secondary AluminiumRegion or regional conditions
NA
Abatement technologies NANot applicable
Not estimated CO, NMVOC, NH3, TSP, PM10, PM2.5, BC, Pb, Cd, Hg, As, Cr, Cu, Ni, Se, Zn, PCDD/F, PCBs, HCB, Benzo(a)pyrene, Benzo(b)fluoranthene, Benzo(k)fluoranthene, Indeno(1,2,3-cd)pyrene
Pollutant Value Unit 95% confidence interval
Reference
Lower UpperNOx 413 g/Mg 280 610 European Commission (2009)SOx 285 g/Mg 220 370 European Commission (2009)
Table 3-21 Tier 2 emission factors for source category 1.A.2.b, Nickel production
Tier 2 emission factors Code NameNFR Source Category 1.A.2.b Non-ferrous metalsFuel GasSNAP (if applicable) 030324 Nickel production (thermal process)Technologies/Practices Nickel ProductionRegion or regional conditions NAAbatement technologies NANot applicableNot estimated NOx, CO, NMVOC, NH3, TSP, PM10, PM2.5, BC, Pb, Cd, Hg, As, Cr, Cu, Ni, Se, Zn, PCDD/F,
PCBs, HCB, Benzo(a)pyrene, Benzo(b)fluoranthene, Benzo(k)fluoranthene, Indeno(1,2,3-cd)pyrene
Pollutant Value Unit 95% confidence interval
Reference
Lower UpperSOx 18000 g/tonne 9000 27000 European Commission (2001)
Draft Not To Be Quoted 28
11
23
4
5
2
Draft Not To Be Quoted 1.A.2 Manufacturing industries and construction (combustion)
Table 3-22 Tier 2 emission factors for source category 1.A.2.b, Magnesium production
Tier 2 emission factors Code NameNFR Source Category 1.A.2.b Non-ferrous metalsFuel Natural GasSNAP (if applicable) 030323 Magnesium production (dolomite treatment)Technologies/Practices Magnesium ProductionRegion or regional conditions NAAbatement technologies NANot applicableNot estimated CO, NMVOC, NH3, TSP, PM10, PM2.5, BC, Pb, Cd, Hg, As, Cr, Cu, Ni, Se, Zn, PCDD/F, PCBs,
HCB, Benzo(a)pyrene, Benzo(b)fluoranthene, Benzo(k)fluoranthene, Indeno(1,2,3-cd)pyrene
Pollutant Value Unit 95% confidence interval
Reference
Lower UpperNOx 3050 g/tonne 1830 4270 European Commission (2001)SOx 335 g/tonne 16 7000 European Commission (2001)
Table 3-23 Tier 2 emission factors for source category 1.A.2.b, Alumina production
Tier 2 emission factors Code NameNFR Source Category 1.A.2.b Non-ferrous metalsFuel Gas/OilSNAP (if applicable) 030322 Alumina productionTechnologies/Practices AluminaRegion or regional conditions NAAbatement technologies NANot applicableNot estimated NMVOC, NH3, TSP, PM10, PM2.5, BC, Pb, Cd, Hg, As, Cr, Cu, Ni, Se, Zn, PCDD/F,
Benzo(a)pyrene, Benzo(b)fluoranthene, Benzo(k)fluoranthene, Indeno(1,2,3-cd)pyrene, PCBs, HCB
Pollutant Value Unit 95% confidence interval
Reference
Lower UpperNOx 945 g/tonne 660 1350 CORINAIR (1990)CO 135 g/tonne 55 330 CORINAIR (1990)SOx 637 g/tonne 88 4610 CORINAIR (1990)
Note: Emission factors derived from thermal input emission factors from 2006 Guidebook and energy use data for alumina production from the non-ferrous metals BREF (EIPPC 2001)
Draft Not To Be Quoted 29
11
2
3
45
2
Draft Not To Be Quoted 1.A.2 Manufacturing industries and construction (combustion)
Combustion in 1.A.2.f.i — Other manufacture
Default emission factors are provided below for NOx, SO2 and CO where information is available. Guidance on estimating other pollutants is provided in the industrial processes chapters when relevant process-related emissions are known to occur.
Table 3-24 Tier 2 emission factors for source category 1.A.2.f.i, Plaster (gypsum) furnaces
Tier 2 emission factors Code NameNFR Source Category 1.A.2.f.i Stationary combustion in manufacturing industries and construction: Other Fuel Gas/OilSNAP (if applicable) 030204 Plaster furnacesTechnologies/Practices Plaster (gysum) manufactureRegion or regional conditions NAAbatement technologies NANot applicableNot estimated CO, NMVOC, SOx, NH3, TSP, PM10, PM2.5, BC, Pb, Cd, Hg, As, Cr, Cu, Ni, Se, Zn, PCDD/F,
PCBs, HCB, Benzo(a)pyrene, Benzo(b)fluoranthene, Benzo(k)fluoranthene, Indeno(1,2,3-cd)pyrene,
Pollutant Value Unit 95% confidence interval
Reference
Lower UpperNOx 1060 g/tonne 800 1400 US EPA (1990)
Table 3-25 Tier 2 emission factors for source category 1.A.2.f.i, Lime production
Tier 2 emission factors Code NameNFR Source Category 1.A.2.f.i Stationary combustion in manufacturing industries and construction: Other Fuel Coal/gas/oilSNAP (if applicable) 030312 Lime (includes iron and steel and paper pulp industries)Technologies/Practices LimeRegion or regional conditions NAAbatement technologies NANot applicableNot estimated NMVOC, NH3, TSP, PM10, PM2.5, BC, Pb, Cd, Hg, As, Cr, Cu, Ni, Se, Zn, PCDD/F,
Benzo(a)pyrene, Benzo(b)fluoranthene, Benzo(k)fluoranthene, Indeno(1,2,3-cd)pyrene, PCBs, HCB
Pollutant Value Unit 95% confidence interval
Reference
Lower UpperNOx 1369 g/tonne 150 12500 European Commission (2010)CO 1940 g/tonne 300 12500 European Commission (2010)SOx 316 g/tonne 10 10000 European Commission (2010)
Draft Not To Be Quoted 30
1
1
2
34567
8
9
10
2
Draft Not To Be Quoted 1.A.2 Manufacturing industries and construction (combustion)
Table 3-26 Tier 2 emission factors for source category 1.A.2.f.i, Cement production
Tier 2 emission factors Code NameNFR Source Category 1.A.2.f.i Stationary combustion in manufacturing industries and construction: Other Fuel Coal/pet. Coke/gas/oil/recovered wastesSNAP (if applicable) 030311 CementTechnologies/Practices Cement manufactureRegion or regional conditions
NA
Abatement technologies NANot applicableNot estimated NH3, TSP, PM10, PM2.5, BCPollutant Value Unit 95% confidence
intervalReference
Lower UpperNOx 1241 g/te clinker 330 4670 European Commission (2010)CO 1455 g/te clinker 460 4600 European Commission (2010)NMVOC 18 g/te clinker 2.3 138 European Commission (2010)SOx 374 g/te clinker 20 11120 European Commission (2010)Pb 0.098 g/te clinker 0.024 0.4 European Commission (2010)Cd 0.008 g/te clinker 0.004 0.016 European Commission (2010)Hg 0.049 g/te clinker 0.01 0.24 European Commission (2010)As 0.0265 g/te clinker 0.014 0.05 European Commission (2010)Cr 0.041 g/te clinker 0.028 0.06 European Commission (2010)Cu 0.0647 g/te clinker 0.022 0.19 European Commission (2010)Ni 0.049 g/te clinker 0.016 0.15 European Commission (2010)Se 0.0253 g/te clinker 0.016 0.04 European Commission (2010)Zn 0.424 g/te clinker 0.2 0.9 European Commission (2010)PCB 103 µg/te clinker 46 230 VDZ (2011)PCDD/F 4.1 ng I-TEQ/te clinker 0.0267 627 European Commission (2010)Benzo(a)pyrene 0.000065 g/te clinker 0.000033 0.000098 US EPA (1995), chapter 11.6Benzo(b)fluoranthene 0.00028 g/te clinker 0.00014 0.00042 US EPA (1995), chapter 11.6Benzo(k)fluoranthene 0.000077 g/te clinker 0.000039 0.00012 US EPA (1995), chapter 11.6Indeno(1,2,3-cd)pyrene 0.000043 g/te clinker 0.000022 0.000065 US EPA (1995), chapter 11.6HCB 4.6 µg/te clinker 2.3 9.2 SINTEF (2006)
Note: Emissions of all pollutants (except particulate matter) are allocated to combustion in cement manufacture. Factors are expressed as grams pollutant per tonne of clinker produced. For HMs the values in the BREF have been converted using 2000 Nm3 per tonnes as done in GB2009. For HCB and PCBs the values in the references have been converted using 2300 Nm3 per tonnes.
Draft Not To Be Quoted 31
11
2345
2
Draft Not To Be Quoted 1.A.2 Manufacturing industries and construction (combustion)
Table 3-27 Tier 2 emission factors for source category 1.A.2.f.i, Roadstone coating (asphalt) plants
Tier 2 emission factors Code NameNFR Source Category 1.A.2.f.i Stationary combustion in manufacturing industries and construction: Other Fuel Gas/OilSNAP (if applicable) 030313 Asphalt concrete plantsTechnologies/Practices AsphaltRegion or regional conditions NAAbatement technologies NANot applicableNot estimated NMVOC, NH3, TSP, PM10, PM2.5, BC, Pb, Cd, Hg, As, Cr, Cu, Ni, Se, Zn, PCDD/F,
Benzo(a)pyrene, Benzo(b)fluoranthene, Benzo(k)fluoranthene, Indeno(1,2,3-cd)pyrene, PCBs, HCB
Pollutant Value Unit 95% confidence interval
Reference
Lower UpperNOx 35.6 g/tonne 12.5 60 US EPA (2004), chapter 11.1CO 200 g/tonne 100 300 US EPA (2004), chapter 11.1SOx 17.7 g/tonne 2.3 44 US EPA (2004), chapter 11.1
Table 3-28 Tier 2 emission factors for source category 1.A.2.f.i, Glass production
Tier 2 emission factors Code NameNFR Source Category 1.A.2.f.i Stationary combustion in manufacturing industries and construction: Other Fuel Gas/OilSNAP (if applicable) 0303 Processes with contactTechnologies/Practices Glass (flat, container, domestic, special,cont. filament glass fibre)Region or regional conditions NAAbatement technologies NANot applicableNot estimated NMVOC, NH3, TSP, PM10, PM2.5, BC, Pb, Cd, Hg, As, Cr, Cu, Ni, Se, Zn, PCDD/F,
Benzo(a)pyrene, Benzo(b)fluoranthene, Benzo(k)fluoranthene, Indeno(1,2,3-cd)pyrene, PCBs, HCB
Pollutant Value Unit 95% confidence interval
Reference
Lower UpperNOx 2930 g/tonne 220 14700 European Commission (2008)
CO 6.13 g/tonne 3.07 258 European Commission (2008)SOx 1960 g/tonne 118 15100 European Commission (2008)
Note: BREF data referenced include new data from the draft revised Glass BREF (EIPPCB 2008). A final BREF document was published in 2012, but the results have not yet been incorporated.
Draft Not To Be Quoted 32
112
3
4
56
2

Draft Not To Be Quoted 1.A.2 Manufacturing industries and construction (combustion)
Table 3-29 Tier 2 emission factors for source category 1.A.2.f.i, Mineral wool production
Tier 2 emission factors Code NameNFR Source Category 1.A.2.f.i Stationary combustion in manufacturing industries and construction: Other Fuel Gas/OilSNAP (if applicable) 030316
030318Glass wool (except binding)Mineral wool (except binding)
Technologies/Practices Mineral WoolRegion or regional conditions NAAbatement technologies NANot applicableNot estimated NMVOC, NH3, TSP, PM10, PM2.5, BC, Pb, Cd, Hg, As, Cr, Cu, Ni, Se, Zn, PCDD/F,
Benzo(a)pyrene, Benzo(b)fluoranthene, Benzo(k)fluoranthene, Indeno(1,2,3-cd)pyrene, PCBs, HCB
Pollutant Value Unit 95% confidence interval
Reference
Lower UpperNOx 1630 g/tonne 220 10600 European Commission (2008)CO 525 g/tonne 1 149000 European Commission (2008)SOx 223 g/tonne 1 4800 European Commission (2008)
Note: BREF data referenced include new data from the draft revised Glass BREF (EIPPCB 2008). A final BREF document was published in 2012, but the results have not yet been incorporated.
Table 3-30 Tier 2 emission factors for source category 1.A.2.f.i, Bricks and tiles
Tier 2 emission factors Code NameNFR Source Category 1.A.2.f.i Stationary combustion in manufacturing industries and construction: Other (Fuel Gas/oil/coalSNAP (if applicable) 030319 Bricks and tilesTechnologies/Practices Bricks and tiles productionRegion or regional conditions NAAbatement technologies NANot applicableNot estimated NMVOC, NH3, TSP, PM10, PM2.5, BC, Pb, Cd, Hg, As, Cr, Cu, Ni, Se, Zn, PCDD/F,
Benzo(a)pyrene, Benzo(b)fluoranthene, Benzo(k)fluoranthene, Indeno(1,2,3-cd)pyrene, PCBs, HCB
Pollutant Value Unit 95% confidence interval
Reference
Lower UpperNOx 184 g/Mg 49 255 European Commission (2007)CO 189 g/Mg 155 800 European Commission (2007)SOx 39.6 g/Mg 2.45 2550 European Commission (2007)
Note: The SOx emission depends on the percentages of sulphur in raw materials (which can be highly variable); SOx emissions can be more accurately estimated for an installation using mass balance procedures. However, the amount of SOx released may be reduced by contact with alkaline components of the raw materials or additives. For coal-fired kilns, the contribution of the fuel sulphur to SOx emissions must also be accounted for when performing mass balance calculations.
Draft Not To Be Quoted 33
11
2345
6789
10
2
Draft Not To Be Quoted 1.A.2 Manufacturing industries and construction (combustion)
Table 3-31 Tier 2 emission factors for source category 1.A.2.f.i, Fine ceramic materials
Tier 2 emission factors Code NameNFR Source Category 1.A.2.f.i Stationary combustion in manufacturing industries and construction: Other
(Please specify in your IIR)Fuel Gas/oil/coalSNAP (if applicable) 030320 Fine ceramic materialsTechnologies/Practices Fine ceramicRegion or regional conditions NAAbatement technologies NANot applicableNot estimated NMVOC, NH3, TSP, PM10, PM2.5, BC, Pb, Cd, Hg, As, Cr, Cu, Ni, Se, Zn, PCDD/F,
Benzo(a)pyrene, Benzo(b)fluoranthene, Benzo(k)fluoranthene, Indeno(1,2,3-cd)pyrene, PCBs, HCB
Pollutant Value Unit 95% confidence interval
Reference
Lower UpperNOx 850 g/tonne 425 1280 RIVA (1992)CO 456 g/tonne 130 1600 RIVA (1992)SOx 247 g/tonne 210 290 RIVA (1992)
Table 3-32 Tier 2 emission factors for source category 1.A.2.f.i, Enamel production
Tier 2 emission factors Code NameNFR Source Category 1.A.2.f.i Stationary combustion in manufacturing industries and construction: Other
(Please specify in your IIR)Fuel Gas/OilSNAP (if applicable) 030325 Enamel productionTechnologies/Practices EnamelRegion or regional conditions NAAbatement technologies NANot applicableNot estimated NMVOC, NH3, TSP, PM10, PM2.5, BC, Pb, Cd, Hg, As, Cr, Cu, Ni, Se, Zn, PCDD/F,
Benzo(a)pyrene, Benzo(b)fluoranthene, Benzo(k)fluoranthene, Indeno(1,2,3-cd)pyrene, PCBs, HCB
Pollutant Value Unit 95% confidence interval
Reference
Lower UpperNOx 12000 g/tonne 7100 29300 European Commission (2012b)CO 2400 g/tonne 1200 3600 US EPA (1997), chapter 11.14SOx 1000 g/tonne 200 5000 European Commission (2012b)
3.3.3 Abatement
A number of add-on technologies exist that are aimed at reducing emissions from combustion in these source activities (primarily PM, but other pollutants are also abated). The resulting emissions can be calculated by extending the technology-specific emission factor with an abated emission factor as given in the formula:
(5)
However, as abatement technology is rarely specified in terms of efficiency, it may be more relevant to develop abated emission factors from the final emission concentrations achieved using abatement.
Draft Not To Be Quoted 34
11
2
3
4
5
6789
10
111213
2
Draft Not To Be Quoted 1.A.2 Manufacturing industries and construction (combustion)
Guidance on estimating emission factors from concentrations for combustion processes is provided in chapter 1.A.1.
3.3.4 Activity data
In most cases the statistical information includes data on annual fuels consumption in the relevant activities. However, data on use of allocation of fuels between conventional combustion and in-process combustion and in specific activities may be limited. To fill these data gaps the following sources could be used:
information from emission trading schemes;
information from the fuel suppliers and individual companies;
energy conservation/climate change mitigation studies for relevant sectors;
energy demand modelling.
To improve reliability of the activity data, appropriate efforts should be made in order to encourage the institution responsible for national energy statistics to report the fuel consumption at the adequate level of sectoral disaggregation in their regular activity.
Also, when data on the fuel consumption are provided at an appropriate level of sectoral split, they should be checked for possible anomalies. The recovery of waste fuels in some sectors requires particular consideration.
3.4 Tier 3 use of facility data
3.4.1 Algorithm
Where facility-level emission data of sufficient quality (see Chapter 3, Data collection, in part A) are available, it is good practice to use these data. There are two possibilities:
the facility reports cover all relevant processes in the country;
facility-level emission reports are not available for all relevant processes in the country.
However, it should be recognised that facility data is unlikely to be disaggregated between combustion and process emissions. Measures must be applied to avoid double-counting of combustion emissions where facility combustion data is difficult to disaggregate from process emissions.
If facility level data are available covering all activities in the country, the implied emission factors (reported emissions divided by the national fuel use) should be compared with the default emission factor values or technology specific emission factors. If the implied emission factors are outside the 95 % confidence intervals for the values given, it is good practice to explain the reasons for this in the inventory report.
Depending on the specific national circumstances and the coverage of the facility-level reports as compared to the total combustion activity, the emission factor (EF) in this equation should be chosen from the following possibilities, in decreasing order of preference:
Draft Not To Be Quoted 35
112
3
4567
89
1011
121314
151617
18
19
20
2122
2324
25262728
2930313233
343536
2
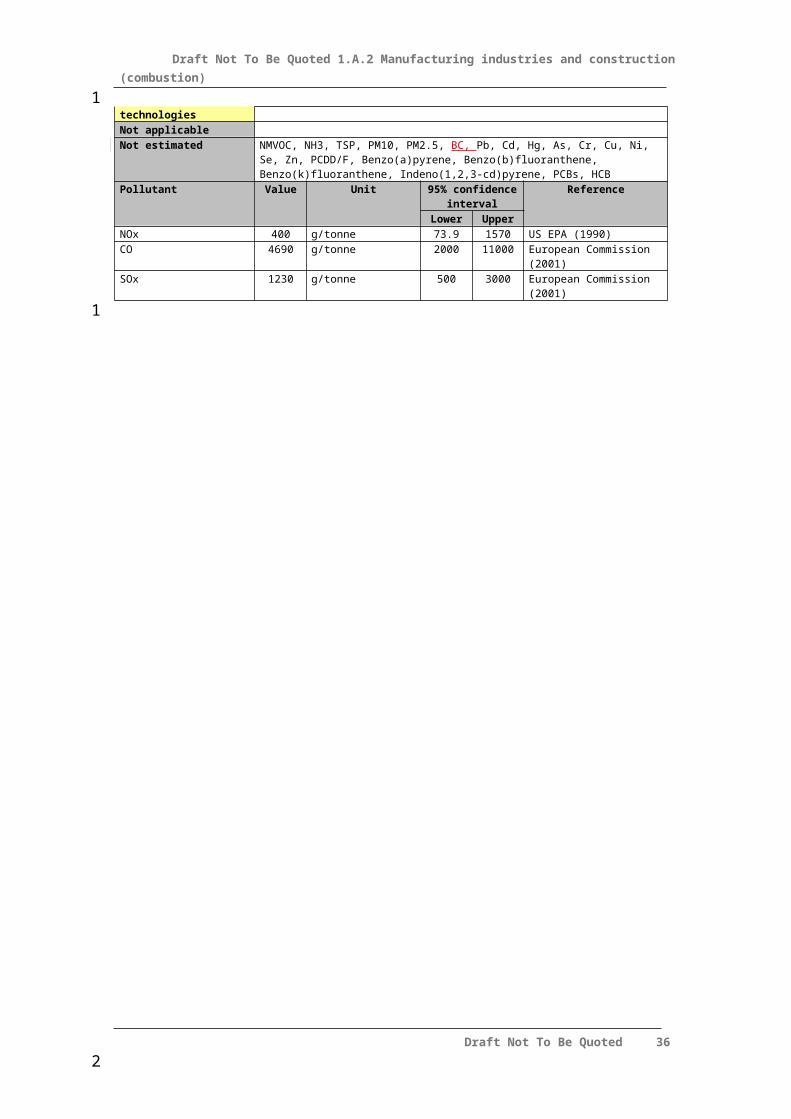
Draft Not To Be Quoted 1.A.2 Manufacturing industries and construction (combustion)
technology-specific emission factors, based on knowledge of the types of technologies implemented at the facilities where facility-level emission reports are not available;
the implied emission factor derived from the available emission reports:
(7)
the default Tier 1 emission factor. This option should only be chosen if the facility-level emission reports cover more than 90 % of the total national production.
Sources of emission factor guidance for facilities include the US EPA, BREF and industry sector guidance (for example from Eurelectric and Concawe trade associations).
Many industrial installations are major facilities and emission data for individual plants might be available through a pollutant release and transfer registry (PRTR) or another national emission reporting scheme. When the quality of such data is assured by a well-developed QA/QC system and the emission reports have been verified by an independent auditing scheme, it is good practice to use such data. If extrapolation is needed to cover all activity in the country either the implied emission factors for the facilities that did report, or the emission factors as provided above could be used.
3.4.2 Activity data
Since PRTR generally do not report activity data, such data in relation to the reported facility level emissions are sometimes difficult to find. A possible source of facility level activity might be the registries of emission trading systems.
In many countries national statistics offices collect production data on facility level, but these are in many cases confidential. However in several countries, national statistics offices are part of the national emission inventory systems and the extrapolation, if needed, could be performed at the statistics office, ensuring that confidentiality of production data is maintained.
4 Data quality
4.1 CompletenessNo specific issues.
4.2 Avoiding double counting with other sectorsIn cases where it is possible to split the emissions, it is good practice to do so. However, care must be taken that the emissions are not double counted. This is particularly relevant to this activity where process emissions may incorporate combustion discharges.
Draft Not To Be Quoted 36
1123
4
56789
10111213141516
17
181920
21222324
25
26
27
28
29303132
2
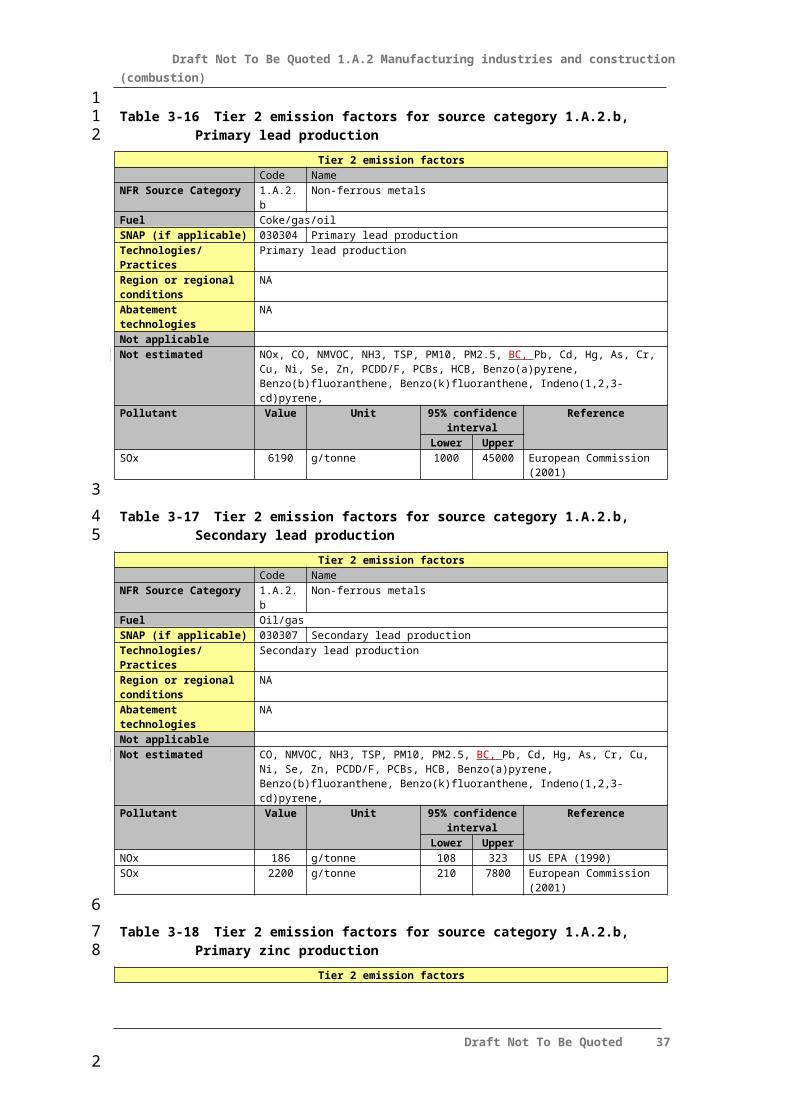
Draft Not To Be Quoted 1.A.2 Manufacturing industries and construction (combustion)
4.3 Verification
4.3.1 Best Available Techniques emission factors
The BREF notes provide guidance on achievable emission levels for combustion emissions.
Guidance on the range of combustion emission factors for conventional combustion is provided within Chapters 1.A.1 Energy industries and 1.A.4 Small combustion.
4.4 Developing a consistent time series and recalculationThe emissions of non-CO2 emissions from fuel combustion change with time as equipment and facilities are upgraded or replaced by less-polluting energy technology. The mix of technology used with each fuel will change with time and this has implications for the choice of emission factor at Tier 1 and Tier 2.
4.5 Uncertainty assessment
4.5.1 Emission factor uncertainties
There is uncertainty in the aggregated emission factors used to estimate emissions. The sizes and technologies in the sector will impact on the uncertainty to be expected from the application of an ‘average’ emission factor.
4.5.2 Activity data uncertainties
The allocation of fuel use between in-process combustion and conventional combustion in some of the processes may be difficult. In addition, activity data for fuel use in an industry sector (or facility) may be subject to uncertainty due to waste recovery within industrial combustion activities.
4.6 Inventory quality assurance/quality control QA/QCNo specific issues.
4.7 MappingNo specific issues.
4.8 Reporting and documentationNo specific issues.
5 GlossaryBoiler: any technical apparatus in which fuels are oxidised in order to generate thermal
energy, which is transferred to water or steam
Brown coal: refers to brown coal/lignite (NAPFUE 105) of gross caloric value (GHV) less than 17 435 kJ/kg and containing more than 31 % volatile matter on a dry mineral
Draft Not To Be Quoted 37
11
2
3
45
6
789
10
11
12
131415
16
17181920
21
22
23
24
25
26
27
28
2
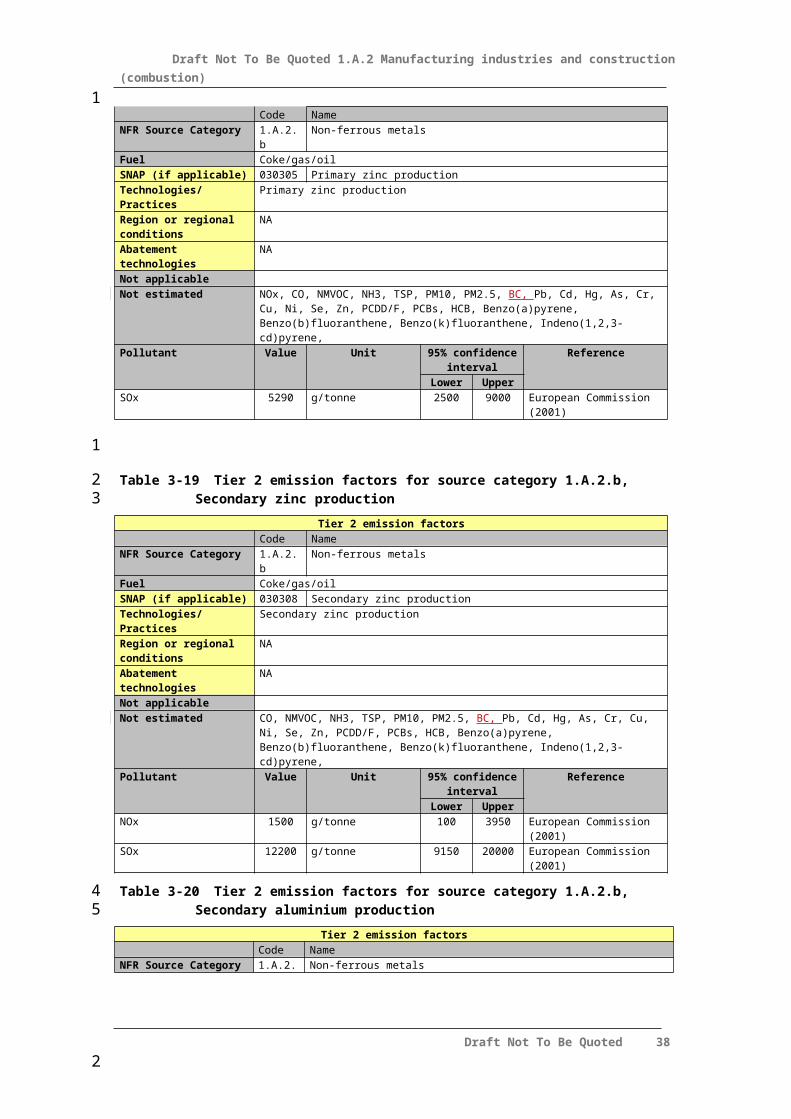
Draft Not To Be Quoted 1.A.2 Manufacturing industries and construction (combustion)
matter free basis
CHP: Combined Heat and Power refers to a co-generation installation where fuel is used for both power generation and heat supply
Cogeneration: refers to a facility where both power generation and heat (typically steam) is produced
Coke: refers to the solid residue obtained from hard coal (NAPFUE 107) or from brown coal (NAPFUE 108) by processing at high temperature in the absence of air
Gaseous fuels:
refers to natural gas (NAPFUE 301), natural gas liquids (NAPFUE 302) and biogas (NAPFUE 309)
Hard coal: refers to coal of a gross caloric value greater than 17 435 kJ/kg on ash-free but moisture basis, i.e. steam coal (NAPFUE 102, GHV > 23 865 kJ/kg), sub-bituminous coal (NAPFUE 103, 17 435 kJ/kg < GHV < 23865 kJ/kg) and anthracite
Liquid fuels: refers to kerosene (NAPFUE 206), gas oil (gas/diesel oil (NAPFUE 204), residual oil, residual fuel oil (NAPFUE 203), liquefied petroleum gases (LPG; NAPFUE 303), and other liquid fuels (NAPFUE 225)
Peat: refers to peat-like fuels (NAPFUE 113)
Biomass: refers to wood fuels which are wood and similar wood wastes (NAPFUE 111) and wood wastes (NAPFUE 116) and agricultural wastes used as fuels (straw, corncobs, etc; NAPFUE 117)
6 ReferencesBoman, C., Pettersson, E., Westerholm, R., Boström, D. & Nordin, A., 2011: Stove Performance and Emission Characteristics in Residential Wood Log and Pellet Combustion, Part 1: Pellet Stoves. Enery Fuels 2011, 25.
European Commission, 2001: Reference Document on Best Available Techniques in the Non Ferrous Metals Industries. December 2001. Available at http://eippcb.jrc.es/
European Commission, 2005. European IPPC Bureau, Reference Document on Best Available Techniques in the Smitheries and Foundries IndustryAvailable at http://eippcb.jrc.es/
European Commission, 2007: Reference Document on Best Available Techniques in the Ceramic Manufacturing Industry. August 2007. Available at http://eippcb.jrc.es/
European Commission, 2009: Draft Reference Document on Best Available Techniques for the Non-Ferrous Metals Industries. Draft July 2009. Available at http://eippcb.jrc.es/
European Commission, 2010: Reference Document on Best Available Techniques in the Cement, Lime and Magnesium Oxide Manufacturing Industries. May 2010. Available at http://eippcb.jrc.es/
European Commission, 2012a: Best Available Techniques (BAT) Reference Document for Iron and Steel Production. Available at http://eippcb.jrc.es/
Draft Not To Be Quoted 38
1
1
2
2
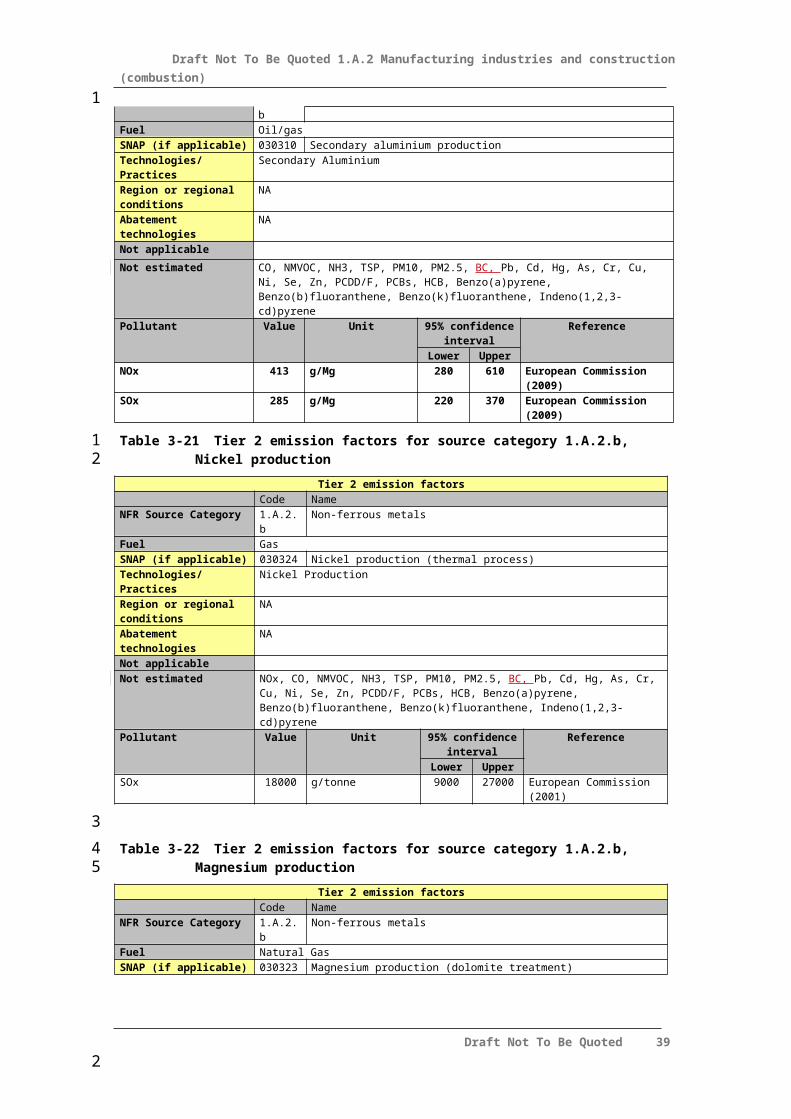
Draft Not To Be Quoted 1.A.2 Manufacturing industries and construction (combustion)
European Commission, 2012b: Best Available Techniques (BAT) Reference Document for the Manufacture of Glass. Available at http://eippcb.jrc.es/
Fernandes, A.P., Alves, C.A., Goncalves, C., Tarelho, L., Pio, C., Schmidl, C. & Bauer, H. (2011): Emission facgtors from residential combustion appliances burning Portuguese biomass fuels. Journal of Environmental Monitoring, 2011, 13, 3196.
Goncalves, C., Alves, C., Evtyugina, M., Mirante, F., Pio, C., Caseiro, A., Schmidl, C., Bauer, H. & Carvalho, F., 2010: Characterisation of PM10 emissions from woodstove combustion of common woods grown in Portugal. Atmospheric Environment, 2010, 44.
Guidebook (2006). EMEP/CORINAIR Emission Inventory Guidebook, version 4 (2006 edition). Published by the European Environmental Agency, Technical report No 11/2006. Available via http://reports.eea.europa.eu/EMEPCORINAIR4/en/page002.html
Hedberg, E., Kristensson, A., Ohlsson, M., Johansson, C., Johansson, P.-Å., Swietlicki, E., Vesely, V., Wideqvist, U. & Westerholm, R., 2002: Chemical and physical characterization of emissions from birch wood combustion in a wood stove. Atmospheric Environment, 2002, 36
Hedman B., Näslund, M. & Marklund, S., 2006: Emission of PCDD/F, PCB and HCB from Combustion of Firewood and Pellets in Residential Stoves and Boilers, Environmental Science & Technology, 2006, 40
Johansson, L.S., Leckner, B., Gustavsson, L., Cooper, D., Tullin, C. & Potter, A., 2004: Emissions characteristics of modern and old-type residential boilers fired with wood logs and wood pellets. Atmospheric Environment, 2004, 38.
Kakareka S., Kukharchyk T., Khomich V. (2004). Research for HCB and PCB Emission Inventory Improvement in the CIS Countries (on an Example of Belarus) / Belarusian Contribution to EMEP. Annual Report 2003. Minsk, 2004.
Lamberg, H., Nuutinen, K., Tissari, J., Ruusunen, J., Yli-Pirilä, P., Sippula, O., Tapanainen, M., Jalava, P., Makkonen, U., Teinilä, K., Saarnio, K., Hillamo, R., Hirvonen, J.-R. & Jokiniemi, 2011: Physicochemical characterization of fine particles from small-scale wood combustion. Atmospheric Environment, 2011, 45.
Naturvårdsverket, 2004: Emission factors and emissions from residential biomass combustion in Sweden.
RIVA 1992 Huizinga K et al, Fjnkeramische industrie, RIVM report 736301124. RIZA report 92.003/24:1992.
Roe S.M., Spivey, M.D., Lindquist, H.C., Kirstin B. Thesing, K.B., Randy P. Strait, R.P & Pechan, E.H. & Associates, Inc, 2004: Estimating Ammonia Emissions from Anthropogenic Non-Agricultural Sources. Draft Final Report. April 2004.
Schmidl, C., Luisser, M., Padouvas, E., Lasselsberger, L., Rzaca, M., Cruz, C.R.-S., Handler, M., Peng, G., Bauer, H. & Puzbaum, H., 2011: Particulate and gaseous emissions from manually and automatically fired small scale combustion systems. Atmospheric Environment, 2011, 45.
SINTEF, 2006: Formation and Release of POPs in the Cement Industry. Second edition. 23 January 2006.
Struschka, M., Kilgus, D., Springmann, M. & Baumbach, G. 2008: Umwelt Bundes Amt, Effiziente 19 Bereitstellung aktueller Emissionsdaten für die Luftreinhaltung, 44/08, , Universität
Draft Not To Be Quoted 39
1
2
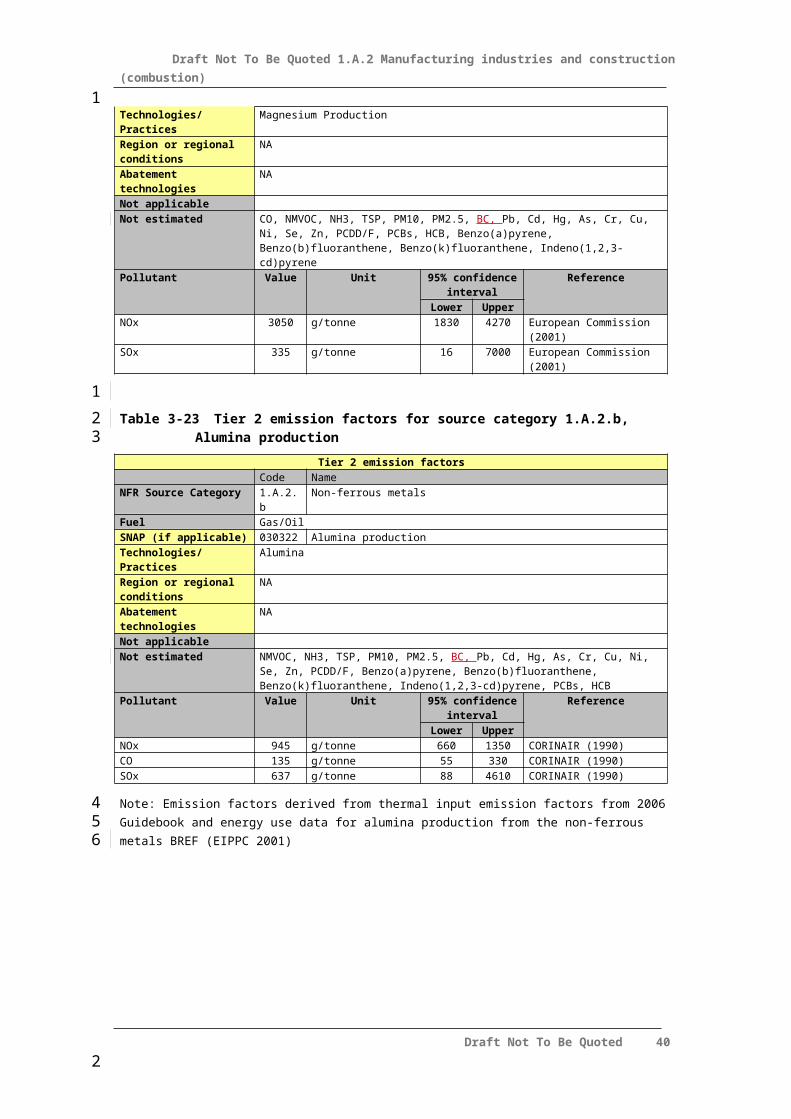
Draft Not To Be Quoted 1.A.2 Manufacturing industries and construction (combustion)
Stuttgart, Institut für 20 Verfahrenstechnid und Dampfkesselwesen (IVD)
Syc, M., Horak, J., Hopan, F., Krpec, K., Tomsej, T., Ocelka, T. & Pekarek, V., 2011: Effect of Fuels and Domestic Heating Appliance Types on Emission Factors of Selected Organic Pollutants. Environmental Science & Technology, 2011.
Tissari, J., Hytönen, K., Lyyränen, J. & Jokiniemi, J., 2007: A novel field measurement method for determining fine particle and gas emissions from residential wood combustion. Atmospheric Environment, 2007, 41.
US EPA 1990. AIRS Facility system. EPA Document 450/4-90-003, Research Triangle Park.
US EPA, 1995: AP 42, Fifth Edition, Volume I, Chapter 11: Mineral Products Industry, Chapter 11.6: Portland Cement Manufacturing. Available at www.epa.gov/ttn/chief/ap42/
US EPA, 1997: AP 42, Fifth Edition, Volume I, Chapter 11: Mineral Products Industry, Chapter 11.3: Bricks and Related Clay Products.
US EPA, 2004: AP 42, Fifth Edition, Volume I, Chapter 11: Mineral Products Industry, Chapter 11.1: Hot Mix Asphalt Plants.
VDZ, 2011: Environmental Data of the German Cement Industry 2010.
7 Point of enquiryEnquiries concerning this chapter should be directed to the relevant leader(s) of the Task Force on Emission Inventories and Projection’s expert panel on combustion and industry. Please refer to the TFEIP website (www.tfeip-secretariat.org/) for the contact details of the current expert panel leaders.
Draft Not To Be Quoted 40
1
1
234567
2