Embed Size (px)
Citation preview


RADIOMETRIC INTERPRETATION OF GEOLOGIC DATA AND ITS EFFECT
ON GROUNDWATER IN ABUJA, NORTH-CENTRAL NIGERIA
OMEJE MAXWELL
Faculty of Science
Universiti Teknologi Malaysia
i

ii

I dedicate this work
To my dear wife and family
Whose love, kindness, patience and prayers have brought me this far
iii

ACKNOWLEDGEMENT
To God be all Glory, honour, majesty and praise for his mercies, protection and care
throughout the course of this research work. I wish to express my profound gratitude
to my able supervisors, Prof. Dr. Husin Wagiran; indeed a father to me, Prof .Dr.
Noorddin Ibrahim and Dr. Soheil Sabri who despite their tight schedules still had
time to scrutinize this work offering with constructive advice where necessary. A
very big thanks to Mr. S. K. Lee who from the beginning of this research took it
upon himself to assist to the end. Also to my uncles in the likes of Dr. Ugwuoke
Paulinus, Mr. Gebriel Ezema, Mr. Ugwuoke Peter Ifeanychukwu, Prince Ugwuoke,
Rev. Paul Okereke, Mr & Mrs. Chima Cyracus Agbo, Mr. Ottih Gerry, Mr. Ugwu
Earnest Ozoemena and Oha Andrew Ifeanyi for their financial and academic
supports.
Thanks and appreciations to all the staff and my friends in the Physics
Department who contributed in this research work. Many thanks to all people who
helped me in my study, in particular, Dr. Ibrahim Alnour, Dr. Yasser Alajerami, Dr.
Muneer Saleh, Mohamad Gulbahar, Nuraddeen Nasiru Getso, Abubaka Sadiqu
Aliyu, Aminu Saidu, Azadeh Rafaei and lab Staff Mr Saiful Bin Rashid, Mr
Mohammad Abdullah Bin Lasimin, Abdusalami Gital, Mr Jaffar and Puan Anissa.
Special thanks to my late parents and all the members of my family that
supported me with patience and encouragements.
iv
ABSTRACT
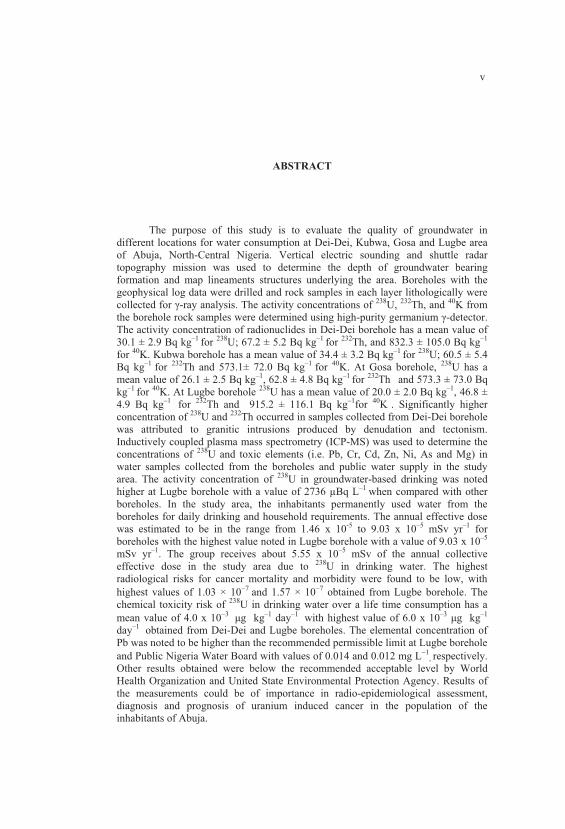
The purpose of this study is to evaluate the quality of groundwater in
different locations for water consumption at Dei-Dei, Kubwa, Gosa and Lugbe area
of Abuja, North-Central Nigeria. Vertical electric sounding and shuttle radar
topography mission was used to determine the depth of groundwater bearing
formation and map lineaments structures underlying the area. Boreholes with the
geophysical log data were drilled and rock samples in each layer lithologically were
collected for γ-ray analysis. The activity concentrations of 238
U, 232
Th, and 40
K from
the borehole rock samples were determined using high-purity germanium γ-detector.
The activity concentration of radionuclides in Dei-Dei borehole has a mean value of
30.1 ± 2.9 Bq kg‒1
for 238
U; 67.2 ± 5.2 Bq kg‒1
for 232
Th, and 832.3 ± 105.0 Bq kg‒1
for 40
K. Kubwa borehole has a mean value of 34.4 ± 3.2 Bq kg‒1
for 238
U; 60.5 ± 5.4
Bq kg‒1
for 232
Th and 573.1± 72.0 Bq kg‒1
for 40
K. At Gosa borehole, 238
U has a
mean value of 26.1 ± 2.5 Bq kg‒1
, 62.8 ± 4.8 Bq kg‒1
for 232
Th and 573.3 ± 73.0 Bq
kg‒1
for 40
K. At Lugbe borehole 238
U has a mean value of 20.0 ± 2.0 Bq kg‒1
, 46.8 ±
4.9 Bq kg‒1
for 232
Th and 915.2 ± 116.1 Bq kg‒1
for 40
K . Significantly higher
concentration of 238
U and 232
Th occurred in samples collected from Dei-Dei borehole
was attributed to granitic intrusions produced by denudation and tectonism.
Inductively coupled plasma mass spectrometry (ICP-MS) was used to determine the
concentrations of 238
U and toxic elements (i.e. Pb, Cr, Cd, Zn, Ni, As and Mg) in
water samples collected from the boreholes and public water supply in the study
area. The activity concentration of 238
U in groundwater-based drinking was noted
higher at Lugbe borehole with a value of 2736 μBq L‒1
when compared with other
boreholes. In the study area, the inhabitants permanently used water from the
boreholes for daily drinking and household requirements. The annual effective dose
was estimated to be in the range from 1.46 x 10⁻⁵
to 9.03 x 10‒5
mSv yr‒1
for
boreholes with the highest value noted in Lugbe borehole with a value of 9.03 x 10‒5
mSv yr‒1
. The group receives about 5.55 x 10‒5
mSv of the annual collective
effective dose in the study area due to 238
U in drinking water. The highest
radiological risks for cancer mortality and morbidity were found to be low, with
highest values of 1.03 × 10�7
and 1.57 × 10�7
obtained from Lugbe borehole. The
chemical toxicity risk of 238
U in drinking water over a life time consumption has a
mean value of 4.0 x 10�3
μg kg‒1
day‒1
with highest value of 6.0 x 10‒3
μg kg‒1
day‒1
obtained from Dei-Dei and Lugbe boreholes. The elemental concentration of
Pb was noted to be higher than the recommended permissible limit at Lugbe borehole
and Public Nigeria Water Board with values of 0.014 and 0.012 mg L�1
, respectively.
Other results obtained were below the recommended acceptable level by World
Health Organization and United State Environmental Protection Agency. Results of
the measurements could be of importance in radio-epidemiological assessment,
diagnosis and prognosis of uranium induced cancer in the population of the
inhabitants of Abuja.
v
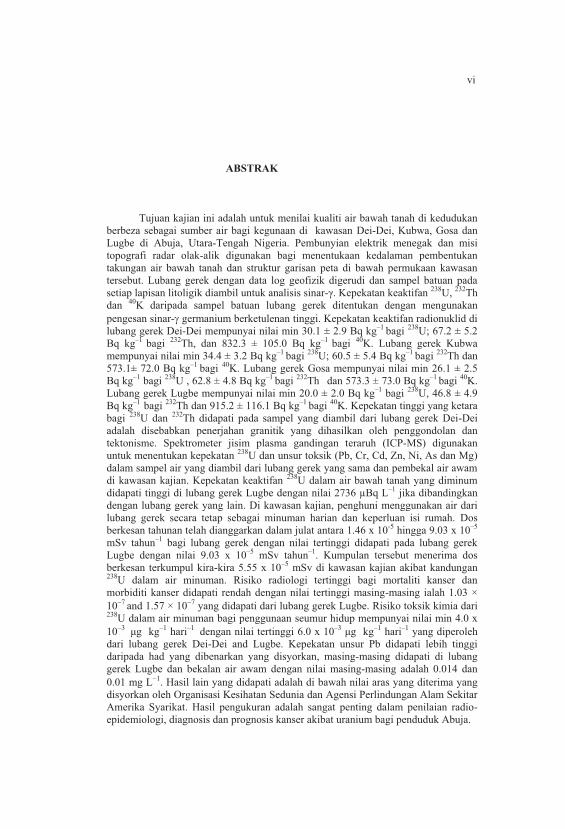
ABSTRAK
Tujuan kajian ini adalah untuk menilai kualiti air bawah tanah di kedudukan
berbeza sebagai sumber air bagi kegunaan di kawasan Dei-Dei, Kubwa, Gosa dan
Lugbe di Abuja, Utara-Tengah Nigeria. Pembunyian elektrik menegak dan misi
topografi radar olak-alik digunakan bagi menentukaan kedalaman pembentukan
takungan air bawah tanah dan struktur garisan peta di bawah permukaan kawasan
tersebut. Lubang gerek dengan data log geofizik digerudi dan sampel batuan pada
setiap lapisan litoligik diambil untuk analisis sinar-γ. Kepekatan keaktifan 238
U,232
Th
dan40
K daripada sampel batuan lubang gerek ditentukan dengan mengunakan
pengesan sinar-� germanium berketulenan tinggi. Kepekatan keaktifan radionuklid di
lubang gerek Dei-Dei mempunyai nilai min 30.1 ± 2.9 Bq kg‒1
bagi238
U; 67.2 ± 5.2
Bq kg‒1
bagi 232
Th, dan 832.3 ± 105.0 Bq kg‒1
bagi40
K. Lubang gerek Kubwa
mempunyai nilai min 34.4 ± 3.2 Bq kg‒1
bagi238
U; 60.5 ± 5.4 Bq kg‒1
bagi232
Th dan
573.1± 72.0 Bq kg‒1
bagi 40
K. Lubang gerek Gosa mempunyai nilai min 26.1 ± 2.5
Bq kg‒1
bagi 238
U , 62.8 ± 4.8 Bq kg‒1
bagi232
Th dan 573.3 ± 73.0 Bq kg‒1
bagi 40
K.
Lubang gerek Lugbe mempunyai nilai min 20.0 ± 2.0 Bq kg‒1
bagi 238
U, 46.8 ± 4.9
Bq kg‒1
bagi232
Th dan 915.2 ± 116.1 Bq kg‒1
bagi 40
K. Kepekatan tinggi yang ketara
bagi238
U dan 232
Th didapati pada sampel yang diambil dari lubang gerek Dei-Dei
adalah disebabkan penerjahan granitik yang dihasilkan oleh penggondolan dan
tektonisme. Spektrometer jisim plasma gandingan teraruh (ICP-MS) digunakan
untuk menentukan kepekatan 238
U dan unsur toksik (Pb, Cr, Cd, Zn, Ni, As dan Mg)
dalam sampel air yang diambil dari lubang gerek yang sama dan pembekal air awam
di kawasan kajian. Kepekatan keaktifan 238
U dalam air bawah tanah yang diminum
didapati tinggi di lubang gerek Lugbe dengan nilai 2736 μBq L‒1
jika dibandingkan
dengan lubang gerek yang lain. Di kawasan kajian, penghuni menggunakan air dari
lubang gerek secara tetap sebagai minuman harian dan keperluan isi rumah. Dos
berkesan tahunan telah dianggarkan dalam julat antara 1.46 x 10⁻⁵
hingga 9.03 x 10‒5
mSv tahun‒1
bagi lubang gerek dengan nilai tertinggi didapati pada lubang gerek
Lugbe dengan nilai 9.03 x 10‒5
mSv tahun‒1
. Kumpulan tersebut menerima dos
berkesan terkumpul kira-kira 5.55 x 10‒5
mSv di kawasan kajian akibat kandungan 238
U dalam air minuman. Risiko radiologi tertinggi bagi mortaliti kanser dan
morbiditi kanser didapati rendah dengan nilai tertinggi masing-masing ialah 1.03 ×
10�7
and 1.57 × 10�7
yang didapati dari lubang gerek Lugbe. Risiko toksik kimia dari 238
U dalam air minuman bagi penggunaan seumur hidup mempunyai nilai min 4.0 x
10�3 μg kg
‒1 hari
‒1 dengan nilai tertinggi 6.0 x 10
‒3 μg kg‒1
hari‒1
yang diperoleh
dari lubang gerek Dei-Dei and Lugbe. Kepekatan unsur Pb didapati lebih tinggi
daripada had yang dibenarkan yang disyorkan, masing-masing didapati di lubang
gerek Lugbe dan bekalan air awam dengan nilai masing-masing adalah 0.014 dan
0.01 mg L�1
. Hasil lain yang didapati adalah di bawah nilai aras yang diterima yang
disyorkan oleh Organisasi Kesihatan Sedunia dan Agensi Perlindungan Alam Sekitar
Amerika Syarikat. Hasil pengukuran adalah sangat penting dalam penilaian radio-
epidemiologi, diagnosis dan prognosis kanser akibat uranium bagi penduduk Abuja.
vi

TABLE OF CONTENTS
CHAPTER TITLE PAGE
iii
iv
v
vi
vii
xiii
xvi
xix
xxi
DEDICATION
ACKNOWLEDGMENT
ABSTRACT
ABSTRAK
TABLE OF CONTENTS
LIST OF TABLES
LIST OF FIGURES
LIST OF ABBREVIATIONS
LIST OF SYMBOLS
LIST OF APPENDIX xxvi
1 INTRODUCTION 1
1.1 Introduction 1
1.2 Problem statement 4
1.3 Research objectives 5
1.4 Reseach scope 6
1.5 Significant of study 9
1.6 Research hypotheses 10
1.7 Thesis organization 10
2 LITERATURE REVIEW 12
2.1 Introduction 12
vii

2.2 Radioactive studies 12
2.2.1 Radioactivity 13
2.3 Natural radioelements 13
2.3.1 Potassium 13
2.3.2 Uranium 14
2.3.3 Thorium 16
2.4 Geochemistry and chemistry of natural radionuclides in
Groundwater 18
2.4.1 Disequilibrium of radioactivity in groundwater 22
2.4.2 Groundwater colloids and particles 24
2.4.3 Activity concentration of natural radionuclides
in different Countries 25
2.4.4 Activity concentration of natural radionuclides
in Nigeria 28
2.5 Groundwater concept 29
2.5.1 Different types of confining Beds 30
2.5.2 Aquifer properties 31
2.5.3 Hydraulic conductivity 32
2.5.4 Heterogeneity and anisotropy of
hydraulic conductivity 32
2.5.5 Groundwater movement 33
2.5.6 Darcy’s law 33
2.6 Basement terrain groundwater in Nigeria 35
2.6.1 Groundwater occurrence in basement complex
rocks of Nigeria. 35
2.6.2 The older granite and gneisses complex area 35
2.6.3 The metasediments, quartzites and schists
complex Area 36
2.6.4 The younger granite/ fluvio volcanic
complex area 36
2.6.5 The granite areas 37
2.6.6 Fluvio volcanic series 37
2.7 The hydrogeologic system of groundwater in Nigeria 38
2.7.1 Groundwater chemistry 38
viii
2.7.2 Groundwater classification in Nigeria 39
3 RESEARCH METHODOLOGY 40
3.1 Introductio 40
3.1.1 The study area 40
3.2 Materials and methods for the present work 42
3.2.1 Geophysical investigation 42
3.2.2 Vertical electrical sounding (VES) 43
3.2.3 Shuttle radar topography mission (SRTM) 46
3.2.4 Application of shuttle radar topography mission 47
3.2.5 Drilling of borehole 47
3.2.6 Sample inventory 48
3.3 Sampling and sample preparation gamma ray analysis 53
3.3.1 Rock samples 53
3.3.2 Gamma-ray detector (HPGe) 58
3.3.3 Gamma-ray detector for the present study 60
3.3.4 Standard sample preparation preparation for
gamma spectrometry 63
3.3.5 Measurement of gamma-ray radioactivity from
Dei-Dei, Kubwa, Gosa And Lugbe Borehole
Rock Samples 64
3.3.6 Calculation of the Concentration of 238
U, 232
Th
and 40
K 66
3.4 Neutron activation analysis (NAA) 66
3.4.1 Sample preparation for NAA 66
3.4.2 Sample irradiation 67
3.4.3 Calculation of elements concentration 67
3.4.4 Determination of concentrations of 238
U and
232
Th 69
3.5 X-ray analysis for the major oxides in the rock sample
from the study area 69
3.7 Inductively coupled plasma mass spectroscopy (ICP-MS)
analysis for groundwater samples 72
ix
3.5.1 Materials and reagents for ICP-MS 72
3.7.2 Sample analysis using Elan 9000 instrument and
technique 75
3.7 Conceptual model for this study 77
4 RESULTS AND DISCUSSION 79
4.1 Introduction 79
4.2 Vertical electrical sounding (VES) measurements 79
4.2.1 VES data analysis and interpretation 81
4.2.2 Interpretation of 2D cross-sections of VES layers
across the survey area. 88
4.2.3 SRTM data analysis and interpretation. 91
4.2.4 Compatibility of VES and SRTM 93
4.3 Interpretation of mathematical model of flow in
homogeneous isotropic medium 99
4.3.1 Prediction of different scenarios pertaining
groundwater flow in a closed media using
Darcy’s law 101
4.4 Measurements of 238
U, 232
Th and 40
K in subsurface
layers of Dei-Dei, Kubwa, Gosa and Lugbe boreholes 107
4.4.1 Verification of 238
U, 232
Th using NAA 107
4.4.2 Activity concentration of 238
U, 232
Th and 40
K
in subsurface rock samples from Dei-Dei,
Kubwa, Gosa and Lugbe boreholes 109
4.4.3 Activity concentration of 238
U, 232
Th and
40K in Dei-Dei borehole rock samples 109
4.4.4 Th/U ratio in rock samples from Dei-Dei
Borehole 113
4.4.5 Correlation of lothologic variations with the
activity concentrations of 238
U, 232
Th and
40K in borehole layers at Dei-Dei 114
4.4.6 Activity concentration of 238
U, 232
Th and
40K in Kubwa borehole rock samples 116
4.4.7 Th/U ratio in rock samples from Kubwa
x
borehole 119
4.4.8 Correlation of lothologic variations with the
activity concentrations of 238
U, 232
Th and
40
K in borehole layers at Kubwa 120
4.4.9 Activity concentration of 238
U, 232
Th and 40
K
in Gosa borehole rock samples 121
4.4.10 Th/U ratio in rock samples from Gosa borehole 124
4.4.11 Correlation of lothologic variations with the
activity concentrations of 238
U, 232
Th and
40
K in borehole layers at Gosa 124
4.4.12 Activity concentration of 238
U, 232
Th and
40
K in Lugbe borehole rock samples 126
4.4.13 Th/U ratio in rock samples from Lugbe borehole 129
4.4.14 Correlation of lothologic variations with the
activity concentrations of 238
U, 232
Th and
40
K in borehole layers at Lugbe 129
4.4.15 Comparison of activity concentration of 238
U,
232
Th and 40
K in subsurface rock samples from
Dei-Dei, Kubwa,Gosa and Lugbe boreholes 130
4.4.16 Comparison of Th/U ratio in rock samples from
Dei-Dei, Kubwa,Gosa and Lugbe boreholes 133
4.4.17 Comparison of activity concentration of 238
U,
232
Th and 40
K in topsoils from Dei-Dei, Kubwa,
Gosa and Lugbe boreholes 133
4.4.18 Comparison of activity concentration of 238
U,
232
Th and 40
K in subsurface rock samples from
Dei-Dei, Kubwa,Gosa and Lugbe and other
Countries 138
4.5 Geochemical characteristics of rock samples from Dei-Dei,
Kubwa,Gosa and Lugbe using X-ray fluorescence analysis 140
4.5.1 Interpretation of major oxides in Dei-Dei
borehole rock samples 140
4.5.2 Interpretation of major oxides in Kubwa
xi

borehole rock samples. 143
4.5.3 Interpretation of major oxides in Gosa borehole
rock samples. 144
4.5.4 Interpretation of major oxides in Lugbe borehole
rock samples. 145
4.6 Measurements of 238
U, 232
Th and 40
K in groundwater
samples from Dei-Dei, Kubwa, Gosa and Lugbe boreholes 146
4.6.1 Accumulation radionuclides (238
U) in humans and
recommendations for the maximum permissible
limit 150
4.6.2 Radiological risk assessment of 238
U in
groundwater from the study area 152
4.6.3 Chemical toxicity risk of 238
U in groundwater
from the study area 155
4.6.4 Elemental concentrations of water samples
from the study area 157
5 CONCLUSION AND FUTURE WORKS 160
5.1 Conclusion 160
5.2 Future work (recommendation) 162
REFERENCES 163
xii

LIST OF TABLES
TABLE NO. TITLE PAGE
2.1 Principal gamma ray emissions in the 238
U decay series 16
2.2 Principal gamma ray emissions in the 232
Th decay series 18
2.4 Concentrations of 238
U in groundwater from different
Countries 26
2.5 Concentrations of 226
Ra in groundwater from different
Countries 27
3.1 Depth and Lithologic unit of Dei-Dei Borehole 50
3.2 Depth and Lithologic unit of Kubwa Borehole 51
3.3 Depth and Lithologic unit of Gosa Borehole 52
3.4 Depth and Lithologic unit of Lugbe Borehole 53
3.5 The decay isotopes, gamma-ray energy and gamma disintegration 61
3.6 IAEA standard samples used in this study 63
3.7 Nuclides formed by neutron capture, Adams and Dam, (1969) 69
4.1 Summary of results obtained from Dei-Dei VES 81
4.2 Summary of results obtained from Kubwa VES 83
4.3 Summary of results obtained from Gosa VES 85
4.4 Summary of results obtained from Lugbe VES 87
4.5 Comparison between NAA and HPGe gamma ray spectrometry 108
4.6 Activity concentrations of 238
U, 232
Th (ppm); K (%) and
(Bq kg‒1
) in Dei-Dei borehole layers. 110
4.7 Correlation between the lithologic rock type and the activity
concentration of 238
U, 232
Th and 40
K (Bq kg‒1
) in Dei-Dei
borehole 114
xiii
4.8 Activity concentrations of 238
U, 232
Th (ppm); K (%) and
(Bq kg‒1
) in Kubwa borehole layers. 116
4.9 Correlation between the lithologic rock type and the activity
concentration of 238
U, 232
Th and 40
K (Bq kg‒1
) in Kubwa
borehole 120
4.10 Activity concentrations of 238
U, 232
Th (ppm), K (%) and
(Bq kg‒1
) in Gosa borehole layers 121
4.11 Correlation between the lithologic rock type and the activity
concentration of 238
U, 232
Th and 40
K (Bq kg‒1
) in Gosa
borehole. 125
4.12 Activity concentrations of 238
U, 232
Th (ppm), K (%) and
(Bq kg‒1
) in Lugbe borehole layers 126
4.13 Correlation between the lithologic rock type and the activity
concentration of 238
U,232
Th and 40
K (Bq kg‒1
) in Lugbe
borehole 130
4.14 Calculated dose rate, radium equivalent, external radiation
hazard and annual effective dose rate of the soil samples from
Dei-Dei, Kubwa, Gosa and Lugbe Abuja, Northcentral
Nigeria 136
4.15 Calculated dose rate, radium equivalent activity, external
radiation hazard and annual effective dose rate compared
with other studies 137
4.16 Summary of activity concentration of radioisotopes in topsoil
samples in Dei-Dei, Kubwa, Gosa and Lugbe boreholes in Abuja
and other parts of the World (UNSCEAR, 1998) 139
4.17 Mineral content (%) of different layer rock samples in Dei-Dei
Borehole 141
4.18 Mineral content (%) of different layer rock samples in Kubwa
borehole 143
4.19 Mineral content (%) of different layer rock sample in Gosa
borehole 144
4.20 Mineral content (%) of different layer rock samples in Lugbe
borehole 145
4.21 The borehole water samples, symbols and locations for ICP-MS
Analysis 146
xiv
4.22 Results of activity concentrations of 238
U in Dei-Dei, Kubwa,
Gosa, Lugbe,Water Board and hand dug well 148
4.23 Comparing the Annual Effective Dose of 238
U in the present study
and International Standard (WHO, 2003; ICRP 67 1993, ICRP 72
1996, National Research Council, Washinton D.C., 1999) 152
4.24 The estimated lifetime cancer mortality and morbidity risk of
uranium in the water samples 153
4.25 The estimated lifetime average daily dose (LADD) of uranium in
the water samples. 155
4.26 Results of elemental concentrations of water analysis in Dei-Dei,
Kubwa borehole, Water Board and hand-dug well and comparing
with EPA USA, 200.8 and Powel et al.,1989. 157
xv

LIST OF FIGURES
FIGURE NO TITLE PAGE
1.1 Flow chat of the scope of work and the structure of the study 8
2.1 Disintegration series of uranium-238 15
2.2 Disintegration series of thorium-232 17
2.3 Disequilibrium of 238
U decay series nuclides 23
2.4 The Typical example of confined and unconfined aquifers 30
2.5 Darcy's experiment 34
3.1 Geological map of Nigeria showing the position of Abuja 41
3.2 Schlumberger array of electrodes for resistivty Measurements 44
3.3 Campus omegaC2 Terrameter 45
3.4 Practical field work using campus omega C2 resistivity
for VES data acquisition 46
3.5 Drilling points at Dei-Dei, Kubwa , Gosa and Lugbe sites in
Abuja, Nigeria and the researcher collecting rock samples with
shovel 48
3.6 Ovum for drying the rock samples at nuclear laboratory, UTM 54
3.7 The rock sample crushing machine 55
3.8 Sieve shaker machine sieving crushed rock sample 56
3.9 The high pressure air flushing machine 57
3.10 Temporary plastic bottle containing each sieved rock sample 58
3.11 Setup of gamma spectrometer 61
3.12 Gama energy spectrums of isotopes of natural occurring
radionuclides 62
3.13 Block diagram of the HPGe detector spectrometer 62
3.14 Standard Sample (IAEA) for S-14 and SL-2 prepared for
xvi

gamma analysis 64
3.15 Prepared samples for gamma counting after 4 weeks secular
equilibrium 65
3.16 Block diagram of the bruker S4 pioneer (WDXRF) 71
3.17 complete setup of bruker Pioneer S4 WDXRF 71
3.18 Prepared rock and standard samples for X-ray analysis 72
3.19 Collection of borehole water samples, Water Board and hand
dug Well in the study area 73
3.20 The water samples collected from 4 boreholes, hand-dug
well and public water supply in Abuja, Nigeria. 74
3.21 Water samples prepared for ICP-MS analysis 75
3.22 The ICP-MS ELAN 9000 instrument 76
3.23 The conceptual model of radionuclides and water-rock interaction 77
4.1 1D profile plot of VES 2 of Dei-Dei Site 82
4.2 1D profile plot of VES 4 of Kubwa Site 84
4.3 1D profile plot of VES 1 of Gosa Site 86
4.4 1D profile plot of VES 3 Lugbe Site 88
4.5 2D cross-sections of interpreted VES depths across survey area 90
4.6 Lineament map draped on sillshaded SRTM-DEM image 92
4.7 Rose diagram showing the distribution of fracture 93
4.8 Lithological logs of representative boreholes drilled in Dei-Dei
and Gosa area of Abuja 95
4.9 Lithologic log of representative borehole drilled around Dei-Dei
area, 70 m 96
4.10 Lithologic log of representative borehole drilled around Kubwa
area, 60 m 97
4.11 Lithologic log of representative borehole drilled around Gosa
area, 50 m 98
4.12 Lithologic log of representative borehole drilled around Lugbe
area, 40 m 99
4.13 Modeling of groundwater flow in homogeneous isotropic
medium 100
4.14 Determination of hydraulic head, pressure head and hydraulic
gradient of the groundwater flowing across Dei-Dei to Kubwa. 104
xvii
4.15 Determination of hydraulic head, pressure head and hydraulic
gradient of the groundwater flowing across Lugbe to Gosa 106
4.16 Activity concentration of 238
U, 232Th
and 40
K versus sample ID
in Dei-Dei borehole, Abuja. 112
4.17 Activity concentration of 238
U, 232Th
and 40
K sample ID
in Kubwa borehole, Abuja. 117
4.18 Activity concentration of 238
U, 232Th
and 40
K versus sample ID
in Gosa borehole, Abuja 123
4.19 Activity concentration of 238
U,232
Th and 40
K versus sample
layers ID in Lugbe borehole, Abuja. 128
4.20 The activity concentration of 238
U,232
Th and 40
K in topsoils
of the four boreholes 134
xviii
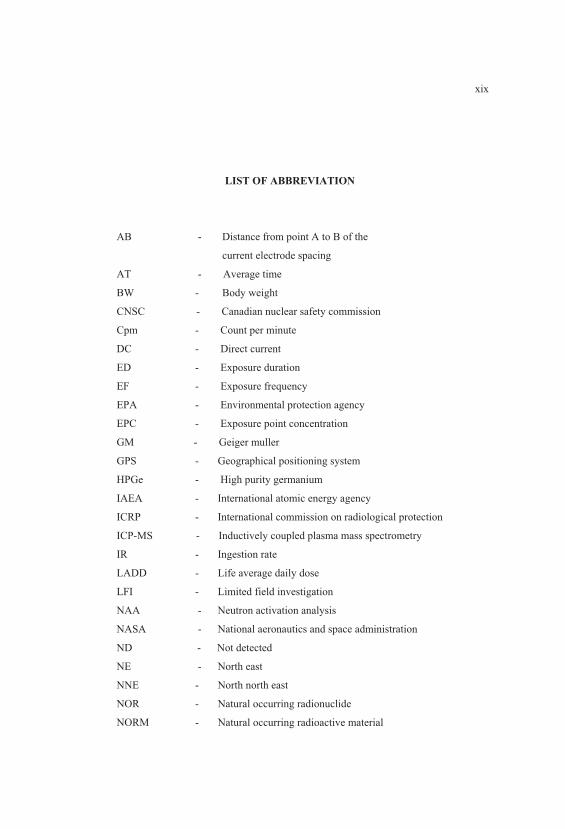
LIST OF ABBREVIATION
AB - Distance from point A to B of the
current electrode spacing
AT - Average time
BW - Body weight
CNSC - Canadian nuclear safety commission
Cpm - Count per minute
DC - Direct current
ED - Exposure duration
EF - Exposure frequency
EPA - Environmental protection agency
EPC - Exposure point concentration
GM - Geiger muller
GPS - Geographical positioning system
HPGe - High purity germanium
IAEA - International atomic energy agency
ICRP - International commission on radiological protection
ICP-MS - Inductively coupled plasma mass spectrometry
IR - Ingestion rate
LADD - Life average daily dose
LFI - Limited field investigation
NAA - Neutron activation analysis
NASA - National aeronautics and space administration
ND - Not detected
NE - North east
NNE - North north east
NOR - Natural occurring radionuclide
NORM - Natural occurring radioactive material
xix

NRC - Nuclear regulatory commission
MCA - Multi-channel analyzer
MNA - Malaysian nuclear agency
MDA - Minimum detectable activity
MINT - Malaysian institute of nuclear technology research
PPM - Parts per million
PPB - Parts per billion
PSI - Pound per square inch
QF - Quality factor
RAD - Radiation absorbed dose
REM - Roentgen equivalent man
REV - Representative elementary volume
RFD - Reference dose
SL - Site layer
SRTM - Shuttle radar topography mission
SRTM-DEM - Shuttle radar topographic mission-digital elevation model
SSW - South south west
STUK - Säteilyturvakeskus strålsäkerhetscentralen (radiation and
nuclear safety authority Finland)
SW - South West
TP - Technical procedure
UNFPA - United nations population fund
UNICEF - United nations internationl Children’s emergency fund
UNSCEAR - United nations scientific committee on the effect of
atomic radiation
U(IV) - Uranous
USSGS - US geological survey
VES - Vertical electrical sounding
X-SAR - X-band synthetic aperture radar
SI - International system of units
WHO - World health organisation
WSW-ENE - West South West- East North East
XRF - X-ray fluorescence
xx

LIST OF SYMBOLES
m - Sample mean
M - Molecular weight
Mg - Magnesium
Al2O3 - Aluminium oxide
As - Arsenic
Asamp - The specific activity concentration of sample
Astd - The specific activity concentration of the standard
sample
BqL-1
- Becquerel per litre
CaO - Calcium oxide
CaCO2 - Calcium carbonates (calcite)
Cd - Cadmium
Co - Cobalt
CO32-
- Carbonate
Cr - Chromium
Csamp - Concentration of sample
Cstd
- Concentration of the standard sample
EBE - Binding energy
Ee - Kinetic energy
Eh - Oxidation potential
Eγ - Gamma energy
F - Fluoride
Fe2O3 - Iron oxide
K - Potassium
KCl - Potassium chloride
K2O - Potasium oxide
xxi

Mg - Magnesium
MgO - Magnesium oxide
MnO - Manganese oxide
n- - n-doped material
N - Number of atoms
Na2O - Sodium oxide
Ni - Nickel
Nsamp - Net count of photopeak area of sample collected
Nstd - Net counts of photopeak area of the standard sample
P+ - P-doped material
P2O5 - Phosphorus oxide
pH - Potential hydrogen
Pb - Lead
Pb(OH)+ - Lead hydroxide
Pb(OH)2 - Lead (II) hydroxide
P0 - Polonium
� - Lifetime cancer risk
R - Roentgen
SiO2 - Silicon oxide
SO4 - Tetraoxosulphate (VI)
Td - Decay time
Th - Thorium
TiO2 - Titanium oxide
u - Atomic mass unit
U - Uranium
U22+
- Uranyl
U3O8 - Uranium trioxide
U4+
- Uranous
UO2 - Uraninite
Wsamp - The weight of the sample collected
Wstd - The weight of the standard sample
Zn - zinc
ZnSO4 - Zinc sulphate
xxii
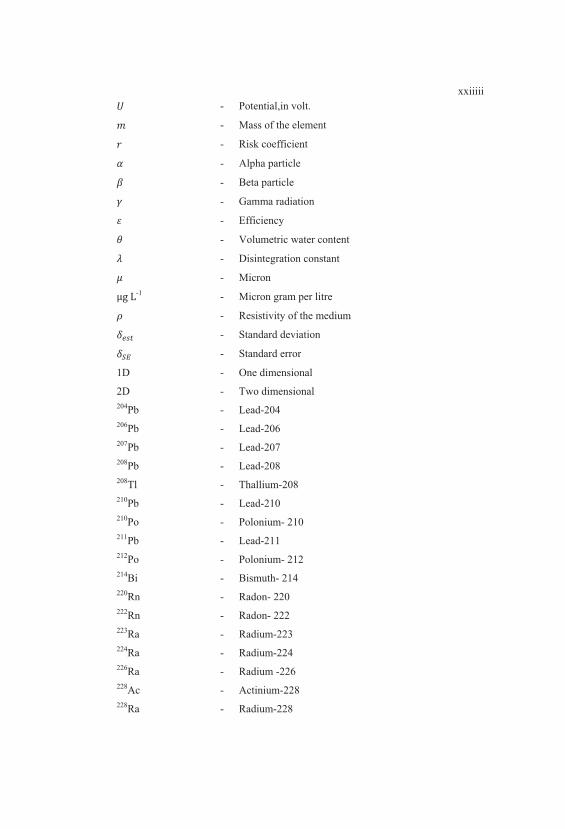
� - Potential,in volt.
� - Mass of the element
� - Risk coefficient
� - Alpha particle
� - Beta particle
� - Gamma radiation
- Efficiency
- Volumetric water content
� - Disintegration constant
� - Micron
���-1 - Micron gram per litre
� - Resistivity of the medium
���� - Standard deviation
��� - Standard error
1D - One dimensional
2D - Two dimensional
204Pb - Lead-204
206Pb - Lead-206
207Pb - Lead-207
208Pb - Lead-208
208Tl - Thallium-208
210Pb - Lead-210
210Po - Polonium- 210
211Pb - Lead-211
212Po
- Polonium- 212
214Bi
- Bismuth- 214
220Rn
- Radon- 220
222Rn
- Radon- 222
223Ra - Radium-223
224Ra - Radium-224
226Ra - Radium -226
228Ac - Actinium-228
228Ra - Radium-228
xxiiiii

233Pa - Protactinium- 233
234U - Uranium- 234
235U - Uranium- 235
236U - Uranium-236
238U - Uranium -238
pH - Neptunium- 239
40K - Potassium- 40
xxiv

LIST OF APPENDICES
APPENDIX TITLE PAGE
A Accessibility map of the study locations of Dei-Dei,
Kubwa, Gosa and Lugbe showing positions of VES
points for borehole locations in Abuja, North central
Nigeria 177
B Geological map of the study area (top) with
schematic cross section (bottom) showing
the rock types and the cross section of where
the boreholes were drilled. 178
C 88-lineament SRTM data extracted for the structural
map of the study. 179
D Calculations of 238
U, 232
Th concentrations in S-14 and
40K concentrations in SL-2 standard sample used for this
study 181
E The concentration of uranium and thorium was
calculated using thefollowing formula 183
F Mathematical Model of Groundwater Flow
in Homogeneous Isotropic Medium 185
G Minimum Detectable Activity for Radioactivity
Concentrations Using HPGe Spectrometry and NAA 189
H List of publications 193
xxvi


CHAPTER 1
INTRODUCTION
1.1 Introduction
Ionizing radiation in natural environment was discovered in 1899 and it is
said to originate from radioactivity in environmental materials like rivers, ground
waters, soils and rocks (Lowder, 1990). The natural radionuclides, 238
U, 232
Th and
40K are present in the earth crust (Evans, 1969). Humans are usually exposed to some
natural background radiations which are the naturally occurring radioactive material
(NORM) (U.S. EPA, 1993). The presence of these (NORM) in soil, rocks, water, and
air, alongside the cosmic radiation result in continuous and unavoidable internal and
external radiation exposures of humans (UNSCEAR, 2000). The NORM in the earth
and water of an environment mainly occur as progeny of 238
U, 235
U and 232
Th
isotopes which are distributed by natural geological and geochemical processes in
addition to potassium 40
K and small quantities of fission-product residues such as
137Cs from atmospheric weapon tests (Trimble, 1968). In many countries, extensive
work has been carried out to evaluate the risks associated with NORM (NRC,1999;
UNSCEAR, 2000). Thus, it has been established that the specific levels of terrestrial
environmental radiation are related to the geological composition of each
lithologically separated area, and to the content of 238
U, 232
Th and 40
K in the rock
from which soils originate in each area (Abd El-mageed et al., 2011; Maxwell et al.,
2013a; Tzortzis and Tsertos, 2004; UNSCEAR, 2000; Xinwei and Xiaolon, 2008).
2
Uranium occurs as a trace element in the earth’s crust and is typically present
in the concentration of 1-10 ppm in granite and in clastic sediments of granitic origin
and thorium is typically present in concentrations ranging between 3 and 30 ppm in
crustal minerals. The average concentration of potassium in crustal rocks is
approximately 2.5% with a range from 0.1% to 5% or more On the other hand,
thorium occurs mostly in sediment (IAEA, 1989).
In 2006, limited field investigation (LFI) involving uranium in the subsurface
at the Hanford Site’s 300 Area in Washington, yielded unexpectedly high
concentrations of uranium in groundwater samples collected at two of the four
characterization boreholes (Williams et al., 2007). The samples were obtained during
drilling and came from stratigraphic intervals in the unconfined aquifer that is not
monitored by the existing well network. The occurrences appeared to be restricted to
an interval of relatively finer-grained sediment within the Ring old Formation. A
subsequent investigation was carried out which involved drilling and characterization
activities at four new locations near the initial discovery. This report presents the
fresh information obtained since the LFI characterization report (Williams et al.,
2007) regarding uranium contamination beneath the 300 Area (Peterson et al., 2008).
It was estimated that approximately 650,000 m3 of groundwater beneath the 300 area
investigated are affected by uranium at concentrations that exceed the drinking water
standard of 30 μg L‒1
.
Naturally occurring radionuclides are manly from three different decay chains
(235
U, 238
U and 232
Th). One of the longest-lived nuclides is 232
Th with a half-life of
1.405 x 10¹⁰
years. 236
U was the immediate parent of 232
Th with a life of 2.342 x 10⁷
years thus is not found in the environment anymore and 238
U refers to the second
longest series. 99.2745% by weight of 238
U, 0.7200% of 235
U, and 0.0055% of 234
U
are the estimated naturally occurring uranium (Pfennig et al., 1998).
The activity concentrations of 238
U, 232
Th and 40
K in groundwater are
connected to the activity concentrations of 238
U and 232
Th of aquifer bearing
formation, and their decay products in subsurface rock formation. This occurs as a
result of reactions between groundwater, soil and bedrock which release quantities of
3
dissolved mineral components depending on the mineralogical and geochemical
composition of the rock formation (IAEA, 1990; Langmuir, 1978). It also depends on
the chemical composition of the water, degree of weathering of the subsurface rock
formation, redox conditions and the residence time of groundwater in subsurface
water bearing formation, (Durrance, 1986). 238
U and 232
Th decay series in soils,
bedrocks and groundwater system is controlled by the chemical substances,
radioactive decay and surrounding physical factors. As a result of these controlled
processes, the radioactive elements either leach into the groundwater or to the
surrounding, resulting into decay series of disequilibrium of nuclides (Durrance,
1986).
In Nigeria, NORM levels have been studied in surface soils in Ijero-Ekiti
(Ajayi et al., 1995), in soil and water around Cement Company in Ewekoro (Jibiri et
al., 1999) and in rocks found in Ekiti (Ajayi and Ajayi, 1999). Only insignificant
levels of NORM were identified by (Ajayi et al., 1995). The health risks to human
are real which is not defined in this geological condition. The activity concentration
of these radionuclides is yet to be defined in the environment and no epidemiological
studies to quantify the risk from all natural radionuclides in drinking water.
In this study, the main emphasis is to determine the risk areas in subsurface
structures (lithology) and to examine activity levels of naturally occurring
radionuclides in different raw water sources at Dei-Dei, Kubwa, Gosa, and Lugbe
boreholes in order to evaluate the exposure to the inhabitants in the area. The study
areas are bounded by latitudes 8o 53`N - 9
o 13`N and longitudes 7
o 00`E - 7
o 30` E.
The borehole points are in the coordinates lat: 9o 6’52”N and long: 7
o 15’39”E (Dei-
Dei), lat: 9o 6’ 16.7” N and long: 7
o 16’ 26.0”E (Kubwa), lat: 8
o 56’ 45.6” N and
long: 7o 13’ 26.2” E (Gosa) and lat: 8
o 59’ 2.3” N and long: 7
o 23’ 7.8”E (Lugbe).

4
1.2 Problem Statement
In Nigeria, the case for conjunctive use of surface and groundwater supply,
where available, to meet the ever increasing demand cannot be over-emphasized.
However, relating the available resources to demand, the population finds it difficult
to access quality water for consumption. Nigeria has been ranked the third in world’s
poorest countries in gaining access to water and sanitation according to World Health
Organization report 2012. A report from (Godknows, 2012) noted that the World
Health organization and UNICEF ranked Nigeria third behind China and India, in
countries with largest population without adequate water and sanitation. The study
area (Abuja) had a master plan in 1979 which projected population in the region to
be 5.8 million people by 2026. The recent population of Abuja is 2, 759,829 at 2013
and the most recent is 3,028,807 at 2014 report (UNIFPA, 2014).
The Water Board has a designed capacity with the pre-plan which is not in
phase with the city growth in the recent time. The increase in demand for water has
led to compulsory alternative sources to defray the deficit. Majority of the public
water supplies come from the borehole of reasonable depths. The water has been
consumed without treatment and during drilling processes it cuts across so many
rock formations. The radioelement exists in this rock formation like granite to some
extent could contaminate the groundwater system through leaching and weathering
processes. The natural radioactivity of ground water is derived primarily from
radioactive rocks, soil and mineral with which the water has been in contact. There
are three naturally radioactive elements: the uranium series, the thorium series and
potassium-40.
The ground water is not considered acceptable to the public, organism and
plantation if activity concentration value exceeds 1 Bq L‒1
as recommended by IAEA
and Annual effective dose exceeds 1 mSv y‒1
as suggested by World Health
Organisation (WHO, 2008). As a result, most of the public in the satellite towns and
suburbs are not aware of the potential problems associated with aquifer bearing rocks
constituting radioactive elements. In the same way, it leaches into the groundwater
through chemical weathering and physical processes which is being consumed daily
5
by the public. The study of these radionuclides in groundwater of the suburbs of
Abuja has become important because many residents of the area embark on the
development of private boreholes without the knowledge of the health risk associated
with the naturally occurring radionuclides.
1.3 Research Objectives
The primary aim of this work is to gather new information on the occurrence
of natural radioactivity in groundwater based drinking water and to reduce the
radiation exposure to Abuja inhabitants. In order to achieve this aim, the objectives
of this work are
1. To investigate the depth to aquifer bearing formation and the subsurface
structures that controls the groundwater system using Vertical Electrical
Sounding (VES) and Shuttle Radar Topography Mission (SRTM).
2. To determine the activity concentration of 238
U, 232
Th and 40
K in different
layers of the subsurface lithology so as to infer the source rock that poses
higher activity level.
3. To determine the corresponding geologic rock type that attributes such high
level of natural radionuclides so as to set a baseline that will help geologists
and hydrologists in groundwater resources on basement terrain areas how to
drill hydrogeologically motivated boreholes in safer aquifer bearing
formations for public consumption.
4. To investigate the occurrence of 238
U and toxic elements in groundwater and
to obtain representative estimates of the effective dose to borehole users
(private wells) in the study area.

6
1.4 Research Scope
The first part of the study was to determine the suitable sites for groundwater
bearing formation (aquifer) at Dei-Dei, 70 m, Kubwa, 60 m, Gosa, 50 m and Lugbe,
40 m in Abuja, Northcentral Nigeria using Vertical Electrical Sounding (VES)
integrated with 88 lineaments (fractures) extracted from Hill-shaded Shuttle Radar
Topography Mission (SRTM) data.
Secondly, the comparison of activity concentrations of 238
U, 232
Th and 40
K in
different layers of subsurface structures in the study area were determined such as to
trace the source rock that constitute higher activity concentrations of 238
U, 232
Th and
40K.
Thirdly, the rock layers with the highest activity level and geological type
that contributed such high level of radionuclides in subsurface formation.
Finally, determination of activity concentrations of 238
U, 232
Th and 40
K in
groundwater to estimate the exposure to the inhabitants of Abuja people who rely on
groundwater based drinking water for consumption. Its purpose was to evaluate the
suitability of different sites as locations for obtaining groundwater for consumption.
The scope of this work described in Figure 1.1 shows how radionuclides from
the environment, soil, bedrock are being transferred to human through groundwater
source from reasonable depths of varying rock formation to the aquiferous zone
(groundwater host rock) below ground level. The exposure is by ingesting the water
that comes from such formation with high dissolved uranium, thorium and potassium
rich minerals due to water-rock interactions. The movements across the fractured
zones through the recharging channels that supply the water to the aquifer are to be
evaluated for the contamination level of the radionuclides to the inhabitants.

7
The scope of this study presented in a flowchart with structure of the study
discussed in Figure 1.1 has two segments:
1. The first segment describes the occurance of radionuclides and the exposure
to Abuja people.
2. The second part discussed the structure of the study to attain the purpose of
this work.

8
__________________________________________________________________________
Figure 1.1 The flowchart of the Scope of work and the Structure of the
study
Determination of Activity
Concentration of 238U and toxic
elements in groundwater-based
drinking water
Geophysical Survey (vertical Electrical Sounding-
VES) to evaluate the lithological variation and depth
to ground water location/Integration of VES and data
extracted from Shuttle Radar Topography Mission
(SRTM) to map the lineament and structures that
control the groundwater system
Comparison of activity
concentrations of 238U, 232Th and 40K
in subsurface structures of Dei-Dei
and Kubwa Abuja, to determine the
layer that constitutes higher activity
level and the rock type.
STRUCTURE OF THIS STUTDY
Dose rate/Exposure to
Abuja People
Measurement of 238U, 232Th and 40K in
Boreholes rock
samples from Gosa
and Lugbe so as to
determine the geologic
type that poses higher
activity level and its
relationship with
granitic intrusions
OCCURENCE
RESTRICTED
Natural Radionuclides in the
Environment, Soil, Bedrock and
Ground water
Transfer of Natural Radionuclides to
drinking water
Ingestion of
Drinking
WaterEXPOSURE
OCCURENCE

9
1.5 Significance of the Study
1. The identification of radioactive source rock that constitute higher activity
concentrations of 238
U, 232
Th and 40
K in subsurface layers will assist
professionals in hydrogeology and water resources management: civil
engineers, environmental engineers, geologists and hydrologists who are
engaged in the investigation, management, and protection of groundwater
resources on areas to drill boreholes for the safety of the inhabitants who rely
on groundwater based drinking water for consumption.
2. It will identify the occurrence of radionuclides in groundwater and obtain
representative estimate for the effective dose to the users of private wells in
Abuja caused by 238
U, 232
Th and 40
K.
3. It will equally reveal the geologic conditions that will help to monitor the
activity levels in groundwater by Geophysicists/Geochemists such as
geologic rock units, weathering, chemical complexation and oxidations.
4. Importantly, to serve as guidance for the water resources management and
effective utilization in Abuja.
5. Furthermore, this study contributes significant and general information on
baseline to the people of Abuja on their groundwater consumption status.

10
1. 6 Research Hypotheses:
H1 = alternative hypothesis
� The layers with high metamorphosed granitic intrusion will report higher
activity concentration of 238
U, 232
Th, and 40
K.
� The layers that are highly fractured and techtonized will be noted higher,
which will be attributed to oxidation of uranium in aqueous phase.
Ho = null hypothesis
� Granitic intrusion has no effect on activity concentration of 238
U, 232
Th
and 40
K.
� There will be no difference in Th/U ratio in different layers
� The 238
U and 232
Th activity does not increase with acidity of soil/rock
� Weathering and metamorphism do not modify the 238
U, 232
Th and 40
K to
readily leach from pegimatite and granites and redeposit in sediment at
large distance from the source rocks.
� Weathering does not have impact in decreasing the Th/U ratio.
1.7 Thesis Organization
This thesis consists of five chapters. Chapter 1 presents the introduction of
the natural occurring radionuclides; problem statement; objectives of the study;
scope of the study; significance of the study; Research hypothesis and development
of conceptual model.
11
Chapter 2 involves a literature review of geophysical methods for
groundwater investigation, radioactive study and radioactivity, natural occurring
radionuclides in groundwater, natural occurring radionuclides in Nigeria,
Groundwater flow concept, groundwater formation in Nigeria. Chapter 3 discusses
the instrumentation for geophysical data acquisition and methods, groundwater flow
model, methodology and calculations of elemental concentrations using comparison
method for gamma spectrometry including HPGe detector and experimental
procedures, methods and calculations for neutron activation analysis, geochemical
characterization method using XRF, method of water analysis using inductively
coupled plasma spectrometry (ICP-MS). Chapter 4 covers the results for geophysical
interpretation, comparison of NAA and direct method (gamma ray spectrometry
using HPGe detector), determination of elemental concentrations of 238
U, 232
Th and
40K in (ppm) and Bq kg
‒1 in studied samples and interpretations, geochemical
characterization and interpretation of the mineral contents in the rock sample
obtained in the four boreholes in the study area, interpretation of ICP-MS results for
both groundwater samples from the same four boreholes and Water Board from the
study area . Chapter 5 summarized the conclusion of the research work and
suggestions.

12
CHAPTER 2
LITERATURE REVIEW
2.1 Introduction
The aim of this chapter is to review the methods and theoretical principles
upon which the present work depends on and according to the objectives of the work.
2.2 Radioactive Studies
Some naturally occurring substances consist of nuclei which makes them
unstable. Thus, these substances spontaneously transform into more stable product
atoms. They are said to be radioactive and the transformation process is known as
radioactive decay. The first investigation of uranium salt in 1896 observed the
blackening of photographic emulsion in the vicinity of uranium compound. This was
subsequently attributed to radiation being emitted by uranium. Radioactive decay is
usually accompanied by the nuclear radiation emission of charged particles, alpha,
beta and gamma rays which are denoted by the Greek letters alpha (α), beta (β) and
gamma (γ).
13
2.2.1 Radioactivity
The activity of radioisotope source is defined as its rate of decay.
Radioactive isotope emits radiation and therefore its activity will decrease as the time
passes. The radiation emitted can be either alpha-, beta- or gamma- radiation, and a
given source may emit radiation of more than one type in its decay process to a
stable isotope. It is important to note that this decay is a completely random process.
During radioactive decay, the mass of the sample will decrease, due to the emission
of alpha- or beta-particle, but the total number of atoms will remain constant.
Gamma-emission takes place from an excited nucleus with no change of nucleon or
proton number. Alpha-emission reduces the nucleon number by four and the proton
number by two. Beta-emission leaves the nucleon number unchanged but increases
or decreases the proton number by one.
2.3 Natural Radioelements
This section reviews basic radiation geophysics, discussing briefly the
primary natural radioelements of potassium, uranium and thorium.
2.3.1 Potassium (K)
Potassium is a radioelement by virtue of the radioactive 40
K isotope which
has an abundance of 0.012 % in natural potassium. The gamma rays from the 40
K are
monoenergetic with energy of 1461 keV and are emitted at a rate of 3.3 quanta s‒1
kg
‒1. In crustal materials, potassium is carried by the feldspar orthoclase (K feldspar),
the muscovite and biotite micas, and the clay mineral illites. The average
concentration of potassium in crustal rocks is approximately 2.5 % potassium with a

14
range from 0.1 to 5 % or more. Pure quartz sand, limestone, or serpentinized
ultramafic rock is material of particularly low potassium content, (IAEA, 1989).
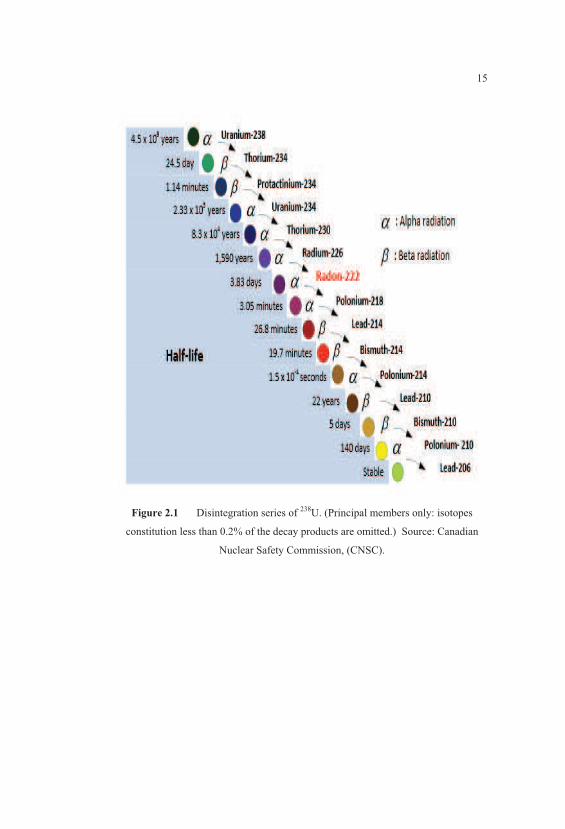
2.3.2 Uranium (U)
Uranium is an element comprised of three radioactive isotopes of mass
number 238, 235 and 234. 238
U (99.3% abundance) and 235
U (0.7% abundance) are
primaeval nuclides which are transformed into stable lead isotopes through
successive alpha and beta decays. 234
U (< 0.01% abundance) is intermediate
radionuclide in the decay series formed by 238
U. The disintegration series of 238
U is
shown in Figure 2.1.
One gram of uranium is an indirect source of almost 50 000 photon emissions
per second of which over 90 % originate from the 238
U decay series. Nearly two
thirds of the 238
U photons are gamma rays with energies of between 242 and 2448
keV. They are principally emitted by two decaying uranium daughter nuclei, 214
Pb
and 214
Bi (Table 2.1). About one third of the 238
U photons are X and gamma rays
with energies of less than 100 keV. A small contribution to the uranium decay series
includes gamma rays with energy of 185.7 keV, emitted by 235
U. Uranium occurs as
a trace element in the earth’s crust and is typically present in concentrations of 1 to
10 ppm in granite and in clastic sediments of granitic origin. In oxidizing
environments, uranium forms the hexavalent uranyl ion which may be transported by
groundwater and redeposited in sediments with a content of organic material, (IAEA,
1989).
15
Figure 2.1 Disintegration series of 238
U. (Principal members only: isotopes
constitution less than 0.2% of the decay products are omitted.) Source: Canadian
Nuclear Safety Commission, (CNSC).
16
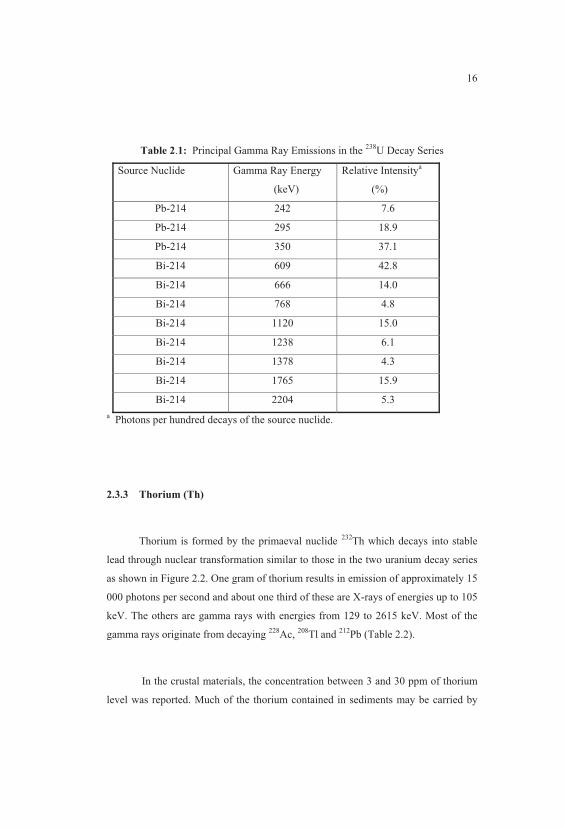
Table 2.1: Principal Gamma Ray Emissions in the 238
U Decay Series
Source Nuclide Gamma Ray Energy
(keV)
Relative Intensitya
(%)
Pb-214 242 7.6
Pb-214 295 18.9
Pb-214 350 37.1
Bi-214 609 42.8
Bi-214 666 14.0
Bi-214 768 4.8
Bi-214 1120 15.0
Bi-214 1238 6.1
Bi-214 1378 4.3
Bi-214 1765 15.9
Bi-214 2204 5.3
aPhotons per hundred decays of the source nuclide.
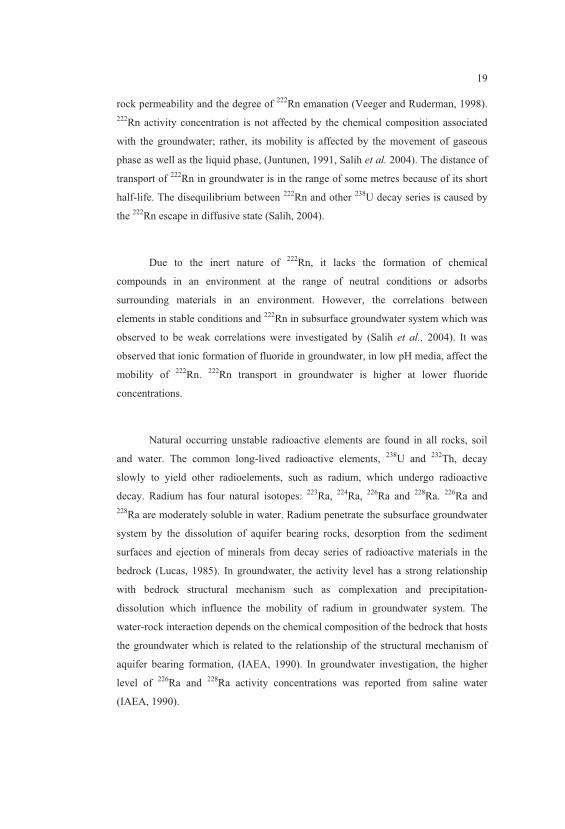
2.3.3 Thorium (Th)
Thorium is formed by the primaeval nuclide 232
Th which decays into stable
lead through nuclear transformation similar to those in the two uranium decay series
as shown in Figure 2.2. One gram of thorium results in emission of approximately 15
000 photons per second and about one third of these are X-rays of energies up to 105
keV. The others are gamma rays with energies from 129 to 2615 keV. Most of the
gamma rays originate from decaying 228
Ac,208
Tl and 212
Pb (Table 2.2).
In the crustal materials, the concentration between 3 and 30 ppm of thorium
level was reported. Much of the thorium contained in sediments may be carried by
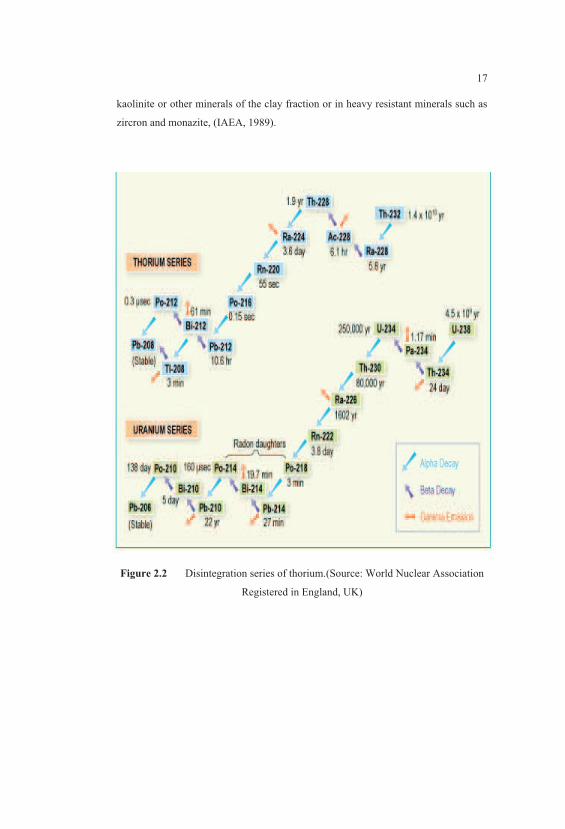
17
kaolinite or other minerals of the clay fraction or in heavy resistant minerals such as
zircron and monazite, (IAEA, 1989).
Figure 2.2 Disintegration series of thorium.(Source: World Nuclear Association
Registered in England, UK)
18
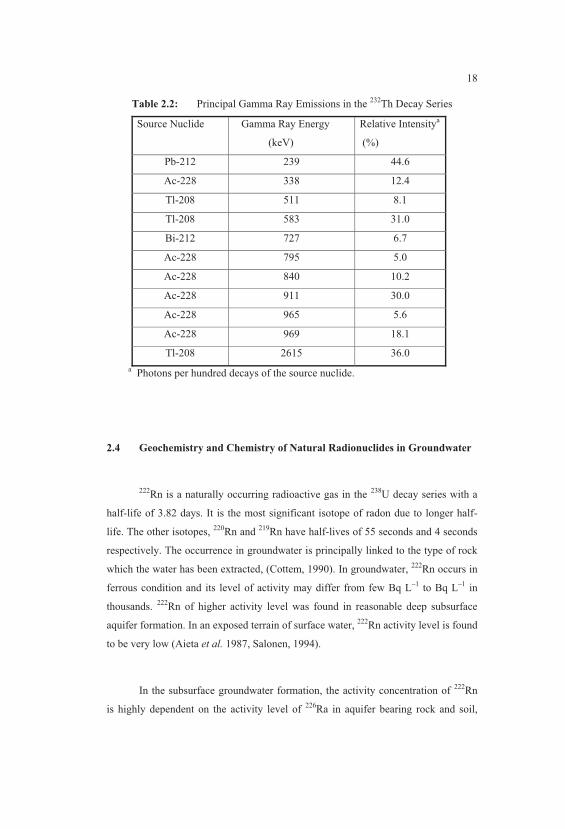
Table 2.2: Principal Gamma Ray Emissions in the 232
Th Decay Series
Source Nuclide Gamma Ray Energy
(keV)
Relative Intensitya
(%)
Pb-212 239 44.6
Ac-228 338 12.4
Tl-208 511 8.1
Tl-208 583 31.0
Bi-212 727 6.7
Ac-228 795 5.0
Ac-228 840 10.2
Ac-228 911 30.0
Ac-228 965 5.6
Ac-228 969 18.1
Tl-208 2615 36.0
a Photons per hundred decays of the source nuclide.
2.4 Geochemistry and Chemistry of Natural Radionuclides in Groundwater
222Rn is a naturally occurring radioactive gas in the
238U decay series with a
half-life of 3.82 days. It is the most significant isotope of radon due to longer half-
life. The other isotopes, 220
Rn and 219
Rn have half-lives of 55 seconds and 4 seconds
respectively. The occurrence in groundwater is principally linked to the type of rock
which the water has been extracted, (Cottem, 1990). In groundwater, 222
Rn occurs in
ferrous condition and its level of activity may differ from few Bq L‒1
to Bq L‒1
in
thousands. 222
Rn of higher activity level was found in reasonable deep subsurface
aquifer formation. In an exposed terrain of surface water, 222
Rn activity level is found
to be very low (Aieta et al. 1987, Salonen, 1994).
In the subsurface groundwater formation, the activity concentration of 222
Rn
is highly dependent on the activity level of 226
Ra in aquifer bearing rock and soil,
19
rock permeability and the degree of 222
Rn emanation (Veeger and Ruderman, 1998).
222Rn activity concentration is not affected by the chemical composition associated
with the groundwater; rather, its mobility is affected by the movement of gaseous
phase as well as the liquid phase, (Juntunen, 1991, Salih et al. 2004). The distance of
transport of 222
Rn in groundwater is in the range of some metres because of its short
half-life. The disequilibrium between 222
Rn and other 238
U decay series is caused by
the 222
Rn escape in diffusive state (Salih, 2004).
Due to the inert nature of 222
Rn, it lacks the formation of chemical
compounds in an environment at the range of neutral conditions or adsorbs
surrounding materials in an environment. However, the correlations between
elements in stable conditions and 222
Rn in subsurface groundwater system which was
observed to be weak correlations were investigated by (Salih et al., 2004). It was
observed that ionic formation of fluoride in groundwater, in low pH media, affect the
mobility of 222
Rn. 222
Rn transport in groundwater is higher at lower fluoride
concentrations.
Natural occurring unstable radioactive elements are found in all rocks, soil
and water. The common long-lived radioactive elements, 238
U and 232
Th, decay
slowly to yield other radioelements, such as radium, which undergo radioactive
decay. Radium has four natural isotopes: 223
Ra, 224
Ra, 226
Ra and 228
Ra. 226
Ra and
228Ra are moderately soluble in water. Radium penetrate the subsurface groundwater
system by the dissolution of aquifer bearing rocks, desorption from the sediment
surfaces and ejection of minerals from decay series of radioactive materials in the
bedrock (Lucas, 1985). In groundwater, the activity level has a strong relationship
with bedrock structural mechanism such as complexation and precipitation-
dissolution which influence the mobility of radium in groundwater system. The
water-rock interaction depends on the chemical composition of the bedrock that hosts
the groundwater which is related to the relationship of the structural mechanism of
aquifer bearing formation, (IAEA, 1990). In groundwater investigation, the higher
level of 226
Ra and 228
Ra activity concentrations was reported from saline water
(IAEA, 1990).

20
Saline waters with low movement, radium occurs as uncomplexed Ra2+
cations. Weak complexes which may be caused by sulphate and carbonate anions are
likely to be found in water that the salinity is very low and has no influence on the
mobility of radium. The most abundant isotopes of radium are 226
Ra and 228
Ra with
half-lives of 1600 years and 5.8 years, respectively. In low saline groundwater, the
ratio of 226
Ra to 228
Ra is widely varied. In the previous report, values from 0.07 to 41
were noted. In saline water, the ratio of 226
Ra to 228
Ra ranges from 0.44 to 4 were
reported in previous work elsewhere which was observed to be lower than the ratio
226Ra to
228Ra in low saline water, (IAEA, 1990). Natural occurring radium has been
observed at high activity level in groundwater from two reasonable deep aquifers
underlying northern Illinoise used for public water supply and was attributed to the
dissolution of aquifer bearing rocks, desorption from the sediment surfaces and
ejection of minerals from decay series of radioactive materials in the bedrock (Lucas,
1985).
238U and
234U are the most predominant form of uranium in groundwater
system. Aieta et al., (1987) reported that due to little abundance of 235
U in earth’s
crust, it occurs in low concentration in groundwater. The oxidation states of uranium
are +III, +IV, +V and +VI of which +IV or +VI state occur in groundwater in as a
result of water rock interaction. Langmuir (1978) noted that the level of activity
concentration in aquifer bearing rock determines the activity concentration in
groundwater and other proximity of uranium-riche aquifer materials, the oxidation
and potential hydrogen ions (pH) state of uranium. Other factors such as the presence
of fluoride and carbonate coupled with other species like phosphate concentrations
can form insoluble minerals or complexes uranium. The activity level of 238
U in
groundwater is influenced by the hydroxides of manganese and iron and high
sorption properties of organic constituents found in water.
Groundwater with pH less than neutral and oxygen deficient, the 238
U is much
better stable in the form of +IV uranous (U4+
) than +VI in oxidized condition of
uranyl, (UO22+
). Durrance (1986) reported that uranous species oxidizes to be in
soluble form of uranyl species under the condition of oxidation to +VI.
21
Langmuir (1978) noted that 238
U chemically immobile in the +IV state. It was
as a result of the precipitation in a wide range of natural condition. 238
U transport is
increased in orders of magnitude in oxidized form of hexavalent state which could be
the less soluble nature of uranous species than the uranyl species. However, the
complexes of uranyl in the state of natural oxidized form are stable than the uranous
conditions of complexes natural condition especially in groundwater system with
more of organic matter.
The mineral content of 238
U in the host rock located in subsurface formation
determines its solubility. Langmuir (1978) reported that 238
U found in rock mineral
like uraninite (UO2) or calcite (CaCO2), in a normal condition, there are possibilities
of leaching from the host rock into the groundwater system. It was found that the
oxidation and leaching of 238
U increases in the present of carbonate which forms
complexes of stable uranyl (Hostetler and Garrels, 1962).
Langmuir (1978) noted that uranium always form complex in groundwater
with the dominant species in the oxidation (redox) potential and the activity of
potential hydrogen ion (pH). Uranium complexing with organic matter are being
studied. Crancon and Lee (2003) observed that fulvic and humic acids are the most
essential ligands in natural condition, noted that uranium transports and precipitates
in groundwater in these acids solute. Ivanovich and Harmon (1982) reported that
humic and fulvic acids varies according to pH with the degree of ionization as well
as the formation of uranium complexes which depends on pH of the groundwater
system. Under acid condition, organic materials in groundwater plays essential role
in the adsorption of uranium in subsurface water-rock interaction, (Lee, 2003; Silva
and Nitshe, 1995).

22
2.4.1 Disequilibrium of Radioactivity in Groundwater
Durrance (1986) noted that238
U and 232
Th decay series in soils, bedrocks and
groundwater system is controlled by the chemical substances, radioactive decay and
surrounding physical factors. As a result of these controlled processes, the
radioactive element either leach into the groundwater or to the surrounding, resulting
into decay series of disequilibrium of nuclides as shown in Figure 2.3. Ivanovich and
Harmon (1982) reported that some daughter nuclides of 238
U and 232
Th have short
half-life to be fractioned from the parent nuclides. 222
Rn for instance, has short-lived
daughters. 210
Pb may be at equilibrium with the progenitor, 226
Ra if 222
Rn is found to
be negligible in diffusion. A radioactive process of secular equilibrium occurs when
the process of the system is not interfered with. In such condition of equilibrium, the
parent nuclides activity concentration and its daughter nuclides activity are equal,
which reduces with the half-life of the source nuclides (parent).

23
Figure 2.3 Disequilibrium of 238
U decay series nuclides. It indicates that the
concentration is higher in solid phase (rock minerals) than liquid phase
(groundwater), the migration of solid phase of the daughter nuclides to the liquid
phase is the direction of the movements (Durrance 1986, Ivanovich and Harmon,
1982).
In subsurface aquifer bearing formation, there is interaction between the soil,
aquifer rock materials and groundwater. Von Gunten and Benes (1995) reported that
since there is interaction between the water and the bedrock interface, the
possibilities of radionuclides leaching into the groundwater system by desorption and
24
dissolution or even erosion means or by radioactive decay atomic recoil is likely to
take place. In groundwater system, elemental particles and radioactive isotopic
disequilibrium occur within uranium- and thorium- series nuclides which were found
to be greatest in deep groundwaters, such as boreholes with reasonable depths. The
chemical and physical characteristics of the nuclides in boreholes were the reasons
for the disequilibrium in groundwater which complexes the nuclides and cause them
to be mobile when dissolved in water, (Salonen and Huikuri, 2002).
In the subsurface formation, Durrance (1986) reported that the measured
activity concentrations of isotopes of 238
U and 234
U are equal. Ivanovich and Harmon
(1982) noted that the activity level of 234
U almost greater than the 238
U activity
concentration in groundwater. Salonem and Huikuri (2002) discovered that the ratio
of 234
U to 238
U in subsurface drilled well in Finnish was 2 with a range of 1-3 at
confidence level of 95 %. The lower activity concentration of 234
U and 238
U results in
higher activity ratio in groundwater. Ivanovich and Harmon, 1982, reported the
higher activity ratio of 234
U to 238U in groundwater to be about 30.
Durrance (1986) reported that in igneous rock formation, the occurrence of
uranium is in undissolved state of +IV, which could be oxidized to form +VI, with a
multiple magnitude order in soluble form than uranium in the form of +IV state. In
this process, 234
Th may interact with atoms of oxygen due to alpha recoil and
generate oxygen radicals in 234
U contents in oxygen-rich rock formation and get the
uranium content in the formation oxidized. The considering of 232
Th fractions in
chemical composition is not an important mechanism, (Suksi 2001).
2.4.2 Groundwater Colloids and Particles
In groundwater, the mobility of radioactive elements is influenced by the
movements of the colloids and other particles in the water. Particle sizes of about 1-
450 nm called colloids and other ions, complexes and constituents of groundwater
25
settles with very low velocity in the aquifer water formation (Degueldre et al. 2000).
The fine clay particles, silica, some transition metals, humic and fulvic acids are the
colloids found in natural subsurface groundwater system. Lieser et al., (1990), noted
that certain level of colloidal humic substance increase was observed at the near
surface. Tiny particles form aggregates and particles of larger sizes are settled onto
the sediments below the bottom.
In groundwater system, transition metals and other metal hydroxides, acids of
fulvic and humic are termed as the carriers of colloidal particles which adsorb or co-
precipitate with radionuclides in colloidal form with other elements in water bearing
formation. This is termed as the first group. The particles of intrinsic colloid are
termed as the second group which are formed by radionuclides materials. The
possibility of intrinsic colloidal formation is unlikely since the mass concentration in
groundwater is low and the constant of the solubility does not exceed the limit
(Lieser et al. 1990, Silva and Nitsche 1995).
2.4.3 Activity Concentrations of Natural Occurring Radioelements Reported
in Different Countries
The various activity concentrations of 238
U and 226
Ra in groundwater have
been carried out in many countries and the results are summarized in Tables 2.3 and
2.4 respectively. The results obtained in different countries cannot be compared to
each other, since few areas that are restricted were examined for the activity levels.

26
Table 2.3: Concentrations of 238
U in groundwater from different Countries.
* D= Drilled Well, G= Groundwater (dug wells and springs), T= Tap water, DW= Drinking water, M= Mineral
water.
Nuclide Country Water
Source
Number
of
Samples
Mean Maximum Reference
238U
(Bq L‒1)
Sweden D 328 14.3 427 Isam Salih et al.
2002
Finland D 7000 32 20 000 Salonen &
Huikuri 2002
G 5000 1.6 89 Juntunen 1991,
Makelainen et al.
2002
Norway D 476 34 750 Midtgard et al.,
1998
D 150 6 3000 Banks et al., 1998
Ukraine D 520 30.4 570 Zelensky et al.,
1993
Switzerla
nd
DW 360 <2 80.6 Deflorin et al.,
2004, UNSCEAR
2000
M 42 <2 <10 Deflorin et al.,
2004
Spain D 345 145 1500 Fernandez et al.,
1992
G 345 32 43 Fernandez et al.,
1992
Germany G + D 14 1.15 5.1 Gans et al., 1987
China G +D 110 1.4 13.4 Zhou et al., 2001
Brazil G + D 88 0.08 667 Almeida et al.,
2004
France G + D 54 8.7 24.4 Saumande et al.,
1973
Slovenia G 500 0.51 4.2 Kobal et al.1990
Italy DW - - 10.5 UNSCEAR 2000
Colorado,
North
(USA)
D 566 18.6 <200 Zielinski et al.,
1995
Colorado,
South
(USA)
D 170 31.6 >200 Zielinski et al.,
1995

27
Table 2.4: Concentrations of 226
Ra in groundwater from different Countries.
Nuclide Country Water
Sourc
e
Number
of
Samples
Mean Maximum Reference
226Ra (Bq
L‒1
)
Finland D 2700 0.06 49 Salonen &
Huikuri 2002
G 2200 0.01 2.0 Makelainen et
al., 2002
Sweden D 328 0.26 4.9 Isam Salih et
al., 2002
Denmark D 79 - 0.55 Ulbak &
Klinder, 1984
Ukraine D 520 0.38 5.2 Zelensky et al.,
1993
Switzerland DW 360 <0.02 1.5 Deflorin et al.,
2004,
UNSCEAR
2000.
Switzerland M 42 0.035 0.13 Deflorin et al.,
2004
Spain D 345 0.84 9.26 Fernandez et
al., 1992
G 345 0.025 0.07 Fernandez et
al., 1992
D 32 1.0 4.0 Soto et al.,
1988
Germany G + D 192 0.15 6.29 Gans et al.,
1988
China G + D 428 0.03 0.94 Zhou et al.,
2001
Brazil G + D 88 0.02 0.49 Almeida et al.,
2004
France G + D 54 0.08 0.53 Saumande et
al., 1973
Slovenia G 500 0.02 0.51 Kobal et al.,
1990
United
Kingdom
DW - - 0.18 UNSCEAR
2000
Poland D 6 0.104 0.33 Grzybowska et
al.,1983
Italy DW - - 1.2 UNSCEAR
2000
Maine
(USA)
D 33 2.4 27 Smith et
al.,1961 *D= Drilled Well, G= Groundwater (dug wells and springs), T= Tap water, DW= Drinking water, M= Mineral
water.
1) = number of drilled well and dug well samples all together
2) = 238U concentration is calculated from total activity concentration of (238U and 234U) using isotope
ratio of 2 and factor 80.6 to convert Bq L‒1 to μg L‒1
3) = geometric mean
4) = median
5) = median and maximum values are estimated from cumulative frequency diagrams
28
2.4.4 Activity concentration of natural radionuclides in Nigeria
The natural radioactivity levels in rocks depend on the type and location of
rock formation. Rocks fall into three main divisions namely, the sedimentary
formation, metamorphic and igneous rocks. Sedimentary rocks are derived from
igneous rocks. Igneous rocks are composed mainly of silicates and free silica. The
principal rock types are granite, granodiorite, diorite, syemite, basalt, eclogite,
peridotite and dunite. In Nigeria, previous studies on radionuclides have been
carried out in soil, bedrocks and water. Few of the reported works are discussed
below.
The Gamma-emitting radionuclides in rocks and soils of Saunder Quarry site
in Abeokuta, South-Western Nigeria were measured by Okeyedi, (2012). He
concluded that the granite rock used for building and construction purposes from the
study area would be rich in natural occurring radionuclides (NOR).
In the same studies above, the radioactivity levels of rock and soil and the
corresponding external exposures in Navy Quarry site of the same area were
determined. He concluded that the food crops grown on the soil of the study area will
be rich in NOR.
In 2011, Gbadebo, determined the radionuclide distribution in the granitic
rocks and soils of abandoned quarry sites, Abeokuta, South-western Nigeria and
concluded that the observed radionuclides are based on local geology of the area and
these radionuclides will serve as a possible source of radiation to the local quarry
workers and nearby residents alike.
The radioactivity of Jos Tin mine tailing in Northern Nigeria was measured
by Usikalu et al., (2011). It was however observed that the radionuclides can act as a
source for external radon exhalation for those dwelling 500 m away from the site.
29
2.5 Groundwater Concept
Groundwater flows through porous media, fractured media, and large passage
through weathered zones in subsurface terrain. Porous media consists of solid
material and voids or pore spaces. Porous media contains relatively small openings in
the solid materials as permeable which allows the flow of water through the media.
The porous media that are of interest in groundwater flow includes natural soil,
unconsolidated sediments, and sedimentary rocks. The size range of particles in soil
is referred to as the soil texture. Grain size determines the particle size classification.
The fraction of clay, silt, sand in soil texture has been described by soil texture
triangle (US Soil Conservation Service, 1951). Each point on the triangle
corresponds to different percentage by mass (weight of clay, sand and silt.
The subsurface occurrence of groundwater can be divided into vadose zone
(zone of operation) and zone of saturation. The vadose zone, also called the
unsaturated or partially saturated zone is the subsurface media above the water table.
The term vadose is derived from the latin vadosus, meaning shallow. Groundwater
originates through infiltration, influent streams, seepages from reservoirs, artificial
recharge, condensation, seepage from ocean, water trapped in the sedimentary rock
(connate water), and juvenile water (volcanic, magmatic and cosmic). Any
significant quantity of subsurface water stored in subsurface formation defines an
aquifer. An aquifer may be defined as a formation that contains sufficient saturated
permeable material to yield significant quantities of water to well, (Lohman et al.,
1972). Aquifers are usually of large area extent and are essentially underground
storage reservoirs. They may be overlain or underlain by confining bed, which is
relatively impermeable material adjacent to the aquifer. Typical example of aquifers
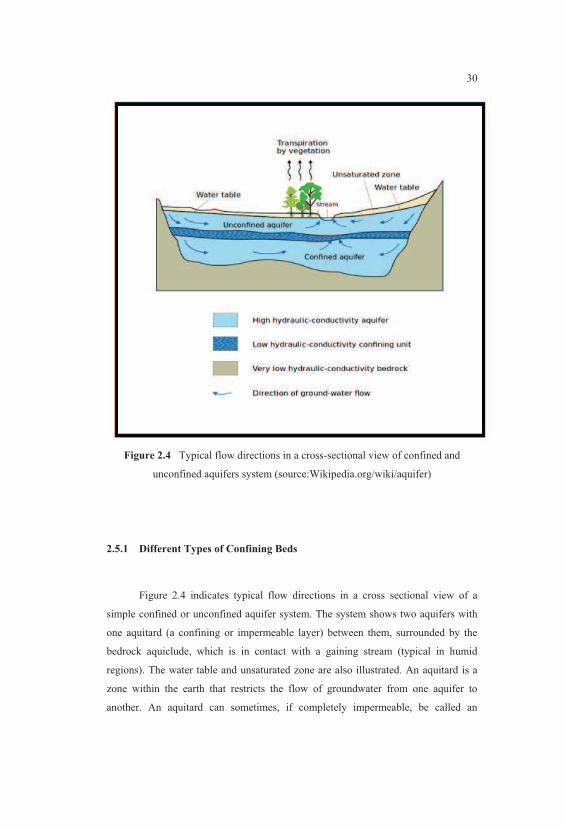
can be found in Figure 2.4.
30
Figure 2.4 Typical flow directions in a cross-sectional view of confined and
unconfined aquifers system (source:Wikipedia.org/wiki/aquifer)
2.5.1 Different Types of Confining Beds
Figure 2.4 indicates typical flow directions in a cross sectional view of a
simple confined or unconfined aquifer system. The system shows two aquifers with
one aquitard (a confining or impermeable layer) between them, surrounded by the
bedrock aquiclude, which is in contact with a gaining stream (typical in humid
regions). The water table and unsaturated zone are also illustrated. An aquitard is a
zone within the earth that restricts the flow of groundwater from one aquifer to
another. An aquitard can sometimes, if completely impermeable, be called an
31
aquiclude or aquifuge. Aquitards are composed of layers of either clay or non-porous
rock with low hydraulic conductivity. Further explanation of different types of
confining beds is shown below.
(1) Aquiclude: A saturated but relatively impermeable materials that do not yield
appreciable quantities of water to well; clay is an example.
(2) Aquifuge: A relatively impermeable formation neither containing nor
transmitting water; solid granite belongs in this category.
(3) Aquitard – A saturated but poorly permeable stratum that impedes groundwater
movements and does not yield water freely to wells, but they may transmit
appreciably water to or from adjacent aquifers and, where sufficiently thick, may
constitute an important groundwater storage zone; sandy clay is an example. (Todd,
1980).
2.5.2 Aquifer Properties
Aquifer performs two important functions- a storage function and a conduit
function. In order words, aquifer stores water and also functions as a pipeline. When
water is drained from a saturated material under the influence of gravity, only a
portion of the total saturated volume in the pores is released. Part of the water is
retained in the interstices due to the losses of the molecular attraction, adhesion and
cohesion. The specific yield Sy, which is the storage term for unconfined aquifers, is
the volume of water drained from a saturated sample of the unit volume (1ft3 or 1m
3)
with a point decrease in the water table. Specific retention Sr is the quantity of water
that is retained in the unit volume after gravity drainage.
The sum of specific yield and the specific retention for saturated aquifers is
the porosity, � � �� � �� . Porosity is the pore volume divided by total volume
expressed in percent. Porosity represents the potential storage of an aquifer, but does
not indicate the amount of water a porous material will yield. The storagetivity (or
storage coefficient) of an aquifer is the volume of water the aquifer releases from or
32
takes into storage per unit surface area of an aquifer per unit decline or rise of head,
(Tiddo, 1980).
2.5.3 Hydraulic Conductivity
It is also referred to as (coefficient of permeability) is the property related to
the function of an aquifer. It is the nature of ease of moving groundwater through
aquifers, with dimension of �� ! " . The hydraulic conductivity, K is the rate of flow
of water through a cross-section of a unit area of aquifer under a unit hydraulic
gradient. The hydraulic gradient is the head loss divided by the distance between two
points. The hydraulic conductivity is commonly expressed in gallon per day ft‒3
or ft
d‒1
or m d‒1
in SI unit.
2.5.4 Heterogeneity and Anisotropy of Hydraulic Conductivity
In geologic formations, the hydraulic conductivity usually varies through
space, referred to as heterogeneity. A geologic formation is homogenous if the
hydraulic conductivity is independent of position in the formation, ie #�$%& '& () �
constant. A geologic formation is heterogeneous if the hydraulic conductivity is
dependent on position in the formation, #�$%& '& () * constant. Hydraulic
conductivity may also show variations with the direction of measurement at a given
point in the formation. A geologic formation is isotropic at a point if the hydraulic
conductivity is independent of direction of measurement at the point, +, � #' �#(. A geologic formation is anisotropic at a point if the hydraulic conductivity varies
with direction, #% * �#' * �#(.

33
2.5.5 Groundwater Movement
Groundwater in its natural state is invariably moving and this movement is
governed by hydraulic principle. The flow through an aquifer is expressed by darcy’s
law, which is the foundation of groundwater hydraulics.
2.5.6 Darcy's Law
Ground water flow can be described quantitatively by Darcy's Law which
was derived empirically by Henry Darcy from his experiments in 1856 of water
flowing through filter sands. Darcy observed that in a given sand, the flow increased
directly proportional to the difference in hydraulic head and inversely proportional to
the length of flow or the flow rate through porous media is proportional to the head
loss and inversely proportional to the length of the flow part, expressed
mathematically as
Darcy's Law in Figure 2.5 can be expressed one dimensionally as:
- � ./ � 0# 12
13 (2.1)
where
4 = flow rate
5 = cross-sectional area through which water flow occur (m2
)
- = specific discharge, or flow rate 4, through cross-section area 5 , meter per day
(m d‒1
)
# = proportionally constant (m d‒1
)
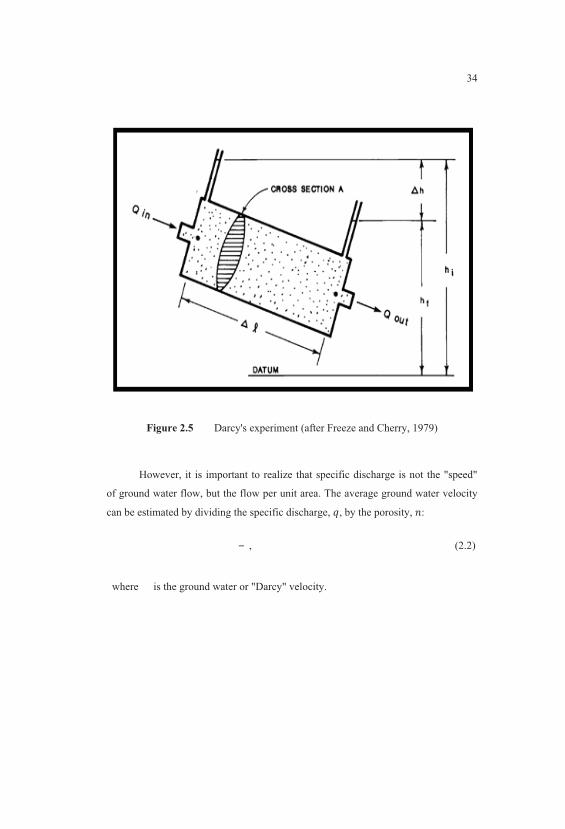
34
Figure 2.5 Darcy's experiment (after Freeze and Cherry, 1979)
However, it is important to realize that specific discharge is not the "speed"
of ground water flow, but the flow per unit area. The average ground water velocity
can be estimated by dividing the specific discharge, -, by the porosity, 6:
, (2.2)
where is the ground water or "Darcy" velocity.
35
2.6 Basement Terrain Groundwater in Nigeria
2.6.1 Groundwater occurrence in Basement Complex Rocks of Nigeria
Despite the favourable, large groundwater occurrence reported in the world
over, the Nigerian situation appears to be restricted by the fact that more than half of
the country is underlain by hard crystalline impervious rocks which are either
igneous or metamorphic in origin. This rather extensive mass, of almost impermeable
rocks underlies many of the semi-arid, and even the humid areas of the country, in
which there is high scarcity of portable water. In these areas, therefore, a serious
hydrogeological situation presents itself and water has to be found to meet the
domestic, agricultural and industrial needs of the population (Offodile, 2002;
Offodile, 1992; Offodile, 1975).
The hydrogeological characteristics of crystalline basement complex rocks in
assessing the groundwater potential in Nigeria has the following hydrogeological sub
provinces which is to be recognized:
(1) The younger granite complex area
(2) The metasediments, quartzites and schists complex area
(3) The older granite, migmatite and gneiss complex area.
2.6.2 The Older Granite and Gneisses Complex Area
The older granite, migmatite and gneissose rocks comprise the extensive
mass of metamorphic rocks underlying most areas of the north and west of the
country. The rocks include different textures of granites; coarse to fine, consisting

36
essentially of biotite, feldspars and quartz, which are indications of hydrogeological
characteristics. While the coarse granites weathered into water bearing sandy residue,
the syenitic rock types, with the predominance of unstable minerals eg. feldspars
decompose into plastic or soft clays and other argillites which behave only as
aquitards or aquicludes (Offodile, 2002; Offodile, 1992; Offodile, 1975).
Generally, only small amount of water can be obtained in the freshly
unweathered bedrock below the weathered layers. Even when fractured, the clayey
materials tend to seal the openings of the fractures and prevent water from being
transmitted into the borehole (Offodile, 2002; Offodile, 1992; Offodile, 1975).
2.6.3 The metasediments, Quartzites and Schists Complex Area
It is difficult to distinguish the metasedimentary areas, as they often grade
into the surrounding country rock which invariably are the older granite series.
However, the hydrogeological properties depend on the texture of the
metasediments, hence the schists and phyllites would be poor aquifers while the
quartzites and pegmatites, where fractures would prevent opposite situations. It is not
possible to describe case studies of these areas as no attempt has been made to
distinguish the areas in borehole drilling programmes. However, the distinction is
necessary for future programmes, to enable the determination of the hydrogeological
area as a potential groundwater producing area (Offodile, 2002; Offodile, 1992;
Offodile, 1975).
2.6.4 The Younger Granite/ Fluvio Volcanic Complex Area
The Younger Granite Complex comprises series of high level intrusive
granite of different chemical compositions, within the basement complex. The

37
granitic series include alkali feldspar granite associated with rhyolites and minor
gabbros and syenites. The emplacement of the rocks is preceded by a series of
volcanic activities which is responsible for its peculiar geomorphologic and textural
set up in Nigeria (Offodile, 2002; Offodile, 1992; Offodile, 1975)
2.6.5 The granite areas
The areas of extensive fracturing in Younger Granite often coincide with the
broad depressions or valleys separating the areas of high relief. The Younger granite
is characterized by a pronounced set of open joints which show a persistent northerly
trend in the study area and contain a lot of water. As a result, shallow groundwater
occurs almost everywhere in the decomposed zone overlying the fresh rock. This is
extensively developed for domestic purposes by means of numerous boreholes and
hand-dug wells (Offodile, 2002; Offodile, 1992).
2.6.6 Fluvio Volcanic Series
The fluvio volcanic series consists essentially of a series of hard, consolidated
basalt bed, basalt boulders and decomposed basalt, often weathered to clay,
invariably underlain by gravels or freshly weathered granite. The basaltic top is often
lateritised. A typical setting is as recorded from Lugbe, using borehole sections and
geophysical methods.

38
2.7 The Hydrogeologic System of Groundwater in Nigeria
The Nigerian hydrogeologic system is dominated by two main drainage
systems, the Rivers Niger and Benue and their tributaries. Others are the braided
north-south flowing rivers marking the coastline and emptying into the Atlantic
Ocean, and the inland northeast network, rising from the middle northeast half of the
country and feeding the Lake Chad. The Lake Chad, which is shared between
Nigeria, Chad, Cameroon and Niger, is the only major inland water body in Nigeria
in the northeastern corner of the country.
One of the main characteristic features of the rivers, in the Sahel region of the
country, is the fact that they originate from the areas of, relatively, higher rainfall,
invariably around the Jos Plateau and the Cameroon highlands. From the wet
highland regions, the rivers flow over large expense of highly permeable and dry
“thirsty” sandy land area before emptying into the Lake Chad or the upper part of the
River Niger. The rivers are, therefore, very effective agents of recharge of the surface
and underground waters, downstream; conveying water from areas of water surplus
to areas of water deficit, (Schultz, 1976).
2.7.1 Groundwater Chemistry
The chemistry of water is determined by some constituents which occur in
solution. These make up the major and minor constituents of water. The major
constituents include elements of calcium, magnesium, sodium, potassium as cations
and carbonates, bicarbonates, sulphates, chlorides and nitrates as anions. Other
chemical constituents, occurring in low concentrations are boron, fluoride, silica,
phosphate, sulphide, lithium and aluminum. The minor elements are generally not
critical in the determination of the quality of groundwater (Offodile, 1975)

39
2.7.2 Groundwater classification in Nigeria
The chemical composition of groundwater in Nigeria varies considerably.
The special characteristic in some hydrogeological environments are discussed
below. However, on the basis of the chemical parameters, viz anionic and cationic
concentrations, the groundwater in Nigeria can be classified into four groups as
follows, (Offodile, 1976):
i. Predominantly calcium bicarbonate water
ii. Magnesium sulphate, sodium chloride calcium bicarbonate water
iii. Predominantly sodium chloride waters
iv. Magnesium sulphate water.
Most of the Nigerian groundwaters fall into this category of predominantly
calcium bicarbonate water. The aquifers include carbonate rocks and sandstones in
various stages of consolidation. But of interest, is the fact that most of Nigerian
sandstone aquifers give high carbonate/bicarbonate chemical characteristics. Du
Preeze (1975) made a similar observation about groundwater from Northern Nigeria.
The observation could be attributed to the environment of deposition of the sands,
and the matrix binding the sands being calcareous, or due to the infiltration of carbon
dioxide rich rain-water derived from the atmosphere.
Some mine waters with a pH below 4 are known to have several hundreds to
several thousands mg L‒1
of Aluminum. Magnesium ions are mostly precipitated
above pH of 10.5. The mobility of manganese, copper, vanadium and uranium is
affected by the pH of the groundwater, though other processes, such as absorption,
may be more effective in controlling their distribution (Du Preeze, 1975).
40
CHAPTER 3
METHODOLOGY
3.1 Introduction
Materials and methods used in this work were discussed according to the
objectives proposed for this research. Firstly, for easy identifications of the study
locations and the rocks that constitute the geology of the area were briefly discussed
in this chapter.
3.1.1 The Study Area
The area of study forms part of the basement complex of North-Central
Nigeria; with lithologic units falling under three main categories, which include: (1)
Undifferentiated migmatite complex of Proterozoic to Archean origin, (2)
Metavolcano-Sedimentary rocks of Late Proterozoic age and (3) Older Granite
Complex of Late Precambrian - Lower Paleozoic age, also known as Pan-African
Granites. All these rocks have been affected and deformed by the Pan-African
thermotectonic event. Detailed reports of the lithological description, age, history,
structure and geochemistry of the Basement Complex of Nigeria are given in
Oyawoye, (1972), Black et al., (1979), Ajibade et al., (1987), Rahaman, (1988),
Caby, (1989), and Dada, (2008). Figure 3.1 is the geologic map of Nigeria with red
arrow pointing the study area as part of the basement complex of Nigeria. The
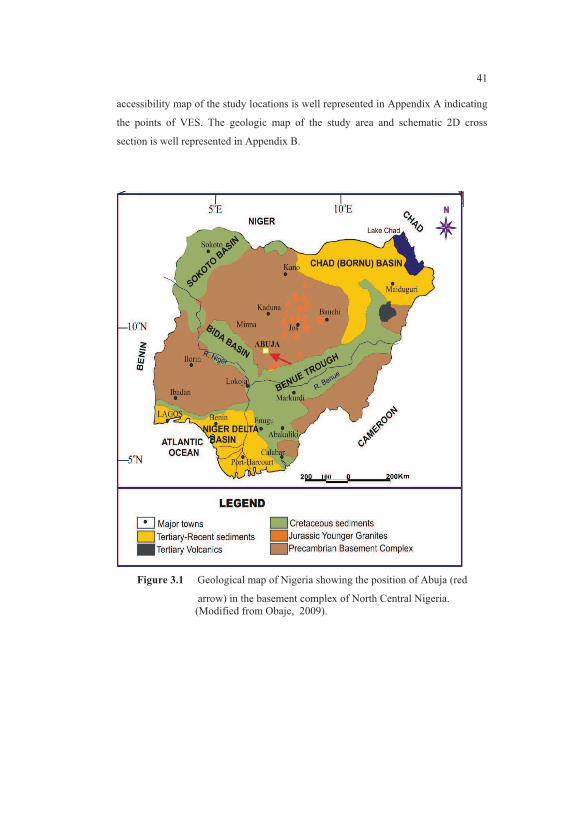
41
accessibility map of the study locations is well represented in Appendix A indicating
the points of VES. The geologic map of the study area and schematic 2D cross
section is well represented in Appendix B.
Figure 3.1 Geological map of Nigeria showing the position of Abuja (red
arrow) in the basement complex of North Central Nigeria.
(Modified from Obaje, 2009).
42
3.2 Materials and Methods for the Present Work
The methods used to materialize the aim of this research work are presented
according to the objectives. They are as follows:
1) Geophysical survey using Vertical Electrical Sounding (VES) to determine the
depth to the groundwater and lithological variation in resistivity.
2) Structural studied using Shuttle Radar Topography Mission (SRTM) data to
map out the subsurface structures, joints and faults that control groundwater
system and yields in the area
3) Modeling of groundwater movement and flow using MatLab.
4) Drilling of hydrogeologically motivated boreholes using 30 ton capacity Rig
Machine attached to 25 ton capacity high pressure compressor made of
INGERSOL.
5) Well log data (rock samples) collected sequentially with varying depth of about
70 m in Dei-Dei, 60 m in Kubwa, 50 m in Gosa and 40 m in Lugbe using hand-
shovel with GPS for coordinate of the borehole point locations (GPS Model:
Extrex 2000-2007).
6) Rock samples collected from the four boreholes accordingly were subjected to
radionuclei analysis using High Purity Germanium Gamma spectrometer
(HPGe)
7) The rock samples were also selected for geochemical characteristics using X-
ray fluorescence (XRF) analysis.
8) The water samples collected from the same four boreholes drilled, hand-dug
well and public water supply from the study area were analysed for activity of
radionuclides and toxic elements using Inductively Coupled Plasma Mass
Spectrometry (ICP-MS).
3.2.1 Geophysical Investigation
The search for groundwater in the study area was done by conventional method
using Vertical Electrical Sounding (VES) for aquifer characterisation, depth to
43
basement terrain groundwater and integrated with Shuttle Radar Topography Mission
(SRTM) for mapping out structures that control the groundwater system. The
combination of both methods revealed detailed groundwater information in the study
area especially at Gosa borehole.
3.2.2 Vertical Electrical Sounding (VES)
The search for groundwater was carried out through the use of electrical
methods of near surface geophysical survey. The Schlumberger configuration in
vertical electrical sounding (VES) was used to obtain field data. VES probes the
vertical variation in resistivity of the subsurface, thereby indicating the presence of
fluid and ionic concentration in the subsurface materials (Reynolds, 2011). VES also
determine the depth to bedrock, delineate the various units that constitute the
overburden (regolith), determine the degree of fracturing of the bedrock; all of which
would help in making the choice for a feasible site for constructing a successful
borehole. Figure 3.2 shows the simple configuration used for field data in this work
(Schlumberger configuration). VES data for this work were obtained using the Allied
OmegaC2 Terrameter as shown in Figure 3.3. The field data obtained was presented
as curve of apparent resistivity values against half of the current electrode separation
(AB/2) in metres on a log-log scale. The VES data obtained were analyzed using the
WINRESIST 2004 Version computer software to improve the quality of the
interpretation by iteration and modeling to goodness of fit. The practical field data
acquisition using Schlumberger array of VES method is shown in Figure 3.4. The
details of the results were discussed in Section 4.2.1 and 4.2.2 respectively.
From Figure 3.2, the mathematical application for the determination of
apparent resistivity is derived.
7 � �8 0 �9 � :;<= > ?
/8 0 ?@9 � ?
@9 0 ?/9A (3.1)
where,
�8�and �9 = potentials at B and C

44
5B= distance between electrodes 5 and B, etc
, (3.2)
where is apparent resistivity
Figure 3.2 The Schlumberger array for resistivity measurements using pair of
electrodes A and B lines for a pair of equipotentials on a half-space.
> A (3.3)
(3.4)
= Current across 5 to
where # is the geometric factor which depends on the arrangement of the four
electrodes and the lithology of the formation. Resistivity meters normally give a
resistance value, � � 7 D! , so in practice the apparent resistivity value is calculated as
stated in Equation 3.4. To determine the true subsurface resistivity, an inversion of
the measured apparent resistivity values using a computer program must be carried
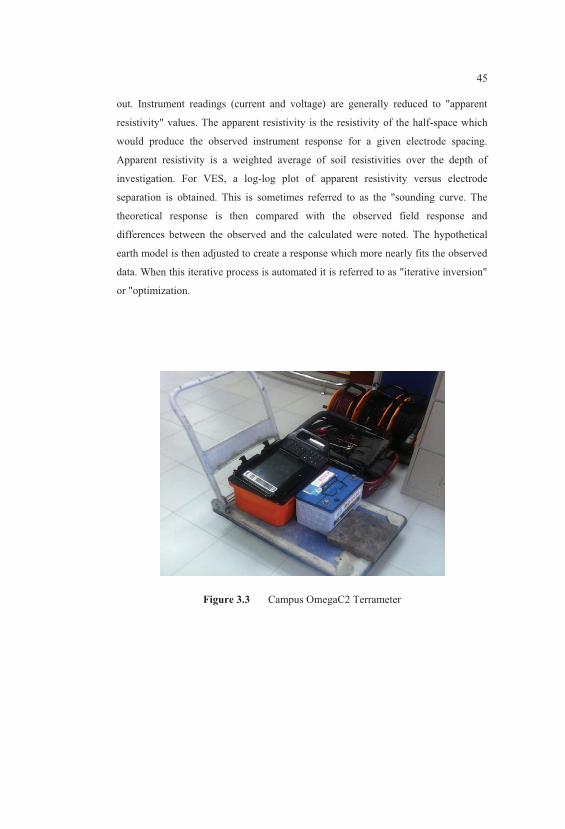
45
out. Instrument readings (current and voltage) are generally reduced to "apparent
resistivity" values. The apparent resistivity is the resistivity of the half-space which
would produce the observed instrument response for a given electrode spacing.
Apparent resistivity is a weighted average of soil resistivities over the depth of
investigation. For VES, a log-log plot of apparent resistivity versus electrode
separation is obtained. This is sometimes referred to as the "sounding curve. The
theoretical response is then compared with the observed field response and
differences between the observed and the calculated were noted. The hypothetical
earth model is then adjusted to create a response which more nearly fits the observed
data. When this iterative process is automated it is referred to as "iterative inversion"
or "optimization.
Figure 3.3 Campus OmegaC2 Terrameter

46
Figure 3.4 Practical field work using Campus Omega C2 resistivity for VES data
acquisition
3.2.3 Shuttle Radar Topography Mission (SRTM)
The conventional method of geophysical survey using Vertical Electrical
Sounding (VES) could not solve the problem of detailed subsurface information of
water-rock interaction and low yield of borehole production in some parts of the
study area, (e.g. Gosa) and groundwater sample is needed for radionuclides and toxic
elemental studies for this present study. Moreso, the inhabitant’s demand for water
supply is on the increase for lack of explorable groundwater with good yield in the
area (Gosa). A combination of conventional method (VES) with SRTM was used to
actualize the objective of subsurface structural mapping and structural trends of
fractures that control the groundwater system.
The Shuttle Radar Topography Mission (SRTM), a single pass interferometry
mission flown in February 2000, generated elevation data at 90 m resolution for 80%
of the Earth’s surface in C-band. The SRTM-DEM data was downloaded from the

47
website: http://srtm.csi.cigar.org/ and subjected to hill-shading procedure using Idrisi
32 software to enhance linear features that could be major regional fractures. The
analytical hill-shading algorithm in Idrisi32 is used to create the hill-shading image
with the Sun azimuth angle set to 315o (NW) and the Sun elevation angle set to 30
o.
The lineaments were extracted and digitized on screen to create a lineament map and
the lineament directions plotted on a rose diagram using GEOrientVer 9.5.0
software. The data used in this study was extracted in the SRTM-DEM as shown in
in Appendix A. The details of the SRTM results were discussed in Section 4.2.3.
3.2.4 Application of SRTM
Application of remotely sensed data for groundwater investigation is
becoming increasingly popular, especially in areas where conventional methods are
inadequate in accurately demarcating hydrologic zones. Examples include the works
of Galnett and Gardner, 1979; Edet, et al., 1994; Bala et al., 2000; Bala 2001. In a
few case studies, it has successfully complemented conventional geophysical
investigations (Goki et al., 2010; Anudu et al., 2011). The use of Shuttle Radar
Topographic Mission – Digital Elevation Model (SRTM-DEM) data for
hydrogeologic studies has been reported in other parts of the world (Wright et al.,
2006; Valeriano et al., 2006; Grohmann et al., 2007; Abdullah et al., 2012; Maxwell
et al., 2013a; Maxwell et al., 2014). These reports show the reliability of SRTM for
geophysical survey in structural studies and hydrogeologic studies.
3.2.5 Drilling of Borehole
The purpose of the borehole drilling in this research work was to collect
different rock layer samples accordingly to the depth of the aquifer and equally
groundwater samples. The boreholes were drilled with the help of 30 ton capacity
Rig machine attached with high pressure compressor made of INGERSOL of 25 ton
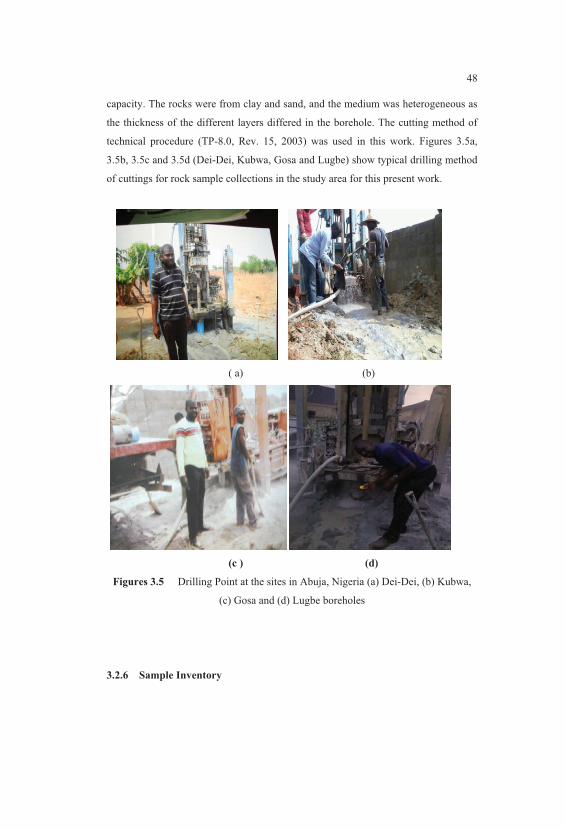
48
capacity. The rocks were from clay and sand, and the medium was heterogeneous as
the thickness of the different layers differed in the borehole. The cutting method of
technical procedure (TP-8.0, Rev. 15, 2003) was used in this work. Figures 3.5a,
3.5b, 3.5c and 3.5d (Dei-Dei, Kubwa, Gosa and Lugbe) show typical drilling method
of cuttings for rock sample collections in the study area for this present work.
( a) (b)
(c ) (d)
Figures 3.5 Drilling Point at the sites in Abuja, Nigeria (a) Dei-Dei, (b) Kubwa,
(c) Gosa and (d) Lugbe boreholes
3.2.6 Sample Inventory
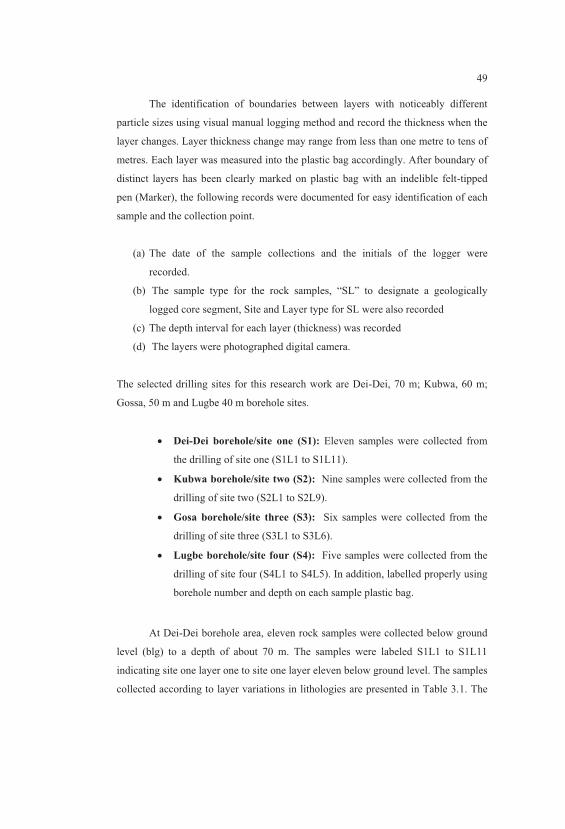
49
The identification of boundaries between layers with noticeably different
particle sizes using visual manual logging method and record the thickness when the
layer changes. Layer thickness change may range from less than one metre to tens of
metres. Each layer was measured into the plastic bag accordingly. After boundary of
distinct layers has been clearly marked on plastic bag with an indelible felt-tipped
pen (Marker), the following records were documented for easy identification of each
sample and the collection point.
(a) The date of the sample collections and the initials of the logger were
recorded.
(b) The sample type for the rock samples, “SL” to designate a geologically
logged core segment, Site and Layer type for SL were also recorded
(c) The depth interval for each layer (thickness) was recorded
(d) The layers were photographed digital camera.
The selected drilling sites for this research work are Dei-Dei, 70 m; Kubwa, 60 m;
Gossa, 50 m and Lugbe 40 m borehole sites.
� Dei-Dei borehole/site one (S1): Eleven samples were collected from
the drilling of site one (S1L1 to S1L11).
� Kubwa borehole/site two (S2): Nine samples were collected from the
drilling of site two (S2L1 to S2L9).
� Gosa borehole/site three (S3): Six samples were collected from the
drilling of site three (S3L1 to S3L6).
� Lugbe borehole/site four (S4): Five samples were collected from the
drilling of site four (S4L1 to S4L5). In addition, labelled properly using
borehole number and depth on each sample plastic bag.
At Dei-Dei borehole area, eleven rock samples were collected below ground
level (blg) to a depth of about 70 m. The samples were labeled S1L1 to S1L11
indicating site one layer one to site one layer eleven below ground level. The samples
collected according to layer variations in lithologies are presented in Table 3.1. The

50
drilling point coordinate, lat. 9o 6’52”N and long.7
o 15’39”E, using GPS, Model:
Extrex High Sensitivity 2000-2007 Garmin Ltd.
Table 3.1: Depth and lithologic unit of Dei-Dei borehole site
Sample ID Depth (m) Thickness (m) Lithology Description
S1L1 0-4 4
Sandstone, brownish
and
ferruginous,
interbedded with quartz
feldspar
S1L2 4-10 6 Coarse sand with clay,
bright red.
S1L3
10-11.3
1.3
Slightly micaceous
Sandy clay, brownish
pebbly, fine to coarse
feldspar.
S1L4 11.3-18.5 7.2 Fin to coarse sandy
clayey and gravel
S1L5 18.5-24 5.5 Sand. Brown, clayey at
the top, fine to coarse
S1L6 24-33 9 Light grey coarse sand,
granite gravel
S1L7 33-45 12 Silty sand feldspar,
blackish to grey
S1L8 45-49 4 Grey silty sand, low
grade
S1L9
49-57
8
Greyish to Purple silty
sand
S1L10
57-64.5
7.5
Sand, fine to coarse,
pebbly blackish to grey
S1L11 64.5-71.7 7.2
Sand, fine to medium-
grained, blackish to
grey becoming whitish
from 69m
In the same way, at Kubwa borehole area, nine rock samples were collected
below ground level (blg) to a depth of about 60 m. The samples were labeled S2L1 to
S2L9 indicating site two layer one to site two layer nine below ground level. The

51
samples collected according to layer variations in lithology are presented in Table
3.2. The drilling point coordinate, lat. 9o
6’16.7” N and long. 7o
16’26.0”E, using
GPS, Model: Extrex High Sensitivity 2000-2007 Garmin Ltd.
Table 3.2: Depth and lithologic unit of Kubwa borehole site.
Sample ID Depth (m) Thickness(m) Lithology Description
S2L1 0-7
7
Brownish ash sandy clay
gravely interbedded.
S2L2 7-13.4 6.4 Clay with bright red.
S2L3 13.4-21 7.6 Sandy clay micaceous,
brownish with feldspar.
S2L4 21-29 8 Fine to coarse sandy clayey
and gravel smoky
S2L5 29-36.4 7.4
Clay sandy, fine grain size,
darkish ash feldspar
S2L6 36.4-43 6.6 Silty clay, interbedded,
bright ash to glacy feldspar.
S2L7 43-44 1 Fine to coarse ashy sandy
clay.
S2L8 44-51 7 Fine to coarse sand,
greyish.
S2L9 51-61.1 10.1
Micaceous - gravely sandy,
fine-medium coarse darkish
to grey.
At Gosa borehole area, six sequential rock samples were collected below
ground level (blg) to a depth of about 50 m. The samples were labeled S3L1 to S3L6
indicating site three layer one to site three layer six below ground level. The samples
collected according to layer variation in lithology are presented in Table 3.3. The
drilling point coordinate, Lat: 8o 56’ 45.6” N and Long: 7
o 13’ 26.2” E, GPS- Model:
Extrex High Sensitivity 2000-2007 Garmin Ltd) was used for determining the
coordinates.

52
Table 3.3: Depth and lithologic units of Gosa borehole site.
Sample ID Depth (m)Thickness
(m)Lithology Description
S3L1 0-4 4Sandy clay, reddish brown
laterite top soil.
S3L2 4-10 6
Sandy clay, fine to
medium, reddish to
yellow.
S3L3 10-11.3 1.3Clay sandy feldspar
Yellowish brown pebbly
S3L4 11.3-18.5 7.2Micaceous clayey, grey to
black
S3L5 18.5-24 5.5Sandy shinny greyish to
black feldspar.
S3L6 24-33 9
Fine medium shinny, qartz
interbeded, greyish ash
feldspar
The last borehole drilled for this study at Lugbe area which was about 40 m
deep. Five rock samples were collected below ground level (blg) and were labeled
accordingly ranging from S4L1 to S4L5. The label identifies the samples as site four
layer one to site four layer 5 (S4L1 to S4L5), respectively. The samples collected
according to layer variation in lithology are presented in Table 3.4. The drilling point
coordinate (lat: 8o
59’ 2.3” N and long: 7o
23’ 7.8”E), GPS- Model: Extrex High
Sensitivity 2000-2007 Garmin Ltd) was used for determining the coordinate. All
these drilled rock samples and information will be subjected for further analysis in
this research work.

53
Table 3.4: Depth and lithologic unit of Lugbe borehole site.
Sample ID Depth (m) Thickness
(m) Lithology Description
S4L1 0-7 7 Laterite topsoil,
yellowish brown
S4L2 7-16.8 9.8
Sandy clay, fine to
coarse, brownish
yellow.
S4L3 16.8-27 10.2 Clayey sandy, brownish
ash, fine grain feldspar
S4L4 27-39 12
Sandy maicaceous,
grey, interbedded with
quatz feldspar
S4L5 39 -40 1 Fine to coarse, ashy to
grey
3.3 Sampling and Sample Preparation for Gamma Ray Spectrometry
Analysis
3.3.1 Rock Samples
A total of thirty one (31) samples collected from boreholes lithologies in Dei-
Dei, Kubwa; Gosa and Lugbe were dried under the ambient temperature of 25-29oC
for some weeks and sealed back into the plastic sock in Nigeria. They were
transported from Nigeria to Universiti Teknologi Malaysia, Nuclear Laboratory. The
samples were first dried at 105oC each overnight with two different ovens made of
Jouan of Japan and Memmert, model Schutzart Din 40050-IP20 made in Western
Germany, crushed with the help of Bico Pulverizer MFD by Bico Inc. UA Burbank,
California. After crushing of each sample, high pressure compressor air with nozzle
pipe was used to flush the remnant on the crushing machine and cleaned with tissue

54
to avoid cross-contamination before adding another sample. It was crushed to
powder and passed through 250μm sieve mesh with the help of sieve shaker made by
EFL 2000R and IMK11 Ende Cott Ltd, England. All the crushing and sieving were
carried out in Applied Geophysics laboratory, Faculty of Petroleum, UTM, Johor
Bahru. The oven used in this work to dry the rock samples at 105oC is shown in
Figure 3.6.
Figure 3.6 Ovum for drying the rock samples at Nuclear Lab. UTM (made of
Jouan by Japan)
After drying the samples overnights, they were taken to the crushing machine
which was set to the required sample size of 250 μm. The crushing machine used is
shown in Figure 3.7

55
Figure 3.7 The rock sample crushing machine was set at 250 μm sizes in Applied
Geophysics Lab., UTM (made by Bico Pulverizer MFD, Bico Inc. UA Burbank
California)
Each rock sample was crushed to the size of 250 μ for this study was further
passed through sieve shaker machine to achieve the required sample size of
powdered form by using the sieve mesh. The sieve shaker machine is shown in
Figure 3.8.

56
Figure 3.8 Sieve shaker machine sieving crushed rock samples through sieve
mesh of 250 μm.
During crushing and sieving, to avoid cross contamination of the samples
either on the sieve mesh or crushing machine, a high pressure air compressor was
used to flush the residue of the samples on the body parts. The air compressor is
shown in Figure 3.9

57
Figure 3.9 The high pressure air flushing machine that keeps the sieve mesh and
crushing machine clean at each use to avoid cross-contamination of rock samples.
After sample sieving, it was temporarily put into the plastic bottle and labeled
according to sample layers and the borehole site as shown in Figure 3.10 for easy
identification before transferring to marinelli beaker to achieve secular equilibrium
and for gamma counting.
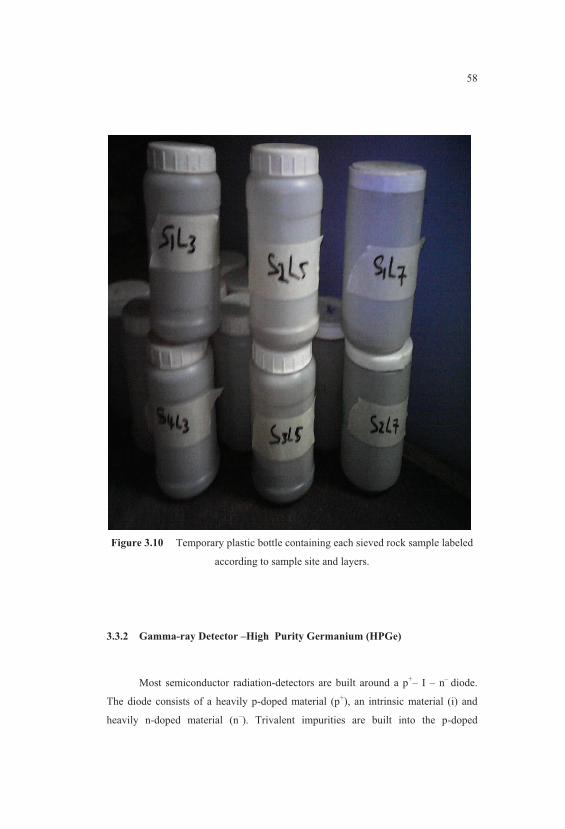
58
Figure 3.10 Temporary plastic bottle containing each sieved rock sample labeled
according to sample site and layers.
3.3.2 Gamma-ray Detector –High Purity Germanium (HPGe)
Most semiconductor radiation-detectors are built around a p+‒ I ‒ n
‒ diode.
The diode consists of a heavily p-doped material (p+), an intrinsic material (i) and
heavily n-doped material (n‒). Trivalent impurities are built into the p-doped

59
material, so this material has an excess of hole. The n-doped material has pentavalent
impurities built in, which results in an excess of electrons. The intrinsic material,
germanium, is a material with a very high degree of purity. These germanium diode
detectors are referred to as High Purity Germanium-detector (HPGe).
When the n‒type crystal an\d p+‒type material are brought into contact, the
charge carrier will migrate over the junction; the electron migrate to p+‒material, the
hole migrate to n- material. The combined effect of these migrations is a negative
space charge on the p+ ‒side and a positive space charge on the n
‒ ‒side of the
junction. The space charge causes an electric field over the junction which opposes
further migration of charge carriers. The zone over which the electric field extends
has a very low density of charge carriers (± 100 charge carriers per cm3) and is called
the depletion zone. Because of the presence of the electric field in this zone, electron-
hole pairs created within the depleted zone will be swept out, driving the electrons to
the n‒‒type material and the holes to the p
+‒type material. However, only a small
part of the detector will be depleted. Therefore, a reverse bias-voltage is applied
which has a two-fold effect on the performance of the detector; it will increase the
active volume of the detector and it will also speed up the charge collection.
As semiconductor detector, the primary electron (created by any of the
gamma interactions) is slowed down creating electron-hole pairs. The number n of
electron-hole pairs created in a semiconductor material is proportional to the
deposited γ-ray energy E1�F according to:
6 � �GHI�HJ (3.5)
with E�2, the average energy required to create an electron-hole pair, which is in the
order of a few K7�only. Since only a few eV is needed to create information carriers
in a semiconductor (in contrast to the approximately 30 eV in a scintillation detector)
the number of information carriers is much larger in a semiconductor detector.

60
3.3.3 Gamma Ray Detection System for this Study
Experiments were carried out using the gamma ray spectrometry facilities at
the Nuclear Lab. Faculty of Science, Universiti Teknologi Malaysia as shown in
Figure 3.11. A high resolution spectrometer was used for the measurement of the
gamma energy spectrum of emitted gamma-rays in the energy range between 50 keV
and 2000 keV. The gamma ray spectrometry consists of a high purity germanium
(HPGe) detector with a counting efficiency of 20%, a resolution of 1.8 keV for 1332
keV gamma ray emission of 60
Co. The detector used in gamma ray measurements
was Canberra GC2018 with Genie-2000 software. The gamma detector was cooled
by liquid nitrogen at 77 K for the purpose of reducing leakage current and thermal
noise, and its warm-up sensor is coupled to the high voltage detector bias supply.
The pre-amplifier was placed inside a lead shield to reduce background radiation
(Tsoulfanidis, 1995). The decay isotopes, gamma energy and gamma disintegrations
are shown in Table 3.5. The decay isotopes of gamma-ray energy and the block
diagram of HPGe operation is shown in Figure 3.12 and 3.13, respectively
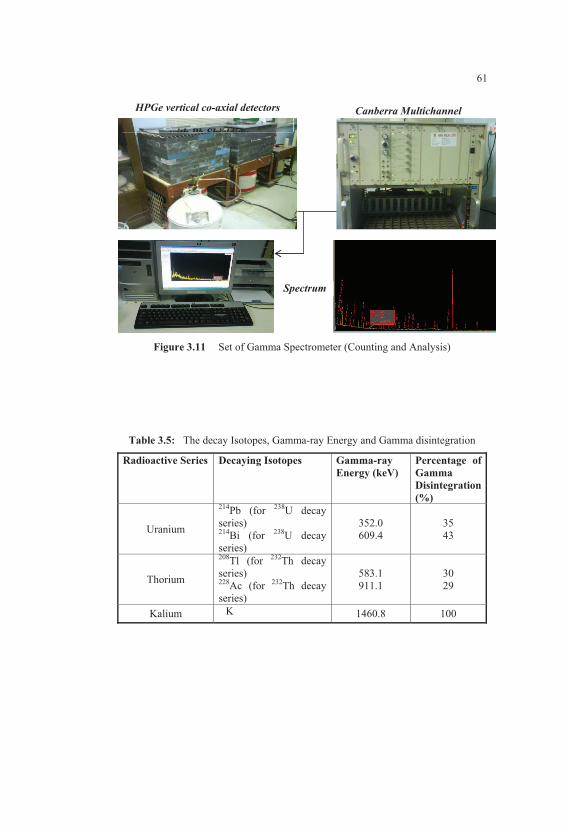
61
Figure 3.11 Set of Gamma Spectrometer (Counting and Analysis)
Table 3.5: The decay Isotopes, Gamma-ray Energy and Gamma disintegration
Radioactive Series Decaying Isotopes Gamma-ray
Energy (keV)
Percentage of
Gamma
Disintegration
(%)
Uranium
214Pb (for
238U decay
series) 214
Bi (for 238
U decay
series)
352.0
609.4
35
43
Thorium
208Tl (for
232Th decay
series) 228
Ac (for 232
Th decay
series)
583.1
911.1
30
29
Kalium K 1460.8 100
HPGe vertical co-axial detectors
with Pb Shielding
Canberra Multichannel
Spectrum
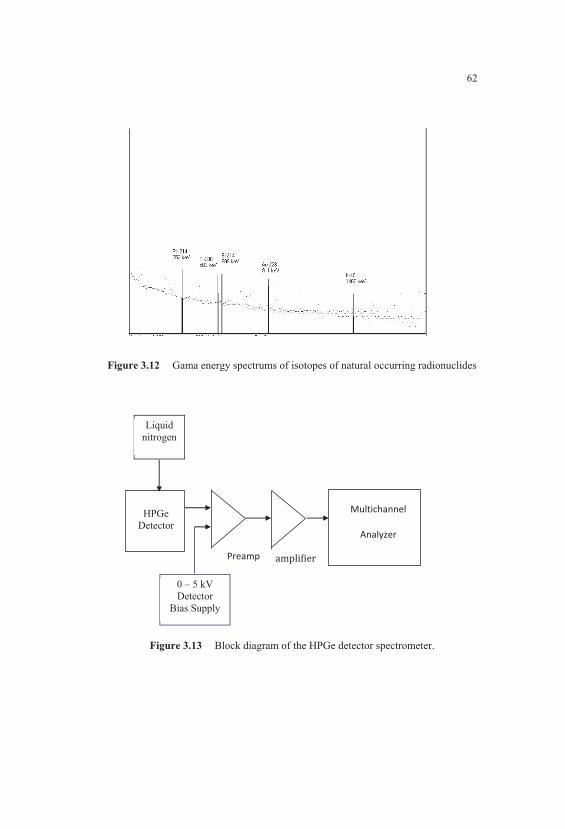
62
Figure 3.12 Gama energy spectrums of isotopes of natural occurring radionuclides
Figure 3.13 Block diagram of the HPGe detector spectrometer.
Preamp amplifier
0 – 5 kV
Detector
Bias Supply
HPGe
Detector
Multichannel
Analyzer
Liquid
nitrogen
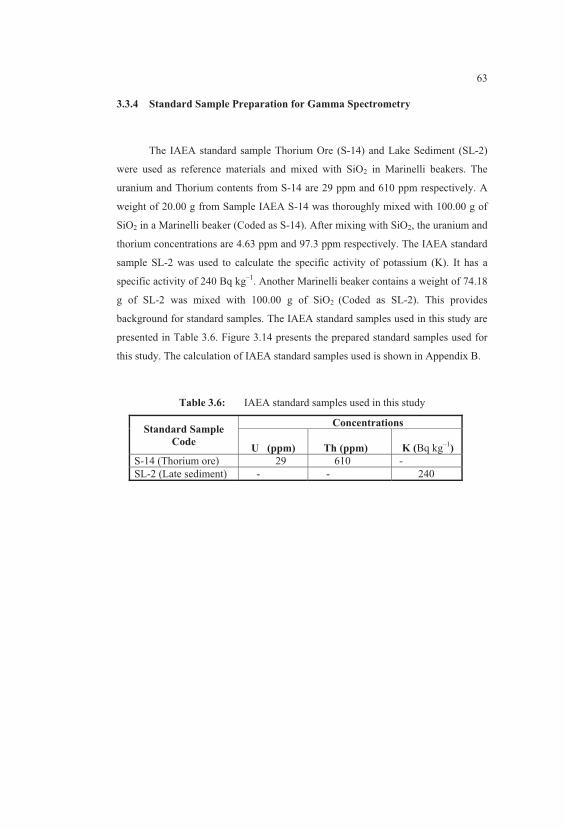
63
3.3.4 Standard Sample Preparation for Gamma Spectrometry
The IAEA standard sample Thorium Ore (S-14) and Lake Sediment (SL-2)
were used as reference materials and mixed with SiO2 in Marinelli beakers. The
uranium and Thorium contents from S-14 are 29 ppm and 610 ppm respectively. A
weight of 20.00 g from Sample IAEA S-14 was thoroughly mixed with 100.00 g of
SiO2 in a Marinelli beaker (Coded as S-14). After mixing with SiO2, the uranium and
thorium concentrations are 4.63 ppm and 97.3 ppm respectively. The IAEA standard
sample SL-2 was used to calculate the specific activity of potassium (K). It has a
specific activity of 240 Bq kg‒1
. Another Marinelli beaker contains a weight of 74.18
g of SL-2 was mixed with 100.00 g of SiO2 (Coded as SL-2). This provides
background for standard samples. The IAEA standard samples used in this study are
presented in Table 3.6. Figure 3.14 presents the prepared standard samples used for
this study. The calculation of IAEA standard samples used is shown in Appendix B.
Table 3.6: IAEA standard samples used in this study
Standard Sample
Code
Concentrations
U (ppm)
Th (ppm)
K (Bq kg‒1
)
S-14 (Thorium ore) 29 610 -
SL-2 (Late sediment) - - 240
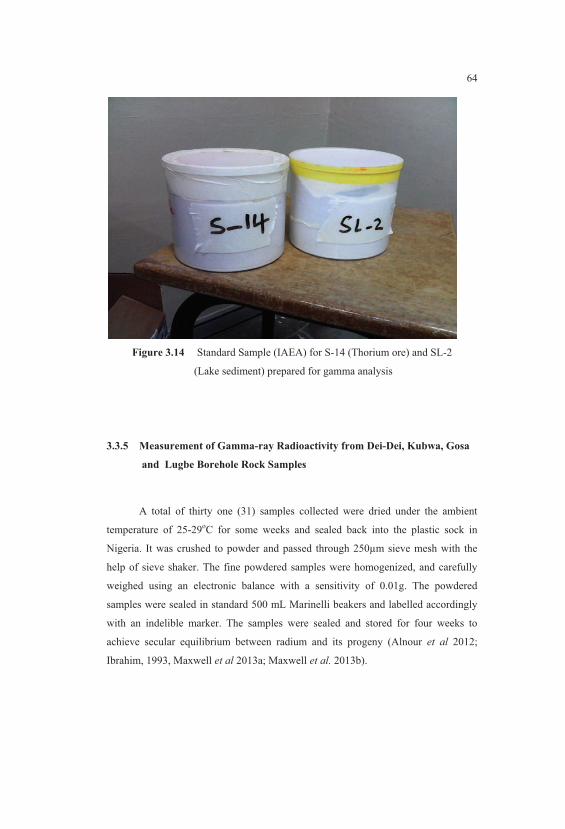
64
Figure 3.14 Standard Sample (IAEA) for S-14 (Thorium ore) and SL-2
(Lake sediment) prepared for gamma analysis
3.3.5 Measurement of Gamma-ray Radioactivity from Dei-Dei, Kubwa, Gosa
and Lugbe Borehole Rock Samples
A total of thirty one (31) samples collected were dried under the ambient
temperature of 25-29oC for some weeks and sealed back into the plastic sock in
Nigeria. It was crushed to powder and passed through 250μm sieve mesh with the
help of sieve shaker. The fine powdered samples were homogenized, and carefully
weighed using an electronic balance with a sensitivity of 0.01g. The powdered
samples were sealed in standard 500 mL Marinelli beakers and labelled accordingly
with an indelible marker. The samples were sealed and stored for four weeks to
achieve secular equilibrium between radium and its progeny (Alnour et al 2012;
Ibrahim, 1993, Maxwell et al 2013a; Maxwell et al. 2013b).

65
Under the conditions of secular equilibrium, 232
Th concentration was
determined from the average concentration of 208
Tl using the 583 keV peak and 228
Ac
by using the 911 keV peak. 238
U was determined from the average concentrations of
the 214
Pb by using the 352 keV peak and 214
Bi by using the 609 keV peak (Hamby
and Tynybekov, 2002; Alnour et al., 2012; Maxwell et al. 2013a; Maxwell et al.
2013b). The 1460 keV peak was used to determine the concentration of K. Each
sample was put into a shielded HPGe detector and measured for 21600 s. The
background gamma-ray spectrum of the detection system was determined with an
empty Marinelli beaker under identical conditions, and was subtracted from the
spectra of each sample. The specific activity was determined by comparing with
IAEA standard samples S-14 (Thorium ore) and SL-2 (Lake Sediment). The samples
prepared for gamma-ray counting are shown in Figure 3.15.
Figure 3.15 Prepared samples for Gamma counting after 4 Weeks secular
equilibrium

66
3.3.7 Calculation of the Concentration of 238
U, 232
Th and K
Calculations of count rates for each detected photopeak and radiological
concentrations (activity per unit mass) of detected radionuclides depend on the
establishment of secular equilibrium in the samples. Due to smaller life-time of the
radionuclides in the decay series of 238
U and 232
Th, the 238
U concentration was
determined from the average concentrations of the 214
Pb at 352 keV and 214
Bi at 609
keV in the sample, and that of 232
Th was determined from the average concentrations
of 208
Tl at 583 keV and 228
Ac at 911 keV decay products (Hamby and Tynybekov,
2000). Thus, an accurate radiological concentration was determined. The
concentration of K was based on 1460 keV peak.
The concentration of uranium, thorium and the specific activity of potassium
in the rock samples were calculated using the formula stated in Appendix C.
3.4 Neutron Activation Analysis (NAA) Method
The NAA method was used to compare the results for uranium and thorium
measured by direct method (gamma spectrometry). Comparison of the results was
discussed in Section 4.4.1. The results obtained will serve as verification of the
direct method for this work.
3.4.1 Sample Preparation for NAA
Few samples were prepared and sent to Nuclear Malaysia Agency (NMA) for
irradiation using TRIGA MARK II reactor. Approximately 0.15-0.2 g from each
sample was prepared in a polyethylene vial, labelled and sealed. Each sample has
67
duplicates to ensure quality of the analytical technique, completely homogegenized
to check errors that can happen during sample preparation.
A uranium-thorium standard solution of 100 ppm U and 98 ppm Th was used.
Approximately, 0.1000 g (ml) U-Th solution was mixed with small amount of Silica
(Si2O-IAEA) in a vial (2.5 ml) and placed in an oven for 4 h at 60 °C until dry; then
the vial was labelled and sealed. The details of the results were discussed in Section
4.4.1.
3.4.2 Sample Irradiation
Each batch of sample together with the reference standard sample and an
empty vial (blank) was attached with Au wire and Zr foil monitor to determine the
neutron flux parameters simultaneously with the sample. However, the Au wire also
used to correct flux differences between each sample and standard or blank sample.
Each batch of sample together with the reference standard sample were
irradiated for 6 h simultaneously at a neutron flux of 2.15 x 10¹²
n cm‒1
s‒1
at
PUPATI TRIGA MARK II reactor (Auu, 1998) operated at 750 kW power. After
approximately 3 days radioactive decay (to allow interfering activities to decay
away) of the samples, blank and reference standard sample were counted for 3600 s
on the gamma detection system.
3.4.3 Calculation of Element Concentration
The procedure generally used to calculate the concentration (i.e., ppm of
element) in the unknown sample is to irradiate the unknown sample and a
comparator standard containing a known amount of the element of interest together
68
in the reactor. If the unknown sample and the comparator standard are both measured
on the same detector, then one needs to correct the difference in decay between the
two. One usually corrects the measured counts (or activity) for both samples at the
end of irradiation using the half-life of the measured isotope. The equation used to
calculate the mass of an element in the unknown sample relative to the comparator
standard is
/LMNI/LOG � PLMNI$�QRSGLMNI)
PLOG$�QRSGLOG) (3.6)
where
5TU�V = activity of the sample
5TWX = activity of the standard sample
�TWX = mass of the standard sample
�TU�V = mass of the sample
� = decay constant for the isotope
Td = decay time.
When performing short irradiation, the irradiation decay and counting times are
normally fixed for all the samples and standards such that the time factors cancel.
Thus the above equation simplifies into
��������Y�ZPF� � [LOG��\LOG��]LMNI�� � (3.7)
where
Y�ZPF��= concentration of the sample
Y��1�� = concentration of the standard
�̂�1�� = weight of the standard sample
�̂ZPF� = weight of the sample
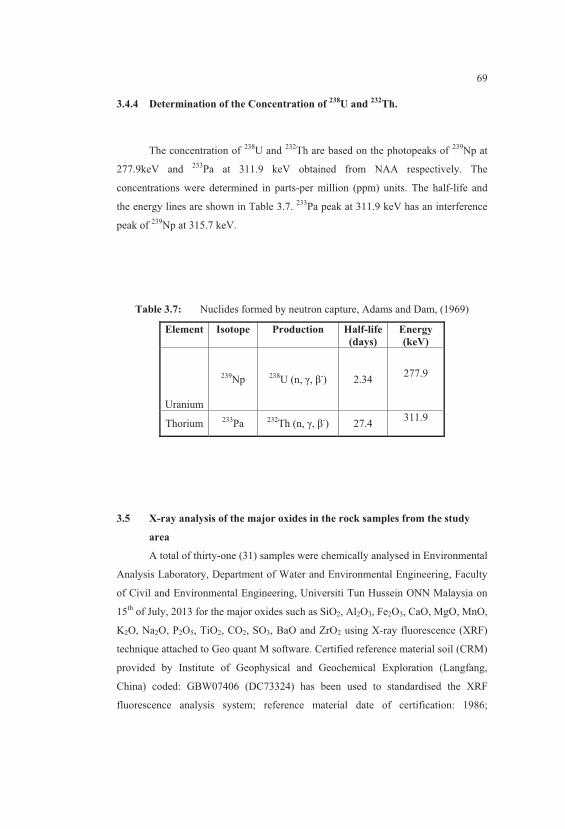
69
3.4.4 Determination of the Concentration of 238
U and 232
Th.
The concentration of 238
U and 232
Th are based on the photopeaks of 239
Np at
277.9keV and 233
Pa at 311.9 keV obtained from NAA respectively. The
concentrations were determined in parts-per million (ppm) units. The half-life and
the energy lines are shown in Table 3.7. 233
Pa peak at 311.9 keV has an interference
peak of 239
Np at 315.7 keV.
Table 3.7: Nuclides formed by neutron capture, Adams and Dam, (1969)
Element Isotope Production Half-life
(days)
Energy
(keV)
Uranium
239Np
238U (n, γ, β-
) 2.34 277.9
Thorium 233
Pa 232
Th (n, γ, β-) 27.4
311.9
3.5 X-ray analysis of the major oxides in the rock samples from the study
area
A total of thirty-one (31) samples were chemically analysed in Environmental
Analysis Laboratory, Department of Water and Environmental Engineering, Faculty
of Civil and Environmental Engineering, Universiti Tun Hussein ONN Malaysia on
15th
of July, 2013 for the major oxides such as SiO2, Al2O3, Fe2O3, CaO, MgO, MnO,
K2O, Na2O, P2O5, TiO2, CO2, SO3, BaO and ZrO2 using X-ray fluorescence (XRF)
technique attached to Geo quant M software. Certified reference material soil (CRM)
provided by Institute of Geophysical and Geochemical Exploration (Langfang,
China) coded: GBW07406 (DC73324) has been used to standardised the XRF
fluorescence analysis system; reference material date of certification: 1986;

70
modification: 2003 and expiration: 2013. It is mainly used in geology, mineral
reconnaissance, agriculture and related fields for carrying out chemical analysis as
calibration samples and for monitoring the quality of measurements.
The reference material was used for checking of the consistency of the
recommended values in relation to the time of the calibration. Raw material (rock
samples/soul samples) was dried in an oven at 105oC for 24 hours and crushed at 350
rpm (rotation per minute) for 5 to 10 minutes. The crushed samples were passed
through a sieve mesh of 50 μm. 7 g of sieved sample was added to 3 g of lico wax
(as binding agent) and were further dried, homogenised and pulverised, and then
compressed into pellets with the help of machine (Model PE Man) to pelletize the
mixture at about 8 x 10⁴ N (80 kN). The geometry differences, particle size effects
and inhomogeneity problems could have been eliminated. From the certified
reference material, two samples were taken and measured several times to check the
time correlation and standard values recovery. The pellet samples were subjected to
XRF chamber (Model: Bruker Pioneer S4 WDXRF) machine to get the percentage
composition of elements in the soil samples for about 45 minutes each. The block
diagram of the Bruker S4 pioneer (WDXRF) and the complete setup of Bruker
Pioneer S4 WDXRF are shown in Figure 3.16 and 3.17, respectively. Both the
prepared samples and standard reference material soil, GBW07406 (DC73324) for
X-ray analysis are shown in Figure 3.18. The results are discussed in Section 4.5.
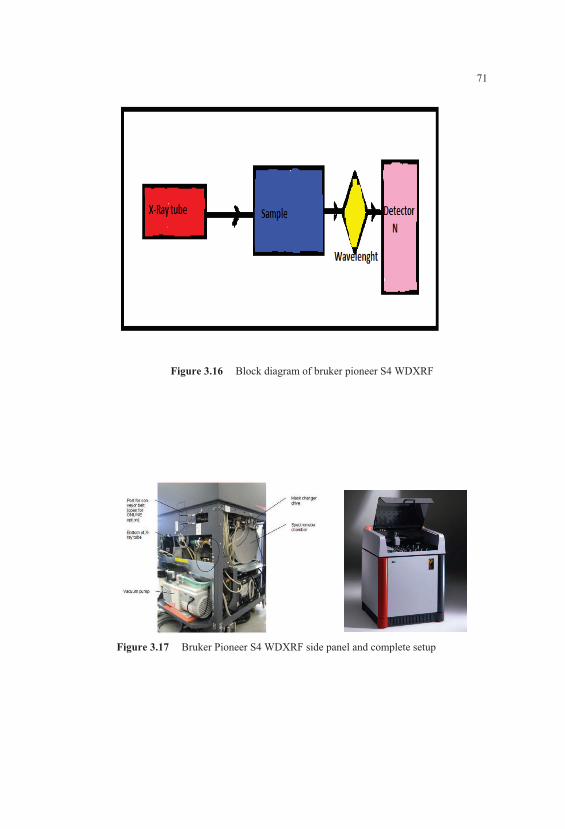
71
Figure 3.16 Block diagram of bruker pioneer S4 WDXRF
Figure 3.17 Bruker Pioneer S4 WDXRF side panel and complete setup
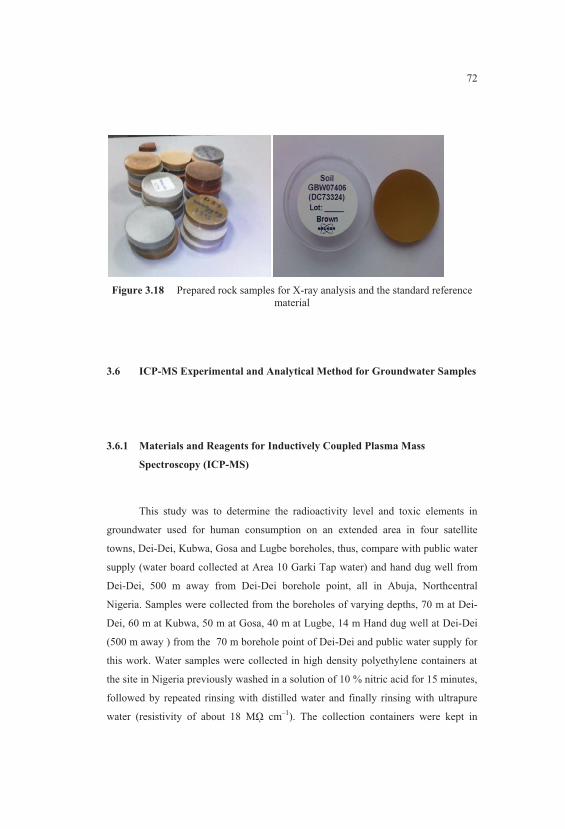
72
Figure 3.18 Prepared rock samples for X-ray analysis and the standard reference
material
3.6 ICP-MS Experimental and Analytical Method for Groundwater Samples
3.6.1 Materials and Reagents for Inductively Coupled Plasma Mass
Spectroscopy (ICP-MS)
This study was to determine the radioactivity level and toxic elements in
groundwater used for human consumption on an extended area in four satellite
towns, Dei-Dei, Kubwa, Gosa and Lugbe boreholes, thus, compare with public water
supply (water board collected at Area 10 Garki Tap water) and hand dug well from
Dei-Dei, 500 m away from Dei-Dei borehole point, all in Abuja, Northcentral
Nigeria. Samples were collected from the boreholes of varying depths, 70 m at Dei-
Dei, 60 m at Kubwa, 50 m at Gosa, 40 m at Lugbe, 14 m Hand dug well at Dei-Dei
(500 m away ) from the 70 m borehole point of Dei-Dei and public water supply for
this work. Water samples were collected in high density polyethylene containers at
the site in Nigeria previously washed in a solution of 10 % nitric acid for 15 minutes,
followed by repeated rinsing with distilled water and finally rinsing with ultrapure
water (resistivity of about 18 Mῼ cm‒1
). The collection containers were kept in

73
sealed polyethylene bags before the collection of samples. Borehole water samples
were stabilized with 5 ml of nitric acid in each litre of water in order to prevent it
from attacking to the wall of the container. The minimum detectable concentration
was 0.01 μg L-1
, corresponding to 124 μBq L-1
(Tarvainen et al., 2001).
For accurate determination of elemental compositions in groundwater
samples, a solution analytical method was used; a multi-standard calibration method
was applied using Elan 9000 instrument that performs analysis at parts-per-trillion
and lower. The samples were collected at each borehole point and hand-dug well as
shown in Figures 3.19 (a) and (b) respectively to know if depth contributes to low or
high activity concentrations of radionuclides in groundwater. In addition to the
samples, public water supply was collected to compare with the groundwater
resources from the study area. Both the groundwater samples, hand-dug well and
public water supply collected from the study area are shown in Figure 3.20.
(a) (b)
Figure 3.19 Collection of borehole water sample and hand-dug well at Dei-Dei

74
Figure 3.20 The water samples collected from Dei-Dei, Kubwa, Gosa and Lugbe
boreholes, hand-dug well and public water supply in Abuja, Nigeria.
The prepared water samples for the ICP-MS analysis is shown in Figure 3.21,
and labeled according to locations and site numbers, on the bodies of the plastic
bottles. The details of the results analysed using ICP-MS spectrometry are discussed
in Section 4.6.
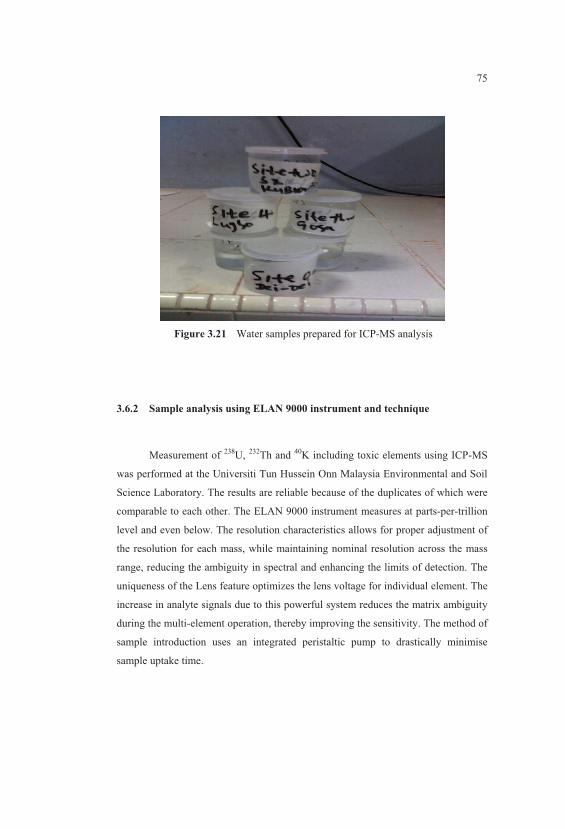
75
Figure 3.21 Water samples prepared for ICP-MS analysis
3.6.2 Sample analysis using ELAN 9000 instrument and technique
Measurement of 238
U, 232
Th and 40
K including toxic elements using ICP-MS
was performed at the Universiti Tun Hussein Onn Malaysia Environmental and Soil
Science Laboratory. The results are reliable because of the duplicates of which were
comparable to each other. The ELAN 9000 instrument measures at parts-per-trillion
level and even below. The resolution characteristics allows for proper adjustment of
the resolution for each mass, while maintaining nominal resolution across the mass
range, reducing the ambiguity in spectral and enhancing the limits of detection. The
uniqueness of the Lens feature optimizes the lens voltage for individual element. The
increase in analyte signals due to this powerful system reduces the matrix ambiguity
during the multi-element operation, thereby improving the sensitivity. The method of
sample introduction uses an integrated peristaltic pump to drastically minimise
sample uptake time.

76
The new method of ICP-MS for determining multi-element analysis and ideal
for groundwater, since the vast majority of target compounds can be detected below
0.1 mg L-1
(Adrian, 2007; Thomas, 2004). In this study, the analysis of radionuclides
and other heavy metals was based on ISO standard 17025 (European Standard EN
ISO/IEC 17025:2000). The samples and all the parameters used were stored in an
encrypted, checksum-protected dataset, in order to protect from losing the
information analyzed. The powerful quality-control system sets the limits,
parameters and standards based on U.S. EPA (EPA 200.8) or other quality-control
guidelines.The ELAN 9000 instrument used to perform the analyses is shown in
Figure 3.22.
Figure 3.22 The ICP-MS ELAN 9000 instrument
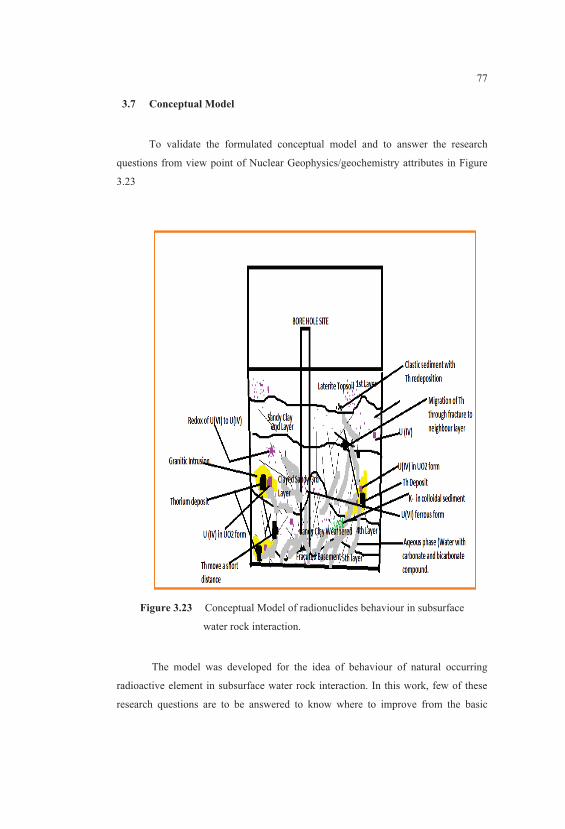
77
3.7 Conceptual Model
To validate the formulated conceptual model and to answer the research
questions from view point of Nuclear Geophysics/geochemistry attributes in Figure
3.23
Figure 3.23 Conceptual Model of radionuclides behaviour in subsurface
water rock interaction.
The model was developed for the idea of behaviour of natural occurring
radioactive element in subsurface water rock interaction. In this work, few of these
research questions are to be answered to know where to improve from the basic

78
ideas. Deposit of U (IV) in the form of UO2 in the host rock in subsurface geologic
formation, what are the ideas for the questions hereunder?
1. What causes uranium to oxidize to soluble form?
2. In subsurface media, what keeps uranium in aqueous phase to form many
chemical species?
3. Why the reaction of U (IV) in aqueous phase is a function of pH, oxidation-
reduction potential and complexity lingand?
4. What is the effect of temperature on U (IV) in the soil?

79
CHAPTER 4
RESULTS AND DISCUSSION
4.1 Introduction
This chapter presents the discussions of the field work of geophysical data
acquisitions and groundwater depth location using VES, structural studies of the
subsurface lineaments and fracture trend using SRTM, modeling of flow in a
homogeneous isotropic media using Matlab, experimental results for gamma ray
measurements using HPGe spectrometry, geochemical characteristics of rock
samples using XRF analysis, radiological and toxic elements concentration in
groundwater using ICP-MS analysis.
4.2 Vertical Electrical Sounding (VES) Measurements
In this work, the objective of VES was to determine the subsurface resistivity
distribution by making measurements on the ground surface. The search for
groundwater was carried out through the use of electrical methods of near surface
geophysical survey. The Schlumberger configuration in vertical electrical sounding
(VES) was used to obtain field data. VES probes the vertical in resistivity of the
subsurface, thereby indicating the presence of fluid and ionic concentration in the

80
subsurface materials, (Reynolds, 2011). It was also applied to determine the depth to
bedrock, delineate the various units that constitute the overburden (regolith),
determine the degree of fracturing of the bedrock; all of which would helpe in
making the choice for a feasible site for constructing a successful borehole. VES data
for this work were obtained using the Allied OmegaC2 Terrameter as shown in
Figure 3.3. The field data obtained was presented as curve of apparent resistivity
values against half of the current electrode separation (AB/2) in metres on a log-log
scale. The VES data obtained were analyzed using the WINRESIST 2004 Version
computer software to improve the quality of the interpretation by iteration and
modeling to goodness of fit. The practical field data acquisition using Schlumberger
array of VES method is shown in Figure 3.4. From these measurements, the true
resistivity of the subsurface can be estimated. The ground resistivity is related to
various geological parameters such as the mineral and fluid content, porosity and
degree of water saturation in the rock. The resistivity measurements are normally
made by injecting current into the ground through two current electrodes (A and B in
Figure 3.2), and measuring the resulting voltage difference at two potential
electrodes (M and N). From the current (I) and voltage (V) values, an apparent
resistivity ( �Z ) value is calculated. The mathematical expression of apparent
resistivity determination discussed in Section 3.2 was derived from Equation 3.4.
Resistivity meters normally give a resistance value, � � 7 D! , so in practice
the apparent resistivity value is calculated as stated in Equation 3.4. To determine the
true subsurface resistivity, an inversion of the measured apparent resistivity values
using a computer program must be carried out. Instrument readings (current and
voltage) are generally reduced to "apparent resistivity" values. The apparent
resistivity is the resistivity of the half-space which would produce the observed
instrument response for a given electrode spacing. Apparent resistivity is a weighted
average of soil resistivities over the depth of investigation. For VES, a log-log plot of
apparent resistivity versus electrode separation is obtained. This is sometimes
referred to as the "sounding curve. The theoretical response is then compared with
the observed field response and differences between observed and theoretical were
noted. The hypothetical earth model is then adjusted to create a response which more
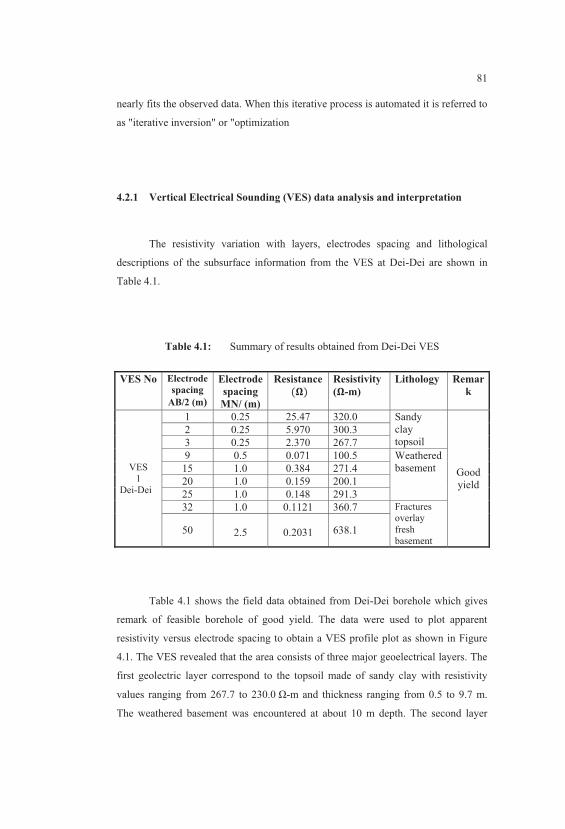
81
nearly fits the observed data. When this iterative process is automated it is referred to
as "iterative inversion" or "optimization
4.2.1 Vertical Electrical Sounding (VES) data analysis and interpretation
The resistivity variation with layers, electrodes spacing and lithological
descriptions of the subsurface information from the VES at Dei-Dei are shown in
Table 4.1.
Table 4.1: Summary of results obtained from Dei-Dei VES
VES No
Electrode
spacing
AB/2 (m)
Electrode
spacing
MN/ (m)
Resistance
$_) Resistivity
(_-m)
Lithology Remar
k
VES
1
Dei-Dei
1 0.25 25.47 320.0 Sandy
clay
topsoil
Good
yield
2 0.25 5.970 300.3
3 0.25 2.370 267.7
9 0.5 0.071 100.5 Weathered
basement 15 1.0 0.384 271.4
20 1.0 0.159 200.1
25 1.0 0.148 291.3
32 1.0 0.1121 360.7 Fractures
overlay
fresh
basement 50
2.5
0.2031 638.1
Table 4.1 shows the field data obtained from Dei-Dei borehole which gives
remark of feasible borehole of good yield. The data were used to plot apparent
resistivity versus electrode spacing to obtain a VES profile plot as shown in Figure
4.1. The VES revealed that the area consists of three major geoelectrical layers. The
first geolectric layer correspond to the topsoil made of sandy clay with resistivity
values ranging from 267.7 to 230.0 Ω-m and thickness ranging from 0.5 to 9.7 m.
The weathered basement was encountered at about 10 m depth. The second layer

82
consists of weathered basement with resistivity ranging from 100.5 to 291.3 Ω-m
with thickness ranges from 9.7 to 59 m. The third layer consist of fractures which
overlaid the fresh basement at about 73 m or greater with resistivity ranging from
360 to 638.1 Ω-m. The VES recommends about 70 m to be drilled in Dei-Dei area.
(+ = experimental, x = calculated)
Figure 4.1 1D profile plot of VES 1 for Dei-Dei Site
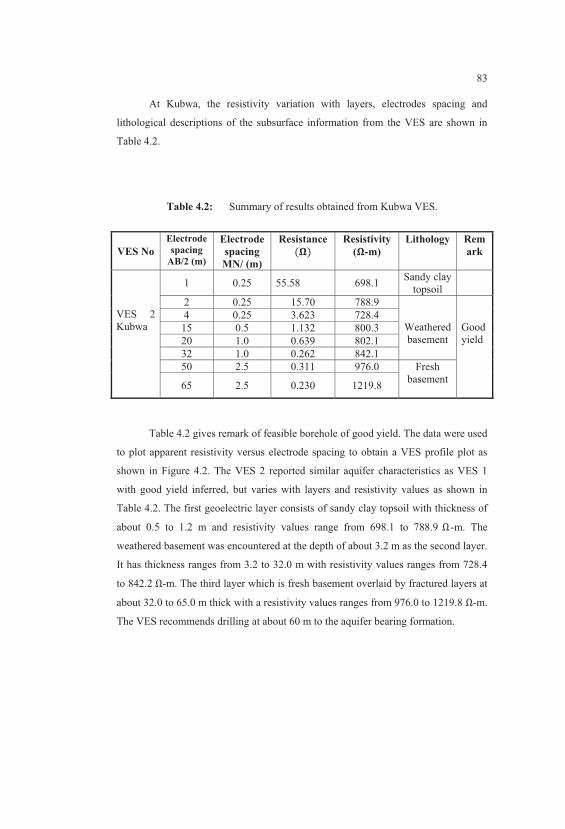
83
At Kubwa, the resistivity variation with layers, electrodes spacing and
lithological descriptions of the subsurface information from the VES are shown in
Table 4.2.
Table 4.2: Summary of results obtained from Kubwa VES.
VES No
Electrode
spacing
AB/2 (m)
Electrode
spacing
MN/ (m)
Resistance $_) Resistivity
(_-m)
Lithology Rem
ark
VES 2
Kubwa
1 0.25 55.58 698.1 Sandy clay
topsoil
2 0.25 15.70 788.9
Weathered
basement
Good
yield
4 0.25 3.623 728.4
15 0.5 1.132 800.3
20 1.0 0.639 802.1
32 1.0 0.262 842.1
50 2.5 0.311 976.0 Fresh
basement
65 2.5 0.230 1219.8
Table 4.2 gives remark of feasible borehole of good yield. The data were used
to plot apparent resistivity versus electrode spacing to obtain a VES profile plot as
shown in Figure 4.2. The VES 2 reported similar aquifer characteristics as VES 1
with good yield inferred, but varies with layers and resistivity values as shown in
Table 4.2. The first geoelectric layer consists of sandy clay topsoil with thickness of
about 0.5 to 1.2 m and resistivity values range from 698.1 to 788.9 ` -m. The
weathered basement was encountered at the depth of about 3.2 m as the second layer.
It has thickness ranges from 3.2 to 32.0 m with resistivity values ranges from 728.4
to 842.2 `-m. The third layer which is fresh basement overlaid by fractured layers at
about 32.0 to 65.0 m thick with a resistivity values ranges from 976.0 to 1219.8 `-m.
The VES recommends drilling at about 60 m to the aquifer bearing formation.

84
(+ = experimental, x = calculated)
Figure 4.2 1D profile plot of VES 2 for Kubwa
The resistivity variation with layers and lithological descriptions of the
subsurface information from the VES 3 are shown in Table 4.3 for Gosa area. VES 3
indicates complicated subsurface and basement information from the remark as it
shows low yield. It shows almost similar aquiferous features as VES 1 and VES 2 in

85
terms of weathered basements, but differs in low yield to dry aquifer even after
drilling up to 50 m depth estimated.
Table 4.3: Summary of results obtained from Gosa VES.
VES
No
Electrode
spacing
AB/2 (m)
Electrode
spacing
MN/ (m)
Resistance $_) Resistivity
(_-m)
Lithology Rema
rk
VES 3
Gosa
1 0.25 28.19 354.1 Laterite
topsoil
Low
yield
to
dry
well
2 0.25 9.139 459.3 Micaceous
sandy
clayey
weathered 3 0.25 2.372 477.0
6 0.5 1.569 354.8
Unweather
ed
basement
15 1.0 0.285 201.6
32 1.0 0.069 222.1
40 2.5 0.113 226.2
50 2.5 0.071 221.5 Fresh
basement
The data were used to plot apparent resistivity versus electrode spacing to
obtain a VES profile plot as shown in Figure 4.3. The results obtained from the
sounding revealed the first layer, laterite topsoil with thickness ranges from 0.8 to 3.3
m and resistivity ranges from 354.1 to 459.3 Ω -m.The second layer; weathered
basement has resistivity ranges from 459.3 to 477.0 Ω-m with thickness ranges from
3.3 to 40.2 m. The unweathered basement was noted to have resistivity ranges from
254.8 to 226.2 Ω-m with thickness ranges from 42.2 m to 50 m. Since the resistivity
values are lower than the weathered zone in other area which is supposed to be a
good promising aquifer features, hence, reported low to dry well when drilled up to
50 m. In this location, low yield was experienced in several boreholes which were
inferred to be the presence of dense intrusive bodies which may have shattered the
aquifer thereby become devoid of water from the zone. The profile plot of the
apparent resistivity versus electrode spacing in Figure 4.3 recommends drilling at
about 50 m in the area.

86
(+ = experimental, x = calculated)
Figure 4.3 1D profile plot of VES 3 for Gosa
The resistivity variation in layers of the subsurface formation from the VES
carried out for aquifer characterisation at Lugbe is shown in Table 4.4. The VES in
the region revealed three major geoelectrical layers overlaying fresh basement.

87
Table 4.4: Summary of results obtained from Lugbe VES
VES No
Electrode
spacing
AB/2
(m)
Electrode
spacing
MN/ (m)
Resistance $_) Resistivity
(_-m)
Lithology
Rem
ark
VES 4
(Lugbe)
1
0.25
28.85
362.4
Sandy
clayey
topsoil
Good
yield 2 0.25 5.909 297.0
Weathered
basement 4 0.25 1.471 296.6
8 0.5 0.249 100.1
15 1.0 0.399 282.3
20 1.0 0.235 294.5
Fractured
basement
overlay
fresh
basement
40 2.5 0.149 300.1
50 2.5 0.111 348.5
65
2.5
0.070
372.3
VES 4 shows the same promising good aquifer yield as VES 1 and VES 2
respectively as presented in Table 4.4. The profile plot of apparent resistivity against
electrode spacing as shown in Figure 4.4 reveals the first layer which is sandy clayey
topsoil with thickness ranges from 0.6 to 1.7 m and resistivity ranges from 297.0 to
362.4 Ω-m.The second layer reported resistivity ranges from 100.1 to 300.1 Ω-m
with thickness varying from 1.7 to 6.4 m as weathered basement. An interesting
observation here is that the fractured basement overlies the fresh basement at the
depth ranging from 15 to 20 m with varying resistivity at about 294.5 to 372.3 Ω-m.
This indicates that the aquifer is can be tapped closer to the surface than other areas.
The profile plot of the apparent resistivity versus electrode spacing recommends
drilling at about 40 m at Lugbe.

88
(+ = experimental, x = theoretical)
Figure 4.4 1D profile plot of VES 4 for Lugbe Site
4.2.2 Interpretation of Two-Dimensional (2D) Cross-sections of VES Layers
Across the Survey Area
The two-dimensional (2D) geoelectrical sections were then generated by
combining any two VES data falling along the distinct trends of each location. Figure
89
4.5 shows 2D lithological characterizations obtained from VES data combination
around Dei-Dei to Kubwa and Gosa to Lugbe. In Dei-Dei area, SW-NE is assumed
by area VES 1 and VES 2 around the Dei-Dei to Kubwa axis. A similar trend
(WSW-ENE) in the Gosa area, VES 3 and 4 respectively, falls within Gosa to Lugbe.
It is observed from Figure 4.5(a) that the weathered zone is thin around Gosa and
become considerably thicker around Lugbe. This explains why groundwater
condition is less problematic around Lugbe. In the Dei-Dei to Kubwa area as shown
in Figure 4.5(b), the top layers which correlate with the weathered layers exhibit
considerable thickness. Although the interested weathered layers thin out towards
Western part of Dei-Dei area, it is still much thicker than that obtained around VES
3, Gosa area.
.

90
Figure 4.5 2D cross-sections of interpreted VES depths across the survey area
with fractures
In view of this complicated report in VES 3, Gosa area, which is densely
populated area and seeking for groundwater supply, which is part of this project
work; a geophysical technique to integrate with the conventional VES method was
needed for adequate delineation of subsurface structures that control the groundwater
system in the area. For the purpose of further investigation of Gosa aquifer
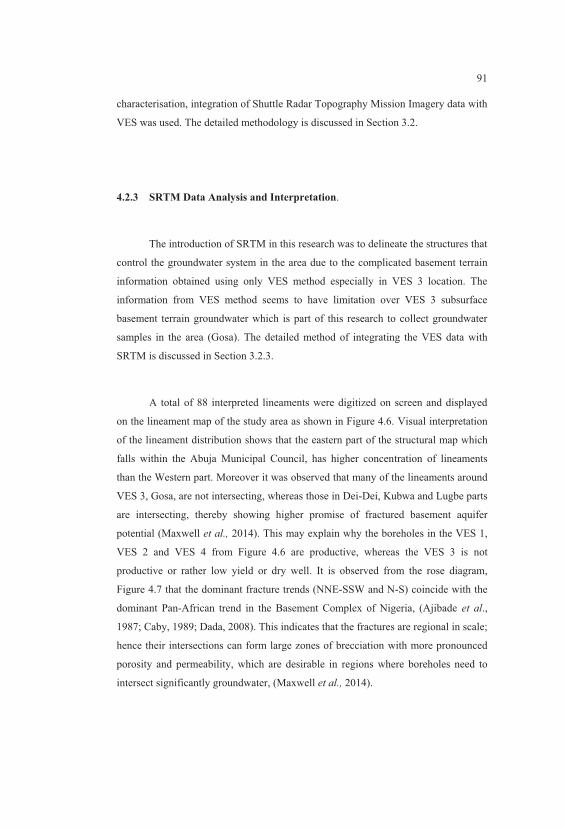
91
characterisation, integration of Shuttle Radar Topography Mission Imagery data with
VES was used. The detailed methodology is discussed in Section 3.2.
4.2.3 SRTM Data Analysis and Interpretation.
The introduction of SRTM in this research was to delineate the structures that
control the groundwater system in the area due to the complicated basement terrain
information obtained using only VES method especially in VES 3 location. The
information from VES method seems to have limitation over VES 3 subsurface
basement terrain groundwater which is part of this research to collect groundwater
samples in the area (Gosa). The detailed method of integrating the VES data with
SRTM is discussed in Section 3.2.3.
A total of 88 interpreted lineaments were digitized on screen and displayed
on the lineament map of the study area as shown in Figure 4.6. Visual interpretation
of the lineament distribution shows that the eastern part of the structural map which
falls within the Abuja Municipal Council, has higher concentration of lineaments
than the Western part. Moreover it was observed that many of the lineaments around
VES 3, Gosa, are not intersecting, whereas those in Dei-Dei, Kubwa and Lugbe parts
are intersecting, thereby showing higher promise of fractured basement aquifer
potential (Maxwell et al., 2014). This may explain why the boreholes in the VES 1,
VES 2 and VES 4 from Figure 4.6 are productive, whereas the VES 3 is not
productive or rather low yield or dry well. It is observed from the rose diagram,
Figure 4.7 that the dominant fracture trends (NNE-SSW and N-S) coincide with the
dominant Pan-African trend in the Basement Complex of Nigeria, (Ajibade et al.,
1987; Caby, 1989; Dada, 2008). This indicates that the fractures are regional in scale;
hence their intersections can form large zones of brecciation with more pronounced
porosity and permeability, which are desirable in regions where boreholes need to
intersect significantly groundwater, (Maxwell et al., 2014).
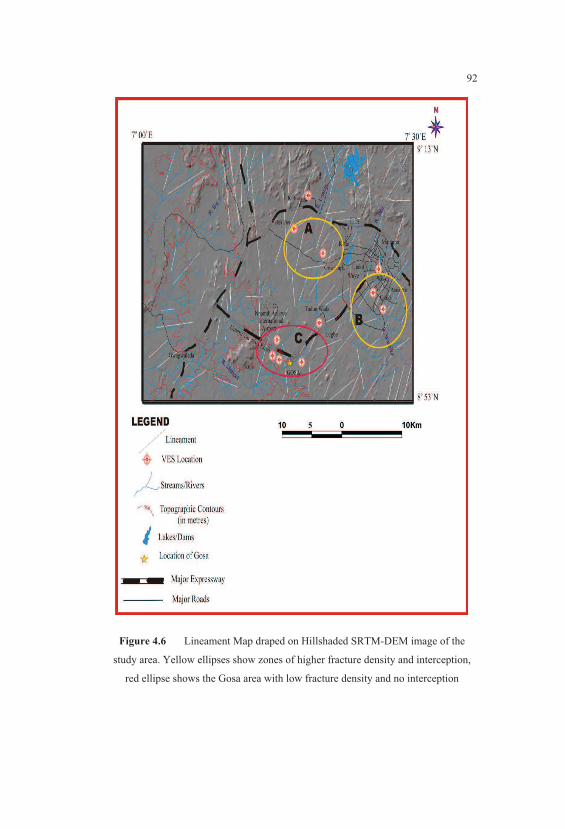
92
Figure 4.6 Lineament Map draped on Hillshaded SRTM-DEM image of the
study area. Yellow ellipses show zones of higher fracture density and interception,
red ellipse shows the Gosa area with low fracture density and no interception
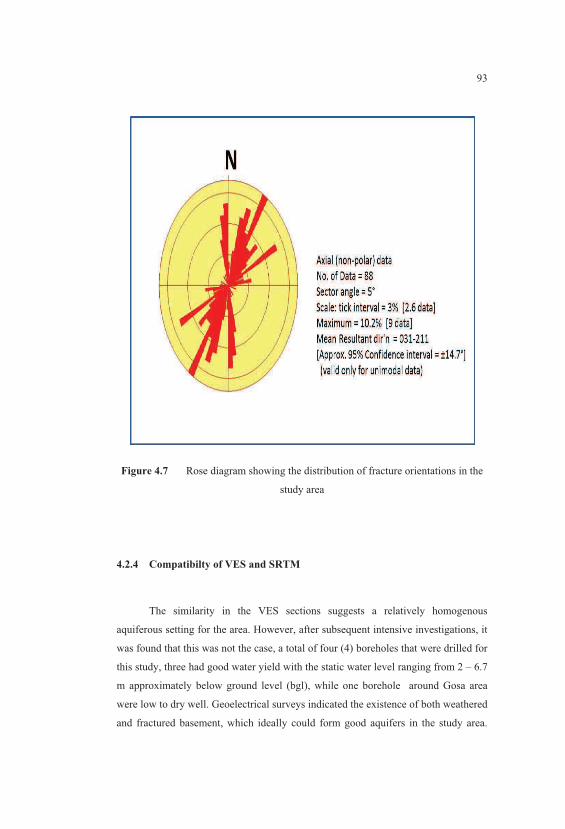
93
Figure 4.7 Rose diagram showing the distribution of fracture orientations in the
study area
4.2.4 Compatibilty of VES and SRTM
The similarity in the VES sections suggests a relatively homogenous
aquiferous setting for the area. However, after subsequent intensive investigations, it
was found that this was not the case, a total of four (4) boreholes that were drilled for
this study, three had good water yield with the static water level ranging from 2 – 6.7
m approximately below ground level (bgl), while one borehole around Gosa area
were low to dry well. Geoelectrical surveys indicated the existence of both weathered
and fractured basement, which ideally could form good aquifers in the study area.
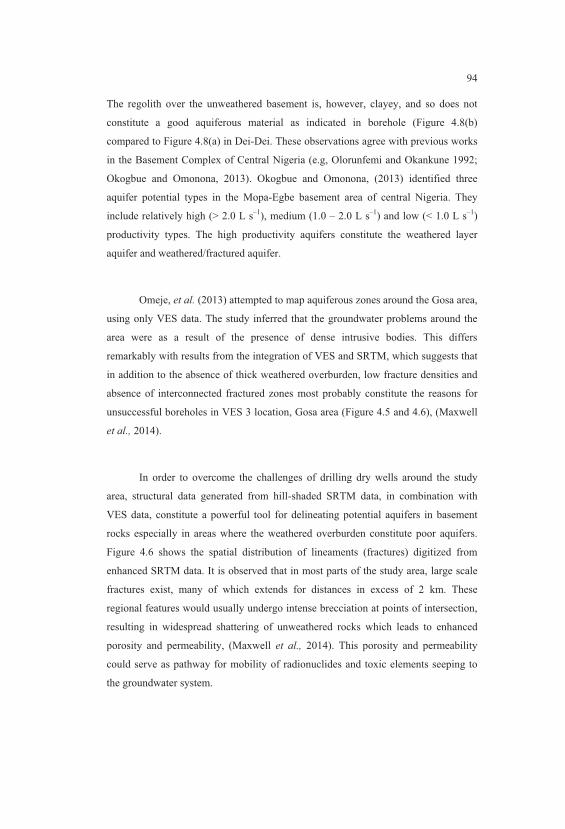
94
The regolith over the unweathered basement is, however, clayey, and so does not
constitute a good aquiferous material as indicated in borehole (Figure 4.8(b)
compared to Figure 4.8(a) in Dei-Dei. These observations agree with previous works
in the Basement Complex of Central Nigeria (e.g, Olorunfemi and Okankune 1992;
Okogbue and Omonona, 2013). Okogbue and Omonona, (2013) identified three
aquifer potential types in the Mopa-Egbe basement area of central Nigeria. They
include relatively high (> 2.0 L s‒1
), medium (1.0 – 2.0 L s‒1
) and low (< 1.0 L s‒1
)
productivity types. The high productivity aquifers constitute the weathered layer
aquifer and weathered/fractured aquifer.
Omeje, et al. (2013) attempted to map aquiferous zones around the Gosa area,
using only VES data. The study inferred that the groundwater problems around the
area were as a result of the presence of dense intrusive bodies. This differs
remarkably with results from the integration of VES and SRTM, which suggests that
in addition to the absence of thick weathered overburden, low fracture densities and
absence of interconnected fractured zones most probably constitute the reasons for
unsuccessful boreholes in VES 3 location, Gosa area (Figure 4.5 and 4.6), (Maxwell
et al., 2014).
In order to overcome the challenges of drilling dry wells around the study
area, structural data generated from hill-shaded SRTM data, in combination with
VES data, constitute a powerful tool for delineating potential aquifers in basement
rocks especially in areas where the weathered overburden constitute poor aquifers.
Figure 4.6 shows the spatial distribution of lineaments (fractures) digitized from
enhanced SRTM data. It is observed that in most parts of the study area, large scale
fractures exist, many of which extends for distances in excess of 2 km. These
regional features would usually undergo intense brecciation at points of intersection,
resulting in widespread shattering of unweathered rocks which leads to enhanced
porosity and permeability, (Maxwell et al., 2014). This porosity and permeability
could serve as pathway for mobility of radionuclides and toxic elements seeping to
the groundwater system.
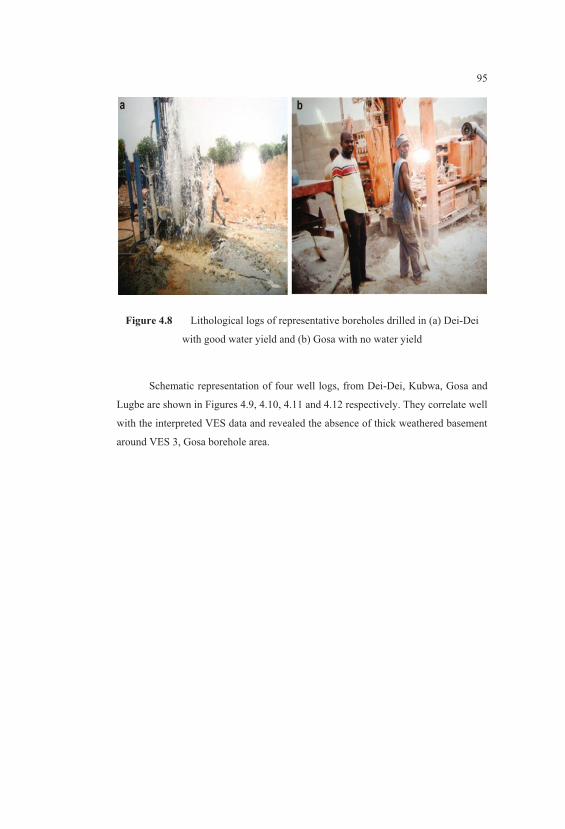
95
Figure 4.8 Lithological logs of representative boreholes drilled in (a) Dei-Dei
with good water yield and (b) Gosa with no water yield
Schematic representation of four well logs, from Dei-Dei, Kubwa, Gosa and
Lugbe are shown in Figures 4.9, 4.10, 4.11 and 4.12 respectively. They correlate well
with the interpreted VES data and revealed the absence of thick weathered basement
around VES 3, Gosa borehole area.
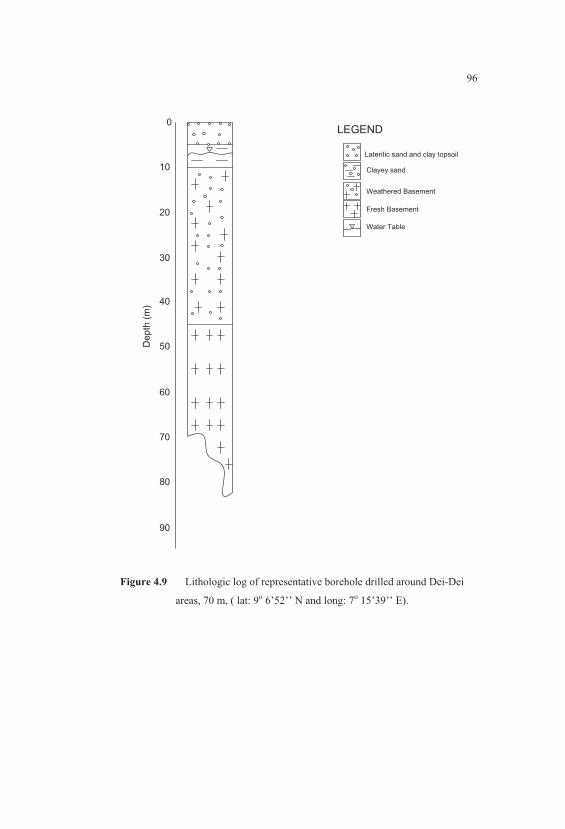
96
0
10
20
30
40
50
60
70
80
90
De
pth
(m)
Lateritic sand and clay topsoil
Clayey sand
LEGEND
Weathered Basement
Fresh Basement
Water Table
Figure 4.9 Lithologic log of representative borehole drilled around Dei-Dei
areas, 70 m, ( lat: 9o 6’52’’ N and long: 7
o 15’39’’ E).
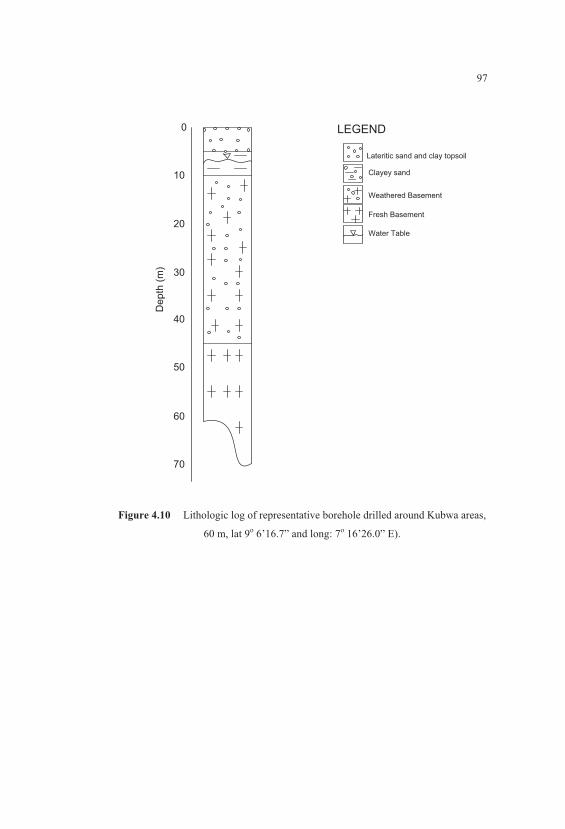
97
0
10
20
30
40
50
60
70
De
pth
(m)
Lateritic sand and clay topsoil
Clayey sand
LEGEND
Weathered Basement
Fresh Basement
Water Table
Figure 4.10 Lithologic log of representative borehole drilled around Kubwa areas,
60 m, lat 9o 6’16.7” and long: 7
o 16’26.0” E).
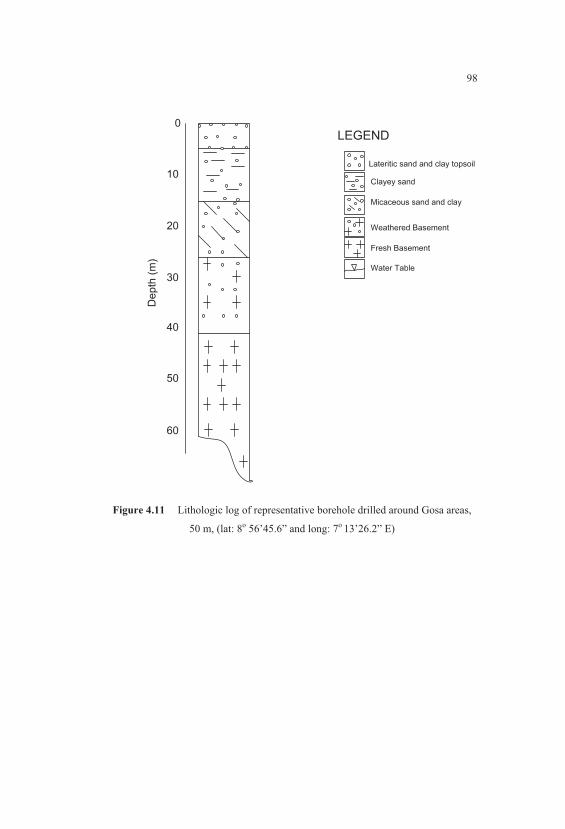
98
0
10
20
30
40
50
60
De
pth
(m)
Lateritic sand and clay topsoil
Clayey sand
Micaceous sand and clay
Weathered Basement
Fresh Basement
Water Table
LEGEND
Figure 4.11 Lithologic log of representative borehole drilled around Gosa areas,
50 m, (lat: 8o 56’45.6” and long: 7
o 13’26.2” E)

99
0
10
20
30
40
50
60
De
pth
(m)
Lateritic sand and clay topsoil
Clayey sand
LEGEND
Weathered Basement
Fresh Basement
Water Table
Figure 4.12 Lithologic log of representative borehole drilled around Lugbe areas,
40 m, (lat: 8o 59’2.3” N and long: 7
o 23’7.8”E)
4.3 Interpretation of Mathematical Model of Flow in Homogeneous
Isotropic Medium
The objective of this mathematical model is to determine the density of water
and the volumetric water content as functions of the spatial variables and of time.
Thus, to verify that the density of water as well as the control volume varies with
time due to the water pressure variation to be modeled using a computer package
(MatLab 2009a). This will help to demonstrate the variations of flow equation in
porous media as shown in Appendix F. If the hydraulic head is obtained by in-situ
measurements, Darcy's law is sufficient to describe the groundwater flow. The input
and output discharges at the level of the Representative Elementary Volume, REV,

100
for limited volumes of the porous media or for the whole system can be computed
based on the hydraulic gradients and the parameters of the porous medium and the
fluid. Equation (xiv) discussed in Appendix F was used to model and verify the
variation in control volume with time due to the water pressure as shown in Figure
4.13
Figure 4.13 Modeling of groundwater flow in homogeneous isotropic medium
In Figure 4.13, the groundwater is thought of as an infinitesimally small cube,
Representative Elementary Volume (REV) which follows from the principles of
equilibrium that pressure on every side of this unit of groundwater must be equal. As
this is the case, it will not move on the direction of the resultant force. Thus, the
pressure in this case is said to be isotropic, i.e it acts with equal magnitude in all
02
46
810
2000
4000
6000
80000
2
4
6
8
10
qxqy
qz

101
directions. The water density and the volumetric water content are functions of the
spatial variables and of time: � � �$%& '& (& W)a � $%& '& (& W)b
Density of water as well as the control volume varies in time due to the water
pressure variation; still, the lateral deformations of the control volume are ignored,
and only the vertical deformation is taken into account. In a given control volume,
aside from sources or sinks, mass cannot be created or destroyed, the conservation of
mass states that for increment of time (Δt), the difference between mass flowing in
across the boundaries, the mass flowing out across the boundaries and the source
within the volume, is the change in storage as in Equation 4.1.
c8LOdec� � c8fg
c� 0 c8dhOc� 0 8iHg
c� (4.1)
4.3.1 Prediction of Different Scenarios Pertaining Groundwater Flow in a
Closed Media of the Model using Darcy’s Law
The objective of the prediction is to calculate the Darcy’s velocity, volume of
water that flows through the media and average linear velocity of the groundwater
flow between two closest boreholes, i.e Dei-Dei to Kubwa and Gosa to Lugbe
respectively. The method is based on Henry Darcy’s work, 1856 to be calculated as
follows:
Darcy’s law is used to predict the velocity, 7, conductivity term, #, head
term, j and distance k.
7 � 0#lcj c�! m (4.2)

102
This is Darcy’s velocity (or Darcy’s flux) which is defined as the flow per
unit cross sectional area of the porous media. In a porous media, the water must flow
through the pores, around the solid particles, at a speed greater than the flux. This
speed is called the average linear groundwater velocity, ��7Z and is calculated by no ,
where 7 is the Darcy’s velocity (or flux) and o is porosity of the media. The
parameters such as the hydraulic head, pressure head and hydraulic gradient are
determined to arrive at a predicted value of the 7, - and ��7Z. The hydraulic head,
pressure head and hydraulic gradient are calculated from Figure 4.14 and Figure 4.15
as follow:
Across Dei-Dei to Kubwa:
1) Hydraulic Head = cj � j< 0 j? (4.3)
where,
j? � Water rise in the casing at Dei-Dei borehole
j< � Water rise in the casing pipe at Kubwa borehole
p? � Aquifer thickness at Dei-Dei
p< � Aquifer thickness at Kubwa, etc
2) Pressure head = jF � j? 0 p? � j< 0 p< (4.4)
3) Hydraulic gradient = jq � cj �! (4.5)
For the hydraulic head, pressure head and hydraulic gradient across Dei-Dei
to Kubwa is shown in Figure 4.14 using Darcy’s law:
1) Hydraulic Head = cj � j< 0 j?= 4.3 – 4.8 = ‒ 0.5 m
2a) Pressure head = jFr � j? 0 p?= 4.8 ‒ 2.3 = 2.5 m
b) Pressure head =jFs= j< 0 p< � tbu 0 vbw � xby�m
3) Hydraulic gradient = jq � cj �! � 0zb{�| yzv{bv�|! � ybv�%�vz}~
In this work, the hydraulic conductivity and porosity values for silt, sandy,
clay and clayey sand of vz}~ as reported elsewhere ( Fetter,1994) will be used.

103
� = 7015.1 � = horizontal difference between Dei-Dei and Kubwa
5 = (0.4 x 5.2) |‒2 = 2.08 |‒2
= diameter of boreholes (0.2 m each) x (�jFr � jFs)
o = 40 % 0r 0.4 = average Porosity for sediment size from 0.002- 2.0 mm (Fetter,
1994)
# � 1 x 10‒5
|�T ‒1 = hydraulic conductivity for silt, sand and clayey sand
(Loxnachar, 1999)
cj � j< 0 j? � 4.3 – 4.8 = ‒ 0.5 | = hydraulic head
jq � cj �! � 0zb{�| yzv{bv�|! � 0ybv�%�vz}~ = hydraulic gradient
therefore,
7 � �0$vz}~) X (0ybv�%�vz}~) = ybv�%�vz}?� ��� Darcy’s velocity (or Darcy’s
flux)
- � $ybv�%�vz}?�)���xbz� � �vb{����vz}� |�T}? = volume of water flowing through
the media.
Average linear velocity, ��7Z is given across Dei-Dei to Kubwa to be
7 o! � �vb{����vz}��|�T}? zbt!
Therefore,
��7Z � uby{����vz}���|�T}?�

104
Figure 4.14 Determination of hydraulic head, pressure head and hydraulic gradient
of the groundwater flowing across Dei-Dei to Kubwa
Across Gosa to Lugbe using Darcy’s law:
1) Hydraulic Head = cj � j< 0 j?= 5.2 – 1.8 = ubt�|
2 a) Pressure head = jFr � j? 0 p?= 1.8 ‒ 0.9 = zb��|
b) Pressure head =�jFs= j< 0 p< � {bx 0 xb� � xbu�|
3) Hydraulic gradient = jq � cj �! � ubt�| {xvvbx�|! � wb{�%�vz}�
� = 5211.2 | = horizontal difference between Gosa to Lugbe
p? � xbu�|
jFs
j? � tb��| j< � tbu�|
� � yzv{bv�|
p< � vbw�|
jFr
Kubwa Dei-Dei yz�| wz�|
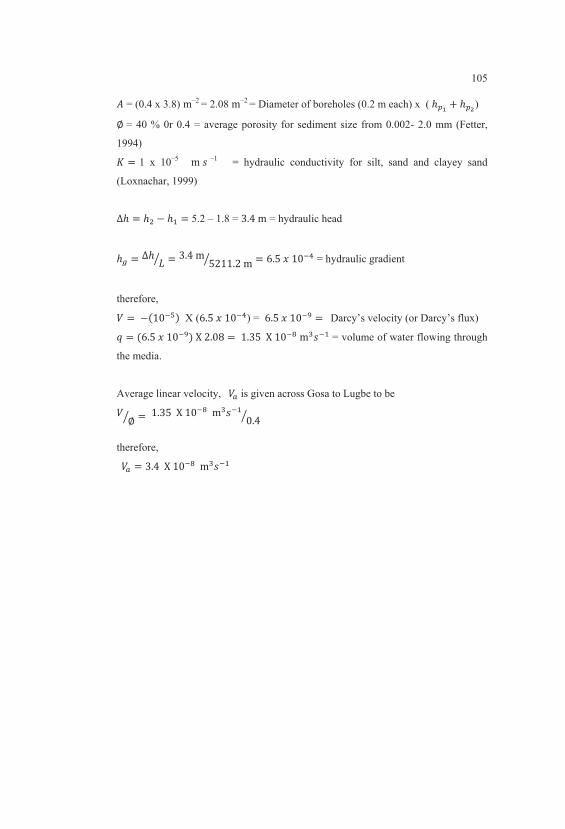
105
5 = (0.4 x 3.8) |‒2 = 2.08 |‒2
= Diameter of boreholes (0.2 m each) x (�jFr � jFs)
o = 40 % 0r 0.4 = average porosity for sediment size from 0.002- 2.0 mm (Fetter,
1994)
# � 1 x 10‒5
|�T ‒1 = hydraulic conductivity for silt, sand and clayey sand
(Loxnachar, 1999)
cj � j< 0 j? � 5.2 – 1.8 = ubt�| = hydraulic head
jq � cj �! � ubt�| {xvvbx�|! � wb{�%�vz}� = hydraulic gradient
therefore,
7 � �0$vz}~) X (wb{�%�vz}�) = wb{�%�vz}� ��� Darcy’s velocity (or Darcy’s flux)
- � $wb{�%�vz}�)���xbz� � �vbu{����vz}� |�T}? = volume of water flowing through
the media.
Average linear velocity, ��7Z is given across Gosa to Lugbe to be
7 o! � �vbu{����vz}���|�T}? zbt!
therefore,
��7Z � ubt����vz}���|�T}?�

106
Figure 4.15 Determination of hydraulic head, pressure head and hydraulic gradient
of the groundwater flowing across Lugbe to Gosa
From the above groundwater flow evaluation, it is shown that the average
linear velocity obtained from the calculations across Gosa to Lugbe is higher than
that of Dei-Dei to Kubwa. It can be concluded that the groundwater at Lugbe
recharges the Gosa area where low yield was found whereas Dei-Dei groundwater
recharges that of Kubwa considering the hydraulic heads across the two pairs of
drilled holes in different locations. It was noted that the flow in subsurface structures
at Gosa to Lugbe reported higher volume of water than that flows across Lugbe to
Gosa than the corresponding Dei-Dei to Kubwa which flows from higher depth to
lower depth and may be attributed to greater large scale fractures interconnected at
Lugbe borehole layers.
jF
tz�| {z |
j< � {bx�|
p< � xb��|
�j? � vb��|
p � zb��|
����� � {xvvbx�|
jF
Gosa Lugbe
107
4.4 Measurements of 238
U, 232
Th and 40
K in Subsurface Layers of Dei-Dei,
Kubwa, Gosa and Lugbe Boreholes
The objective of these measurements was to determine the concentrations of
238U,
232Th and
40K in different layers of the groundwater bearing formation, thus, to
infer the layer that constitutes the higher activity level and the geologic rock type.
Initially, the concentrations of 238
U and 232
Th of few selected samples were measured
using High Purity Germanium Gamma Spectrometry (HPGe) in Nuclear Laboratory,
Faculty of Science, Universiti Teknologi Malaysia for verification with neutron
activation analysis. The details of the gamma ray method used are discussed in
Section 3.4. The few samples were selected for neutron activation analysis (NAA) in
Malaysian Nuclear Agency (MNA) for verification of the present work. The closest
three out of the few selected samples were S1L7, S3L4 and S4L1 respectively. The
details of the NAA processes discussed in Section 3.4.
4.4.1 Verification of 238
U, 232
Th Using Neutron Activation Analysis (NAA)
Few samples were prepared and sent to Malaysian Nuclear Agency for
irradiation using PUSPATI TRIGA MARK II reactor. Each sample about 0.2 g was
prepared in a polyethylene vial and labelled accordingly. Each sample has duplicates
to ensure quality of the analytical technique. A uranium-thorium standard solution of
100 ppm U and 98 ppm Th was used. Approximately, 0.1000 g (ml) U-Th solution
was mixed with small amount of Silica (SiO2-IAEA) in a vial (2.5 ml) and placed in
an oven for 4 hours at 60 °C until dry; then the vial was labelled and sealed.
This technique was adopted in this work in order to verify the results obtained
using gross gamma method (HPGe GRS). The results of NAA method from
Malaysian Nuclear Agency (MNA) and gross gamma method using HPGe gamma
ray spectrometry are comparable as shown in Table 4.5. The results of the NAA and
direct method analysis for 238
U and 232
Th for three samples are in good agreement,
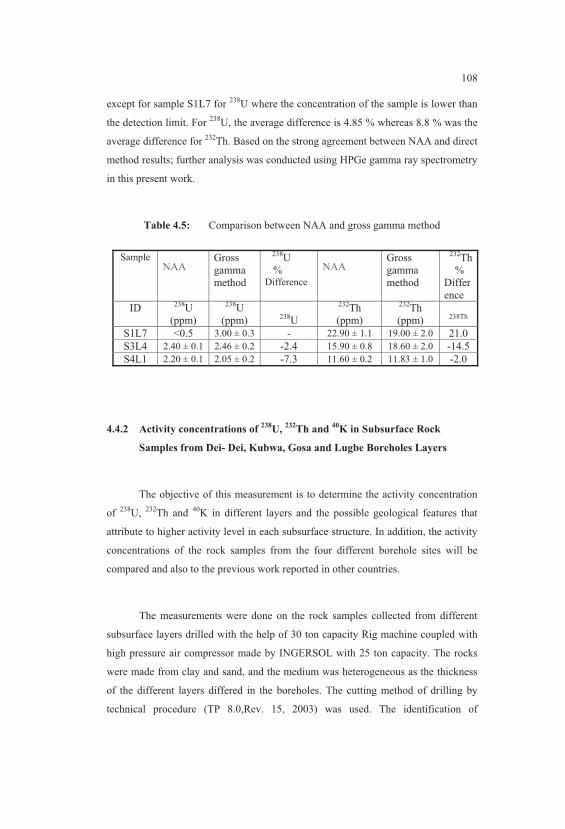
108
except for sample S1L7 for 238
U where the concentration of the sample is lower than
the detection limit. For 238
U, the average difference is 4.85 % whereas 8.8 % was the
average difference for 232
Th. Based on the strong agreement between NAA and direct
method results; further analysis was conducted using HPGe gamma ray spectrometry
in this present work.
Table 4.5: Comparison between NAA and gross gamma method
Sample NAA
Gross
gamma
method
238U
% Difference
NAA Gross
gamma
method
232Th
%
Differ
ence
ID 238
U
(ppm)
238U
(ppm)
238U
232Th
(ppm)
232Th
(ppm)
238Th
S1L7 <0.5 3.00 ± 0.3 - 22.90 ± 1.1 19.00 ± 2.0 21.0
S3L4 2.40 ± 0.1 2.46 ± 0.2 -2.4 15.90 ± 0.8 18.60 ± 2.0 -14.5
S4L1 2.20 ± 0.1 2.05 ± 0.2 -7.3 11.60 ± 0.2 11.83 ± 1.0 -2.0
4.4.2 Activity concentrations of 238
U, 232
Th and 40
K in Subsurface Rock
Samples from Dei- Dei, Kubwa, Gosa and Lugbe Boreholes Layers
The objective of this measurement is to determine the activity concentration
of 238
U, 232
Th and 40
K in different layers and the possible geological features that
attribute to higher activity level in each subsurface structure. In addition, the activity
concentrations of the rock samples from the four different borehole sites will be
compared and also to the previous work reported in other countries.
The measurements were done on the rock samples collected from different
subsurface layers drilled with the help of 30 ton capacity Rig machine coupled with
high pressure air compressor made by INGERSOL with 25 ton capacity. The rocks
were made from clay and sand, and the medium was heterogeneous as the thickness
of the different layers differed in the boreholes. The cutting method of drilling by
technical procedure (TP 8.0,Rev. 15, 2003) was used. The identification of

109
boundaries between layers with noticeably different particle sizes using visual
manual logging method and record the thickness as layer changes. Layer thickness
change may range from less than one metre to tens of metres. Distinct layers with
clearly marked on plastic sock with an indelible felt-tipped pen, using a single entry
for each layer on the plastic poly bag for easy identification.
A total of 31 rock samples were collected from the four boreholes in different
locations of the study area. In addition, the samples were labeled using borehole
number and depth drilled on each polyethylene bag as discussed in Section 3.2.5.
Measured concentrations of K, nuclides from 232
Th series (208
Tl, 228
Ac) and
238U series (
214Pb and
214Bi) in investigated rock samples for each location are
discussed in Section 4.4.3. The details of sample preparations for gamma analysis are
discussed in Section 3.3.
4.4.3 Activity Concentration of 238
U, 232
Th and 40
K in Dei-Dei Borehole
Rock Samples
In Dei-Dei borehole area, eleven (11) different layer samples were collected
lithologically. The samples were labeled accordingly as S1L1 to S1L11 up to below
ground the level of about 70 m. The objective is to determine the layer that
constitutes the higher activity level and the source rock in subsurface formation. The
measurement was done using HPGe detector, all the details of sample preparation,
analysis and calculations for gamma ray analysis are presented in Section 3.3 and
3.3.7 respectively.
The activity concentrations of 238
U, 232
Th and 40
K in each layer from Dei-Dei
borehole rock samples, S1L1 to S1L11 were measured as shown in Tables 4.6. 238
U
activity concentrations were calculated as the arithmetic means of the activities of
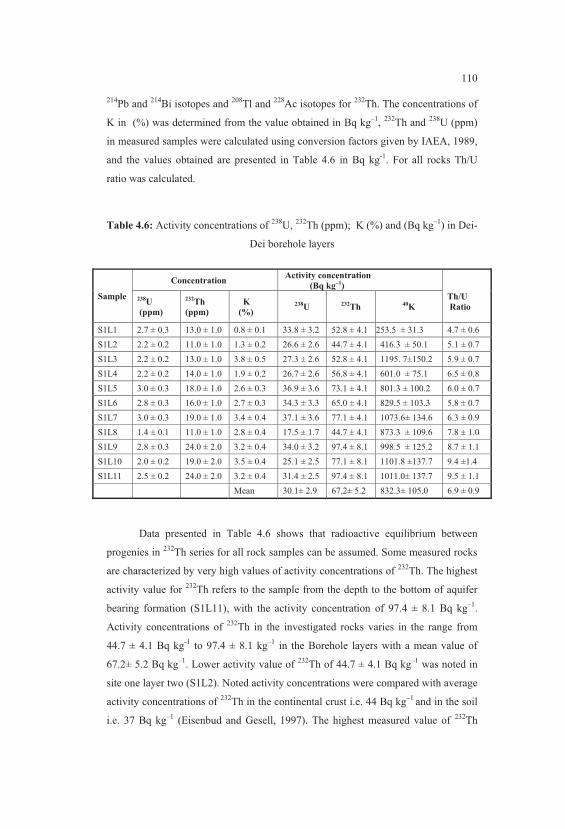
110
214Pb and
214Bi isotopes and
208Tl and
228Ac isotopes for
232Th. The concentrations of
K in (%) was determined from the value obtained in Bq kg‒1
, 232
Th and 238
U (ppm)
in measured samples were calculated using conversion factors given by IAEA, 1989,
and the values obtained are presented in Table 4.6 in Bq kg-1
. For all rocks Th/U
ratio was calculated.
Table 4.6: Activity concentrations of 238
U, 232
Th (ppm); K (%) and (Bq kg‒1
) in Dei-
Dei borehole layers
Sample
Concentration Activity concentration
(Bq kg‒1
)
238U
(ppm)
232Th
(ppm)
K
(%)
238U
232Th
40K
Th/U
Ratio
S1L1 2.7 ± 0.3 13.0 ± 1.0 0.8 ± 0.1 33.8 ± 3.2 52.8 ± 4.1 253.5 ± 31.3 4.7 ± 0.6
S1L2 2.2 ± 0.2 11.0 ± 1.0 1.3 ± 0.2 26.6 ± 2.6 44.7 ± 4.1 416.3 ± 50.1 5.1 ± 0.7
S1L3 2.2 ± 0.2 13.0 ± 1.0 3.8 ± 0.5 27.3 ± 2.6 52.8 ± 4.1 1195. 7±150.2 5.9 ± 0.7
S1L4 2.2 ± 0.2 14.0 ± 1.0 1.9 ± 0.2 26.7 ± 2.6 56.8 ± 4.1 601.0 ± 75.1 6.5 ± 0.8
S1L5 3.0 ± 0.3 18.0 ± 1.0 2.6 ± 0.3 36.9 ± 3.6 73.1 ± 4.1 801.3 ± 100.2 6.0 ± 0.7
S1L6 2.8 ± 0.3 16.0 ± 1.0 2.7 ± 0.3 34.3 ± 3.3 65.0 ± 4.1 829.5 ± 103.3 5.8 ± 0.7
S1L7 3.0 ± 0.3 19.0 ± 1.0 3.4 ± 0.4 37.1 ± 3.6 77.1 ± 4.1 1073.6± 134.6 6.3 ± 0.9
S1L8 1.4 ± 0.1 11.0 ± 1.0 2.8 ± 0.4 17.5 ± 1.7 44.7 ± 4.1 873.3 ± 109.6 7.8 ± 1.0
S1L9 2.8 ± 0.3 24.0 ± 2.0 3.2 ± 0.4 34.0 ± 3.2 97.4 ± 8.1 998.5 ± 125.2 8.7 ± 1.1
S1L10 2.0 ± 0.2 19.0 ± 2.0 3.5 ± 0.4 25.1 ± 2.5 77.1 ± 8.1 1101.8 ±137.7 9.4 ±1.4
S1L11 2.5 ± 0.2 24.0 ± 2.0 3.2 ± 0.4 31.4 ± 2.5 97.4 ± 8.1 1011.0± 137.7 9.5 ± 1.1
Mean 30.1± 2.9 67.2± 5.2 832.3± 105.0 6.9 ± 0.9
Data presented in Table 4.6 shows that radioactive equilibrium between
progenies in 232
Th series for all rock samples can be assumed. Some measured rocks
are characterized by very high values of activity concentrations of 232
Th. The highest
activity value for 232
Th refers to the sample from the depth to the bottom of aquifer
bearing formation (S1L11), with the activity concentration of 97.4 ± 8.1 Bq kg‒1
.
Activity concentrations of 232
Th in the investigated rocks varies in the range from
44.7 ± 4.1 Bq kg-1
to 97.4 ± 8.1 kg‒1
in the Borehole layers with a mean value of
67.2± 5.2 Bq kg‒1
. Lower activity value of 232
Th of 44.7 ± 4.1 Bq kg‒1
was noted in
site one layer two (S1L2). Noted activity concentrations were compared with average
activity concentrations of 232
Th in the continental crust i.e. 44 Bq kg‒1
and in the soil
i.e. 37 Bq kg‒1
(Eisenbud and Gesell, 1997). The highest measured value of 232
Th

111
activity concentration exceeds the average activity concentration refers to the
continental crust almost twice in S1L11, site one layer eleven (Maxwell et al.,
2013a).
In the same Dei-Dei borehole rock samples, the highest activity concentration
values of 238
U refer to the samples collected from the S1L7 with the values of 37.1 ±
3.6 Bq kg‒1
. Distinctly lower value was obtained from S1L8 with a value of 17.5 ±
1.7 Bq kg‒1
. 238
U concentration varies in the range from 17.5 ± 1.7 Bq kg‒1
to 37.1 ±
3.6 Bq kg‒1
respectively with a mean value of 30.1± 2.9 Bq kg‒1
in Dei-Dei. For
comparison, the arithmetic mean of the activity concentrations of 238
U from lower
Silesia equals to 35 Bq kg‒1
which is higher than the present work of 30.1± 2.9 Bq
kg‒1
. 238
U activity concentrations in granite from SzKlarska poreba (Karkonosze
granite) vary in the wide range from 15 to 119 Bq kg‒1
whereas in aplite and in mica
schist from SzKlarska Poreba 238
U activity concentrations are 66 ± 6 Bq kg‒1
and 54
± 9 Bq kg‒1
respectively (Przylibski, 2004). Comparing the activity concentrations
of 238
U with the average activity concentrations of 238
U reported for the continental
crust i.e. 36 Bq kg‒1
and for soil i.e. 22 Bq kg‒1
(Eisenbud and Gesell, 1997) with the
present work, the average value of 30.1± 2.9 Bq kg‒1
for 238
U is lower.
As shown in Table 4.6 for Dei-Dei borehole, 40
K activity concentrations for
all the rock samples are greater than 200 Bq kg‒1
. In first and second layers, the
activity concentrations of the radionuclide do not differ much, but the lowest value
was noted in first layer, S1L1 with a value of 253.5 ± 31.3 Bq kg‒1
,whereas the
highest value refers to the sample layer three (S1L3) with a value of 1195.7 ± 150.2
Bq kg‒1
respectively. The range varies from 253.5 ± 31.3 Bq kg‒1
to 1195.7 ± 150.2
Bq kg-1
in Dei-Dei borehole with a mean value of 832 ± 103 Bq kg‒1
. In contrast
with the range of the average activity concentrations of 40
K reported for the
continental crust i.e. 850 Bq kg‒1
and for soil i.e. 400 Bq kg‒1
(Eisenbud and Gesell,
1997), it can be seen that measured activity concentrations associated with K decay
are distinctly higher than the average concentration of this isotope in the continental
crust for all samples. The percentage is higher in layer three (S1L3) for about 3.82%.
The plot of activity concentration of 232
Th, 238
U and K versus sample ID in Dei-Dei

112
is presented in Figure 4.16 indicating almost 100 % increase of 232
Th activity with
depth (Maxwell et al., 2013a).
Figure 4.16 Activity concentration of 238
U, 232Th
and 40
K versus sample ID in Dei-
Dei borehole, Abuja.
0
200
400
600
800
1000
1200
S1L1 S1L2 S1L3 S1L4 S1L5 S1L6 S1L7 S1L8 S1L9 S1L10 S1L11
33.62 26.46 27.17 26.51 36.83 34.2 36.93 17.43
33.85 24.95 31.26
52.28 45.02 51.06 55.59 70.89 66.33 76.86 46.1 95.31 77.33 97.29
253.69
415.07
1195.34
601.14
800.47 827.94
1073.47
873.87
997.12
1101.08
1010.66
Conc. ((Bq/kg)
Sample CCode
U-238 Th-232 K-40

113
4.4.4 Th/U Ratio in Rock Samples from Dei-Dei Borehole
The Th/U ratio varies ranging from 4.7 ± 0.6 to 9.5 ± 1.1 as shown in Table
4.6. The highest value refers to layer eleven (S1L11) with a value of 9.45 ± 1.1
whereas the lowest value was noted in the sample collected from first layer(S1L1)
with a value of 4.7 ± 0.6 and rock type shows laterite top soil (Maxwell et al.,
2013a). Obtained Th/U ratios are very high, higher than data published in literature
relating to rocks of Karkonosze-Irera block. For example, in hornfel from Death
Bend area, Th/U ratio equals to 3 and Th/U concentration ratio in rocks in the
environs of Swieradow Zdroj varies between 1.5 and 3.2 (Malczewski et al., 2005),
is low compared to 9.5 ± 1.1 obtained in the present study by a factor of 3.
Th/U concentration ratio given by (Eisenbud and Gesell, 1997) for the
continental crust equals to 1.2 and for granite is 1.8. Cited values are distinctly lower
than Th/U concentration ratio obtained from the investigated rock samples from Dei-
Dei borehole site. In addition, the value of Th/U ratio in the present work is greater
than the measured value in granite from Szklarska Poreba that is equals to 3.2 (Plewa
and Plewa, 1992). Obtained results suggest that very high content of 232
Th and high
content of 238
U in investigated rock samples were related to being rocks formed due
to thermal metamorphism and metasomatic processes (Maxwell et al. 2013a). These
processes seem to be responsible for high level of radioactivity of rocks in the area.
The highest value of Th/U concentration ratio refers to the deepest layer up to 70 m,
S1L11. The lowest values of Th/U ratio concentrations was measured in rock sample
collected at the laterite top soil to the depth of about 6 m thick, this lower value could
be assigned to erosion impact on the surface of the soil.
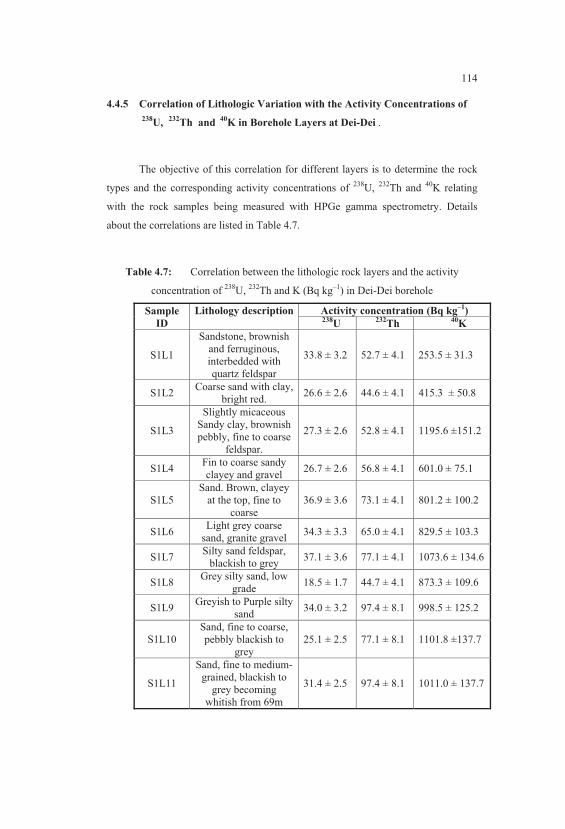
114
4.4.5 Correlation of Lithologic Variation with the Activity Concentrations of
238
U, 232
Th and 40
K in Borehole Layers at Dei-Dei .
The objective of this correlation for different layers is to determine the rock
types and the corresponding activity concentrations of 238
U, 232
Th and 40
K relating
with the rock samples being measured with HPGe gamma spectrometry. Details
about the correlations are listed in Table 4.7.
Table 4.7: Correlation between the lithologic rock layers and the activity
concentration of 238
U, 232
Th and K (Bq kg‒1
) in Dei-Dei borehole
Sample
ID
Lithology description Activity concentration (Bq kg‒1
)
238
U 232
Th 40
K
S1L1
Sandstone, brownish
and ferruginous,
interbedded with
quartz feldspar
33.8 ± 3.2 52.7 ± 4.1 253.5 ± 31.3
S1L2 Coarse sand with clay,
bright red. 26.6 ± 2.6 44.6 ± 4.1 415.3 ± 50.8
S1L3
Slightly micaceous
Sandy clay, brownish
pebbly, fine to coarse
feldspar.
27.3 ± 2.6 52.8 ± 4.1 1195.6 ±151.2
S1L4 Fin to coarse sandy
clayey and gravel 26.7 ± 2.6 56.8 ± 4.1 601.0 ± 75.1
S1L5
Sand. Brown, clayey
at the top, fine to
coarse
36.9 ± 3.6 73.1 ± 4.1 801.2 ± 100.2
S1L6 Light grey coarse
sand, granite gravel 34.3 ± 3.3 65.0 ± 4.1 829.5 ± 103.3
S1L7 Silty sand feldspar,
blackish to grey 37.1 ± 3.6 77.1 ± 4.1 1073.6 ± 134.6
S1L8 Grey silty sand, low
grade 18.5 ± 1.7 44.7 ± 4.1 873.3 ± 109.6
S1L9 Greyish to Purple silty
sand 34.0 ± 3.2 97.4 ± 8.1 998.5 ± 125.2
S1L10
Sand, fine to coarse,
pebbly blackish to
grey
25.1 ± 2.5 77.1 ± 8.1 1101.8 ±137.7
S1L11
Sand, fine to medium-
grained, blackish to
grey becoming
whitish from 69m
31.4 ± 2.5 97.4 ± 8.1 1011.0 ± 137.7
115
The data presented in Table 4.7 shows that the highest value for 40
K refers to
the sample layer three (S1L3). Correlating the 40
K activity concentration with the
lithology in S1L3, it could be observed that the highest 40
K activity value
corresponds to slightly micaceous sandy clay, brownish pebble, fine to coarse
feldspar. The geologic types that constitute such high activity level are inferred to be
the cross-bedding of undifferentiated Pan-African granite and biotite-homblende
granodiorite as shown in Appendix B. The lowest value noted in S1L1 is due to
sandstone, brownish and ferruginous, interbedded with quartz feldspar. The presence
of ferrugenous composition in the host rock samples could have masked off the
activity of 40
K thereby reporting low activity level in the rock sample.
Correlation between lithologic rock layers and activity of 232
Th in Dei-Dei
borehole presented in Table 4.7 shows the highest value in S1L11 and noted that the
rock sample from that layer is made of sand, fine to medium-grained, blackish to
grey becoming whitish from the depth of 69 m to 70 m. It could be that the activity
concentration of natural radionuclides in rocks are connected to radionuclides in
groundwater which reacts with soil and bedrock and release quantities of dissolved
components, depending on the mineralogical and geochemical composition of the
rock. The redox conditions and the residence time of groundwater in the soil and
bedrock may also contribute to such higher value in Dei-Dei borehole. The geologic
type is inferred to be Pan-African granite (undifferentiated). The lower value
reported in S1L2 constitute coarse sand interbedded with clay, bright red. This low
activity level could be caused by the deformed and fractured characteristic of the
layer formation due to tectonic activity in the area.
The correlation of rock samples from the subsurface layers and measured
activity concentration of 238
U in Dei-Dei borehole indicates that the highest values
refer to the samples collected from the S1L5 and S1L7 respectively as shown in
Table 4.7. It can be observed that the major rock minerals were sand, brown clayey
at the top, fine to coarse for S1L5 and silty sand feldspar, blackish to grey were the
major rock lithology for S1L7 respectively. Such lithologic rock type could be
inferred to Pan-African granite with some fractions of biotite homblende
metamorphosed together in the samples. Distinctly lower value was noted in S1L8

116
with lithologic description of grey silty sand, low grade which could support
oxidization of 238
U in aqueous phase since the aquiferous zone of the water bearing
formation extended to the layer; and the disperse the activity to neighbouring layers,
S1L7 and S1L9, respectively (Maxwell et al., 2013). The geology could be
weathered Pan-African granite.
4.4.6 Activity Concentration of 232
Th, 238
U and 40
K in Kubwa Borehole Rock
Samples
In Kubwa borehole source, a total of nine (9) different layer samples were
collected lithologically. The samples were labeled accordingly ranging from S2L1 to
S2L9 below ground level up to about 60 m. The activity concentrations of 238
U, 232
Th
and 40
K in each layer from Kubwa borehole rock samples, S2L1 to S2L9 were
measured and presented in Tables 4.8.
Table 4.8: Activity concentrations of 238
U, 232
Th (ppm); K (%) and (Bq kg
‒1) in
Kubwa borehole layers
Sample
Concentration Activity concentration
(Bq kg‒1
)
238U
(ppm)
232Th
(ppm)
K
(%) 238
U
232Th
40K
Th/U
Ratio
S2L1 4.2 ± 0.4 21.0 ± 2.0 0.38 ± 0.1 51.7 ± 5.0 85.3 ± 8.1 118.9 ± 15.7 5.01 ± 0.7
S2L2 1.9 ± 0.1 8.0 ± 1.0 1.27 ± 0.2 23.0 ± 1.2 32.5 ± 4.1 397.5 ± 50.1 4.30 ± 0.6
S2L3 2.6 ± 0.3 14.0 ± 1.0 1.94 ± 0.3 32.6 ± 3.7 56.8 ± 4.1 607.2 ± 78.3 5.30 ± 0.7
S2L4 3.2 ± 0.3 9.0 ± 1.0 2.03 ± 0.3 39.0 ± 3.7 36.5 ± 4.1 635.4 ± 81.4 2.85 ± 0.4
S2L5 1.2 ± 0.1 10.0 ± 1.0 1.63 ± 0.2 15.7 ± 1.2 40.6 ± 4.1 510.2 ± 62.6 8.40 ± 1.1
S2L6 2.8 ± 0.3 17.0 ± 1.0 2.25 ± 0.3 34.3 ± 3.7 69.0 ± 4.1 704.3 ± 87.6 6.12 ± 0.8
S2L7 3.5 ± 0.3 19.0 ± 2.0 2.22 ± 0.3 42.7 ± 3.7 77.1 ± 8.1 694.9 ± 84.5 5.49 ± 0.8
S2L8 3.3 ± 0.3 19.0 ± 2.0 2.36 ± 0.3 40.3 ± 3.7 77.1 ± 8.1 738.7 ± 93.9 5.83 ± 0.8
S2L9 2.5 ± 0.2 17 ± 1.0 2.40 ± 0.3 31.1 ± 2.5 69.0 ± 4.1 751.2 ± 93.9 6.75 ± 0.7
Mean 34.4± 3.2 60.5± 5.4 573.1± 72.0 5.56± 0.7

117
Figure 4.17 Activity concentration of 238
U, 232Th
and 40
K versus sample ID in
Kubwa borehole, Abuja
0
100
200
300
400
500
600
700
800
S2L1 S2L2 S2L3 S2L4 S2L5 S2L6 S2L7 S2L8 S2L9
51.56
22.87 32.46 38.85 14.62
34.2 42.61 40.14 31.05
83.69 31.61
57.19 36.87
40.13
68.88 76.99 76.86
69.46
118.95
398.62
605.36
635.52
510.19
704.92 695.46
737.93 750.28
Co
nc.
(B
q/k
g)
Sample Code
u-238 Th-232 K-40

118
Data presented in Table 4.8 is the elemental concentration and activity
concentrations of 238
U, 232
Th and 40
K from Kubwa borehole samples. Table 4.8
shows that the higher activity concentration of 232
Th refers to sample layer one
(S2L1) with the value of 85.3 ± 8.1 Bq kg‒1
. Sample collected from second layer
(S2L2) has value of 32.5 ± 4.1 Bq kg‒1
and is distinctly lower. It was observed that
S2L7 and S2L8 activity concentrations of 232
Th reported similar activity level with
values of 77.1 ± 8.1 and 77.1 ± 8.1 Bq kg‒1
respectively. This closeness in activity
values may be attributed to metamorphism process of Pan-African events. The
activity concentrations of 232
Th varies from 32.5 ± 4.1 to 85.3 ± 8.1 Bq kg‒1
with a
mean value of 60.5 ± 5.4 Bq kg‒1
in Kubwa borehole. Noted activity concentrations
were compared with average activity concentrations of 232
Th in the continental crust
as reported by (Eisenbud and Gesell, 1997). The measured value of 232
Th activity
concentration in (S2L1) exceeds the average activity concentration compared to the
continental crust almost twice, (Maxwell et al., 2013a).
Measured rocks are characterized by radioactivity of 238
U in Kubwa borehole.
The highest value refers to the sample collected from S2L1, (51.7 ± 5.0 Bq kg‒1
).
Distinctly lower value was obtained from S2L5 with a value of 15.7 ± 1.2 Bq kg‒1
as
shown in Table 4.8. 238
U concentration in Kubwa borehole varies ranging from 15.7
± 1.2 Bq kg-1
to 51.7 ± 5.0 Bq kg-1
respectively, with a mean value of 34.4± 3.2 Bq
kg‒1
. Comparing the range of 15 ± 1 Bq kg‒1
to 52 ± 5 Bq kg‒1
of 238
U in the present
study with 238
U activity concentrations in granite from SzKlarska poreba
(Karkonosze granite) varying widely from 15 to 119 Bq kg‒1
, they are within the
normal range. Przylibski, (2004) reported 66 ± 6 Bq kg‒1
and 54 ± 9 Bq kg‒1
for 238
U
with a mean value of 35 Bq kg‒1
from lower Silesia. Comparing the mean value of
the present work, 34 Bq kg‒1
with Przylibski, (2004), they are in good agreement.
Measured activity concentrations of 238
U were compared with the average activity
concentrations of 238
U reported by Eisenbud and Gesell (1997) in continental crust;
the average activity concentrations of 238
U in the present study are higher except in
samples S2L2, S2L3, S2L5 and S2L9 respectively, (Maxwell et al., 2013a).
As shown in Table 4.8, 40
K activity concentrations for all the rock samples
are greater than 100 Bq kg‒1
. The activity concentrations of 40
K did not differ much,

119
but the lowest value was noted in first layer (S2L1) with a value of 118.9 ± 15.7 Bq
kg‒1
, whereas the highest value refers to the sample layer nine (S2L9) with a value of
751.2 ± 93.9 Bq kg‒1
. The range varies between 118.9 ± 15.7 Bq kg-1
to 751.2 ± 93.9
Bq kg-1
in Kubwa borehole with a mean value of 573.1± 72.0 Bq kg‒1
. Compare to
the range of the average activity concentrations of 40
K reported by Eisenbud and
Gesell, (1997), it can be seen that the measured activity concentrations associated
with 40
K decay are distinctly lower than the average concentration reported in the
continental crust for some samples from Kubwa Borehole. In Figure 4.17 for Kubwa
borehole samples, it can be observed that 40
K increases with depth compared to Dei-
Dei borehole samples as shown in Figure 4.16. They strongly agree with the distinct
increase of 40
K with depth below ground level. It may be due to the process of
deposition of sediments in the subsurface layers within the region which might differ
in other areas.
4.4.7 Th/U Ratio in Rock Samples from Kubwa Borehole
The Th/U ratio varies in the range from 2.85 ± 0.4 to 8.40 ± 1.1. The highest
value refers to sample layer five (S2L5) with a value of 8.40 ± 1.1 whereas the
lowest value was noted in the sample collected from fourth layer (S2L4) with a value
of 2.85 ± 0.4 as shown in Table 4.8. Obtained Th/U concentration ratios are higher in
the present work compared to data published in literature concerning rocks of
Karkonosze-Irera block, by Malczewski et al., (2005) and Eisenbud and Gesell
(1997) from the investigated rock samples at Kubwa borehole (Maxwell et
al.,2013b).

120
4.4.8 Correlation of Lithologic Variation and the Activity Concentration
of 238
U, 232
Th and 40
K in Borehole Layers at Kubwa .
The objective of this correlation of different layers is to determine the
relationship between rock type and the corresponding activity concentrations of 238
U,
232Th and
40K with the rock samples being measured with HPGe gamma ray
spectrometry. Details of the correlations are listed in Table 4.9.
Table 4.9: Correlation between the lithologic rock type and the activity
concentration of 238
U, 232
Th and 40
K (Bq kg‒1
) in Kubwa borehole
Comparison of the lithological layer variations and the activity concentrations
of 238
U, 232
Th and 40
K in Kubwa area as shown in Table 4.9, it can be noted that
brownish ash sandy clay, gravely interbedded, constituted the highest activity value
for 238
U and 232
Th as in S2L1 which is inferred to be porphyroblastic gneisse and
Sample
ID Lithology description
Activity concentration (Bq kg‒1
)
238U
232Th
40K
S2L1 Brownish ash sandy clay
gravely interbedded. 51.8 ± 4.9 85.3 ± 8.1 118.9 ± 15.7
S2L2 Clay with bright red. 22.9 ± 1.2 32.5 ± 4.1 397.5 ± 50.1
S2L3 Sandy clay micaceous,
brownish with feldspar. 32.6 ± 3.7 56.8 ±4.1 607.2 ± 78.3
S2L4 Fin to coarse sandy
clayey and gravel smoky 39.0 ± 3.7 36.5 ± 4.1 635.4 ± 81.4
S2L5 Clay sandy, fine grain
size, darkish ash feldspar 14.7 ± 1.2 40.6 ± 4.1 510.2 ± 62.6
S2L6 Silty clay, interbedded,
bright ash to glacy
feldspar.
34.3 ± 3.7 69.0 ± 4.1 704.3 ± 87.6
S2L7 Fine to coarse ashy
sandy clay. 42.7 ± 3.7 77.1 ± 8.1 694.9 ± 84.5
S2L8 Fine to coarse sand,
greyish. 40.3 ± 3.7 77.1 ± 8.1 738.7 ± 93.9
S2L9 Micaceous - gravely
sandy, fine-medium
coarse darkish to grey.
31.1 ± 2.5 69.0 ± 4.1 751.2 ± 93.9
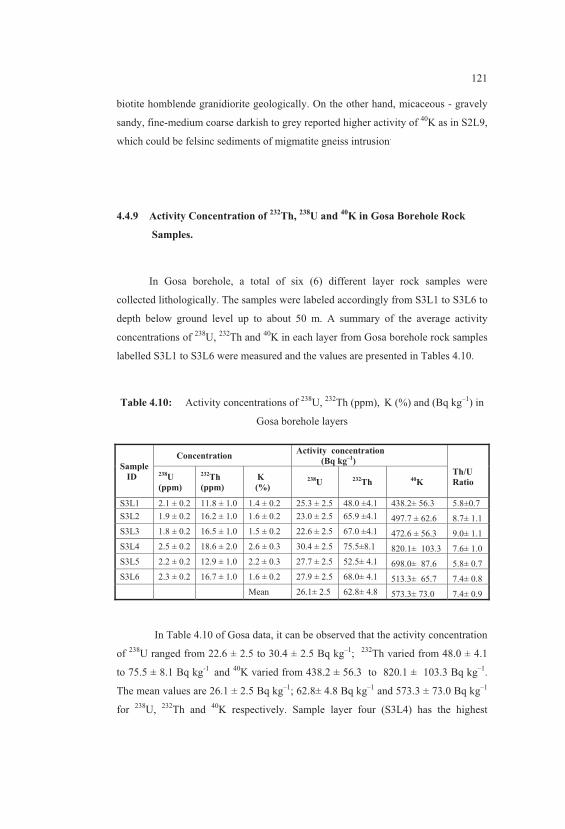
121
biotite homblende granidiorite geologically. On the other hand, micaceous - gravely
sandy, fine-medium coarse darkish to grey reported higher activity of 40
K as in S2L9,
which could be felsinc sediments of migmatite gneiss intrusion.
4.4.9 Activity Concentration of 232
Th, 238
U and 40
K in Gosa Borehole Rock
Samples.
In Gosa borehole, a total of six (6) different layer rock samples were
collected lithologically. The samples were labeled accordingly from S3L1 to S3L6 to
depth below ground level up to about 50 m. A summary of the average activity
concentrations of 238
U, 232
Th and 40
K in each layer from Gosa borehole rock samples
labelled S3L1 to S3L6 were measured and the values are presented in Tables 4.10.
Table 4.10: Activity concentrations of 238
U, 232
Th (ppm), K (%) and (Bq kg
‒1) in
Gosa borehole layers
Sample
ID
Concentration Activity concentration
(Bq kg‒1
)
238U
(ppm)
232Th
(ppm)
K
(%)
238U
232Th
40K
Th/U
Ratio
S3L1 2.1 ± 0.2 11.8 ± 1.0 1.4 ± 0.2 25.3 ± 2.5 48.0 ±4.1 438.2± 56.3 5.8±0.7
S3L2 1.9 ± 0.2 16.2 ± 1.0 1.6 ± 0.2 23.0 ± 2.5 65.9 ±4.1 497.7 ± 62.6 8.7± 1.1
S3L3 1.8 ± 0.2 16.5 ± 1.0 1.5 ± 0.2 22.6 ± 2.5 67.0 ±4.1 472.6 ± 56.3 9.0± 1.1
S3L4 2.5 ± 0.2 18.6 ± 2.0 2.6 ± 0.3 30.4 ± 2.5 75.5±8.1 820.1± 103.3 7.6± 1.0
S3L5 2.2 ± 0.2 12.9 ± 1.0 2.2 ± 0.3 27.7 ± 2.5 52.5± 4.1 698.0± 87.6 5.8± 0.7
S3L6 2.3 ± 0.2 16.7 ± 1.0 1.6 ± 0.2 27.9 ± 2.5 68.0± 4.1 513.3± 65.7 7.4± 0.8
Mean 26.1± 2.5 62.8± 4.8 573.3± 73.0 7.4± 0.9
In Table 4.10 of Gosa data, it can be observed that the activity concentration
of 238
U ranged from 22.6 ± 2.5 to 30.4 ± 2.5 Bq kg‒1
; 232
Th varied from 48.0 ± 4.1
to 75.5 ± 8.1 Bq kg-1
and 40
K varied from 438.2 ± 56.3 to 820.1 ± 103.3 Bq kg‒1
.
The mean values are 26.1 ± 2.5 Bq kg‒1
; 62.8± 4.8 Bq kg‒1
and 573.3 ± 73.0 Bq kg‒1
for 238
U, 232
Th and 40
K respectively. Sample layer four (S3L4) has the highest

122
activities for 238
U, 232
Th and 40
K with values of 30.4 ± 2.5 Bq kg‒1
, 75.5 ± 8.1 Bq kg-
1 and 820.1 ± 103.3 Bq kg
‒1 respectively in a single layer. The lowest values of
238U,
232Th and
40K were observed in different layers. The lower activity of
238U was noted
in site three layer three (S3L3) with a value of 22.6 ± 2.5 Bq kg‒1
whereas site three
layer one (S3L1) reported the lowest activities for 232
Th and 40
K with values of 48.0
± 4.1 Bq kg‒1
and 438.2 ± 56.3 Bq kg‒1
respectively (Maxwell et al., 2013b). The
average activity concentration for 238
U reported in continental crust is 36 Bq kg-1
and
for soil is 22 Bq kg-1
, for 232
Th, the value for continental crust is 44 Bq kg‒1
and for
soil is 37 Bq kg‒1
and for 40
K, the value for continental crust is 850 Bq kg‒1
and in
soil 400 Bq kg‒1
. At Gosa borehole, the activity for 238
U is close to the report by
Eisenbud and Gesell, (1997), whereas the highest value for 232
Th is 76 Bq kg‒1
which
exceeds the value for continental crust by a factor of 1.7. In the case of 40
K, it is
820.1 ± 103.3 Bq kg‒1
lower compared to 850 Bq kg‒1
reported by Eisenbud and
Gesell, (1997). In Figure 4.18, it can be observed that the 238
U, 232
Th and 40
K
reported higher in a single sample layer four (S3L4) which may have been as a result
of deformed nature of sample layer three (S3L3) by distributing its activities to the
neighbouring layer four downward (S3L4), (Maxwell et al., 2013b).

123
Figure 4.18 Activity concentration of 238
U, 232Th
and 40
K versus
sample ID in Gosa borehole, Abuja
0
100
200
300
400
500
600
700
800
900
S3L1 S3L2 S3L3 S3L4 S3L5 S3L6
22.9 22.89 22.5 30.24 27.61 27.86
45.21 65.46 66.56 75.02 52.09 67.5
436.73
495.86 473.87
820.82
697.39
512.42
Co
nc.
(B
q/k
g)
Sample ID
U-238 Th-232 K-40
124
4.4.10 Th/U Ratio in Rock Samples from Gosa Borehole
The Th/U ratio in Gosa borehole ranged from 5.55 ± 0.7 to 9.02 ± 1.1 as
shown in Table 4.10. Sample layer three (S3L3) reported the highest Th/U ratio of
9.02 ± 1.1 whereas Sample S3L1 and S3L5 have the lowest Th/U ratio of 5.77 ± 0.7.
Th/U ratio given by Eisenbud and Gesell (1997) for the continental crust equals to
1.2 and for granite is 1.8. At Gosa borehole, the Th/U ratio is 7 and 5 times higher
than the average values for continental crust and granite respectively. For example,
in hornfel from Death Bend area, Th/U is 3 and Th/U ratio in rocks in the environs of
Swieradow Zdroj varies between 1.5 and 3.2 respectively, (Malczewski, 2005). In
comparison with the present work at Gosa, the Th/U ratio of 9.02 exceeds the report
from Malczewski (2005) by 3 times (Maxwell et al., 2013b).
4.4.11 Correlation of Lithologic Variation and the Activity Concentrations of
238
U, 232
Th and 40
K in Borehole Layers at Gosa
The objective of correlating different layers is to determine the rock type and
the corresponding activity concentrations of 238
U, 232
Th and 40
K being measured with
HPGe gamma ray spectroscopy at Gosa borehole layers. Details of the correlations
are listed in Table 4.11.

125
Table 4.11: Correlation between the lithologic rock type and the activity
concentration of 238
U, 232
Th and 40
K (Bq kg‒1
) in Gosa borehole.
Correlating the lithological arrangement of the layers with the corresponding
activity concentrations of 238
U, 232
Th and 40
K to determine the rock type with the
highest activity level are shown in Table 4.11 for Gosa borehole. It is noted that
micaceous clayey, grey to black rock constituted the highest activity value which is
inferred to be porphyroblastic gneisse and biotite homblende granodiorite
geologically for 238
U, 232Th
and 40
K in the same sample layer four (S3L4). The sandy
clay, fine to medium, reddish to yellow and clay sandy feldspar Yellowish brown
pebbly in S3L2, S3L3 and S3L1 constituted the lower activity values for 238
U and
40K respectively in Gosa area. This may be due to the presence of intrusion of basic
and altrabasic minerals in a minor quantity that would have turned sandy clay to
yellowish at a reasonable depth.
Sample
ID Lithology description
Activity concentration (Bq kg-1
)
232 U
232Th
40K
S3L1 Sandy clay, reddish
brown laterite top soil. 25.3 ± 2.5 48.0 ± 4.1 438.2 ± 56.3
S3L2 Sandy clay, fine to
medium, reddish to
yellow.
23.0 ± 2.5 65.9 ± 4.1 497.7 ± 62.6
S3L3 Clay sandy feldspar
Yellowish brown
pebbly
22.6 ± 2.5 67.0 ± 4.1 472.6 ± 56.3
S3L4 Micaceous clayey, grey
to black 30.4 ± 2.5 75.5 ± 8.1 820.1 ± 103.3
S3L5 Sandy shinny greyish to
black feldspar. 27.7 ± 2.5 52.5 ± 4.1 698.0 ± 87.6
S3L6 Fine medium shinny,
qartz interbed, greyish
ash feldspar
27.9 ± 2.5 68.0 ± 4.1 513.3 ± 65.7

126
4.4.12 Activity Concentrations of 232
Th, 238
U and 40
K in Lugbe Borehole
Rock Samples
A total of five (5) samples were collected from the subsurface layers at Lugbe
and labeled accordingly for easy identifications which are from S4L1 to S4L5 below
ground level up to the depth of about 40 m. The objective is to determine the source
rock that gave the highest activity level of radionuclides in the subsurface formation
at Lugbe.
A summary of the average activity concentrations of 238
U, 232
Th and K in
each subsurface layer from Lugbe borehole rock samples, S4L1 to S4L5 were
measured are presented in Tables 4.12. 238
U activity concentrations were calculated
as the arithmetic means of the activities fot 214
Pb and 214
Bi isotopes and 208
Tl and
228Ac isotopes for
232Th. The concentrations of
40K (%),
232Th and
238U (ppm) in
measured samples were calculated using conversion factors given by IAEA, 1989 are
as shown in Table 4.12 in Bq kg‒1
. For all rocks Th/U ratio was calculated.
Table 4.12: Activity concentrations of 238
U, 232
Th (ppm), K (%) and (Bq kg‒1
) in
Lugbe borehole layers.
Sample
ID
Concentration Activity concentration
(Bq kg‒1
)
238U
(ppm)
232Th
(ppm)
K
(%)
238U
232Th
40K
Th/U
Ratio
S4L1 1.8 ± 0.2 11.2±1.0 3.2± 0.4 22.6 ± 2.5 45.5± 4.1 1011.0±128.3 6.1± 0.9
S4L2 1.5 ± 0.1 10.7±1.0 3.1± 0.4 18.0 ± 1.2 43.6± 4.1 970.3±122.7 7.4± 0.9
S4L3 1.7 ± 0.2 12.0 ±1.0 2.9± 0.4 21.5 ± 2.5 48.6± 4.1 907.7±115.8 6.9± 1.0
S4L4 1.8 ± 0.2 12.2±2.0 2.8± 0.4 21.9 ± 2.5 49.6 ±8.1 870.1±110.6 6.9± 1.4
S4L5 1.3 ± 0.1 11.5±1.0 2.6± 0.3 16.1 ± 1.2 46.7 ±4.1 816.9±103.3 8.9± 1.0
Mean 20.0± 2.0 46.8± 4.9 915.2± 116.1 7.2± 1.0
In Table 4.12, it is noted that the activity concentration of 238
U varied from
16.1 ± 1.2 to 22.6 ± 2.5 Bq kg‒1
, 232
Th varied from 43.6 ± 4.1 to 49.6 ± 8.1 Bq kg‒1
,
and 40
K varied from 816.9 ± 103.3 to 1011.0 ± 128.3 Bq kg‒1
with mean values of

127
20.0 ± 2.0 Bq kg‒1
, 46.8 ± 4.9 Bq kg‒1
and 915.2 ± 116.1 Bq kg‒1
respectively for
238U,
232Th and
40K in Lugbe borehole. In Table 4.12 , rock sample layer one (S4L1)
from Lugbe borehole reported the highest activity concentrations for 238
U and K with
values 22.6 ± 2.5 Bq kg‒1
and 1011.0 ± 128.3 Bq kg‒1
respectively. Sample layer
four (S4L4) reported highest activity concentration for 232
Th with a value 49 ± 4 Bq
kg‒1
. The lowest values were obtained in same sample layer five (S4L5) for 238
U and
40K with values 16.1 ± 1.2 Bq kg
‒1 and 816.9 ± 103.3 Bq kg
‒1 for
238U and
40K
respectively whereas Sample layer two (S4L2) reported the lowest 232
Th with a value
of 44 ± 4 Bq kg-1
(Maxwell et al., 2013b). The average activity concentration for
238U in Lugbe borehole rock samples is 20 Bq kg
‒1, 47 Bq kg
‒1 for
232Th and 915 Bq
kg‒1
for 40
K. The average activity concentrations for
238U reported in continental crust
is 36 Bq kg‒1
and for soil is 22 Bq kg-1
, for 232
Th, continental crust is 44 Bq kg-1
and
for soil is 37 Bq kg‒1
and for K, continental crust is 850 Bq kg‒1
and for soil 400 Bq
kg‒1
, Eisenbud and Gesell (1997). Compared the values of the present work from
Lugbe borehole rock samples to Eisenbud and Gesell (1997), the activity
concentration of 238
U and 232
Th are within the range but for 40
K, it is 1.2 times higher
than the report by Eisenbud and Gesell (1997). The 19.22 % decrease in activity
concentration of 40
K with depth is noted at a glance in Figure 4.19. This decrease in
activity concentrations of 40
K with depth could be attributed to the chemical
weathering and magma flow which may have deposited felnsic sediments with depth
during the cooling in the metamorphic processes in the area, , (Maxwell et al.,
2013b).
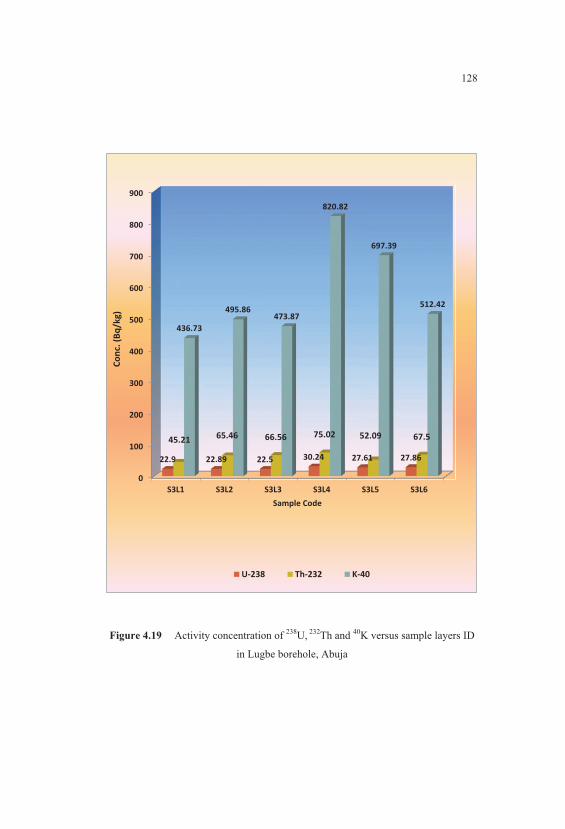
128
Figure 4.19 Activity concentration of 238
U, 232
Th and 40
K versus sample layers ID
in Lugbe borehole, Abuja
0
100
200
300
400
500
600
700
800
900
S3L1 S3L2 S3L3 S3L4 S3L5 S3L6
22.9 22.89 22.5 30.24 27.61 27.86
45.21 65.46 66.56 75.02 52.09 67.5
436.73
495.86 473.87
820.82
697.39
512.42
Co
nc.
(B
q/k
g)
Sample Code
U-238 Th-232 K-40
129
4.4.13 Th/U Ratio in Rock Samples from Lugbe Borehole
The Th/U ratio ranged from 6.13 ± 0.8 to 8.85 ± 1.0 as shown in Table 4.12.
The highest Th/U ratio of 8.85 ± 1.0 was obtained from sample layer five (S4L5) and
lowest Th/U ratio from sample layer one (S4L1) is 6.13 ± 0.8. Th/U ratio given by
Eisenbud and Gesell (1997), for the continental crust is 1.2 and for granite is 1.8. The
Th/U ratio in the present work has a value 7 and 4 times higher than the average
value for the continental crust and granite respectively (Maxwell et al. 2013b). For
example, in hornfel from Death Bend area, Th/U is 3 and Th/U ratio in rocks in the
environs of Swieradow Zdroj varies between 1.5 and 3.2, (Malczewski, 2005),
comparing with the present study, it is twice compared the value reported by
Malczewski (2005).
4.4.14 Correlation of Lithologic Variation and the Activity Concentrations of
238
U, 232
Th and 40
K in Borehole Layers at Lugbe
The purpose of this correlation of different layers in Lugbe subsurface rock
samples is to determine the geology rock type and the corresponding activity
concentrations of 238
U, 232
Th and 40
K being measured with HPGe gamma ray
spectroscopy. Details of the correlations are listed in Table 4.13. Table 4.13
presented the lithologies and the corresponding activity concentrations of each
subsurface layer. It can be observed that the topsoil, S4L1 that comprises laterite,
yellowish brown in colour reported the highest activity concentration of 238
U and K.
The geology of that location that could constitute such activity level is inferred to be
intercalation of biotite-homblende graniodiorite and porphryblastic gneisses. It can
be noted from Figure 3.3, the geologic map of the study area that a glaring fracture
cuts across the terrain of Lugbe toward other areas in NE-SW trend, hence, could
enhance the mobility of oxidized 238
U in aqueous phase and K in feldspatic
sediments thereby re-depositing at the near surface. The highest value of 232
Th was
noted in sample layer four (S4L4).

130
Table 4.13: Correlation between the lithologic rock type and the activity
concentration of 238
U, 232
Th and 40
K (Bq kg‒1
) in Lugbe borehole
Sample
ID
Lithology
description
Activity concentrations
(Bq kg‒1
)
238 U
232
Th
40K
Th/U
Ratio
S4L1 Laterite topsoil,
yellowish brown 22.6 ± 2.5 45.5 ± 4.1 1011.0± 128.3 6.1±0.9
S4L2 Sandy clay, fine
to coarse,
brownish yellow.
18.3 ± 1.2 43.6 ± 4.1 970.3± 122.1 7.4±0.9
S4L3 Clayey sandy,
brownish ash, fine
grain feldspar
21.5 ± 2.5 48.6 ± 4.1 907.7± 115.8 6.9±1.0
S4L4 Sandy
maicaceous, grey,
interbedded with
quatz feldspar
21.9 ± 2.5 49.6 ± 8.1 870.1 ± 109.6 6.9±1.4
S4L5 Fine to coarse,
ashy to grey 16.1 ± 1.2 46.7± 4.1 816.9 ± 103.3 8.9±10
4.4.15 Comparison of Activity Concentration of 232
Th, 238
U and K in
Subsurface Layers from Dei-Dei, Kubwa, Gosa and Lugbe Boreholes
The objective of this comparison is to verify if the same geologic rock type
can reflect similar activity concentrations of 238
U, 232
Th and K in the study areas.
Secondly, to determine the source rock of the radionuclides in each location of the
borehole area which will encourage the professionals in groundwater developments
the identify regions that are safer for groundwater based drinking water exploration.
The findings of this study showed that the activity concentrations of 238
U in
Dei-Dei reported the highest value in layer seven (S1L7) whereas in Kubwa, is in
layer one (S2L1). The higher value in topsoil is due to soil type and the mobility
characteristics of 238
U in subsurface sediment (Maxwell et al., 2013a). In Gosa
borehole rock samples, the activity concentration of 238
U reported higher in layer
131
four (S3L4), whereas in Lugbe borehole samples, sample layer one (S4L1) reported
the highest value. The lowest value of 238
U in Dei-Dei is noted in layer eight (S1L8)
whereas in Kubwa borehole, it was noted in fifth layer (S2L5). The lowest value of
238U in Gosa reported in layer three (S3L3) whereas in Lugbe, it was noted in layer
five (S4L5), it may be due to low distribution of acidic felsic intrusion in the
subsurface sediment, (Maxwell et al., 2013b). In all the samples, the highest 238
U
activity value was noted at Kubwa borehole sample; in sample layer one at the
topsoil with porphyroblastic gneisse and biotite homblende granodiorite as the
geological formation.
The activity concentrations of 232
Th in Dei-Dei was noted higher in layer
eleven (S1L11) whereas in Kubwa and Gosa boreholes, it was noted in sample layer
one (S2L1 and S3L1) respectively. In Lugbe borehole, the activity concentration of
232Th was noted in layer four (S4L4). The lowest values of
232Th in Dei-Dei was
noted in layer two (S1L2) and in Kubwa, the lowest value was in (S2L2). Both layers
(S1L2 and S2L2) may appear to have the same deposition of inter sedimentation and
could have the same geologic rock type, but differ in 238
U due to its oxidation
characteristics, (Maxwell et al., 2013a). The lowest value of 232
Th in Gosa was noted
in layer one (S3L1) whereas the lowest value in Lugbe reported in layer two (S4L2).
In Gosa, the sample layer one (S3L1) may have been affected by the same geological
attributes associated with 232
Th mineral composition during Pan-African Orogeny
event, (Maxwell et al., 2013b). The highest value of 232
Th was recorded in Dei-Dei
sample layer eleven (S1L11) which geologically could be migmatite gneiss complex
intruded into the fractured basement terrain aquifer bearing rock.
The activity concentration of 40
K in Dei-Dei is higher in layer three (S1L3)
and in Kubwa was noted in ninth layer (S2L9). The contradicting result here is the
lowest values of 40
K was noted in first layers of both Dei-Dei and Kubwa (S1L1 and
S2L1), which may be attributed to low colloidal sediments in the near surface of both
Dei-Dei and Kubwa boreholes. In Gosa borehole, the highest activity concentration
of 40
K was noted in layer four (S3L4) whereas in Lugbe borehole, the highest value
was noted in sample layer one (S4L1). The lowest value of 40
K in Gosa and Lugbe
were found in layer one and layer five (S3L1 and S4L5) respectively. The highest
132
value of 40
K in the four boreholes was noted in Dei-Dei in sample layer three (S1L3)
which geologically was attributed to biotite granitic intrusion (Maxwell et al.,
2013a).
In these comparisons, few significant results were found as follows:
1) In S1L2 and S2L2 reporting low activity values of 232
Th in the same topsoil
from Dei-Dei and Kubwa boreholes and was attributed to the same deposition
or sedimentation processes which may be due to similar geologic rock type,
(Maxwell et al., 2013a)
2) In that similar layer the activity level of 238
U in S1L2 and S2L2 varies due to
238U oxidation characteristics (Maxwell et al., 2013a).
3) Another scenario was that S1L2 and S2L2 reported the lowest activity of
232Th whereas S1L1 and S2L1 reported the lowest activity of
40K which was
attributed to low felsinc sediments in the layers, (Maxwell et al., 2013a).
4) In Gosa borehole, the activity concentrations of 238
U, 232
Th and 40
K reported
to be higher in a single layer (S3L4). Such similar homogeneity of activity
concentrations reporting higher value in a single layer, S3L4 from the
structural/ tectonic point of view could be due to that the area underwent
complex polyphase deformation shown by tectonometamorphic phase that is
caused by granitic intrusions, (Maxwell et al., 2013b).
5) In Lugbe borehole, the variations in activity concentrations of radionuclides
may be due to the oxidation of 238
U and the colloidal sediments containing
carbonate and bicarbonate constituents that keep 238
U and 40
K mobile,
(Maxwell et al., 2013b).
6) It could be noted in Figures 4.16 and 4.17 that the activity concentrations of
40K increases with depth in Dei-Dei and Kubwa, (Maxwell et al., 2013b);
whereas at Lugbe, Figure 4.19, its apparently decreases 100 % with depth,
(Maxwell et al., 2013b). It may be caused by the variation in sediment
distribution in subsurface aqueous phase due to large scale fractures by
dissolution of its concentration from higher deposit to lower deposit region. It
could be observed that the situation of 40
K increase with depth in Dei-Dei and
Kubwa boreholes differ from Gosa and Lugbe borehole which may be

133
attributed to the sequence of sedimentation deposit of felsinc intrusions which
depends on the fracture trend in the basement terrain of Abuja and its
environs.
4.4.16 Comparison of Th/U Ratios in Rock Samples from Dei-Dei, Kubwa ,
Gosa and Lugbe Boreholes
The Th/U ratio in Dei-Dei with highest value refers to layer eleven (S1L11),
whereas the lowest value was noted in the sample collected from first layer, laterite
top soil, S1L1. In Kubwa, the Th/U ratio with highest value refers to layer five
(S2L5), whereas the lowest value was noted in the sample collected from fourth
layer, S2L4. At Gosa borehole, sample S3L3 has the highest Th/U ratio and sample
S4L5 at Lugbe borehole reported higher value. These two layers (S3L3 and S4L5)
indicated whether enrichment or relative depletion of radioisotopes may have
occurred, as given in Tables 4.10 and 4.12 respectively (Maxwell et al., 2013c). The
lowest Th/U ratio at Gosa borehole was noted in Sample S3L5 whereas at Lugbe
borehole, it was Sample layer one (S4L1) as shown in Table 4.10 and 4.12
respectively. Dei-Dei reported higher Th/U ratio and presumed to be due to rock
samples being connected to where rocks were formed from thermal metamorphism
and metasomatic processes that occurred, (Maxwell et al., 2013a).
4.4.17 Comparison of Activity Concentration of 232
Th, 238
U and 40
K in Topsoil
of the Study Area (Dei-Dei, Kubwa, Gosa and Lugbe)
The objective of this comparison was to detect the area that reports higher
activity concentrations of 238
U, 232
Th and 40
K in order to recommend for
environmental assessment of radiological impact on inhabitants in the region.
The activity concentrations of the topmost layers of the four borehole rock
samples were presented in Figure 4.20. As it can be observed that the activity of 40
K
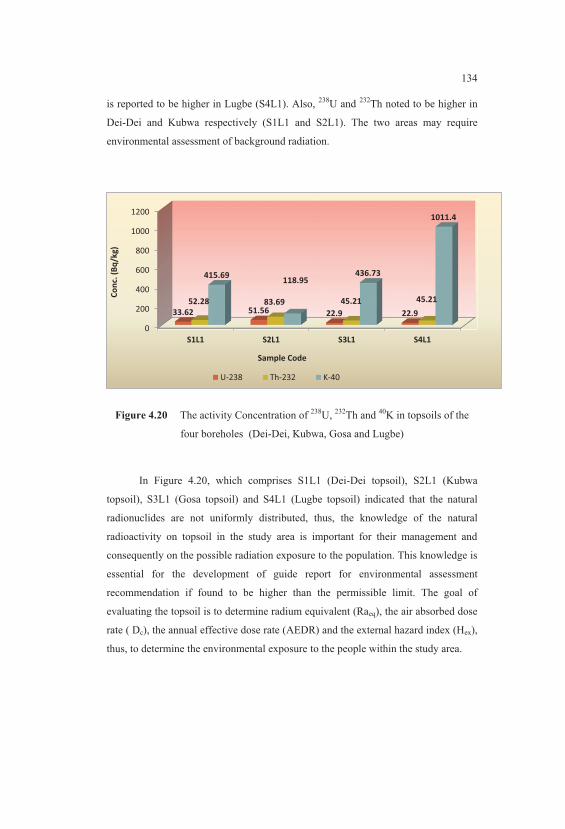
134
is reported to be higher in Lugbe (S4L1). Also, 238
U and 232
Th noted to be higher in
Dei-Dei and Kubwa respectively (S1L1 and S2L1). The two areas may require
environmental assessment of background radiation.
Figure 4.20 The activity Concentration of 238
U, 232
Th and 40
K in topsoils of the
four boreholes (Dei-Dei, Kubwa, Gosa and Lugbe)
In Figure 4.20, which comprises S1L1 (Dei-Dei topsoil), S2L1 (Kubwa
topsoil), S3L1 (Gosa topsoil) and S4L1 (Lugbe topsoil) indicated that the natural
radionuclides are not uniformly distributed, thus, the knowledge of the natural
radioactivity on topsoil in the study area is important for their management and
consequently on the possible radiation exposure to the population. This knowledge is
essential for the development of guide report for environmental assessment
recommendation if found to be higher than the permissible limit. The goal of
evaluating the topsoil is to determine radium equivalent (Raeq), the air absorbed dose
rate ( Dc), the annual effective dose rate (AEDR) and the external hazard index (Hex),
thus, to determine the environmental exposure to the people within the study area.
0
200
400
600
800
1000
1200
S1L1 S2L1 S3L1 S4L1
33.62 51.56 22.9 22.9
52.28 83.69 45.21 45.21
415.69 118.95
436.73
1011.4
Co
nc.
(B
q/k
g)
Sample Code
U-238 Th-232 K-40

135
Dose rate: In the study area Equation (4.6) was used to calculate the external
gamma dose rate Dc in air from natural radionuclides for samples from topsoil,
UNSCEAR, 2000
Dc = 0.462 A(238
U) + 0.604 A(232
Th) + 0.0417 A(40
K) (4.6)
where, Dc is the absorbed dose rate at 1 m from the ground, A(238
U), A(232
Th) and
A(K) are the activity concentrations of 238
U, 232
Th and 40
K in Bq kg‒1
of the
samples respectively.
Radium equivalent: Radium equivalent was calculated according to the
Equations (4.7), UNSCEAR, 2000.
Raeq = ARa + 1.43 ATh + 0.077 AK (4.7)
Radiation hazard: The gamma ray radiation hazards due to the specified
radionuclides were assessed by external radiation hazard and was calculated using
Equation (4.8), UNSCEAR, 2000
Hex = ARa/370 + ATh/259 + AK/4810 ≤ 1 (4.8)
where, ARa ~ AU, ATh and AK are the average activity concentrations of 238
U, 232
Th
and 40
K in Bq kg‒1
, respectively. For the radiation hazard to be acceptible, it is
recommended that the Raeq activity is lower than the value of 370 Bq kg‒1
, while the
Hex be less than unity.
Annual Effective Dose Rate: The annual effective dose rate (AEDR) in units
of μSv y‒1
was calculated by the following formula as shown in Equation (4.9)
AEDR = Dc (nGy h‒1
) x 8760 h x 0.7 Sv Gy‒1
x 10‒3
(4.9)

136
To estimate the AEDR, the conversion coefficient from absorbed dose rate in
air to effective dose (0.7 Sv Gy‒1
) , UNSCEAR, 2000 was used.
The values obtained from the calculated dose rate, radium equivalent,
external radiation hazard and annual effective dose rate due to the topsoil samples
from Dei-Dei, Kubwa, Gosa and Lugbe borehole samples are presented in Table
4.14.
Table 4.14: Calculated dose rate, radium equivalent,external radiation hazard and
annual effective dose rate of the topsoil samples from Dei-Dei, Kubwa, Gosa and
Lugbe
Location Sample
ID Lithology
Dc
(nGy h-1
)
Raeq
(Bq kg-1
) Hex
AEDR
(μSv
y-1
)
Dei-Dei S1L1 Sandston 58 126 0.35 355.7
Kubwa S2L1 Sandy
clay 80 180
0.49 490.6
Gosa S3L1 Sandy
clay 59 124
0.34 361.8
Lugbe S4L1 Laterite 81 160 0.45 496.7
The results of the dose rate, radium equivalent activity, external radiation
hazard and annual effective dose rate due to topsoil of the sampling sites are shown
in Table 4.14. The calculated dose rate was higher at Lugbe with a value of 81 nGy
h‒1
which is attributed to lateritic topsoil interbedded with gravel as the formation of
the surface area. The low dose rate was determined on the sandstone at Dei-Dei
topsoil with a value of 58 nGy h‒1
. The higher radium equivalent activity of 180 Bq
kg‒1
was reported at Kubwa whereas Gosa reported a distinctly lower value of 124
Bq kg-1
. The external radiation hazard index of 0.49 was noted at Kubwa and lower
value of 0.34 was reported at Gosa. The external hazard index of 0.49 did not exceed
the recommended value. All the lower values found at Gosa area may be due to the
absence of interconnectivity of fractures reported earlier in this study from geologic
interpretation as shown in Figure 4.6. The highest annual effective dose rate (AEDR)
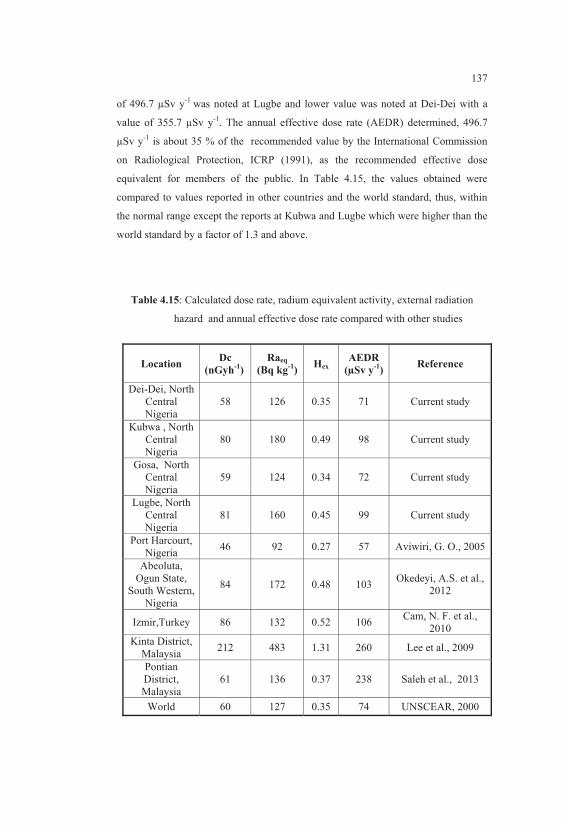
137
of 496.7 μSv y-1
was noted at Lugbe and lower value was noted at Dei-Dei with a
value of 355.7 μSv y-1
. The annual effective dose rate (AEDR) determined, 496.7
μSv y-1
is about 35 % of the recommended value by the International Commission
on Radiological Protection, ICRP (1991), as the recommended effective dose
equivalent for members of the public. In Table 4.15, the values obtained were
compared to values reported in other countries and the world standard, thus, within
the normal range except the reports at Kubwa and Lugbe which were higher than the
world standard by a factor of 1.3 and above.
Table 4.15: Calculated dose rate, radium equivalent activity, external radiation
hazard and annual effective dose rate compared with other studies
Location Dc
(nGyh-1
)
Raeq
(Bq kg-1
) Hex
AEDR
(μSv y-1
)
Reference
Dei-Dei, North
Central
Nigeria
58 126 0.35 71 Current study
Kubwa , North
Central
Nigeria
80 180 0.49 98 Current study
Gosa, North
Central
Nigeria
59 124 0.34 72 Current study
Lugbe, North
Central
Nigeria
81 160 0.45 99 Current study
Port Harcourt,
Nigeria 46 92 0.27 57 Aviwiri, G. O., 2005
Abeoluta,
Ogun State,
South Western,
Nigeria
84 172 0.48 103 Okedeyi, A.S. et al.,
2012
Izmir,Turkey 86 132 0.52 106 Cam, N. F. et al.,
2010
Kinta District,
Malaysia 212 483 1.31 260 Lee et al., 2009
Pontian
District,
Malaysia
61 136 0.37 238 Saleh et al., 2013
World 60 127 0.35 74 UNSCEAR, 2000

138
4.4.18 Comparison of activity concentration of 232
Th, 238
U and K in
Dei-Dei, Kubwa, Gosa , Lugbe and other Countries
The purpose of this comparison was to correlate the values of the results of
the present work and the previous work published elsewhere. Comparison of the
activity concentrations of 238
U, 232
Th and K in the present study with previous studies
are presented in Table 4.16. Most of the reports were not from sequential subsurface
layers as this present study, but they are all from soils and rocks. The results of
present work show good agreement with those reported in previous studies. In
general, all results existed within the range of values given in UNSCEAR,
(UNSCEAR, 1998).

139
Table 4.16: Summary of Activity Concentration of radioisotopes in topsoil samples
in Dei-Dei, Kubwa, Gosa and Lugbe boreholes in Abuja and other Parts of the
World (UNSCEAR, 1998)
Region/ Country
232Th (Bq kg
‒1)
238U (Bq kg
‒1) K (Bq kg
‒1)
Range Mean Range Mean Range Mean
Dei-De1 Abuja,
Nort Central
Nigeriaa
53 ± 4 53 34 ± 3 34 236 ± 32 236
Kubwa Abuja,
Northcental,Niger
ia a
84 ± 7 84 52 ± 5 52 119 ± 15 119
Gosa Abuja,
Nort Central
Nigeriaa
48 ± 4 48
25 ± 2
25 438 ± 56 438
Lugbe Abuja,
Northcental,Niger
ia a
46 ± 4 46 23 ± 2 23 1011± 128 1011
Ikogosi-
Ekiti,South
western Nigeria b
1- 108 82 4 -111 58 40-2437 1203
Malaysia c 63 -110 82 49 – 86 66 170-430 310
China c 1 - 360 41 2 - 690 84 9-1800 440
India c 14-160 64 7 - 81 29 38-760 400
Japan c 2-88 28 2 - 59 29 15-990 310
United State c 4 -130 35 4 - 140 35 100-700 370
Egypt c 2 - 96 18 6 - 120 37 29-650 320
Greece c 1 - 190 20 1 - 240 25 12-1570 360
Portugal c 22 -100 51 26 - 82 49 220-230 840
Russia c 2 - 79 30 0 - 67 19 100-400 520
Spain c 2-210 33 - - 25-1650 570
World d 7-50 45 16 -116 33 100-700 420
a- Present study; b- O.S Ajayi (1999); c- UNSCEAR (1998); d- UNSCEAR (2000)
140
4.5 Geochemical Characteristics of Rock Sample from Dei-Dei,
Kubwa, Gosa and Lugbe Using X-ray Fluorescence Analysis
The main objective of this geochemical characteristic investigation is to study
the effect of mineral elements on rock samples from Dei-Dei, Kubwa, Gosa and
Lugbe borehole samples and to compare with the GBW07406 (DC73324) reference
material, hence, to know their effect on activity concentration of 238
U, 232
Th and K
and on the variations of layers activity levels. The details of the sample preparation
and methods are discussed in Section 3.5.
Thirty-one (31) samples were chemically analysed in Environmental Analysis
Laboratory, Department of Water and Environmental Engineering, Faculty of Civil
and Environmental Engineering, Universiti Tun Hussein ONN Malaysia. The
purpose of the analysis was to determine the major oxides such as SiO2, Al2O3,
Fe2O3, CaO, MgO, MnO, K2O, Na2O, P2O5, TiO2, CO2, SO3, BaO and ZrO2 in the
samples using X-ray Fluorescence (XRF) technique attached to Geo-quant M
software. Certified reference material soil (CRM) provided by Institute of
Geophysical and Geochemical Exploration (Langfang, China) coded: GBW07406
(DC73324) has been used as the standard for the XRF fluorescence analysis system;
reference material date of certification: 1986; modification: 2003 and expiration:
2013. It is mainly used in geology, mineral reconnaissance, agriculture and the
related fields to carry out chemical analysis as calibration samples and for
monitoring the quality of measurements. The studied layers, for Dei-Dei with eleven
samples are S1L1 to S1L11, for Kubwa with nine samples are S2L1 to S2L9, for
Gosa with six samples S3L1 to S3L6 and Lugbe rock samples are S4L1 to S4L5.
4.5.1 Interpretation of Major Oxides in Dei-Dei Borehole Rock Samples
At Dei-Dei, the chemical composition of the collected samples is shown in
Table 4.17. The samples can be differentiated according to their SiO2, CaO, Fe2O3,
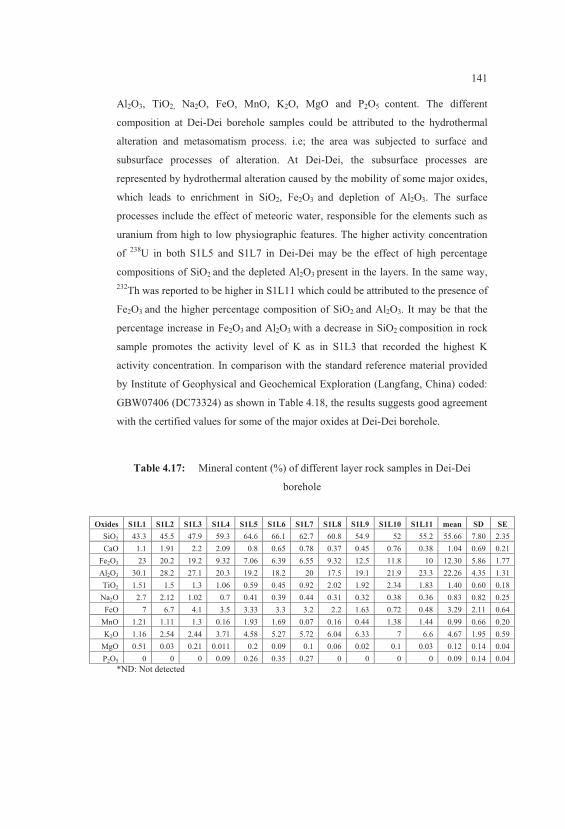
141
Al2O3, TiO2, Na2O, FeO, MnO, K2O, MgO and P2O5 content. The different
composition at Dei-Dei borehole samples could be attributed to the hydrothermal
alteration and metasomatism process. i.e; the area was subjected to surface and
subsurface processes of alteration. At Dei-Dei, the subsurface processes are
represented by hydrothermal alteration caused by the mobility of some major oxides,
which leads to enrichment in SiO2, Fe2O3 and depletion of Al2O3. The surface
processes include the effect of meteoric water, responsible for the elements such as
uranium from high to low physiographic features. The higher activity concentration
of 238
U in both S1L5 and S1L7 in Dei-Dei may be the effect of high percentage
compositions of SiO2 and the depleted Al2O3 present in the layers. In the same way,
232Th was reported to be higher in S1L11 which could be attributed to the presence of
Fe2O3 and the higher percentage composition of SiO2 and Al2O3. It may be that the
percentage increase in Fe2O3 and Al2O3 with a decrease in SiO2 composition in rock
sample promotes the activity level of K as in S1L3 that recorded the highest K
activity concentration. In comparison with the standard reference material provided
by Institute of Geophysical and Geochemical Exploration (Langfang, China) coded:
GBW07406 (DC73324) as shown in Table 4.18, the results suggests good agreement
with the certified values for some of the major oxides at Dei-Dei borehole.
Table 4.17: Mineral content (%) of different layer rock samples in Dei-Dei
borehole
*ND: Not detected
Oxides S1L1 S1L2 S1L3 S1L4 S1L5 S1L6 S1L7 S1L8 S1L9 S1L10 S1L11 mean SD SE
SiO2 43.3 45.5 47.9 59.3 64.6 66.1 62.7 60.8 54.9 52 55.2 55.66 7.80 2.35
CaO 1.1 1.91 2.2 2.09 0.8 0.65 0.78 0.37 0.45 0.76 0.38 1.04 0.69 0.21
Fe2O3 23 20.2 19.2 9.32 7.06 6.39 6.55 9.32 12.5 11.8 10 12.30 5.86 1.77
Al2O3 30.1 28.2 27.1 20.3 19.2 18.2 20 17.5 19.1 21.9 23.3 22.26 4.35 1.31
TiO2 1.51 1.5 1.3 1.06 0.59 0.45 0.92 2.02 1.92 2.34 1.83 1.40 0.60 0.18
Na2O 2.7 2.12 1.02 0.7 0.41 0.39 0.44 0.31 0.32 0.38 0.36 0.83 0.82 0.25
FeO 7 6.7 4.1 3.5 3.33 3.3 3.2 2.2 1.63 0.72 0.48 3.29 2.11 0.64
MnO 1.21 1.11 1.3 0.16 1.93 1.69 0.07 0.16 0.44 1.38 1.44 0.99 0.66 0.20
K2O 1.16 2.54 2.44 3.71 4.58 5.27 5.72 6.04 6.33 7 6.6 4.67 1.95 0.59
MgO 0.51 0.03 0.21 0.011 0.2 0.09 0.1 0.06 0.02 0.1 0.03 0.12 0.14 0.04
P2O5 0 0 0 0.09 0.26 0.35 0.27 0 0 0 0 0.09 0.14 0.04
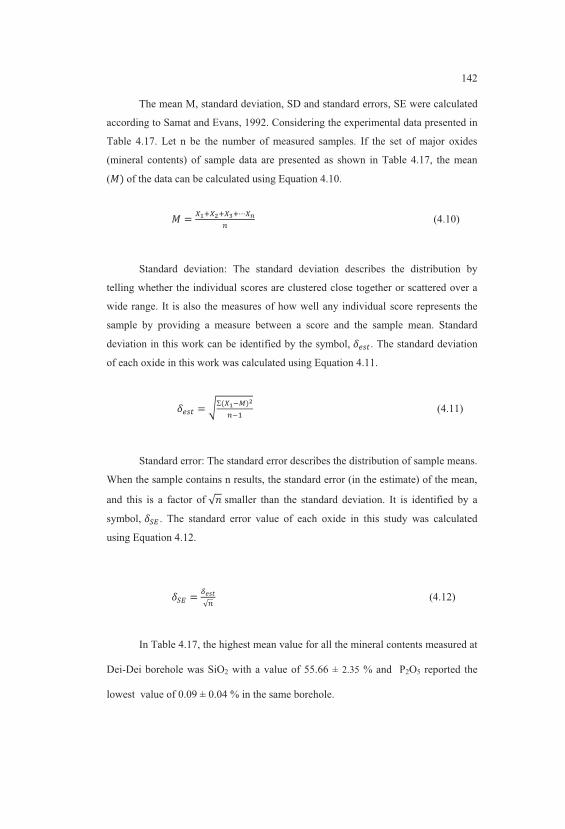
142
The mean M, standard deviation, SD and standard errors, SE were calculated
according to Samat and Evans, 1992. Considering the experimental data presented in
Table 4.17. Let n be the number of measured samples. If the set of major oxides
(mineral contents) of sample data are presented as shown in Table 4.17, the mean
(B)�of the data can be calculated using Equation 4.10.
B � �r��s������g� (4.10)
Standard deviation: The standard deviation describes the distribution by
telling whether the individual scores are clustered close together or scattered over a
wide range. It is also the measures of how well any individual score represents the
sample by providing a measure between a score and the sample mean. Standard
deviation in this work can be identified by the symbol, ����. The standard deviation
of each oxide in this work was calculated using Equation 4.11.
���� � �Σ$�r}8)s�}? (4.11)
Standard error: The standard error describes the distribution of sample means.
When the sample contains n results, the standard error (in the estimate) of the mean,
and this is a factor of �6 smaller than the standard deviation. It is identified by a
symbol, ��� . The standard error value of each oxide in this study was calculated
using Equation 4.12.
��� � �HLO�� (4.12)
In Table 4.17, the highest mean value for all the mineral contents measured at
Dei-Dei borehole was SiO2 with a value of 55.66 ± 2.35 % and P2O5 reported the
lowest value of 0.09 ± 0.04 % in the same borehole.
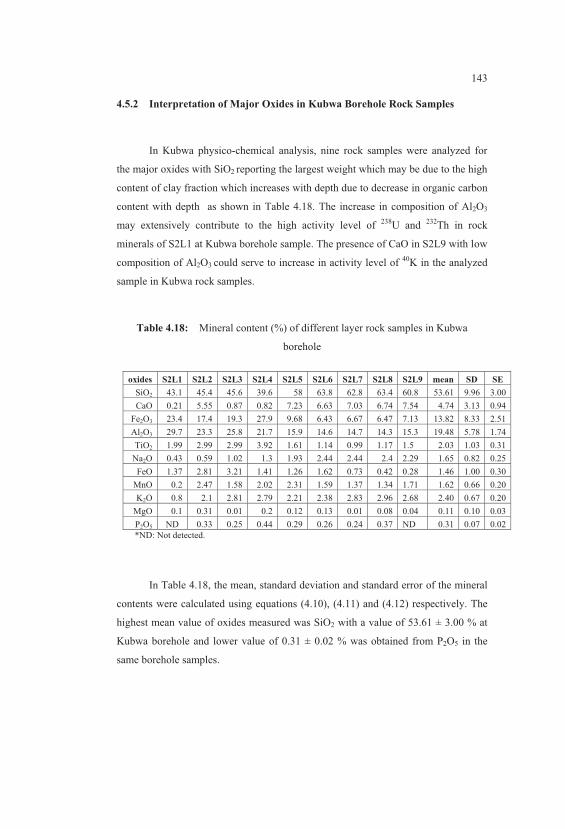
143
4.5.2 Interpretation of Major Oxides in Kubwa Borehole Rock Samples
In Kubwa physico-chemical analysis, nine rock samples were analyzed for
the major oxides with SiO2 reporting the largest weight which may be due to the high
content of clay fraction which increases with depth due to decrease in organic carbon
content with depth as shown in Table 4.18. The increase in composition of Al2O3
may extensively contribute to the high activity level of 238
U and 232
Th in rock
minerals of S2L1 at Kubwa borehole sample. The presence of CaO in S2L9 with low
composition of Al2O3 could serve to increase in activity level of 40
K in the analyzed
sample in Kubwa rock samples.
Table 4.18: Mineral content (%) of different layer rock samples in Kubwa
borehole
oxides S2L1 S2L2 S2L3 S2L4 S2L5 S2L6 S2L7 S2L8 S2L9 mean SD SE
SiO2 43.1 45.4 45.6 39.6 58 63.8 62.8 63.4 60.8 53.61 9.96 3.00
CaO 0.21 5.55 0.87 0.82 7.23 6.63 7.03 6.74 7.54 4.74 3.13 0.94
Fe2O3 23.4 17.4 19.3 27.9 9.68 6.43 6.67 6.47 7.13 13.82 8.33 2.51
Al2O3 29.7 23.3 25.8 21.7 15.9 14.6 14.7 14.3 15.3 19.48 5.78 1.74
TiO2 1.99 2.99 2.99 3.92 1.61 1.14 0.99 1.17 1.5 2.03 1.03 0.31
Na2O 0.43 0.59 1.02 1.3 1.93 2.44 2.44 2.4 2.29 1.65 0.82 0.25
FeO 1.37 2.81 3.21 1.41 1.26 1.62 0.73 0.42 0.28 1.46 1.00 0.30
MnO 0.2 2.47 1.58 2.02 2.31 1.59 1.37 1.34 1.71 1.62 0.66 0.20
K2O 0.8 2.1 2.81 2.79 2.21 2.38 2.83 2.96 2.68 2.40 0.67 0.20
MgO 0.1 0.31 0.01 0.2 0.12 0.13 0.01 0.08 0.04 0.11 0.10 0.03
P2O5 ND 0.33 0.25 0.44 0.29 0.26 0.24 0.37 ND 0.31 0.07 0.02
*ND: Not detected.
In Table 4.18, the mean, standard deviation and standard error of the mineral
contents were calculated using equations (4.10), (4.11) and (4.12) respectively. The
highest mean value of oxides measured was SiO2 with a value of 53.61 ± 3.00 % at
Kubwa borehole and lower value of 0.31 ± 0.02 % was obtained from P2O5 in the
same borehole samples.

144
4.5.3 Interpretation of Major Oxides in Gosa Borehole Rock Samples
In Gosa, the S3L6 in Table 4.19 reported the highest activity concentrations
of both 238
U and 232
Th which could be refer to the higher percentage composition of
SiO2 and Fe2O3 in the presence of P2O5. It could be that P2O5 could increase the
activity of radionuclides at low composition of Al2O3 in rock samples. In Gosa area,
it could be observed that Al2O3 decreases appreciably with depth as it is in other
areas, Dei-Dei and Kubwa respectively. The sample layer four (S3L4) with high
percentage of SiO2 and Al2O3 with addition of high composition of K2O percentage
in the sample may have contributed to high activity concentration of 40
K in the rock
sample obtained in that layer.
Table 4.19: Mineral content (%) of different layer rock sample in Gosa borehole
oxides S3L1 S3L2 S3L3 S3L4 S3L5 S3L6 mean SD SE
SiO2 45.2 53.4 51.8 57.2 71.8 54.6 55.67 8.87 2.67
CaO 0.22 3.3 0.1 0.78 1.58 1.7 1.28 1.19 0.36
Fe2O3 19 8.35 9.05 7.58 6.8 23.5 12.38 7.06 2.13
Al2O3 29.1 33.7 34.6 27.1 11.5 11.7 24.62 10.46 3.15
TiO2 1.2 0.73 0.78 0.71 1.38 0.81 0.94 0.28 0.09
Na2O 2.41 3.87 1.32 0.74 1.37 1.1 1.80 1.16 0.35
FeO 1 0.12 1.53 1.03 1.1 0.87 0.94 0.46 0.14
MnO 1.14 0.03 0.14 0.17 0.13 1.88 0.58 0.76 0.23
K2O 0.8 2.54 0.78 3.88 3.13 2.09 2.20 1.25 0.38
MgO 0.99 0.78 0.84 1.24 1.21 1.42 1.08 0.25 0.08
P2O5 ND ND ND ND ND 0.26 0.02 0.08 0.02 *ND: Not detected
In the same way, the mean, standard deviation and standard error of mineral
contents in Table 4.19 were calculated using Equations (4.10), (4.11) and (4.12)
respectively. The highest mean value of 55.67 ± 2.67 % was from SiO2 and a mean
value of 0.02 ± 0.02 % obtained for P2O5 as shown in Table 4.19 reported the lowest
mineral content in the area.
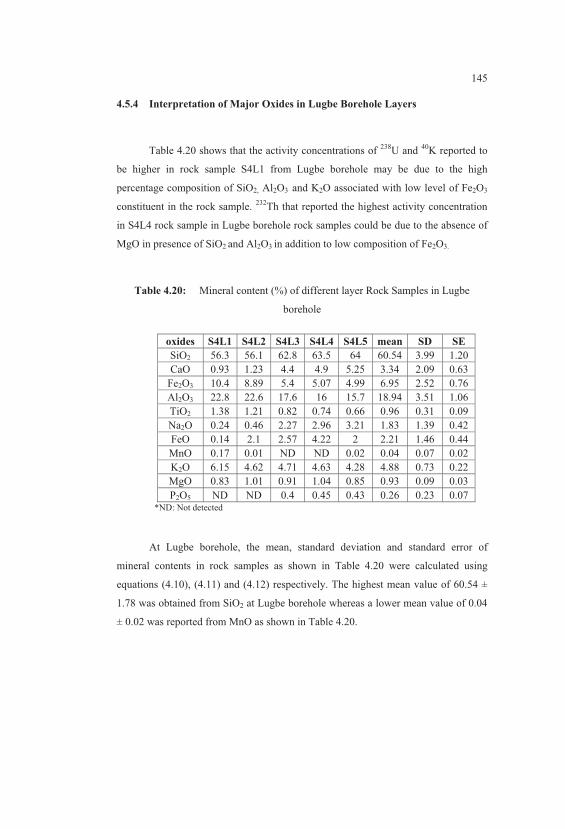
145
4.5.4 Interpretation of Major Oxides in Lugbe Borehole Layers
Table 4.20 shows that the activity concentrations of 238
U and 40
K reported to
be higher in rock sample S4L1 from Lugbe borehole may be due to the high
percentage composition of SiO2, Al2O3 and K2O associated with low level of Fe2O3
constituent in the rock sample. 232
Th that reported the highest activity concentration
in S4L4 rock sample in Lugbe borehole rock samples could be due to the absence of
MgO in presence of SiO2 and Al2O3 in addition to low composition of Fe2O3.
Table 4.20: Mineral content (%) of different layer Rock Samples in Lugbe
borehole
oxides S4L1 S4L2 S4L3 S4L4 S4L5 mean SD SE
SiO2 56.3 56.1 62.8 63.5 64 60.54 3.99 1.20
CaO 0.93 1.23 4.4 4.9 5.25 3.34 2.09 0.63
Fe2O3 10.4 8.89 5.4 5.07 4.99 6.95 2.52 0.76
Al2O3 22.8 22.6 17.6 16 15.7 18.94 3.51 1.06
TiO2 1.38 1.21 0.82 0.74 0.66 0.96 0.31 0.09
Na2O 0.24 0.46 2.27 2.96 3.21 1.83 1.39 0.42
FeO 0.14 2.1 2.57 4.22 2 2.21 1.46 0.44
MnO 0.17 0.01 ND ND 0.02 0.04 0.07 0.02
K2O 6.15 4.62 4.71 4.63 4.28 4.88 0.73 0.22
MgO 0.83 1.01 0.91 1.04 0.85 0.93 0.09 0.03
P2O5 ND ND 0.4 0.45 0.43 0.26 0.23 0.07 *ND: Not detected
At Lugbe borehole, the mean, standard deviation and standard error of
mineral contents in rock samples as shown in Table 4.20 were calculated using
equations (4.10), (4.11) and (4.12) respectively. The highest mean value of 60.54 ±
1.78 was obtained from SiO2 at Lugbe borehole whereas a lower mean value of 0.04
± 0.02 was reported from MnO as shown in Table 4.20.
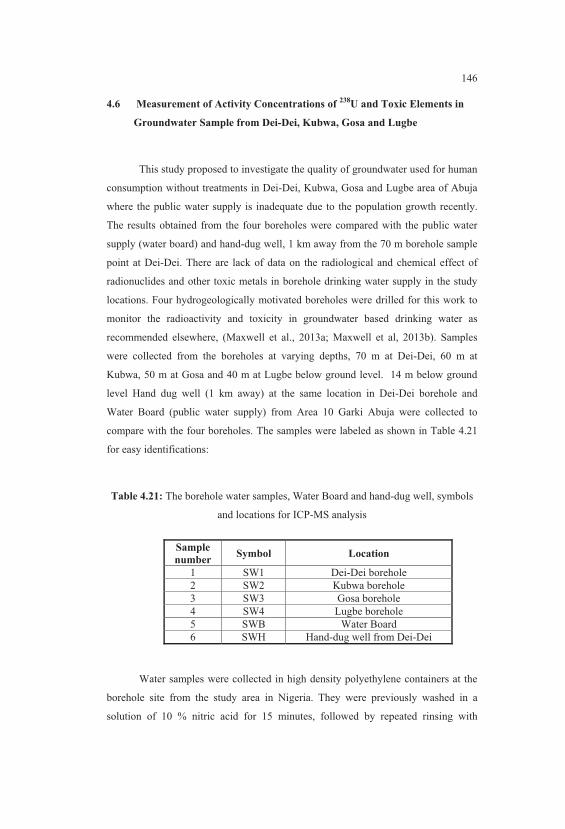
146
4.6 Measurement of Activity Concentrations of 238
U and Toxic Elements in
Groundwater Sample from Dei-Dei, Kubwa, Gosa and Lugbe
This study proposed to investigate the quality of groundwater used for human
consumption without treatments in Dei-Dei, Kubwa, Gosa and Lugbe area of Abuja
where the public water supply is inadequate due to the population growth recently.
The results obtained from the four boreholes were compared with the public water
supply (water board) and hand-dug well, 1 km away from the 70 m borehole sample
point at Dei-Dei. There are lack of data on the radiological and chemical effect of
radionuclides and other toxic metals in borehole drinking water supply in the study
locations. Four hydrogeologically motivated boreholes were drilled for this work to
monitor the radioactivity and toxicity in groundwater based drinking water as
recommended elsewhere, (Maxwell et al., 2013a; Maxwell et al, 2013b). Samples
were collected from the boreholes at varying depths, 70 m at Dei-Dei, 60 m at
Kubwa, 50 m at Gosa and 40 m at Lugbe below ground level. 14 m below ground
level Hand dug well (1 km away) at the same location in Dei-Dei borehole and
Water Board (public water supply) from Area 10 Garki Abuja were collected to
compare with the four boreholes. The samples were labeled as shown in Table 4.21
for easy identifications:
Table 4.21: The borehole water samples, Water Board and hand-dug well, symbols
and locations for ICP-MS analysis
Sample
number Symbol Location
1 SW1 Dei-Dei borehole
2 SW2 Kubwa borehole
3 SW3 Gosa borehole
4 SW4 Lugbe borehole
5 SWB Water Board
6 SWH Hand-dug well from Dei-Dei
Water samples were collected in high density polyethylene containers at the
borehole site from the study area in Nigeria. They were previously washed in a
solution of 10 % nitric acid for 15 minutes, followed by repeated rinsing with

147
distilled water and finally rinsing with ultrapure water (resistivity of about 18 Mῼ
cm‒1
). Before the sample collection, the prepared collection containers were kept in
sealed polyethylene bags. Borehole water samples were stabilized with 5 ml of nitric
acid in each litre of water. For accurate determination of elemental compositions in
groundwater samples, a solution analytical method was used; a multi-standard
calibration method was applied using Elan 9000 instrument that performs analysis at
parts-per-trillion and lower (ICP-MS). The details of the method were discussed in
Section 3.6.
Table 4.22 presents the activity concentrations of 238
U that were determined
in groundwater samples taken from the study area. The data in Table 4.22 were
converted to �Bq L‒1
using the conversion factor of 15 μg L‒1
(0.19 Bq L‒1
), (WHO,
2003). The activity concentrations of 238
U in the water supplies for drinking and
domestic purposes were found to be higher at Lugbe borehole with a value of 2736
Bq L-1
whereas lower value of 443 Bq L‒1
was reported at Gosa borehole. Activity
concentration of 1824 Bq L‒1
was noted for Water Board sample whereas 2430 Bq
L‒1
was reported in hand-dug well water sample. It was observed that the activity
concentration of 238
U radionuclide in groundwater based drinking water at Lugbe
borehole was higher than that of Dei-Dei, Kubwa and Gosa. Comparing the activity
level in Lugbe borehole with the Water Board, Lugbe borehole was higher by a
factor of 1.5. Interestingly, the hand-dug well with activity level of 2430 Bq L‒1
at a
depth of about 14 m collected 1 km away from Dei-Dei borehole was closer to the
activity level of 2698 Bq L‒1
found at Dei-Dei borehole water sample. The activity
concentration of 238
U in Lugbe borehole was higher than all the values obtained in
other samples; probably, the 222
Rn content in the water may not have way to escape
to the surrounding compared to other boreholes and the surface water that serves the
Water Board. In addition, the Water Board in Abuja which is the public water supply
in the region noted higher than the borehole drilled at Gosa and Kubwa. This may be
attributed to solubility and high content of heavy metals in the public water supply
which was identified from ICP-MS analysis. The variation of the activity levels
depend on the activity of 222
Rn in water. The reason for higher solubility of 238
U in
some groundwater samples may be due to the chemical composition of Abuja
groundwater. Compared to water from hand-dug well, bedrock waters are more
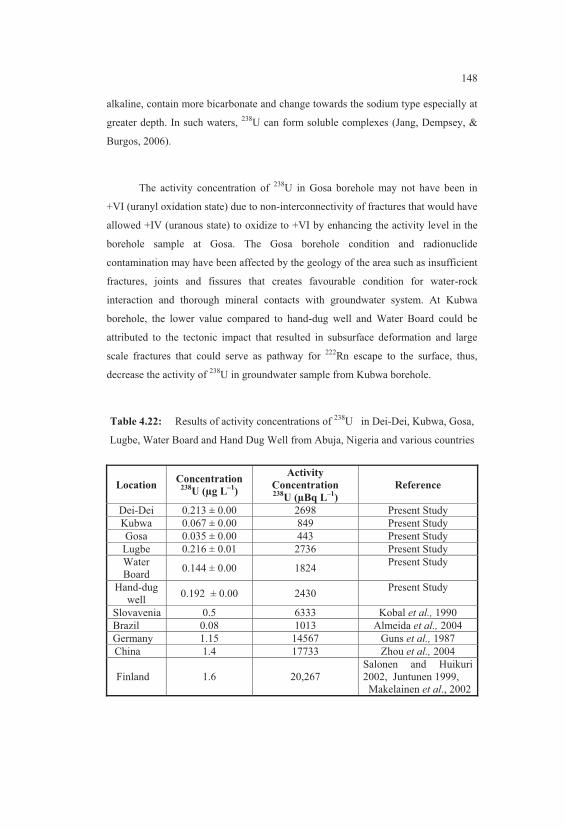
148
alkaline, contain more bicarbonate and change towards the sodium type especially at
greater depth. In such waters, 238
U can form soluble complexes (Jang, Dempsey, &
Burgos, 2006).
The activity concentration of 238
U in Gosa borehole may not have been in
+VI (uranyl oxidation state) due to non-interconnectivity of fractures that would have
allowed +IV (uranous state) to oxidize to +VI by enhancing the activity level in the
borehole sample at Gosa. The Gosa borehole condition and radionuclide
contamination may have been affected by the geology of the area such as insufficient
fractures, joints and fissures that creates favourable condition for water-rock
interaction and thorough mineral contacts with groundwater system. At Kubwa
borehole, the lower value compared to hand-dug well and Water Board could be
attributed to the tectonic impact that resulted in subsurface deformation and large
scale fractures that could serve as pathway for 222
Rn escape to the surface, thus,
decrease the activity of 238
U in groundwater sample from Kubwa borehole.
Table 4.22: Results of activity concentrations of 238
U in Dei-Dei, Kubwa, Gosa,
Lugbe, Water Board and Hand Dug Well from Abuja, Nigeria and various countries
Location Concentration
238U (μg L
‒1)
Activity
Concentration 238
U (μBq L‒1
)
Reference
Dei-Dei 0.213 ± 0.00 2698 Present Study
Kubwa 0.067 ± 0.00 849 Present Study
Gosa 0.035 ± 0.00 443 Present Study
Lugbe 0.216 ± 0.01 2736 Present Study
Water
Board 0.144 ± 0.00 1824
Present Study
Hand-dug
well 0.192 ± 0.00 2430
Present Study
Slovavenia 0.5 6333 Kobal et al., 1990
Brazil 0.08 1013 Almeida et al., 2004
Germany 1.15 14567 Guns et al., 1987
China 1.4 17733 Zhou et al., 2004
Finland 1.6 20,267
Salonen and Huikuri
2002, Juntunen 1999,
Makelainen et al., 2002
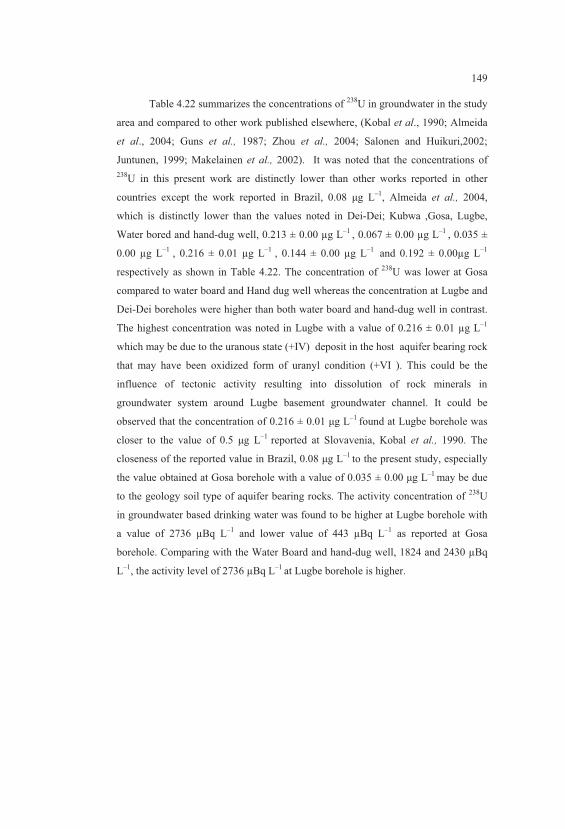
149
Table 4.22 summarizes the concentrations of 238
U in groundwater in the study
area and compared to other work published elsewhere, (Kobal et al., 1990; Almeida
et al., 2004; Guns et al., 1987; Zhou et al., 2004; Salonen and Huikuri,2002;
Juntunen, 1999; Makelainen et al., 2002). It was noted that the concentrations of
238U in this present work are distinctly lower than other works reported in other
countries except the work reported in Brazil, 0.08 μg L‒1
, Almeida et al., 2004,
which is distinctly lower than the values noted in Dei-Dei; Kubwa ,Gosa, Lugbe,
Water bored and hand-dug well, 0.213 ± 0.00 μg L‒1
, 0.067 ± 0.00 μg L‒1
, 0.035 ±
0.00 μg L‒1
, 0.216 ± 0.01 μg L‒1
, 0.144 ± 0.00 μg L‒1
and 0.192 ± 0.00μg L‒1
respectively as shown in Table 4.22. The concentration of 238
U was lower at Gosa
compared to water board and Hand dug well whereas the concentration at Lugbe and
Dei-Dei boreholes were higher than both water board and hand-dug well in contrast.
The highest concentration was noted in Lugbe with a value of 0.216 ± 0.01 μg L‒1
which may be due to the uranous state (+IV) deposit in the host aquifer bearing rock
that may have been oxidized form of uranyl condition (+VI ). This could be the
influence of tectonic activity resulting into dissolution of rock minerals in
groundwater system around Lugbe basement groundwater channel. It could be
observed that the concentration of 0.216 ± 0.01 μg L‒1
found at Lugbe borehole was
closer to the value of 0.5 μg L‒1
reported at Slovavenia, Kobal et al., 1990. The
closeness of the reported value in Brazil, 0.08 μg L‒1
to the present study, especially
the value obtained at Gosa borehole with a value of 0.035 ± 0.00 μg L‒1
may be due
to the geology soil type of aquifer bearing rocks. The activity concentration of 238
U
in groundwater based drinking water was found to be higher at Lugbe borehole with
a value of 2736 μBq L‒1
and lower value of 443 μBq L‒1
as reported at Gosa
borehole. Comparing with the Water Board and hand-dug well, 1824 and 2430 μBq
L‒1
, the activity level of 2736 μBq L‒1
at Lugbe borehole is higher.

150
4.6.1 Accumulation of Radionuclide (238
U) in Humans and Recommendations
for the Maximum Permissible Limit
The objective of the estimation of radionuclide accumulation was to know the
level of exposure to the inhabitants of the study area that depend on borehole water
by determining the annual effective dose and the life average daily dose. The
International Commission on Radiological Protection, ICRP, provides
recommendations and guidance on all aspects of protection against ionizing
radiation, which are published in the commission’s own scientific journal, the Annals
of the ICRP, was also referred to in this work. The process of exposure starts through
ingestion of groundwater that contains radionuclides; after entering the human body,
radionuclides are typically accumulated in the skeleton, liver, kidney and soft tissues.
Ingested radionuclides are not entirely retained in the human body. Dose coefficients
help to determine the effective dose associated with radiation exposure in assessing
the health risk to people. The dose coefficient is expressed in Sv Bq‒1
, the effective
dose equivalent per unit water activity concentration of the radionuclide. The annual
effective dose is calculated taking into account the activity concentration of the
nuclide (Bq L‒1
), the dose coefficient (Sv Bq‒1
) is give as 4.5 x 10‒8
(ICRP67, 1993;
ICRP72, 1996; National Research Council, 1999) and the annual water consumption
is given as 731 L L y‒1
, (WHO, 2004; National Research Council, 1999), from
Equation (4.13).
5E��$|����� v) � 5Y�$����}?)�����Y�$�����}?)���5^Y����}?���vzzz (4.13)
where,
5E� = Annual effective dose
5Y = Activity concentration
�Y = Dose coefficient
5^Y = Annual water consumption
151
In the present study, Equation (4.13) was used to determine the annual
effective dose of the water samples for 238
U radionuclide only in groundwater based
drinking water as shown in Table 4.23. The World Health Organisation (WHO) and
Environmental Protection Agency (EPA-USA) used the quantity of 2 litres per day
water consumption for adults (World Health Organisation, 2004; National Research
Council 1999). The annual effective dose reported higher in Lugbe borehole with a
value of 9.0 x 10‒5
mSv y‒1
and lower value of 1.5 x 10‒5
mSv y‒1
noted at Gosa
borehole as shown in Table 4.28. Compared to Water Board and hand-dug well, with
values 6.0 x 10‒5
mSv y‒1
and 8.0 x 10‒5
mSv y‒1
respectively which were lower than
the values obtained at Lugbe and Dei-Dei boreholes, of 9.0 x 10‒5
mSv y‒1
and 8.9 x
10‒5
mSv y‒1
respectively. In contrast with the previous report of the international
standard (Council Directive 98/83/EY, 1998), 0.1 mSv y‒1
, the highest value of
borehole water sample obtained in the study area, Lugbe with a value of 9.0 x 10‒5
mSv y‒1
was far below the recommended limit. According to ICRP 69 (1995),
uranium gets to the blood through the soft tissues and excretes in urine. It can be
excreted in few months whereas the parents could be retained for years. Uranium
exchanges with Ca2+
accumulate in surface of bone and highly concentrated area of
growth. The liver accumulates 1.5 to 2% of which most of it removed in a few
weeks. Furthermore, the radioactivity of uranium has chemical toxicity that
predominately affects the kidneys (Kurttio et al., 2002; Kuttio et al., 2005). From the
reference work done elsewhere, the uranium concentration is limited mainly by
chemical toxicity rather than the effective dose (WHO, 2006). In 2003, the World
Health Organization proposed a provisional guideline of 15 μg L‒1
(0.19 Bq L‒1
).
The result of this present study is below the recommended limit and within the range
for the standard guideline for drinking water as shown in Table 4.23.
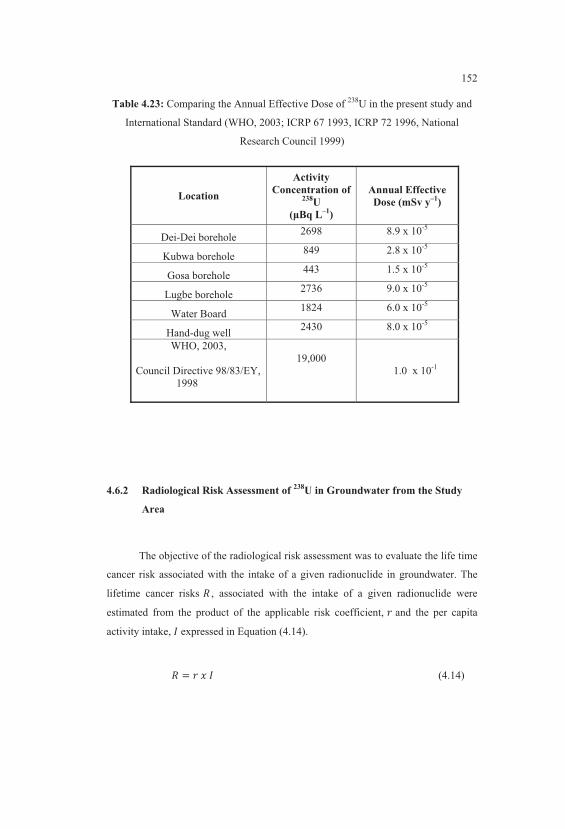
152
Table 4.23: Comparing the Annual Effective Dose of 238
U in the present study and
International Standard (WHO, 2003; ICRP 67 1993, ICRP 72 1996, National
Research Council 1999)
Location
Activity
Concentration of 238
U
(μBq L‒1
)
Annual Effective
Dose (mSv y‒1
)
Dei-Dei borehole 2698 8.9 x 10
-5
Kubwa borehole 849 2.8 x 10
-5
Gosa borehole 443 1.5 x 10
-5
Lugbe borehole 2736 9.0 x 10
-5
Water Board 1824 6.0 x 10
-5
Hand-dug well 2430 8.0 x 10
-5
WHO, 2003,
Council Directive 98/83/EY,
1998
19,000
1.0 x 10⁻¹
4.6.2 Radiological Risk Assessment of 238
U in Groundwater from the Study
Area
The objective of the radiological risk assessment was to evaluate the life time
cancer risk associated with the intake of a given radionuclide in groundwater. The
lifetime cancer risks � , associated with the intake of a given radionuclide were
estimated from the product of the applicable risk coefficient, � and the per capita
activity intake, D expressed in Equation (4.14).
� � ��%�D (4.14)

153
According to WHO (2008), the average life expectancy at birth in Nigeria is
45.5 y and, an annual consumption of water for an individual is about 731 �. This
brings the lifetime intake of water to 33,215� . The cancer risk coefficients of
uranium 1.13 × 10‒9
Bq‒1
for mortality and 1.73 × 10‒9
Bq‒1
for morbidity
respectively were obtained from the literature (EPA, 1999; UNSCEAR, 2000). Using
Equation 4.22 and these coefficients, the cancer mortality and morbidity risks of
uranium over lifetime consumption of water were calculated and the results are
presented in Table 4.24.
Table 4.24: The estimated lifetime cancer mortality and morbidity risk of 238
U in
the water Samples.
In Table 4.24, the cancer mortality risk ranged from 1.67 × 10‒8
to 1.03 × 10‒
7 while for morbidity risk ranges from 4.88 × 10
‒9 to 1.57 × 10
‒7. The highest cancer
mortality value was found at Lugbe borehole with a value of 1.03 × 10‒7
and lower
value reported at Gosa borehole with a value of 1.67 x 10‒8
. The highest cancer
morbidity of 1.57 x 10‒7
was noted at Lugbe whereas lower value of 1.67 x 10‒8
reported at Gosa borehole. The cancer risk comparing Lugbe cancer mortality risk of
1.03 × 10‒7
to 6.85 x 10‒8
and 9.12 x 10‒8
values of cancer mortality risks for Water
Board and hand-dug well respectively, Lugbe was distinctly higher than the two
Location Cancer
Mortality Risk
Cancer
Morbidity Risk
Reference
Dei-Dei 1.01 x 10‒7
1.55 x 10‒7
Present Study
Kubwa 3.19 x 10‒8
4.88 x 10‒9
Present Study
Gosa 1.67 x 10‒8
2.55 x 10‒8
Present Study
Lugbe 1.03 x 10‒7
1.57 x 10‒7
Present Study
Water Board 6.85 x 10‒8
1.05 x 10‒7
Present Study
Hand-dug well 9.12 x 10‒8
1.40 x 10‒7
Present Study
Odeda, Ogun
state, Nigeria 2.54 x 10
‒4 3.39 x 10
‒4
Amokom &
Jibri 2010
154
values. In contrast with a study reported by Amokom & Jibri, (2010) in Ogun State
Nigeria, Lugbe borehole water sample of 1.03 × 10‒7
was lower than 2.54 x 10‒4
value obtained. For cancer morbidity of 1.57 x 10‒7
obtained from Lugbe borehole
water sample was higher than 1.05 x 10‒7
and 1.40 x 10‒7
values obtained for cancer
morbidity for Water Board and hand-dug well water samples respectively when
compared but lower than the value of 3.39 x 10‒4
for cancer morbidity reported in
Ogun State Nigeria, (Amokom & Jibri, 2010). The cancer risk at 10‒7
is low
compared to the acceptable level of 10‒3
for the radiological risk (EPA-USA, 1999).
It can be noted that both cancer mortality and morbidity reported is to be high at
Lugbe borehole, the aquifer could be affected due to higher deformation of fractures
which enabled water to trap at the near surface since the subsurface geology permits
the rapid downward movement of water sources from the source.
4.6.3 Chemical Toxicity Risk of 238
U in Groundwater from the Study Area
The purpose of the chemical toxicity was to determine the effect of the
carcinogenic and non-carcinogenic risks associated with chemical toxicity in the
water sample selected for this study. The analysis was done using inductively
coupled plasma mass spectroscopy (ICP-MS). The chemical toxicity risk was
evaluated using the lifetime average daily dose of 238
U through drinking water intake,
and compared it with the reference dose (RFD) of 0.6 μg kg‒1
day‒1
(EPA-USA,
1999) used as a standard criteria for uranium in several foreign organizations and
thereby produce a hazard quotient, Equation (4.15) and the lifetime average daily
dose (LADD), Equation (4.16)
Hazard quotient = �/������ (4.15)
Ingestion LADD of drinking water = ��[���;����������
/����@\ (4.16)
where, LADD is lifetime average daily dose (μg kg‒1
day‒1
), EPC is the exposure
point concentration (μg L‒1
), IR is the water ingestion rate (L day‒1
); EF is the

155
exposure frequency (days year‒1
), ED is the total exposure duration (years), AT is the
average time (days) and BW is the body weight (kg). Using therefore, IR = 2 L day‒1
,
EF = 350 days, ED = 45.5 y, AT = 16,607.5 (obtained from 45.5 × 365) and BW = 70
kg (for a standard man). The chemical toxicity risk for uranium over a lifetime
consumption was estimated and presented in Table 4.25. The exposure dose ranged
from 1 x 10‒3
to 6 x 10‒3
μg kg‒1
day‒1
. The LADDs values were observed to be
higher in the Lugbe and Dei-Dei boreholes compared to Kubwa and Gosa boreholes.
This could be due to the altrabasic minerals emanated from the deep seated source
caused by magmatic and metamorphic processes of granitic intrusions and its
interconnectivity with geochemistry and aquifer bearing formation. The lowest value
of 1 x 10‒3 μg kg
‒1 day
‒1 was found in Gosa borehole. Comparing the LADD from
Dei-Dei and Lugbe to Water Board and hand-dug well, it can be observed that Dei-
Dei and Lugbe boreholes were higher than 4 x 10‒3
and 5 x 10‒3
values for Water
Board and hand-dug well respectively. By comparing the LADD obtained in this
study and the RFD (0.6 μg kg‒1
day‒1
) that is an acceptable level, the chemical
toxicity risk due to 238
U in the water samples were all below the RFD. This shows
that there may not be health risks associated with 238
U in the water samples which are
mainly due to the chemical toxicity risk of 238
U.
Table 4.25: The estimated lifetime average daily dose (LADD) of uranium in the
water samples.
Location LADD (μg kg‒1
day‒1
) Reference
Dei-Dei borehole 6 x 10‒3
present
Kubwa borehole 2 x 10‒3
present
Gosa borehole 1 x 10‒3
present
Lugbe borehole 6 x 10‒3
present
Water Board 4 x 10‒3
presnt
Hand-dug well 5 x 10‒3
present
RFD (Reference
Dose) 6 x 10
‒1
Ye-shin et al.,
2004

156
The LADD of 238
U in drilled borehole of Dei-Dei and Lugbe were higher
than Kubwa borehole, Gosa borehole, Hand-dug well and Water-Board. Probably,
222Rn may have escaped so easily from the Kubwa Borehole due to large scale
fractures found in the region which may have channel towards the surface. The low
activity level in Gosa may be caused by non-interconnectivity of fractures that
hampers groundwater yield in the zone reported by Omeje et al., (2014). In addition,
the Water Board of Abuja which is the public water supply in the region noted higher
than Kubwa and Gosa boreholes which may be attributed to solubility and high
content of toxic non-carcinogen metals in the source of the surface water of the
public water supply. Compared the Dei-Dei borehole and hand-dug well since both
were collected very close to each other but of varying depth, the LADD in Dei-Dei
borehole was noted to be higher than the hand-dug well. The higher value in Dei-Dei
borehole could be due to the bedrock waters are more alkaline, contain more
bicarbonate and change towards the sodium type especially at greater depth
(Juntunen 1991, Tarvainen et al., 2001). However, Dei-Dei borehole reported higher
value of LADD of 238
U than hand-dug well which may have formed soluble
complexes in aqueous phase in deeper well, (Langmuire 1978). The low level in
hand dug well may be due to 222
Rn escapes so easily since the depth is too shallow.
4.6.4 The Elemental Concentrations of Water Samples in Dei-Dei, Kubwa,
Gosa , Lugbe, Hand-Dug Well and Public Water Supply
The objective of determining the elemental concentrations was to infer the
source of the groundwater pollution in the study area. The concentrations of the
elements were determined using ICP-MS analysis in the same water samples. The
concentrations in mg L-1
of the elements in the study area are presented in Table
4.26.

157
Table 4.26: Results of elemental concentrations of water analysis in Dei-Dei, Kubwa
borehole, Water Board and hand-dug well and comparing with EPA 200.8 and Powel
et al.,1989
Sample
Location
Carcinogenic toxic Non-carcinogenic toxic elements
elements (mg L−1
) (mg L−1
)
As
Cr
Cd
Pb
Ni
Zn
Mg
K
Dei-Dei
borehole 0.002 0.004 0.0001 0.005 0.003 0.02 Nil Nil
Kubwa
borehole 0.0002 0.002 0.00002 0.0002 0.002 0.04 2.11 1.41
Gosa
borehole 0.0006 0.0003 0.0003 0.003 0.001 0.032 1.334 1.339
Lugbe 0.002 0.004 0.0001 0.014 0.021 0.277 0.037 0.0006
Water
Board 0.001 0.01 0.0002 0.012 0.008 0.04 Nil Nil
Hand-
dug well 0.003 0.001 0.00006 0.002 0.005 0.03 Nil Nil
U.S EPA
200.8 0.05 0.1 0.005 0.010 0.07 0.07 0.05 -
Powell et
al., 1989 - - - - - - - 8.0
Lead is one of the most abundant heavy metals in nature and could be toxic
for humans (UNSEAR, 2000). Most important anthropogenic source of lead in the
environment is combustion of gasoline with lead. In environmental, lead changes to
Pb2+
ion or as insoluble lead compounds. Residence time in blood and soft tissues is
one month, but in case of livers, it is 50 years (WHO, 1995). Maximum permissible
limit for lead in drinking water is 0.01mg L-1
(Council Directive 98/83/EC/1998
Quality of Drinking Water). The values obtained in the analysed water samples were
well below 0.01mg L-1
except Lugbe borehole and Water Board with values 0.014
mg L-1
and 0.012 mg L-1
respectively which were higher than the standard
recommended values (EPA, 200.8).
Cadmium is a metal found in natural deposit such as ores containing other
elements. Cadmium is used primarily for metal plating and coating operations,
including transportation equipment, machinery backing enamels, photography etc.
The major source in drinking water are corrosion of galvanised pipes, erosion of

158
natural deposit, discharge from metal refineries; runoff from waste batteries and
paints. Some people who drink water containing cadmium well in excess of the
maximum contaminant level of 0.005 mg L-1
or 5 ppb for many years could
experience kidney damage (2005 EPA Guidelines for Carcinogenic Risk
Assessment). Comparing to the present study from both the groundwater samples
and the public water (Water Board), they are below the contaminant level.
Arsenic is widely distributed in the environment because of its natural and
anthropogenic sources (Commission Directives 2003/40/CE/May 2003). In surface
and groundwater, arsenic is found dissolved in inorganic form (arsenite, arsenic) and
organic form (acid-monimetilarsonic MMA-DMA dimetilarsinic acid). Inorganic
arsenic is known to have high levels of toxicity, the allowable limits of As in natural
mineral water (Commission Directives 2003/40/CE/May 2003) and water for human
consumption (Commission 98/83/CE/3 Directives. Nov. 1998) was reduced to 0.05
mg L-1
total arsenic. Obtained levels in analyzed water samples were below the
acceptable limits.
Accumulation of metal ions in subsurface water is important to be known in
order to classify them for quality into standard and for consumption purposes. In this
view, the concentrations obtained in four water samples for eight metals toxic
assessments were below the acceptable limit. The Dei-Dei borehole, Kubwa
borehole, Gosa borehole and Lugbe borehole could be noted that they did not differ
much in toxic metal concentration values except in Pb in Gosa and Water Board
which reported slightly higher than the recommended limit. In the same way, the
concentrations of Zn, Cr, Mg and K reported are below the permissible limit except
Mg in Kubwa and Gosa boreholes which noted higher than the permissible limit. Mg
and K could only be traced in Kubwa, Gosa and Lugbe boreholes as shown in Table
4.30. It could be that the iron and manganese contents in groundwater in those areas
are high and could result in hard water compared to Dei-Dei borehole, hand-dug well
and Water Board samples. The carcinogenic risk level of toxic elements (Cr, Cd, As)
range from 2.0 x 10 ‒5
to 1.0 x 10‒2
and for non- carcinogenic (Pb, Zn, Ni, Mg and
K), ranges from 2.0 x 10‒4
to 2.11 x 100 as shown in Table 4.31. Comparing the
carcinogenic toxic metals (Cr, Cd, As,) and non-carcinogenic (Pb, Zn, Ni, Mg and K)
159
in the studied samples, it can be seen that the values of non-carcinogenic risks are
much larger than the values of the carcinogenic risk. This indicates apparently that
non carcinogenic pollutants in the drinking groundwater are the major health risks in
the groundwater in the study area.
The usefulness of determining elemental concentration comes from the fact
that the result can be used to create an overview of the sample, thus, the results can
be used to determine the origin of the sample in question or identifying sources of
pollution. Determination of toxic elemental concentrations can be used in hydro-
geochemical studies because of its potential to provide information about the water-
rock interaction and in some cases evaluate the groundwater flow.

160
CHAPTER 5
CONCLUSION
5.1 Summary
The result from the VES survey carried out in the study area indicated the
presence of lateritic or sandy topsoil, weathered basement and fractured basement. In
Gosa where the groundwater was complicated to explore, the VES indicated the
existence of both weathered and fractured basement which ideally could form good
aquifers. The major aquiferous zones in the study area are zones of brecciation
developed by intersection of regional fractures detectable on hill-shaded SRTM-
DEM images. The lineament map generated shows the presence of large scale
fractures around Gosa area; the fracture density is low and do not intersect. This
demonstrates the usefulness of integrating conventional vertical electrical sounding
(VES) survey with structural data derived from enhanced SRTM imagery in a
hydrogeologically complicated terrain.
The results of gamma-ray measurements presented in this work give current
information about natural radioactivity variation in layers of varying depths. This is
the first subsurface radioactive investigation in the region. The higher activity
concentrations of radionuclides (238
U, 232
Th and 40
K) in the study area may be due to
the accumulation of felsic granitic intrusion which intruded in the subsurface and
erratically distributed higher in near surface layers. Such variation or instability of

161
activity concentration of radionuclides with depth may be a function of lithological,
structural, topographic and climatic factors which work synergistically. 40
K values in
some rock samples activity concentrations were similar in biotite gneiss rock
samples; it could be that biotite granitic intrusion that is inferred as the formation in
those layers reflect the same activity of potassium in rock’s radioactivity
measurements (Maxwell et al., 2013a). It was identified from this study that layers in
the region may have encountered more effect of tectonic activities that resulted to
interbedding of intrusive materials of magmatic and metasediments that enhanced the
activity of radionuclides. In addition, the granitic intrusions produced by denudation
and tectonism show that the majority of the radionuclides genetically connected with
granitic intrusion built into metamorphosed rocks in the closest vicinity of the
intrusion. The identification of radioactive source rocks that could constitute higher
activity concentrations of 238
U, 232
Th and 40
K in subsurface layers geologically,
addressed the professionals in hydrogeology and water resources management: civil
engineers, environmental engineers, geologists and hydrologists who are engaged in
the investigation, management, and protection of groundwater resources in the region
suitable site for drilling hydrogeologically motivated boreholes.
In the study area, the mean annual effective dose from the natural
radionuclide (238
U) for the users of borehole was estimated to be 5.55 x 10‒5
mSv of
the annual collective dose. The highest annual effective dose from radionuclide was
noted in Lugbe Borehole with a value of 9.0 x 10‒5
mSv y‒1
. The lowest value was
reported at Gosa borehole which was geologically attributed to redox condition of
238U due to non-interconnectivity of fractures that serve as pathway for transports of
sediments through the groundwater system. The radiological risks of 238
U in the
water samples were found to be low, typically in magnitude of 10−7
. It could be that
the human risk due to 238
U content in water supplies both from groundwater and
public water that will result from ingestion in the area may likely be to the chemical
toxicity of 238
U as a heavy metal rather than radiological risk. Interestingly, the water
board reported distinctly high activity concentration of radionuclide and toxic
elements compared to some drilled wells in the study area but below recommended
limit. There is a variation of concentrations of heavy metals depending on the
chemical composition of the groundwater host rock which was inferred by this study.
Characterization in terms of concentrations of the metals in water samples collected

162
in the study areas contain arsenic of below the permissible limit, so to all other
elements. Determination of toxic elements in various types of environmental samples
is very important in creating a fingerprint of the sample and thus the results can be
used in determining the origin of the sample in question and to identify sources of
pollution. However, the analysis of both the carcinogen and non-carcinogen
chemicals indicate that non-carcinogenic risk from (Pb, Zn, Ni, Mg, K) are much
larger than the values of the carcinogenic risk (Cd, Cr, As) in the studied samples.
This indicates apparently that chemical carcinogenic pollutants in the groundwater
based drinking water are the major risk inducing chemical parameters in the study
area.
This study represents a useful radiometric interpretation data that could be of
importance in radio-epidemiological assessment, diagnosis and prognosis of
uranium-induced diseases to the population of the inhabitants of Abuja.
5.2 Recommendation and Future Work
In the case of activity concentrations of 238
U, 232
Th and 40
K in subsurface
layers in the study area, it is recommended that further research or replicate of the
similar method in two different regions but deeper depth of 80 m in each region
especially in sedimentary terrain and to compare the results with basement complex
region lithologically where this work was carried out.
Taking the whole analysis of the groundwater into consideration, it is
recommended that non-carcinogens pollution are the primary pollutants that pose the
health risk in the region and it is recommended that the groundwater in Abuja should
be treated before consumption to decrease the risk if the means is possible. At the
same time, measures of groundwater quality protection and monitoring should be
enhanced and new supply source which has lower risk must found.

163
REFERENCES
Abdullah, K., Sarfaraz, A. and Shadab, K. (2012). Geology and geomorphology of
the Manipur Valley using digitally Enhanced satellite image and SRTM
DEM in the Eastern Himalaya, India. Int. J. of Geosc., 3,1010 – 1018.
Abdallah, M. A. M. and Morsy, F. A. E. (2013). Persistent organochlorine pollutants
and metals residues in sediment and freshwater fish species cultured in a
shallow lagoon, Egypt. Environmental Technology, 34(13-16), 2389–2399.
Acworth, R.I. (1987). The development of crystalline basement aquifers in a tropical
Environment. Quarterly Journal of Engineering Geology, 20, 265 - 272.
Adams, F. and Dams, R. (1969). A compilation of precisely determined gamma
transition energies of radionuclides produced by reactor irradiation. Journal
of Radioanalytical Chemistry, 3, 99-121.
Ahmed, J., Baig, T.,Gul Kazi, A., Qadir Shah, G., Abbas Kandhro, H., Imran Afridi,
M., Balal Arain, M., Khan Jamali, Jalbani, N. (2010). Ecotoxicology and
Environmental Safety 73, 914–923.
Aieta, E. M., Singley, J. E., Trusell, A.R., Thorbjarnarson, K. W., McGuire, M. J.
(1987). Radionuclides in Drinking water: An overview. Journal of the
American Water worksAssociation, 79 (4), 144-152.
Ajayi, I. R., Ajayi, O.S., Fusuyi, A. S. (1995). The natural radioactivity of surface
soil in Ijero-Ekiti. Nigeria. Nig. J. of Phys., 7: 101-103.
Ajayi, O. S., Ajayi, I.R. (1999). Environmental gamma radiation levels of some
areas of Ekiti and Ondo State, South Western Nigeria. Nig. J. of Phys., 11:
17-21.
Ajibade, A., Woakes, M. and Rahaman, M. (1987). Proterozoic crustal development
in the Pan-African regime of Nigeria. Geodynamics Series. 17, 259-271.
164
Almeida, R. M. R., Lauria, D. C., Ferreira, A. C., Sracek, O. (2004). Groundwater
radon, radium and uranium in Região dos Lagos, Rio de Janeiro State, Brazil.
Journal of Environmental Radioactivity; 73 (3): 323–334.
Alnour, I., Wagiran, H., Ibrahim, N., Laili, Z., Omar, M., Hamzah, S. and Idi, B. Y.
(2012). Natural radioactivity measurements in the granite rock of quarry sites,
Johor, Malaysia. Radiation Physics and Chemistry. 81(12), 1842-1847.
Al-Sulaiti, H. (2011). Determination of natural radioactivity levels in the State of
Qatar using High Resolution Gamma-ray Spectroscopy. Ph.D. Thesis.
Universisty of Surrey. UK.
Anudu, G.K., Essien, B.I., Onuba, L.N., Ikpokonte, A.E. (2011). Lineament analysis
and interpretation for assessment of groundwater potential of Wamba and
adjoining areas, Nassarawa State, northcentral Nigeria. Journal of applied
technology in environmental sanitation, 1, 185 – 198.
Auu, Gui Ah. (1983). PUSPATI TRIGA REACTOR FUEL WORTH
MEASUREMENT. Nuclear Science Journal, 1, 9-12.
Bala, A.E. (2001). An evaluation of Landsat 5 Thematic Mapper data as a tool for
groundwater investigation in Basement Complex rocks of Nigeria.
Unpublished PhD Thesis, Ahmadu Bello University, Zaira, Nigeria.
Bala, A.E., Batalan, O., De Smedt, F. (2000).Using Landsat5 imagery in the
assessment of groundwater resources in the crystalline rocks around Dutsin
Ma, northwestern Nigeria. Journal of Mining and Geology, 36, 85 – 92.
Barongo, J. O., Palacky G. D. (1989). Investigation of electrical properties of
weather layers in the Yale area, Western Kenya, using resistivity soundings.
Geophysics,56, 133-138.
Black, R. R., Caby, R., Moussine-Pouchkine, A., Bayer, R., Bertrand, J.M., Boullier,
A.M., Fabre, J., Lesquer, A. (1979). Evidence for Late Precambrian plate
tectonics in West Africa. Nature, 278, 223 – 227.
Caby, R. (1989).Precambrian terrains of Benin, Nigeria and Northeast Brazil and the
Late Proterozoic South Atlantic fit. Geologic Society of American Special
Paper. 230, 145 – 158.
Cothern, R. C., P.A. Rebers , P. A. (1990) (Eds.) Radon, Radium and Uranium in
drinking water, Lewis Publishers.

165
Council Directive 98/83/EY/, of 3 November. (1998), on the quality of water
intended for human consumption, Official Journal of the European
Communites, L 330, 05/12/1998 s. 0032-0054; 1996.
Crancon, P., van der Lee, J. (2003). Speciation and mobility of uranium (VI) in
humic–containing soils. Radiochimica Acta; 91: 673–679.
Dada, S. S. (2008). Proterozoic evolution of the Nigeria – Boborema province. Geol.
Socei. Lond.Speci. Public. 294, 121 – 136
De Beer, J. H., Blume J., (1985). Geophysical and hydrogeological investigation of
the groundwater resources of western Hereroland, southwest
African/Namibia. Trans. Geol. Soc. S. Africa,88, 483-493.
Deflorin, O., Surbeck, H. (2004). Natürliche Radionuklide in Grundwässern des
Kantons Graubünden, In: Völkle H., Gobet M. Umweltradioaktivität und
Strahlendosen in der Schweiz. Bern; Bundesamt für Gesundheit.
Degueldre, C., Triay, I., Kim, J. I., Vilks, P., Laaksoharju, M., Miekeley, N. (2000).
Groundwater colloid properties: a global approach. Applied Geochemistry,15,
1043–1051.
Delleur, J.W. (1999).The Handbook of Groundwater Engineering. CRC Press, New
York.
Durrance, E. M. (1986). Radioactivity in Geology: Principles and Applications. New
York, NY (USA). John Wiley and Sons Inc.
Edet, A. E., Okereke, C. S. (1997). Assessment of hydrogeological conditions in
basement aquifers of the Precambrian Oban Massif, Southeastern Nigeria.
Journal of Applied Geophysics, 36, 195-204.
Edet, A.E., Teme, C.S., Okereke, C.S., Esu, E.O. (1994). Lineament analysis for
groundwater exploration in Precambrian Oban Massif and Obudu Plateau,
S.E Nigeria. Journal of Mining and Geology,30, 87 – 95.
Eisenbud, M. and Gesell, T. (1997). Environmental Radioactivity from Natural,
Industrial and Military Sources. Acad. press, San Diego, CA, 134-200.
Evan, R.D. (1969). Engineer's guide to elementary behaviour of radon daughters.
Health Phys.,17, 229- 252.
Fernandez, F., Lozano, J. C., Comez, J.M.G. (1992) Natural Radionuclides in
Ground Water in Western Spain. Radiation Protection Dosimetry ,45 (1–4):
227–229.
166
Fetter, C. W. (1994). Applied Hydrogeology, 3rd ed. Upper Saddle River, NJ: Prentice Hall,
Inc
Figgins PE. (1961) Radiochemistry of Polonium. NAS-NS Publication 3037.
Washington: U.S. Atomic Energy Commission.
Freeze, R.A. and Cherry, J.A. (1979). Groundwater. Prentice Hall, New Jersey, 604
pp
Galnett, R.H., Gardner, J.V. (1979). Use of radar for groundwater exploration in
Nigeria. West Africa.Proceedings of the 14th
International Symposium on
Remote Sensing of Environment, Ann Arbor, Michigan.
Gans, I., Fusban, H.U., Wollenhaupt, H., Kiefer, J., Glöbel, B., Berlich, J.,
Porstendörfer, J. (1987). Radium 226 und Andere Natürliche Radionuklide
im Trinkwasser und in Getränken in der Bundesrepublik Deutschland.
WaBoLu-Hefte 4/87, Institut für Wasser- Boden-und Lufthygiene des
Bundesgesund-heitsamtes.
Gbadebo, A.M. (2011). Natural redionuclides Distributions in granitic rocks and
soils of abandoned quarry sites, Abeokuta, South western Nigeria. Asian
Journal of Applied Sci.,4 : 176-185.
Godknows Igali. (2012). Nigeria Ranks 3rd
in Poor Water Access, by WHO and
UNICEF.11th
Session of Development partners Coordinating Meeting, Daily
Triumph Newspaper, May 10th
.
Goki, N.G., Ugodulunwa, F.X.O., Ogunmola, J.K., Oha, I.A., Ogbole, J.O. (2010).
Geological controls for groundwater distribution in the basement rocks of
Kanke, central Nigeria from geophysical and remotely sensed data. African
Journal of Basic and Applied Sciences,2, 104 – 110.
Greenberg, R. R., Bode, P. and De Nadai Fernades, E. A. (2011). Neutron activation
analysis: A primary method of measurement. Spectrochimica Acta Part B:
Atomic Spectroscopy. 66 (3), 193-241.
Grohmann, H.C., Riccomini, C., Machado-Alves, F. (2007). SRTM-based
morphotectonic analysis of the Pocos de Caldas Alkaline massif, Southern
Brazil. Computers & Geosciences, 33, 10 – 19.
Grzybowska, D., Wardaszko, T., Nidecka, J. (1983). Natural Radioactivity of Fresh
Waters in Poland. Polskie Archiwum Hydrobiologii; 30 (4): 309–318.
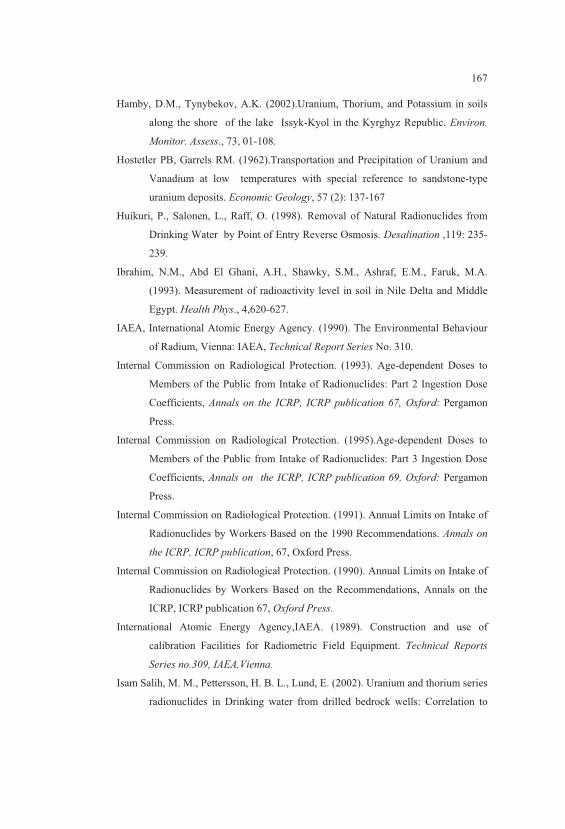
167
Hamby, D.M., Tynybekov, A.K. (2002).Uranium, Thorium, and Potassium in soils
along the shore of the lake Issyk-Kyol in the Kyrghyz Republic. Environ.
Monitor. Assess., 73, 01-108.
Hostetler PB, Garrels RM. (1962).Transportation and Precipitation of Uranium and
Vanadium at low temperatures with special reference to sandstone-type
uranium deposits. Economic Geology, 57 (2): 137-167
Huikuri, P., Salonen, L., Raff, O. (1998). Removal of Natural Radionuclides from
Drinking Water by Point of Entry Reverse Osmosis. Desalination ,119: 235-
239.
Ibrahim, N.M., Abd El Ghani, A.H., Shawky, S.M., Ashraf, E.M., Faruk, M.A.
(1993). Measurement of radioactivity level in soil in Nile Delta and Middle
Egypt. Health Phys., 4,620-627.
IAEA, International Atomic Energy Agency. (1990). The Environmental Behaviour
of Radium, Vienna: IAEA, Technical Report Series No. 310.
Internal Commission on Radiological Protection. (1993). Age-dependent Doses to
Members of the Public from Intake of Radionuclides: Part 2 Ingestion Dose
Coefficients, Annals on the ICRP, ICRP publication 67, Oxford: Pergamon
Press.
Internal Commission on Radiological Protection. (1995).Age-dependent Doses to
Members of the Public from Intake of Radionuclides: Part 3 Ingestion Dose
Coefficients, Annals on the ICRP, ICRP publication 69, Oxford: Pergamon
Press.
Internal Commission on Radiological Protection. (1991). Annual Limits on Intake of
Radionuclides by Workers Based on the 1990 Recommendations. Annals on
the ICRP, ICRP publication, 67, Oxford Press.
Internal Commission on Radiological Protection. (1990). Annual Limits on Intake of
Radionuclides by Workers Based on the Recommendations, Annals on the
ICRP, ICRP publication 67, Oxford Press.
International Atomic Energy Agency,IAEA. (1989). Construction and use of
calibration Facilities for Radiometric Field Equipment. Technical Reports
Series no.309, IAEA,Vienna.
Isam Salih, M. M., Pettersson, H. B. L., Lund, E. (2002). Uranium and thorium series
radionuclides in Drinking water from drilled bedrock wells: Correlation to

168
Geology and Bedrock radioactivity and dose estimation. Radiation Protection
Dosimetry 2002; 102 (3): 249–258.
Ivanovich, M., Harmon, R. S., (Eds.). (1982). Uranium series Disequilibrium.
Application to Environmental Problems, Clarendon Press, Oxford.
Jang, J. H., Dempsey, B. A., and Burgos, W. D. (2006). Solubility of Schoepite:
Comparison and selection of complexation and constants for U(VI). Water
Res. 40, 2738-2740.
Jibiri, N. N., Mabawonku, A. O., Oridate, A. A., ujiagbedion. (1999). Natural
radionuclides concentration level in soil and water around a cement factory at
Eweoro, Ogun, Nigeria. Nig. J. of Phy. 11, 12-16.
Juntunen, R. (1991).Uranium and radon in wells drilled into bedrock in Southern
Finland. Report of Investigation, Helsinki: Geological Survey of Finland
(98).
Kafala, S. and MacMahon, T. (1993). Neutron activiation analysis without muclti
element standards. Journal of radioanalytical and nuclear chemistry. 169 (1),
187-199.
Keller, G. V., Frischknecht, F. C. (1966). Pergamon Press, 1966 -Science - 519
pages
Knoll, G. F. (2000). Radiation detection and measurements. 3rd
ed.. John Wiley &
Sons, Inc. New York.
Kobal, I., Vaupotic, J., Mitic, D., Kristan, J., Ancik, M., Jerancic, S., Skofljanec, M.
(1990). Natural radioactivity of fresh waters in Slovenia, Yugoslavia.
Environmental International; 16 (2): 141–154. Koljonen T. (Ed.). (1992).
The Geochemical Atlas of Finland, Part 2: Till. Espoo. Geological Survey of
Finland.
Langmuir, D. (1978) .Uranium-solution equilibria at low temperatures with
applications to sedimentary Ore deposits. Geochimica Cosmochimica Acta
,42 (6): 547-569.
Lee, S. K. (2007) Natural background radiation in the Kinta District, Perak
Malaysia. Masters thesis, Universiti Teknologi Malaysia, Faculty of Science.
Lee, S.K., H. Wagiran, Ahmad T. R, Nursama H. A and A. K. Wood. (2009).
Radiological Monitoring: Terrestrial Natural Radionuclides in Kinta District,
Perak, Malaysia. J. of Environ. Radioact., 100, 368-374.

169
Lehtinen, M.,Nurmi,P., Ramo, T. (1998). Suomen Kalliopera 3000 Vuosimiljoonaa.
Jyvaskyla:Suomen Geologinen Seura; (in Finnish).
Lieser, K. H., Ament, A., Hill, R., Singh, R. N., Stingl, U., Thybusch, B. (1990).
Colloids in Groundwater and their Influence on Migration of Trace Elements
and Radionuclides. Radiochimica Acta; 49 (2): 83–100.
Lohman, S.W. (1972). Groundwater Hydraulic. U.S Geological Survey professional
paper, 708.
Lowder, V. M. (1990). Natural environmental radioactivity and radon gas. Proc. Of
Int. Workshop on Radon Monitoring in radioprotection, environmental
radioactivity and earth Sciences. World Scientific Singapore. P. 1-17.
Malaysia. M.Sc thesis, Universiti Teknologi Malaysia.
Loxnachar, Thomas, E., Brown, Kirk ,W.,Cooper, Terence, H., Milford, Murray, H.
(1999). Sustaining Our Soils and Society. American Geological Institute,
Soil Science Society of America, USDA Natural Resource Conservation
Service publication.
Lucas, H. F. (1985). 226Ra and 228Ra in water supplies: Journal of the American
Water Works Association, v. 77. no. 9, p. 57–66.
Mäkeläinen, I., Salonen, L., Huikuri, P., Arvela, H. (2002). Dose received and cancer
risk from natural radionuclides in drinking water in Finland. Proceedings of
the 5th International Conference on High Levels of Natural Radiation and
Radon Areas held in Munich, Germany on Sep 4-7, 2000. BfS Schriften.
Strahlenhygine. High Levels of Natural Radiation and Radon Areas:
Radiation Dose and Health Effects. Volume II: Poster Presentations. General
Exposure Assessment; 24: 28-30.
Malczewski, D. ,Teper, L., and Dorda, J. (2004). Assessment of natural and
anthropgenic radioactivity levels in rocks and soils in the environs of
Świeradów Zdrój in Sudetes, Poland, by in situ gamma-ray spectrometry,
Journal ofEnvironmental Radioactivity 73, 233–245.
Malczewski, D., Sitarek, A., Zaba, J. and Dorda, J. (2005) . Natural radioactivity of
selected Crystalline rocks of Iera block, Prze. Geol. ,53 (3), 237-244.
Malczewski, D. and Żaba, J. (2007). 222
Rn and 220
Rn concentrations in soil gas of
Karkonosze-Izera Block (Sudetes, Poland), Journal of Environmental
Radioactivity 92, 144–164.

170
Maxwell, O., Wagiran, H., Ibrahim, N., Lee, S. K., Soheil, S. (2013a). Comparison
of 238
U, 232
Th, and 40
K in different layers of subsurface structuresion Dei-Dei
and Kubwa, Abuja, Northcentral Nigeria. Radiation Physics and Chemistry,
91, 70-80.
Maxwell, O., Wagiran, H., Ibrahim, N., Lee, S. K., Soheil, S. (2013b). Measurement
of 238
U, 232
Th, and 40
K in boreholes at Gosa and Lugbe, Abuja, North
Central Nigeria. Radiation Protection Dosimetry , pp 1-7.
Maxwell, O., Wagiran, H., Noorddin I., Oha I.A., Onwuka O. S., Soheil S. (2014).
Integrated geoelectrical and structural studies for groundwater investigation
in some parts of Abuja, Northcentral Nigeria. Near Surface Geophysics, 12,
doi:10.3997/1873-0604.2014007.
Mbonu, P.D.C., Ebeniro, J. O.,Ofoegbu. C. O., Ekine, A.S. (1991). Geoelectrical
Sounding for the determination of aquifer Characteristics in part of Umuahia
area of Nigeria. Geophysics, 56, 284-291.
Mendoza, J.A and Dahlin T. (2008). Resistivity imaging in steep and weathered
terrains. Near Surface Geophysics 6, 105–112.
Midtgård, A.K., Frengstad, B., Banks, D., Reidar Krog, J., Strand, T., Siewers, U.,
Lind, B. (1998) Drinking water from crystalline bedrock aquifers - not just
H2O. Mineralogical Society Bulletin; December: 9–16.
National Academy of Science. (1995). Nitrate and Nitrite in Drinking
Water. Washington, D.C.: National Academy Press.
National Research Council., (1999). Risk Assessment of Radon in Drinking Water.
Washinton D.C.: National Academy Press.
Nikolakopoulos, K. G.; Kamaratakis, E. K; Chrysoulakis, N. (2006). “ SRTM vs
ASTER elevation product. Comparison for two regions in Crete, Greece”.
International Journal of Remote Sensing 27 (21).0143-1161.
Novotny. (2003). Water quality – diffuse pollution and wastewater management.
2nd edition, John Wiley and Sons, Inc., 43–50.
Nur. A., Ayuni, N. K. (2004). Hydrologeolectrical study in Jalingo Metropolis and
environs of Taraba State, Northeastern Nigeria. Global Journal of Geological
Science ,2, 101-109.
Obaje, N.G. (2009). Geology and mineral resources of Nigeria. Lecture notes in
earth sciences, 120, pp 221.

171
Offodile, M. E. (1992). Groundwater study and development in Nigeria (1st Ed),
ISBN, 978-30956-2-4, Pp. 306-308.
Okeyedi, A.S., Gbadedo, A.K., Arowolo, T.A., Mustapa, A.O., Tehokossa.,(2012).
Measurement of Gamma-emitting Radionuclides in Rocks and Soil of
Saunder Quarry Site, Abeokuta, Ogun State, Nigeria. Journal of Applied
Sciences 12 (20) 2178 – 2181.
Oladapo, M. I., Akintorinwa, O.J. (2007). Hydrogeophysical study of Ogbesse,
southwestern Nigeria. Global Journal of Pure Sci, 13, 55-61.
Olorunfemi, M. O., Okakune, E. T. (1992). Hydrogeological and Geological
significance of Geoelectrical survey of Ile-Ife. Nigeria Journal of Mining and
Geology,28, 221-222.
Olorunfemi, M. O., Fasuyi, S. A. (1993). Aquifer types and
geoelectrical/hydrogeologic characteristics of the central basement terrain of
Nigeria. Journal of African Earth Sciences, 16; 309-317.
Omeje M., H., Wagiran, N. Ibrahim, Oha I.A, Onwuka O.S., P.E Ugwuoke, Meludu,
O. (2013). Geoelectrical investigation of aquifer problems in Gosa area of
Abuja, Northcentral Nigeria. International Journal of Physical Sciences, vol.
8 (13), pp. 549-559.
Oyawoye, M. O. (1972). The basement complex of Nigeria. In T.F.J. Dessauvagie
and A.J. Whiteman (eds). African Geology, Ibadan, 66 – 102.
Palacky, G.V. (1987). Resistivity characteristics of geologic target, in
electromagnetic methods in applied geophysics, Vol. 1, Theory, 1351.
Peterson, R. E., Rockhold, M. L., Serne, R. J., Thorne, P. D. and Williams, M. D.
(2008). Uranium contamination in the subsurface beneath the 300 Area,
Hanford Site, Washington. Pacific Northwest National Laboratory (PNNL),
Richland, WA (US).
Pfenning, G. , Klewe- Nebenius, H. , Seelmann-Eggebert, W.(1998). Chart of the
Nuclides. 6th
edition revised reprint.
Plewa, M. and Plewa, S. (1992). Petrofizyka, Wydawnictwa Geologiczne,
Warszawa, 248-271.
Powell, P., Bailey, R. J. , Jolly, P. K. (1987). Trace elements in British tap-water
Supplies.
Przylibski, T. (2004) .Concentration of 226
Ra in rocks of the southern part of Lower
Silesia (SW Poland), Journal of Environmental Radioactivity 75, 171–191

172
Swindon, WRc (Report PRD 706-M/1).
Pulawaski, B., Kurtn, K. (1977). Combined use of resistivity and seismic refraction
methods in groundwater prospecting in crystalline areas. Study project,
Kenya, DANIDA 5-33.
Rahaman, M.A. (1988). Recent advances in the study of the Basement Complex of
Nigeria. Precambrian Geology of Nigeria. Geol. Survey of Nigeria
publication, 11 – 43.
Reuter H.I, A. Nelson, Jarvis, A. (2007). An evolution of void filling interpolation
methods For SRTM data. International Journal of Geographic Information
Science, 21:9, 983–1008.
Reynolds J.M. (2011). An Introduction to Applied and Environmental Geophysics.
John Wiley & Sons Ltd., England, vol. 2, 712 pp.
Saleh, M. A., Ramli, A. T., Alajerami, Y. and Aliyu, A. S. (2013). Assessment of
natural radiation levels and associated dose rates from surface soils in pontian
district, Johor, malaysia. Journal of Ovonic Research. 9(1)
Salih, I., Bäckström, M., Karlsson, S., Lund, E., Pettersson, H.B.L. (2004) Impact of
fluoride and other aquatic parameters on radon concentration in natural
waters. Applied Radiation and Isotopes ,60 (1): 99–104.
Salonen, L. , Huikuri, P. (2000 & 2002 ). Elevated Level of Uranium Series
Radionuclides in Private Water Supples in Finland, Proceedings of the 5th
International Conference on High Levels of Natural Radiation and Radon
Areas held in Munich, Germany on Sep. 4-7, BfS Schriften. Strahlenhygine.
High levels of Natural Radiation and Radon Areas: Radiation Dose and
Health Effect. Volume II: General Exposure Assessment; 24: 28-30.
Salolen L. (1994) . 238
U series radionuclides as a source of increased radioactivity in
groundwater originating from Finnish bedrock. Future Groundwater
Resources at Risk: IAHS Publ. No. 222: 71-84.
Satpatty, B. N., Kanugo, B. N. (1976). Groundwater Exporation in Hard rock terrain,
A case Study. Geophysical prospecting,24, 725-736.
Saumande, P., Reix, F., Beck, C . (1973 )Etude de la radioactivté des eaux naturelles
du Limousin: Le radium 226, l´uranium et le radon. Bulletin De La Societe de
Pharmacie de Strasbourg , XVI (2): 141–152.
Shemang, E. N. (1993). Groundwater potentials of Kubami River Bassin, Zaria,
Nigeria, from D.C Resistivity study. Water Resources 2, 36-41.

173
Silva, R., Nitsche, H. (1995). Actine Environmental Chemistry. Radiochimica
Acta,70/71: 377-396.
Smith, B. M., Grune, W. N., Higgins, F.B. , Terril, J. G., Jr. (1961). Natural
Radioactivity in Groundwater supplies in Maine and New Hampshire.
Journal of the American Water Works Association; 53 (1), 75–88.
Smith, L. L. , Alvarado, J. S. , Markun, F. J. , Hoffmann, K. M. , Seely, D. C. ,
Shannon, R. T. (1997). An Evaluation of Radium-Specific, Solid-Phase
Extraction Membranes. Radioactivity & Radiochemistry; 8 (1): 30–37.
SRTM. http://srtm.csi.cigar.org/ (Date of access 06/09/2010).
Stihi, C., Radulescu, C., Busuioc, G., I.V, Popescu, A, Gheboianu, Ene, A. (2011).
Rom. Journ. Phys., 56, no.1–2, 257–264.
Suksi, J. (2001). Natural Uranium as a Tracer in Radionuclide Geosphere Transport
Studies, Report Series in Radiochemistry 16/2001. Helsinki; University of
Helsink Department of Chemistry, Laboratory of Radiochemistry.
Supian, B.S., Evans, C.J. (1992). Statistics and nuclear counting: theory, problems
and solutions. Statistics and errors in measurements.Pp. 26-35.
Technical Procedure . (2003). NYE County Nuclear Waste Repository Project Office
Field Collection, Logging, and Processing of Borehole Geologic Sample, pp
19.(TP 8.0,Rev. 15).
Thomas, R . (2004). Practical Guide to ICP-MS, MarcelDekker Inc.
Todd, K. D. (1980). Groundwater Hydrology, 2nd
ed. New York: John Wiley and
Sons.
Tsoulfanidis, N . (1995). Measurement and Detection of Radiation. Taylor and
Francis.
Tarvainen, T. , Lahermo, P. , Hatakka, T. , Huikuri, P., Ilmasti, M., Juntunen, R.,
Karhu, J., Kortelainen, N., Nikkarinen, M., Vaisanen, U. (1999-
2000).Chemical Composition of well water in Finland- Main results of the
“One thousand wells” Project. Geological Survey of Finland, Current
Research ; Special Paper, 31: 57-76.
Tzortzis, M., Tsertos, H. (2004). Determination of thorium, uranium and potassium
Elemental concentrations in surface soils in Cyprus. J. Environ. Radioact. 77,
325-338.
Trimble, C.A. (1968). Absolute counting of alpha decay and the radioactivity in
water from Hot spring National Park. University of Arkansas; Thesis.
174
Ulbak. K., Klinder, O. (1984). Radium and Radon in Danish Drinking Water.
Radiation Protection Dosimetry; 7 (1–4): 87–89.
Ulrich, H. J., Degueldre, C. (1993). The sorption of 210Pb, 210Bi and 210Po on
montmorillonite: a study with emphasis on reversibility aspects and on the
effect of the radioactive decay of adsorbed nuclides. Radiochimica Acta, 62:
81–90.
United Nations Population Fund (UNFPA,(2013 &2014):
http://nigeria.unfpa.org/abuja.html.
United Nations Scientific Committee on the Effects of Atomic Radiation.,
UNSCEAR. (1998). Sources, effects and risks of ionising radiations. New
York.
United Nations Scientific Committee on the effects of Atomic Radiation,
UNSCEAR. (2000). Sources, effect and risks of ionising radiation. Report to
the General Assembly with Scientific Annexes. United Nations. New York.
United States Environmental Protection Agency. (2003). Current Drinking Water
Standards, Ground water and drinking water protection agency, pp. 1–12.
U.S. Environmental Protection Agency (EPA) .(1999). Cancer risk coefficients for
Environmental exposure to radionuclides. United State Environmental
Protection Agency. Federal Guidance Report No -13(EPA. 402 R-99-001).
U.S. Environmental ProtectionAgency. (1993). Diffuse NORM Waste
characterization and preliminary risk assessment, Washington, DC: U.S.
EPA; RAE-9232/1-2, Draft Report.
Usikalu, M. A., Anoka, O. C. and Balogun, F. A. (2011). Radioactivity measurement
s of the Jos Tin mine tailing in Northern Nigeria. Archives of Physics
Research, 2 (2): 80-86.
U.S. Nuclear Regulatory Commission, NRC. (1988). Health risk of radon and other
internally deposited alpha-emitters, Washington, DC. Academia press; NRC.
Report BEIR IV.
U.S Soil Conservation Service. (1951). A report based on data gathered under
cooporation agreement between the soil conservation service, the Idaho
Agricultural experiment station. Gem country. U.S Geological Survey.
Vaaramaa, K., Lehto, J., Ervanne, H. (2003). Soluble and Particle-Bound 234,238
U,
226Ra and
210Po in ground waters. Radiochimica Acta; 91 (1): 21–27.

175
Valeriano, Márcio, M., Kuplich Tatiana, M., Storino Moisés , Amaral Benedito, D.,
Mendes, J. r., Jaime, N. L., Dayson, J. (2006).Modelling small watersheds
in Brazilian Amazonia with Shuttle Radar Topographic Mission 90m data.
Comput. & Geosc.32, 1169 – 1181.
Veeger, A. I., Ruderman, N. C. (1998) Hydrogeologic Controls on Radon-222 in a
Buried Valley- Fractured Bedrock Aquifer System. Ground Water; 36 (4):
596–604.
Von Gunten, H.R., Benes, P. (1995). Speciation of Radionuclides in the
Environment. Radiochimica Acta ; 69: 1–29.
Wright, R., Garbeil, H., Baloga, S., Mougin-Mark, P., (2006). An assessment of
Shuttle Radar Topographic Mission digital elevation data for studies of
volcano morphology. Remote Sensing of Environment 105, 41 – 53.
Williams, B. A., Brown, C. F., Um, W., Nimmons, M. J., Peterson, R. E., Bjornstad,
B. N., Lanigan, D. C., Serne, R. J., Spane, F. A. and Rockhold, M. L. (2007).
Limited field investigation report for uranium contamination in the 300 Area,
300-FF-5 operable unit, Hanford Site, Washington. Pacific Northwest
National Laboratory (PNNL), Richland, WA (US).
World Health Organization (WHO). (2008). Meeting the MDG drinking water and
sanitation target: the urban and rural challenge of the decade. WHO Library
Cataloguing-in-Publication Data .
World Health Organization. (2004). 3rd Edition of Guidelines on Drinking
Water Quality, Geneva.
WHO Lead. (1995). Environmental Health Criteria, Geneva, 165.
Xinwei, L., Xiaolon, Z. (2008). Natural radioactivity measurements in Rock samples
of Chihua Mountain National Geological Park, China. Radiat. Prot. Dosim.
128, 77-82.
Ye-shin, K., Hoa-sung, P., Jin-yong, K., Sun-ku, P., Byong-wook, C., Ig-hwan, S.,
Dong Chun, S. (2004). Health risk assessment for uranium in Korean
groundwater. J. Environ. Radioactivity, pp. 77-85.
Zelensky, A. V., Buzinny, M. G., Los, I. P. (1993). Measurement of 226
Ra, 222
Rn and
Uranium in Ukrainian Groundwater using Ultra-low level liquid scintillation
counting. In: Noakes JE, Schönhofer F, Polach HA. (Eds.) Advances in
Liquid Scintillation Spectrometry 1992, RADIOCARBON; 405–411.

176
Zielinski, R. A., Asher-Bolinder, A., Meier, A. L. (1995). Uraniferous waters of the
Arkansas River Valley, Colorado, U.S.A.: a function of geology and land use.
Applied Geochemistry; 10: 133–144.
Zhuo, W., Iida, T., Yang, X. (2001).Occurrence of 222
Rn, 226
Ra, 228
Ra and U in
groundwater in Fujian Province, China. Journal of Environmental
Radioactivity; 53: 111–120.
Zohdy, A. A., Eaton, C.P., Mabey, D. R. (1974). Application of surface geophysics
In groundwater investigation. Tech.Water resources investigation,
Washington. US. Geol. Survey.
177
APPENDIX A:
Accessibility map of the study locations of Dei-Dei, Kubwa, Gosa and Lugbe
showing positions of VES points for borehole locations in Abuja, North central
Nigeria

178
APPENDIX B:
Geological map of the study area (top) with schematic cross section (bottom)
showing the rock types and the cross section of where the boreholes were
drilled.
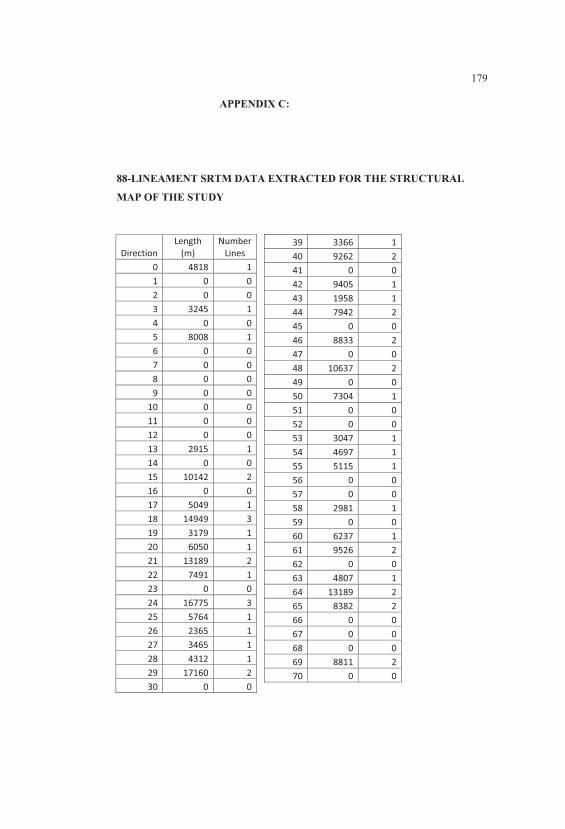
179
APPENDIX C:
88-LINEAMENT SRTM DATA EXTRACTED FOR THE STRUCTURAL
MAP OF THE STUDY
39 3366 1
40 9262 2
41 0 0
42 9405 1
43 1958 1
44 7942 2
45 0 0
46 8833 2
47 0 0
48 10637 2
49 0 0
50 7304 1
51 0 0
52 0 0
53 3047 1
54 4697 1
55 5115 1
56 0 0
57 0 0
58 2981 1
59 0 0
60 6237 1
61 9526 2
62 0 0
63 4807 1
64 13189 2
65 8382 2
66 0 0
67 0 0
68 0 0
69 8811 2
70 0 0
Direction
Length
(m)
Number
Lines
0 4818 1
1 0 0
2 0 0
3 3245 1
4 0 0
5 8008 1
6 0 0
7 0 0
8 0 0
9 0 0
10 0 0
11 0 0
12 0 0
13 2915 1
14 0 0
15 10142 2
16 0 0
17 5049 1
18 14949 3
19 3179 1
20 6050 1
21 13189 2
22 7491 1
23 0 0
24 16775 3
25 5764 1
26 2365 1
27 3465 1
28 4312 1
29 17160 2
30 0 0

180
119 0 0
120 0 0
121 0 0
122 0 0
123 0 0
124 0 0
125 0 0
126 0 0
127 0 0
128 0 0
129 0 0
130 0 0
131 0 0
132 0 0
133 0 0
134 0 0
135 0 0
136 0 0
137 0 0
138 0 0
139 0 0
140 0 0
141 0 0
142 0 0
143 396 1
144 0 0
145 0 0
146 0 0
147 0 0
148 0 0
149 0 0
150 0 0
151 0 0
152 0 0
153 0 0
154 0 0
155 0 0
156 0 0
157 0 0
158 0 0
79 5632 1
80 0 0
81 4884 1
82 3586 1
83 0 0
84 5016 1
85 0 0
86 0 0
87 0 0
88 0 0
89 0 0
90 77 1
91 4268 1
92 0 0
93 0 0
94 0 0
95 0 0
96 0 0
97 0 0
98 0 0
99 0 0
100 0 0
101 0 0
102 0 0
103 0 0
104 0 0
105 0 0
106 0 0
107 0 0
108 5401 1
109 0 0
110 0 0
111 0 0
112 0 0
113 0 0
114 0 0
115 0 0
116 0 0
117 0 0
118 0 0

181
APPENDIX D
CALCULATION OF 238
U AND 232
TH IN THORIUM ORE (IAEA S-14) AND
40K IN LAKE SEDIMENT (IAEA SL-2)
238U:
Concentration of 238
U in Thorium ore (S-14) = 29 ppm
The weight of measured sample used from S-14 = 20.01 g
The concentration of 238
U in S-14 used = 29 x 20.01μg g‒1
= 580.29 ppm
232Th:
For 232
Th in Thorium ore (S-14) = 0.061 (wt. %) = �b��?��?��?������ � zbzwv� � 10
‒4
= 610 ppm
The measure weight of S-14 used = 20.01 g
The concentration of 232
Th in S-14 used = 610 x 20.01 = 12206.1 ppm.
40K:
Specific activity of 40
K = 240 Bq kg‒1
(IAEA SL-2)
182
The weight of SL-2 used = 74.18 g
The activity of 40
K in SL-2 used = <���@ ?����q �� ytbv��¡ = 0.24 x 74.18 Bq
= 17.8 Bq

183
APPENDIX E
THE CONCENTRATION OF URANIUM AND THORIUM WAS
CALCULATED USING THE FOLLOWING FORMULA
std
stdsamp
sampstd
samp CNW
NWC .
�
�� (3.19)
where
Y�ZPF= concentration of sample collected (ppm)
Y��1= concentration of the standard sample (ppm)
Y��1 = weight of the standard sample (g)
�̂ZPF = weight of the sample collected (g)
C�ZPF= net counts of the photopeak area of the sample collected
C��1 = net counts of the photopeak area of the standard sample.
The uncertainty of the sample concentration was calculated by using the
accurate approach by Supian and Evans, 1992.
cY�ZPF$VV�) � ¢lc\LOG\LOG m
< � £c\LMNI\LMNI ¤
< � £c9LMNI\LMNI ¤
< lc9LOG9LOG m<¥
?n<¦�Y��1� (3.20)
Conversion factors were used to convert ppm to Bq kg‒1
. [238
U; 1ppm = 12.35 Bq kg‒
1;
232Th; 1ppm= 4.06 Bq kg
‒1]. Whereas 1% of
40K = 313 Bq kg
‒1 (IAEA, 1989).
The specific activity of potassium was calculated by using the formula:
std
stdsamp
sampstd
samp ANW
NWA .
�
��
(3.21)
where
184
5�ZPF = the specific activity of the sample collected (Bq Kg‒1
)
5��1 = the specific activity of standard sample (Bq Kg‒1
)
�̂�1 = the weight of the standard sample (Kg)
C�ZPF = the net counts of the photopeak area for the sample collected
�̂ZPF = the weight of the sample collected (Kg)
C��1 = the net counts of the photopeak area for the standard sample.
The uncertainty of the specific activity of potassium was calculated by using
the following formula:
c5�ZPF$VV�) � ¢lc\LOG\LOG m
< � £c\LMNI\LMNI ¤
< � £c9LMNI\LMNI ¤
< lc9LOG9LOG m<¥
?n<¦����5��1 (3.22)
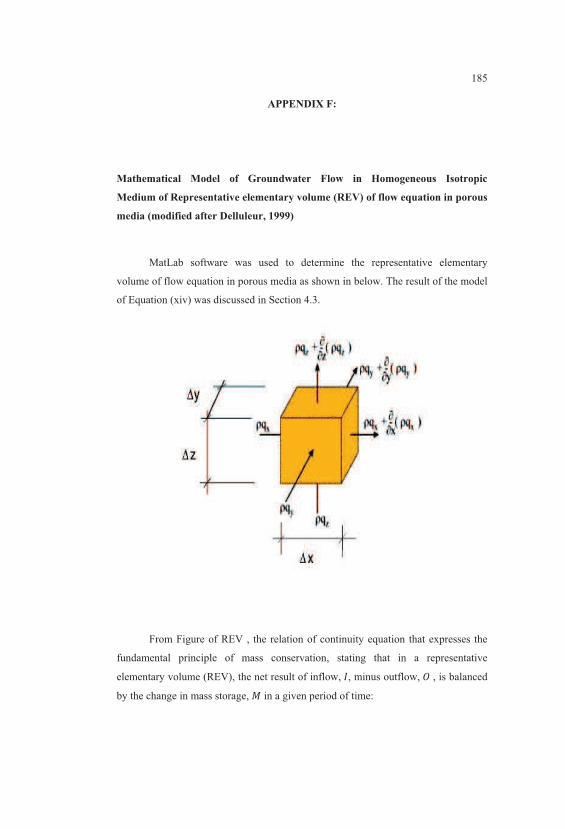
185
APPENDIX F:
Mathematical Model of Groundwater Flow in Homogeneous Isotropic
Medium of Representative elementary volume (REV) of flow equation in porous
media (modified after Delluleur, 1999)
MatLab software was used to determine the representative elementary
volume of flow equation in porous media as shown in below. The result of the model
of Equation (xiv) was discussed in Section 4.3.
From Figure of REV , the relation of continuity equation that expresses the
fundamental principle of mass conservation, stating that in a representative
elementary volume (REV), the net result of inflow, D, minus outflow, § , is balanced
by the change in mass storage, B in a given period of time:
186
D 0 § � ¨8¨� (i)
D and �§ represent mass fluxes, expressed in mass per unit time (kg s‒1
); they can be
computed using Darcy's law, which is the constitutive law of the porous media.
Equation (3.5) can also be written in the following form:
D 0 § � �© (ii)
where D and § now represent the mass inflow and the mass outflow, whose
fundamental dimension is mass [B].
Because Darcy's law is based on the difference of the hydraulic heads, in
order to individualize the solution, the boundary conditions are needed. Finally, for
transient simulations, the initial conditions meaning that the starting values for the
state variables are necessary because the state variables are functions of location
(spatial coordinates) and time. The continuity equation will lead to partial differential
equations, for which analytical solutions exist only in a limited number of cases.
Thus, numerical methods are largely employed to solve the usual practical problems
of flow in porous media. The equation of continuity is obtained using the same
principle for the unsaturated, respectively saturated media; there is only a small
difference concerning the water content: for unsaturated media it is variable in time,
while for saturated media it is a constant.
Continuity equation:
Consider a volume of soil (Figure 3.9), also called elementary control
volume. The lengths of the three sides are c%& c' and��c(�; the time step used for the
discretization of the continuity equation is cW. The water flux, -, flowing through the
REV has the components -��& -�� and -ª� Left side of the volume of the continuity equation:
The mass inflow D�� during the interval cW through the left face of area c' c( is:
D� � ��7� � �-��cW�c'c( (iii)
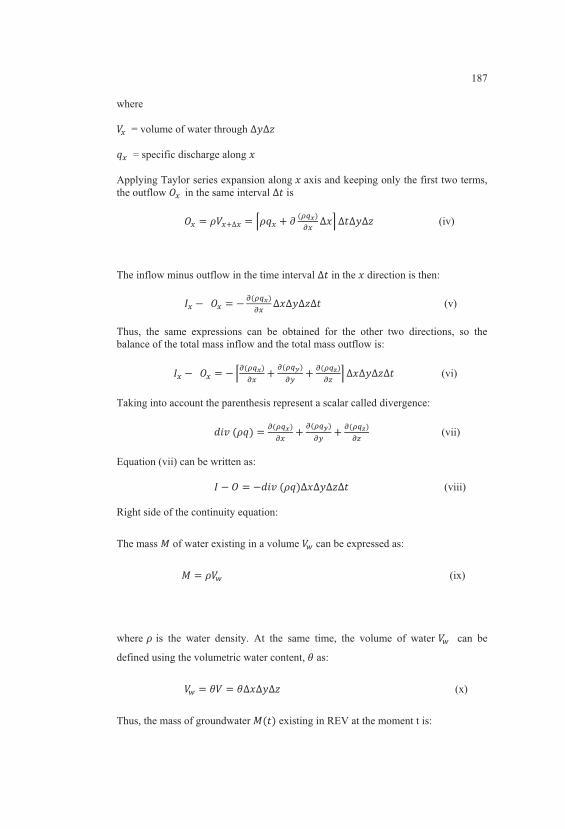
187
where
7� = volume of water through c'c(
-� = specific discharge along %�Applying Taylor series expansion along % axis and keeping only the first two terms,
the outflow §�� in the same interval cW is
§� � �7��c� � «�-� � ¬ $: )¨� c%® cWc'c( (iv)
The inflow minus outflow in the time interval cW in the % direction is then:
D� 0 ��§� � 0 ¨$: )¨� c%c'c(cW (v)
Thus, the same expressions can be obtained for the other two directions, so the
balance of the total mass inflow and the total mass outflow is:
D� 0 ��§� � 0 «¨$: )¨� � ¨$: ¯)¨� � ¨$: °)
¨ª ® c%c'c(cW (vi)
Taking into account the parenthesis represent a scalar called divergence:
X±²�$�-) � ¨$: )¨� � ¨$: ¯)
¨� � ¨$: °)¨ª (vii)
Equation (vii) can be written as:
D 0 § � 0X±²�$�-)c%c'c(cW (viii)
Right side of the continuity equation:
The mass B of water existing in a volume 7] can be expressed as:
B � �7] (ix)
where � is the water density. At the same time, the volume of water 7] can be
defined using the volumetric water content, as:
7] � 7 � c%c'c( (x)
Thus, the mass of groundwater B$W) existing in REV at the moment t is:
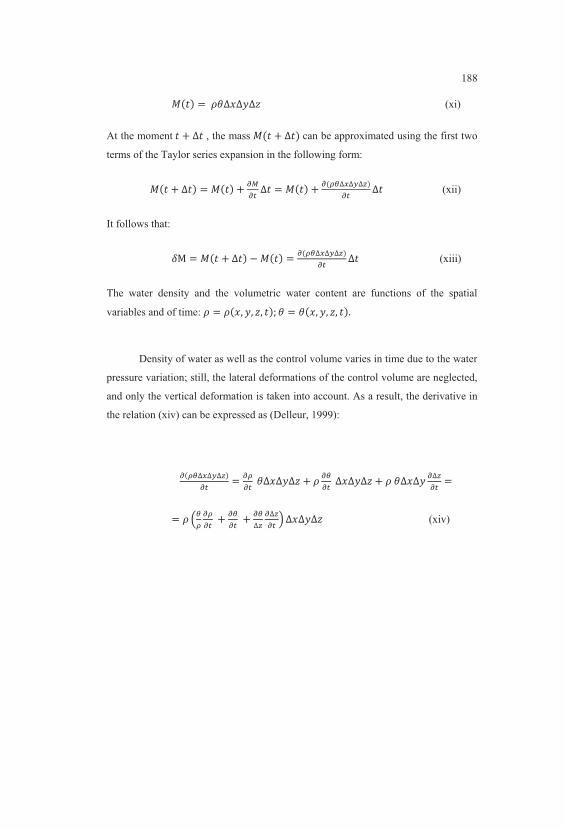
188
B$W) � ��c%c'c( (xi)
At the moment�W � cW , the mass B$W � cW) can be approximated using the first two
terms of the Taylor series expansion in the following form:
B$W � cW) � B$W) � ¨8¨� cW � B$W) � ¨$:³c�c�cª)
¨� cW (xii)
It follows that:
�© � B$W � cW) 0 B$W) � ¨$:³c�c�cª)¨� cW (xiii)
The water density and the volumetric water content are functions of the spatial
variables and of time: � � �$%& '& (& W)a � $%& '& (& W)b
Density of water as well as the control volume varies in time due to the water
pressure variation; still, the lateral deformations of the control volume are neglected,
and only the vertical deformation is taken into account. As a result, the derivative in
the relation (xiv) can be expressed as (Delleur, 1999):
¨$:³c�c�cª)
¨� � ¨:¨� �c%c'c( � � ¨³
¨� �c%c'c( � ��c%c' ¨cª¨� �
� � l³: ¨:¨� �� ¨³
¨� �� ¨³cª
¨cª¨� m c%c'c( (xiv)
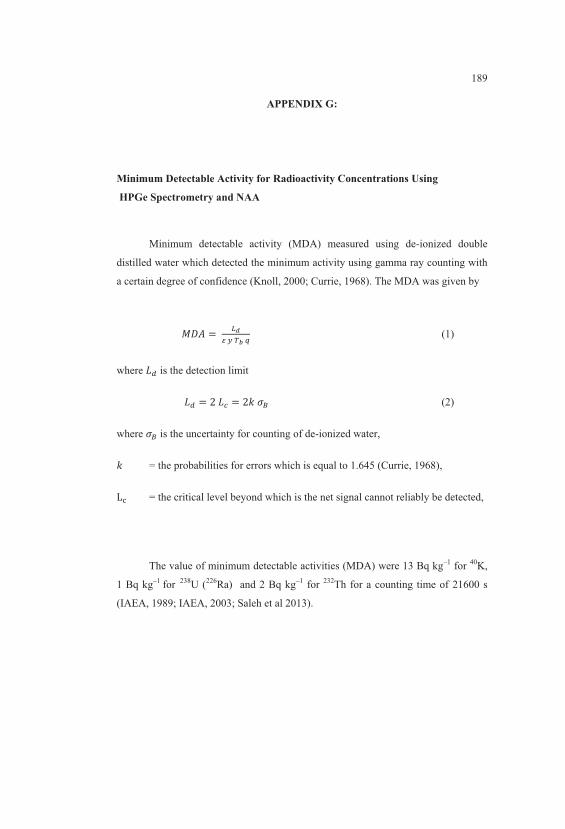
189
APPENDIX G:
Minimum Detectable Activity for Radioactivity Concentrations Using
HPGe Spectrometry and NAA
Minimum detectable activity (MDA) measured using de-ionized double
distilled water which detected the minimum activity using gamma ray counting with
a certain degree of confidence (Knoll, 2000; Currie, 1968). The MDA was given by
B�5 �� �G´����µ� (1)
where �1 is the detection limit
�1 � x��¶ � x·�¸@ (2)
where ¸@ is the uncertainty for counting of de-ionized water,
· = the probabilities for errors which is equal to 1.645 (Currie, 1968),
�¹ = the critical level beyond which is the net signal cannot reliably be detected,
The value of minimum detectable activities (MDA) were 13 Bq kg–1
for 40
K,
1 Bq kg–1
for 238
U (226
Ra) and 2 Bq kg–1
for 232
Th for a counting time of 21600 s
(IAEA, 1989; IAEA, 2003; Saleh et al 2013).

190
Detection Limit for Neutron Activation Analysis (NAA)
The limit of detection of a particular element refers to the lowest level to
which an analytical signal can be distinguished at a specific confidence level from a
background signal. The detection limit depends on the irradiation, the decay and the
counting conditions (Currier, 1968, Greenberg et al., 2011; Kafala and MacMahon,
2007; Al-Sulaiti, 2011). The detection limit is often estimated by using Currie’s
formula (Currier, 1968).
The counting threshold of a particular element is defined for making decision
if sample can be detected, namely, the critical level $�¹) according to Currie, �¹ is
defined as the level of the net signal above which the gross count can be considered
to be statistically different from background signal. The critical level �¹ is expressed
as
�¹ � �+º»¼½¾ � +�x� (3)
where +º� is the coverage is factor being employed, and »¼½¾ is the standard
deviation of Gaussian distribution for the number of counts in the blank. »¼½¾ which
can be estimated from the following relation
»¼½¾< � »¿�Às � »Às (4)
where »¿�Às is the variance of the signal and »Às is the variance of the blank. If »¼½¾ is approximately independent of the signal level, then
»¼½¾< � »¿�Às � »Às � x»Às (5)
For a single count, �»À< � �, and hence
»¼½¾< � x� (6)

191
Description level is subjected to two kinds of errors based on the net counts
result of a particular element. If the net counts �Á is less than���Ã, the element does
not contain any count above this limit at 95 % confidence level. The probability of
making an error in assuming a signal has been detected where no signal is actually
presented; this type of error is called �. The net count, ÁÂ& of element is given by
ÁÂ � ÁÄ 0 ÁÅ (7)
where ÁÅ is the number of count recorded with a blank sample and ÁÄ is the number
of counts recorded with element of interest.
If the second type of error, Æ is implemented, then the possibility of not
detecting the signal where one exists has to be taken into consideration. The
detection limit �Ç, can be described as the level of true net counts (signal). �1 can be
written as
��Ç � ��¹ ��+È»¼½¾ � ��¹ � +È�x� (8)
where +È is the coverage factor being employed in this case. If both types of errors
are set to be equal then
+º � +È � +
and thus
��Ç � x�¹ � x+»¼½¾ � x+�x� (9)
In this case, the detection limit is simply twice the critical level.
��1 � #�xÉ � vbwt{�É � xbuu�É (10)
where, 1.645 is the value of to give a 95 % confidence level, � is the background
area under the photopeak. The detection limit in unit of mass of an element is given
by the following equation:

192
��1 � <b���@� (11)
where Ê is called sensitivity of analysis, given as
� � [/P � >9M³�Ë´] A ��� (12)
where Ì is the atomic weight; other parameters are �, the reaction rate per second,
� , the saturation factor ( � � v 0 K}Í�fe�) , Î � K}Í�G� ; Decay factor, Y �$v 0 K}Í�N�) �! ; Counting factor, � � Ï�2 �̧ÐÐ is the reaction rate, CZ is the
Avogadro’s number (mol‒1
); is the isotopic abundance of target isotope CÑ, � is
the mass of the irradiated element (Ò), 5 is the net peak area, � is the gamma ray
abundance and is the peak efficiency of the detector.
The detection limit of elemental analysis investigated by neutron activation
analysis for 228 and 278 energy (keV) for 238
U is 0.80 ppm. 232
Th with 312 energy
(keV) has detection limit of 0.50 ppm.

193
APPENDIX H:
LIST OF PUBLICATIONS
Maxwell, O., Wagiran, H., Ibrahim, N., Lee, S. K., Soheil, S. (2013a). Comparison
of 238
U, 232
Th, and 40
K in different layers of subsurface structuresion Dei-Dei
and Kubwa, Abuja, Northcentral Nigeria. Radiation Physics and Chemistry,
91, 70-80.
Maxwell, O., Wagiran, H., Ibrahim, N., Lee, S. K., Soheil, S. (2013b). Measurement
of 238
U, 232
Th, and 40
K in boreholes at Gosa and Lugbe, Abuja, North
Central Nigeria. Radiation Protection Dosimetry , pp 1-7.
Maxwell, O., Wagiran, H., Noorddin I., Oha I.A., Onwuka O. S., Soheil S. (2014).
Integrated Geoelectrical And Structural Studies For Groundwater
Investigation In Some Parts Of Abuja, Northcentral Nigeria. Near Surface
Geophysics, 12, Doi:10.3997/1873-0604.2014007.
OMEJE, M., H., Wagiran, N. Ibrahim, Oha I.A, Onwuka O.S., P.E Ugwuoke,
Meludu, O. (2013). Geoelectrical investigation of aquifer problems in Gosa
area of Abuja, Northcentral Nigeria. International Journal of Physical
Sciences, vol. 8 (13), pp. 549-559.
Maxwell, O., Wagiran, H., Ibrahim, N., Lee, S. K., Soheil, S. (2014). Radiological
monitoring of borehole at Dei-Dei in Abuja, Northcentral Nigeria. ICSED
2014: February 19-21, Singarpore (APCBEE Pocedia). Singapore 2014
Published by Elsevier B.V. Selection and/or peer review under responsibility
of Asia-Pacific Chemical, Biological & Environmental Engineering Society.
Maxwell, O., Wagiran, H., Ibrahim, N., Lee, S. K., Soheil, S. (2014). Radiation
Hazards on borehole drillers in Dei-Dei Abuja, North Central Nigeria.
Proceeding of International Science Postgraduate Conference 2013
194
(ISPC2013) at Faculty of Science, Universiti Teknologi Malaysia.
O. Maxwell, H. Wagiran, S. Sabri, S. K. Lee and Z. Embong. (2014). Radioactivity
Level and toxic elemental concentration in groundwater at Dei-Dei and
Kubwa area of Abuja, Northcentral Nigeria. Submitted to Journal of
Radiation Physics and Chemistry.
O. Maxwell, H. Wagiran, N. Ibrahim , S. Sabri and Z. Embong. (2014). Natural
Radioactivity and Geological Influence on Subsurface Layers at Kubwa and
Gosa Area of Abuja, Northcentral Nigeria. Submitted to Journal of applied
radiation and Isotopes.
O. Maxwell, H. Wagiran, S. Sabri, S. K. Lee and Z. Embong. (2014). Health Risks
Associated with Radionuclides of Subsurface Lithology on Borehole Drillers
in Parts of Abuja, North Central Nigeria. Submitted to Journal of Stochastic
Environmental Research and Risk Assessment.


![[XLS] · Web view857.6 601.6 1081.472 915.2 512 254.72000000000003 254.72000000000003 652.80000000000007 1305.6000000000001 883.2 627.20000000000005 352 537.6 140.80000000000001 76.800000000000011](https://img.pdfslide.us/doc/110x75/5b9b455d09d3f22d2a8ce5f9/xls-web-view8576-6016-1081472-9152-512-25472000000000003-25472000000000003.jpg)


![[XLS] · Web viewSummary DAYWORK 1 BQ-10 BQ-9 BQ-8 BQ-7 BQ-6 BQ-5 BQ-4 BQ-3 BQ-2 BQ-1 Preamble Contents Example Notes Multiple post sign support assemblies (each type and size) Multiple](https://img.pdfslide.us/doc/110x75/5aff741f7f8b9aa34d906f7c/xls-viewsummary-daywork-1-bq-10-bq-9-bq-8-bq-7-bq-6-bq-5-bq-4-bq-3-bq-2-bq-1-preamble.jpg)