Embed Size (px)
Citation preview
Wimberley Rotary Club
March 4, 2014
Wimberley, Texas
Texas Population Characteristics,
Trends, and Projections
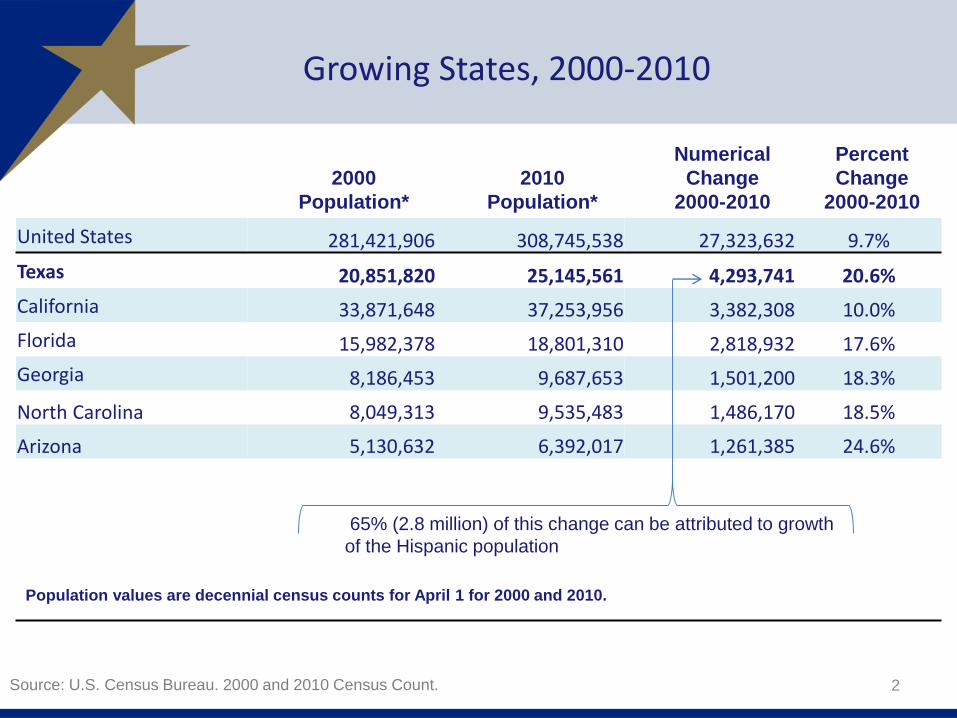
Growing States, 2000-2010
2
2000
Population*
2010
Population*
Numerical
Change
2000-2010
Percent
Change
2000-2010
United States 281,421,906 308,745,538 27,323,632 9.7%
Texas 20,851,820 25,145,561 4,293,741 20.6%
California 33,871,648 37,253,956 3,382,308 10.0%
Florida 15,982,378 18,801,310 2,818,932 17.6%
Georgia 8,186,453 9,687,653 1,501,200 18.3%
North Carolina 8,049,313 9,535,483 1,486,170 18.5%
Arizona 5,130,632 6,392,017 1,261,385 24.6%
Population values are decennial census counts for April 1 for 2000 and 2010.
Source: U.S. Census Bureau. 2000 and 2010 Census Count.
65% (2.8 million) of this change can be attributed to growth
of the Hispanic population
Percent Change
Due to
Year* Population
Numerical
Change
Annual
Percent
Change
Natural
Increase
Net
Migration
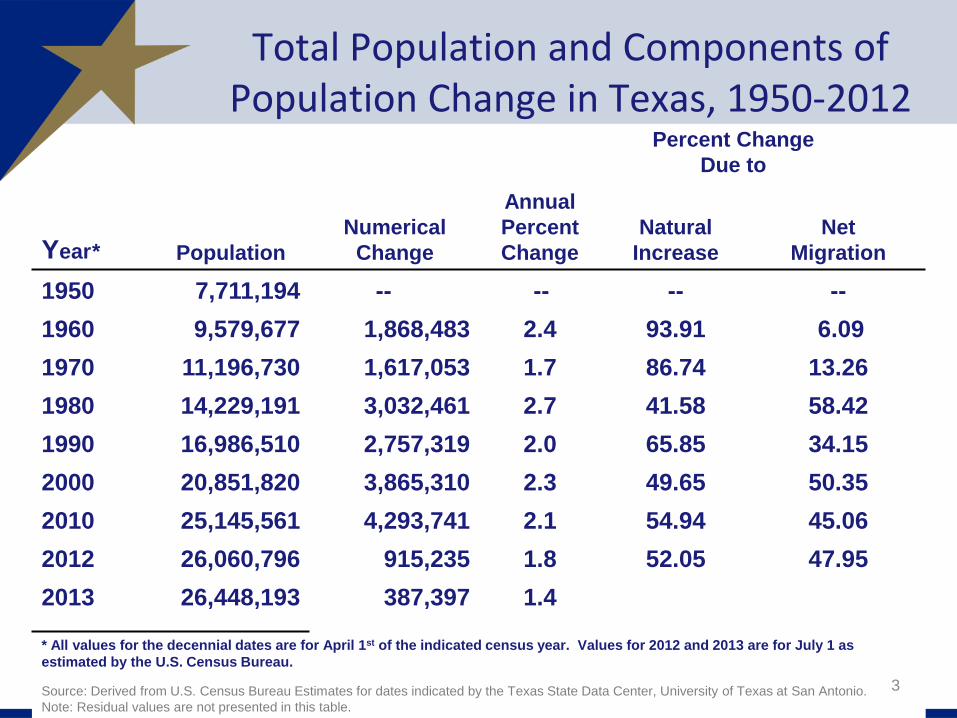
1950 7,711,194 -- -- -- --
1960 9,579,677 1,868,483 2.4 93.91 6.09
1970 11,196,730 1,617,053 1.7 86.74 13.26
1980 14,229,191 3,032,461 2.7 41.58 58.42
1990 16,986,510 2,757,319 2.0 65.85 34.15
2000 20,851,820 3,865,310 2.3 49.65 50.35
2010 25,145,561 4,293,741 2.1 54.94 45.06
2012 26,060,796 915,235 1.8 52.05 47.95
2013 26,448,193 387,397 1.4
* All values for the decennial dates are for April 1st of the indicated census year. Values for 2012 and 2013 are for July 1 as
estimated by the U.S. Census Bureau.
Source: Derived from U.S. Census Bureau Estimates for dates indicated by the Texas State Data Center, University of Texas at San Antonio.
Note: Residual values are not presented in this table.
Total Population and Components of Population Change in Texas, 1950-2012
3
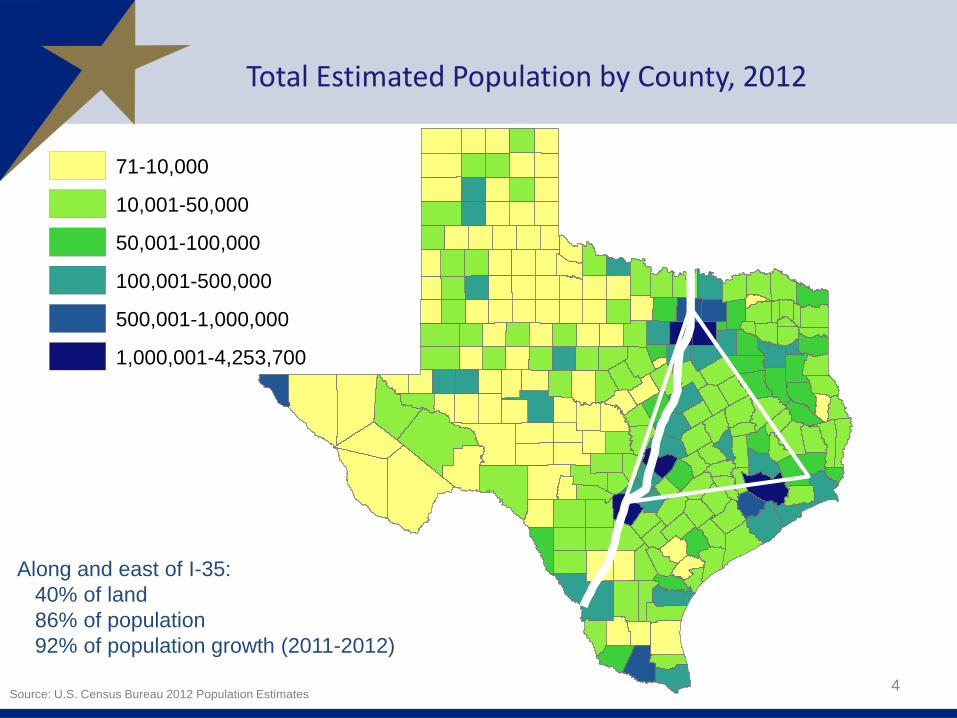
Total Estimated Population by County, 2012
4Source: U.S. Census Bureau 2012 Population Estimates
Along and east of I-35:
40% of land
86% of population
92% of population growth (2011-2012)
Legend
POPESTIMATE2012
71-10,000
10,001-50,000
50,001-100,000
100,001-500,000
500,001-1,000,000
1,000,001-4,253,700
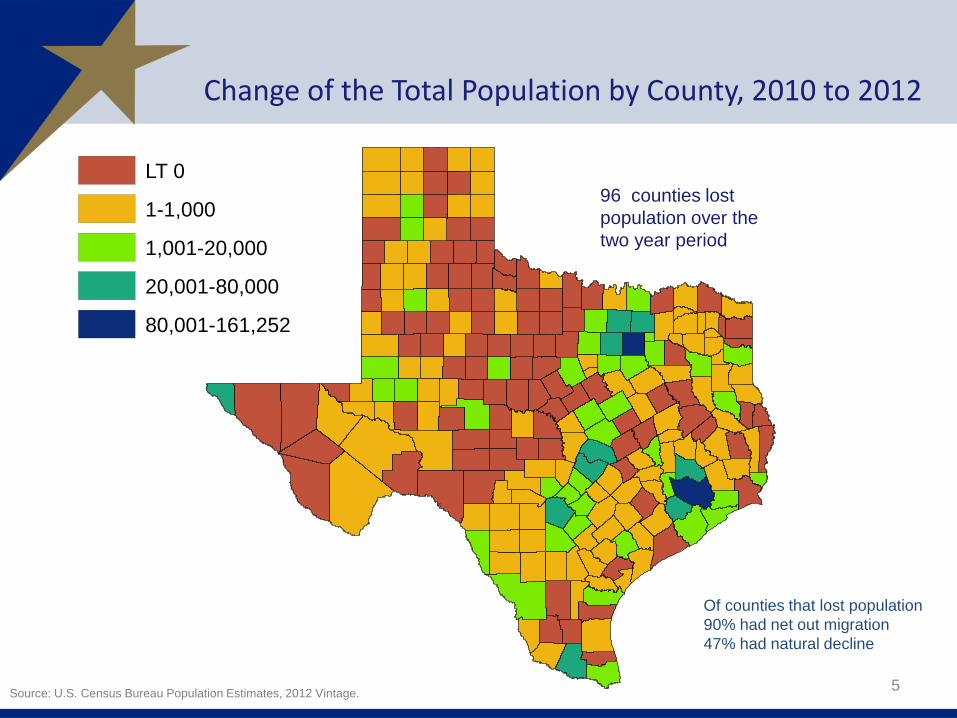
Change of the Total Population by County, 2010 to 2012
5Source: U.S. Census Bureau Population Estimates, 2012 Vintage.
96 counties lost
population over the
two year period
Legend
tl_2010_48_county10
popchg4201072012
LT 0
1-1,000
1,001-20,000
20,001-80,000
80,001-161,252
Of counties that lost population
90% had net out migration
47% had natural decline
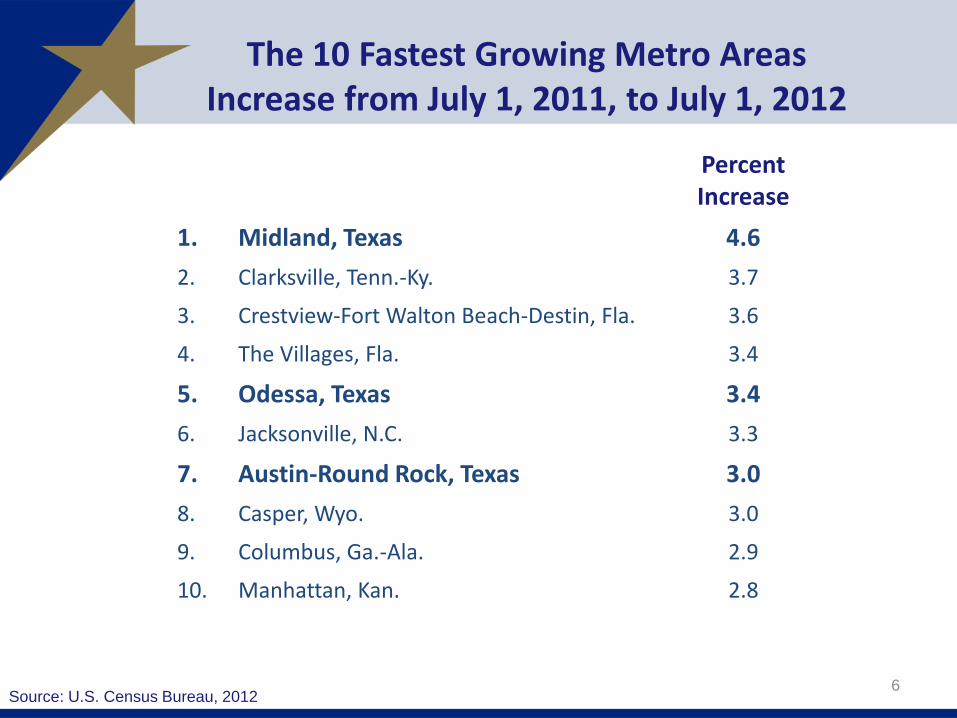
The 10 Fastest Growing Metro AreasIncrease from July 1, 2011, to July 1, 2012
6
Percent Increase
1. Midland, Texas 4.6
2. Clarksville, Tenn.-Ky. 3.7
3. Crestview-Fort Walton Beach-Destin, Fla. 3.6
4. The Villages, Fla. 3.4
5. Odessa, Texas 3.4
6. Jacksonville, N.C. 3.3
7. Austin-Round Rock, Texas 3.0
8. Casper, Wyo. 3.0
9. Columbus, Ga.-Ala. 2.9
10. Manhattan, Kan. 2.8
Source: U.S. Census Bureau, 2012

The 10 Counties with the Largest Numeric Increase from July 1, 2011, to July 1, 2012
7
NumericIncrease
1. Harris, Texas 80,005
2. Los Angeles, Calif. 73,764
3. Maricopa, Ariz. 73,644
4. Dallas, Texas 45,827
5. San Diego, Calif. 38,880
6. King, Wash. 35,838
7. Travis, Texas 34,381
8. Orange, Calif. 34,017
9. Tarrant, Texas 32,997
10. Clark, Nev. 32,833
Source: U.S. Census Bureau, 2013
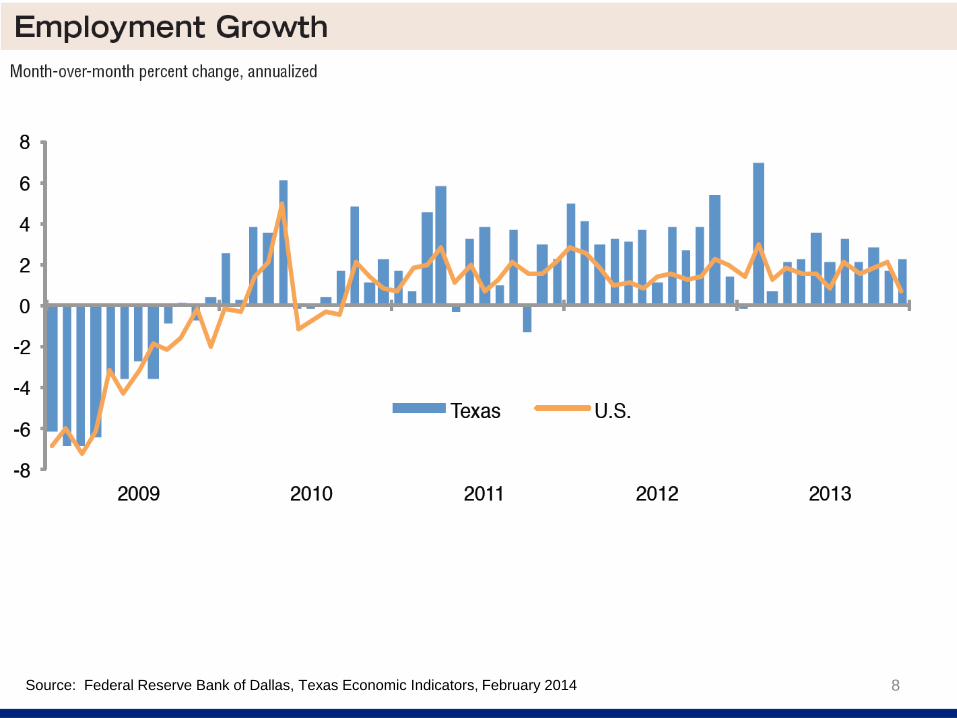
8Source: Federal Reserve Bank of Dallas, Texas Economic Indicators, February 2014
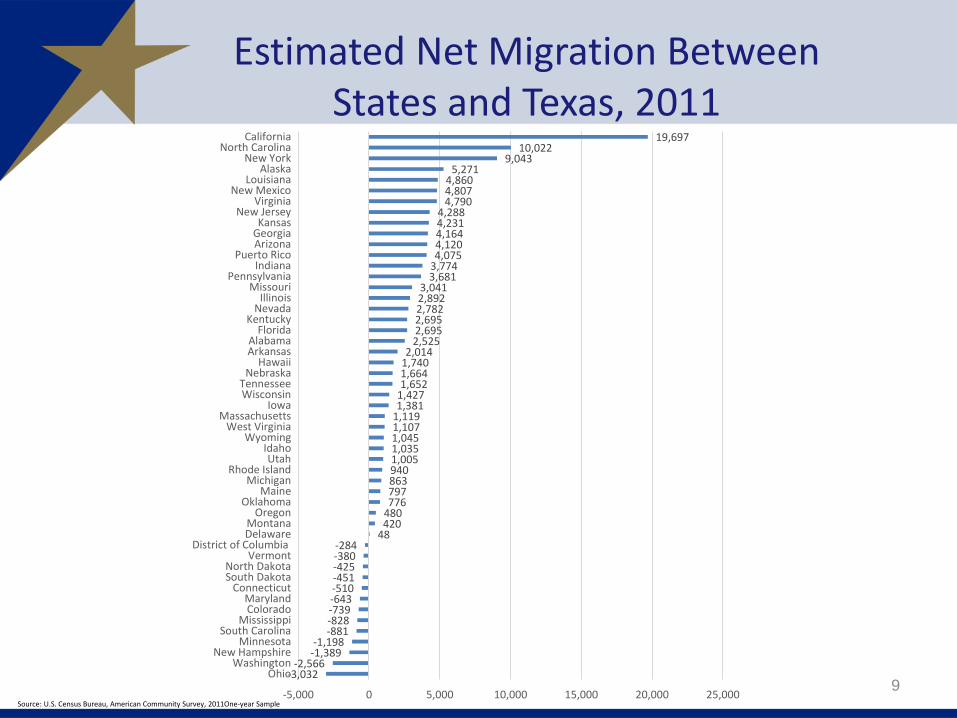
-3,032-2,566
-1,389-1,198
-881-828-739-643-510-451-425-380-284
484204807767978639401,0051,0351,0451,1071,1191,3811,4271,6521,6641,7402,014
2,5252,6952,6952,7822,8923,041
3,6813,7744,0754,1204,1644,2314,288
4,7904,8074,860
5,2719,043
10,02219,697
-5,000 0 5,000 10,000 15,000 20,000 25,000
OhioWashington
New HampshireMinnesota
South CarolinaMississippi
ColoradoMaryland
ConnecticutSouth DakotaNorth Dakota
VermontDistrict of Columbia
DelawareMontana
OregonOklahoma
MaineMichigan
Rhode IslandUtah
IdahoWyoming
West VirginiaMassachusetts
IowaWisconsinTennessee
NebraskaHawaii
ArkansasAlabama
FloridaKentucky
NevadaIllinois
MissouriPennsylvania
IndianaPuerto Rico
ArizonaGeorgiaKansas
New JerseyVirginia
New MexicoLouisiana
AlaskaNew York
North CarolinaCalifornia
Estimated Net Migration Between States and Texas, 2011
9Source: U.S. Census Bureau, American Community Survey, 2011One-year Sample
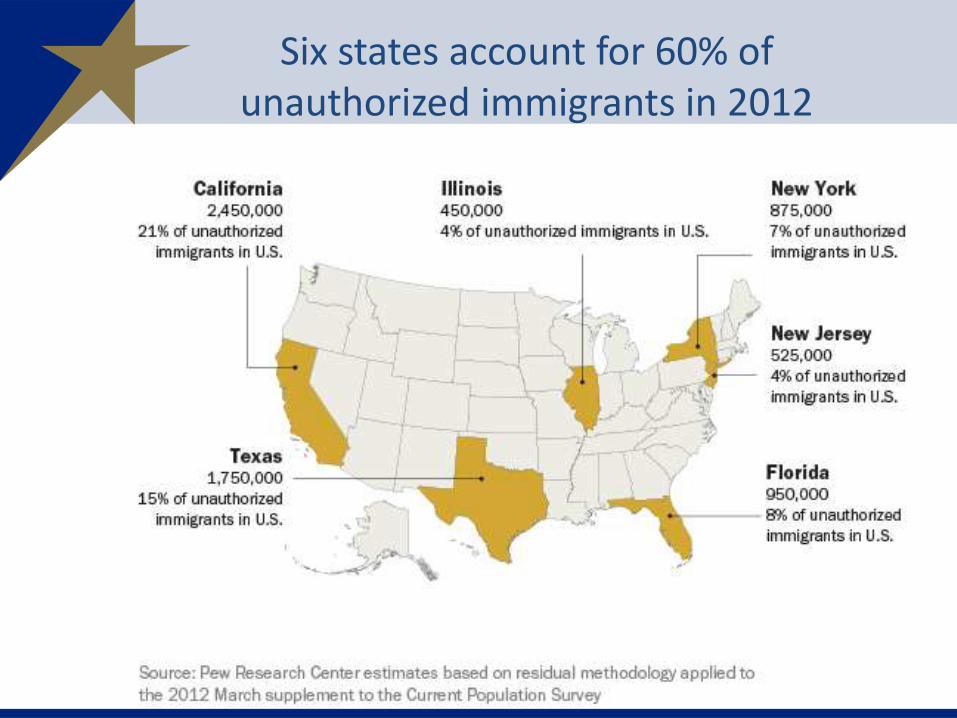
Six states account for 60% of unauthorized immigrants in 2012
10
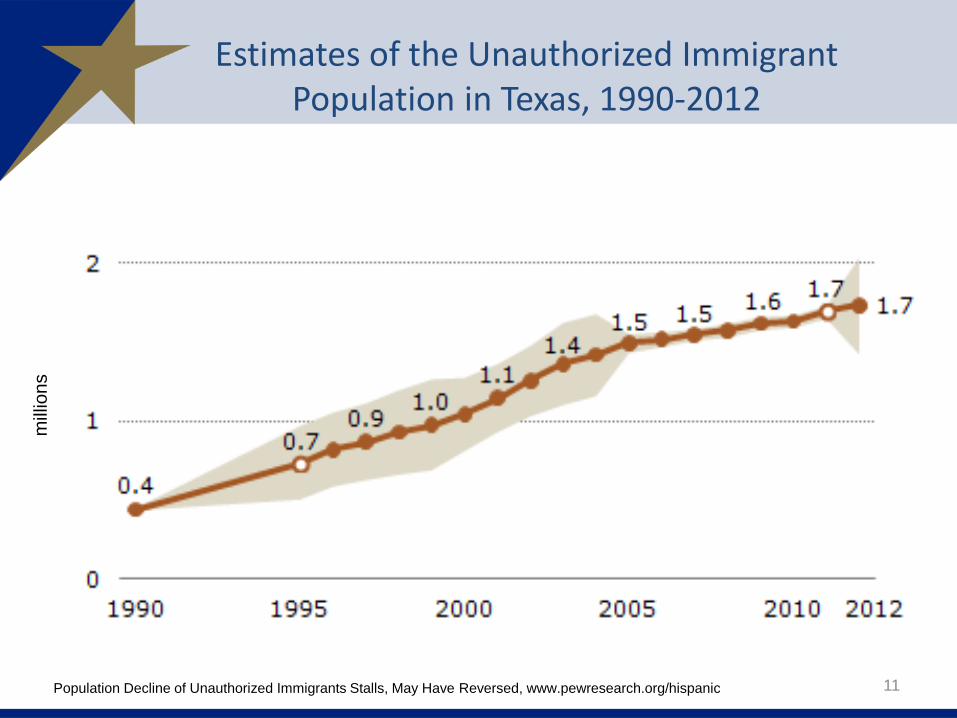
Estimates of the Unauthorized Immigrant Population in Texas, 1990-2012
11
mill
ion
s
Population Decline of Unauthorized Immigrants Stalls, May Have Reversed, www.pewresearch.org/hispanic
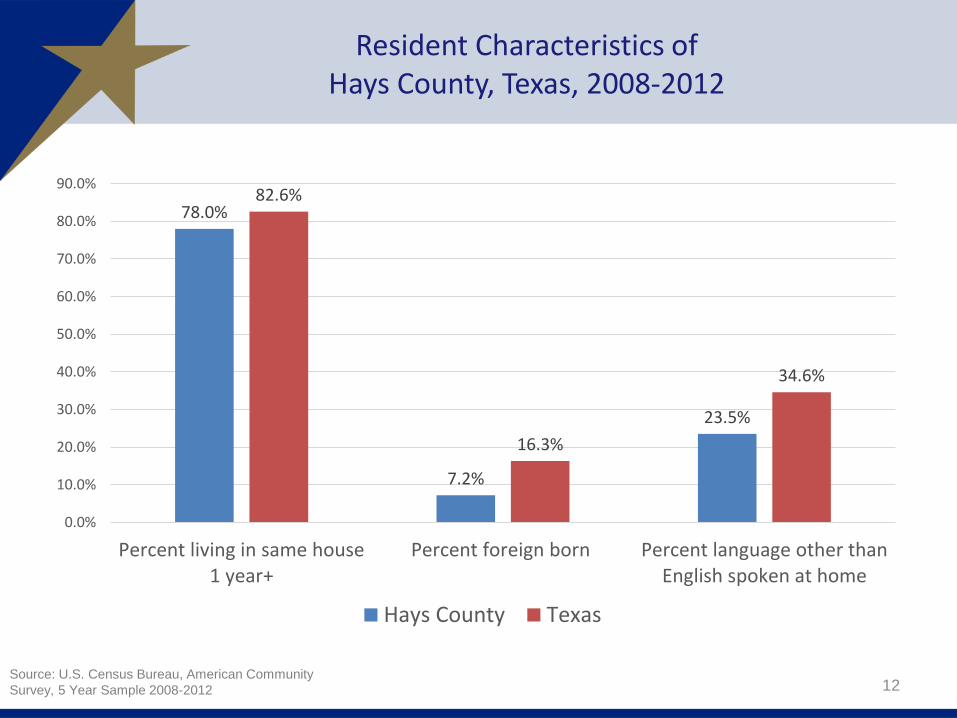
Resident Characteristics ofHays County, Texas, 2008-2012
78.0%
7.2%
23.5%
82.6%
16.3%
34.6%
0.0%
10.0%
20.0%
30.0%
40.0%
50.0%
60.0%
70.0%
80.0%
90.0%
Percent living in same house1 year+
Percent foreign born Percent language other thanEnglish spoken at home
Hays County Texas
12Source: U.S. Census Bureau, American Community
Survey, 5 Year Sample 2008-2012
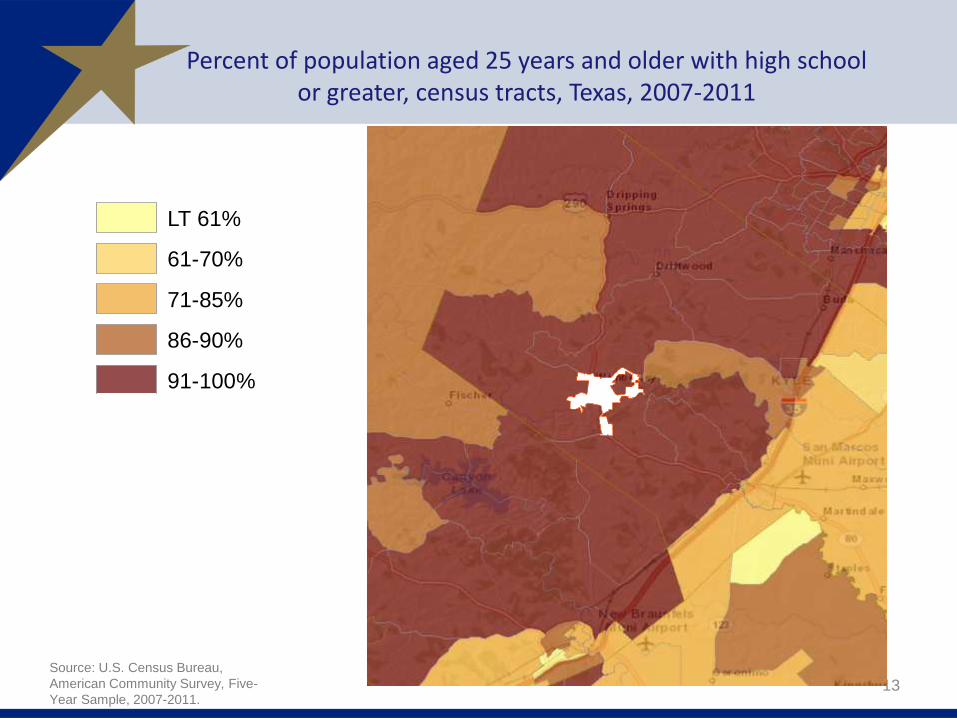
Percent of population aged 25 years and older with high school or greater, census tracts, Texas, 2007-2011
13
Legend
ACS_11_5YR_TRACT_48_TEXAS
HS and Greater
LT 61%
61-70%
71-85%
86-90%
91-100%
Source: U.S. Census Bureau,
American Community Survey, Five-
Year Sample, 2007-2011.
Sources: Esri, DeLorme, HERE, USGS, Intermap, increment PCorp., NRCAN, Esri Japan, METI, Esri China (Hong Kong), Esri(Thailand), TomTom
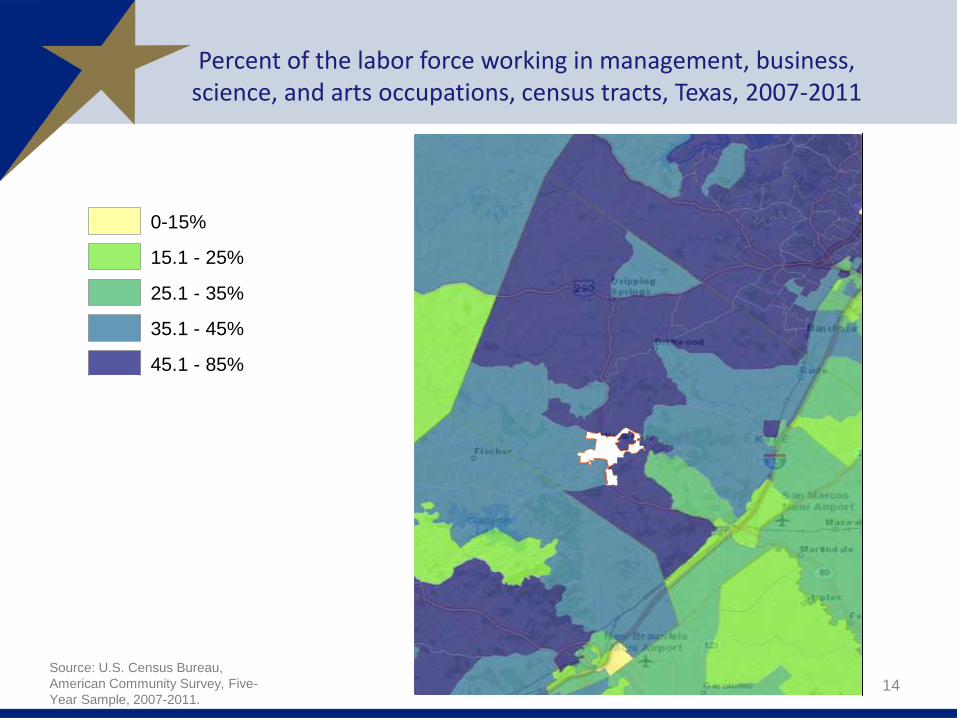
Percent of the labor force working in management, business, science, and arts occupations, census tracts, Texas, 2007-2011
14
Legend
ACS_11_5YR_TRACT_48_TEXAS
Pct Business Science
0-15%
15.1 - 25%
25.1 - 35%
35.1 - 45%
45.1 - 85%
Source: U.S. Census Bureau,
American Community Survey, Five-
Year Sample, 2007-2011.
Sources: Esri, DeLorme, HERE, USGS, Intermap, increment PCorp., NRCAN, Esri Japan, METI, Esri China (Hong Kong), Esri(Thailand), TomTom
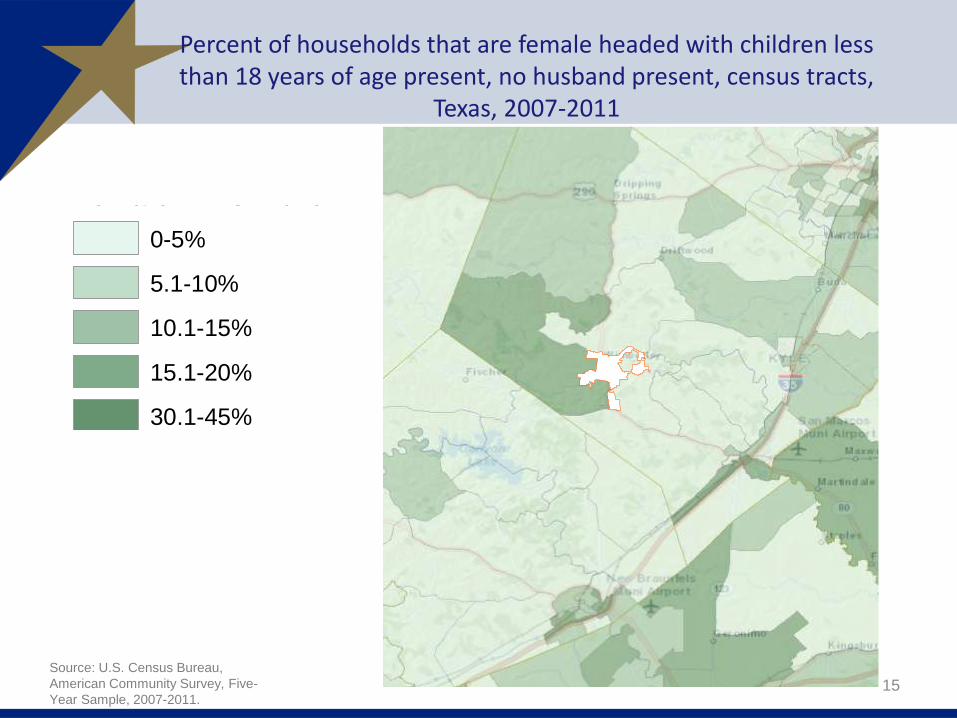
Percent of households that are female headed with children less than 18 years of age present, no husband present, census tracts,
Texas, 2007-2011
15Source: U.S. Census Bureau,
American Community Survey, Five-
Year Sample, 2007-2011.
Legend
ACS_11_5YR_TRACT_48_TEXAS
Female HH Children Present vc12
0-5%
5.1-10%
10.1-15%
15.1-20%
30.1-45%
Sources: Esri, DeLorme, HERE, USGS, Intermap, increment PCorp., NRCAN, Esri Japan, METI, Esri China (Hong Kong), Esri(Thailand), TomTom
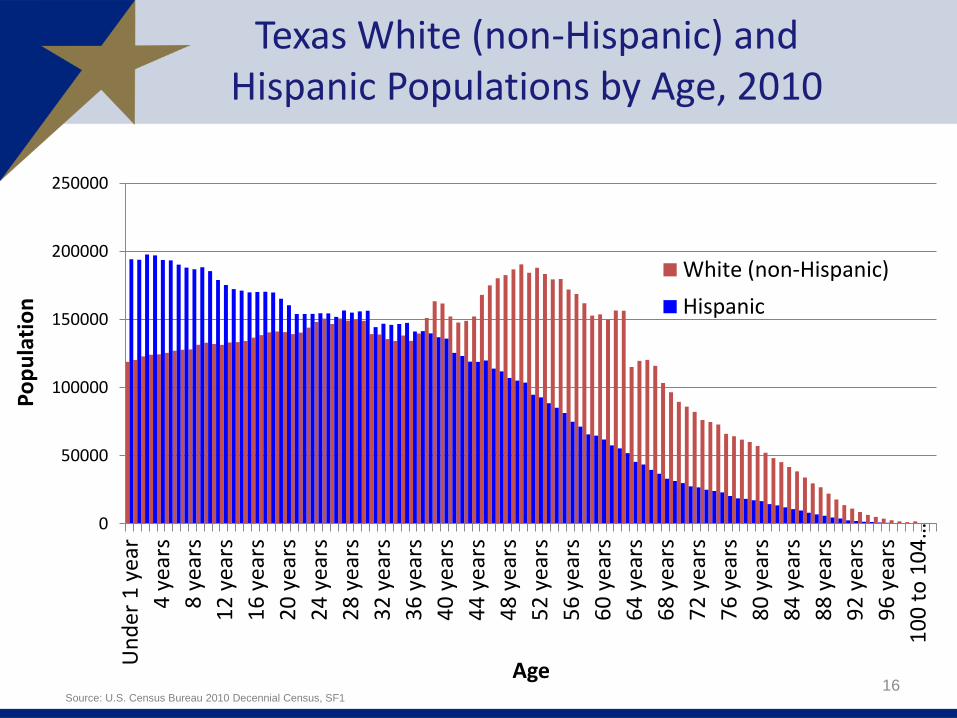
Texas White (non-Hispanic) and Hispanic Populations by Age, 2010
0
50000
100000
150000
200000
250000
Un
der
1 y
ear
4 y
ears
8 y
ears
12
yea
rs
16
yea
rs
20
yea
rs
24
yea
rs
28
yea
rs
32
yea
rs
36
yea
rs
40
yea
rs
44
yea
rs
48
yea
rs
52
yea
rs
56
yea
rs
60
yea
rs
64
yea
rs
68
yea
rs
72
yea
rs
76
yea
rs
80
yea
rs
84
yea
rs
88
yea
rs
92
yea
rs
96
yea
rs
10
0 t
o 1
04
…
Po
pu
lati
on
Age
White (non-Hispanic)
Hispanic
16Source: U.S. Census Bureau 2010 Decennial Census, SF1
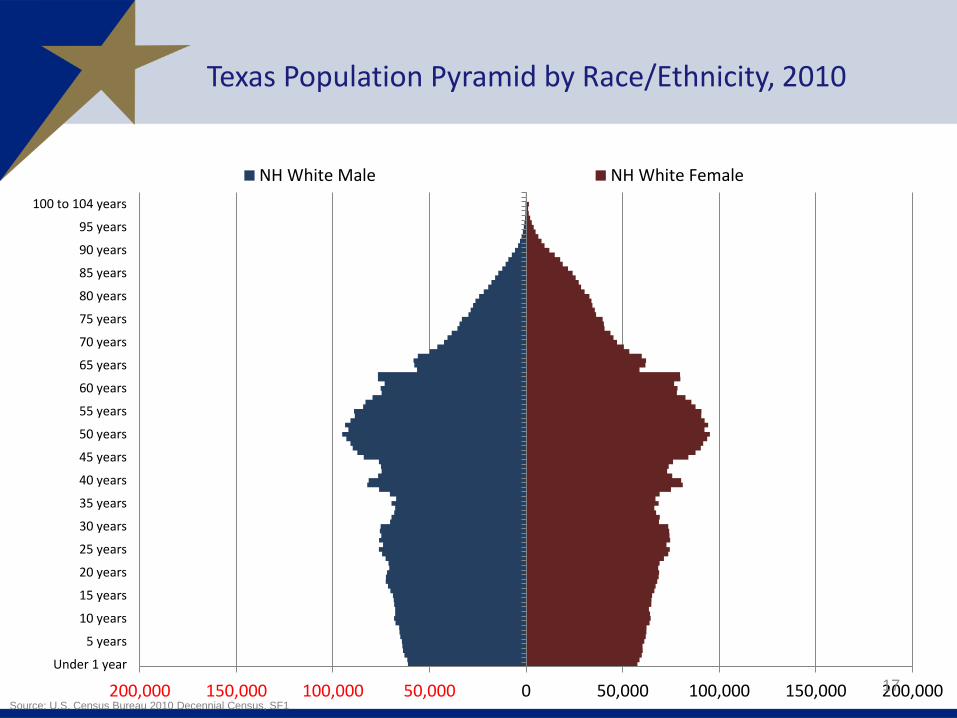
Texas Population Pyramid by Race/Ethnicity, 2010
200,000 150,000 100,000 50,000 0 50,000 100,000 150,000 200,000
Under 1 year
5 years
10 years
15 years
20 years
25 years
30 years
35 years
40 years
45 years
50 years
55 years
60 years
65 years
70 years
75 years
80 years
85 years
90 years
95 years
100 to 104 years
NH White Male NH White Female
17Source: U.S. Census Bureau 2010 Decennial Census, SF1
Texas Population Pyramid by Race/Ethnicity, 2010
200,000 150,000 100,000 50,000 0 50,000 100,000 150,000 200,000
Under 1 year
5 years
10 years
15 years
20 years
25 years
30 years
35 years
40 years
45 years
50 years
55 years
60 years
65 years
70 years
75 years
80 years
85 years
90 years
95 years
100 to 104 years
Hispanic Male NH Black Male NH Asian Male NH Other Male
Hispanic Female NH Black Female NH Asian Female NH Other Female
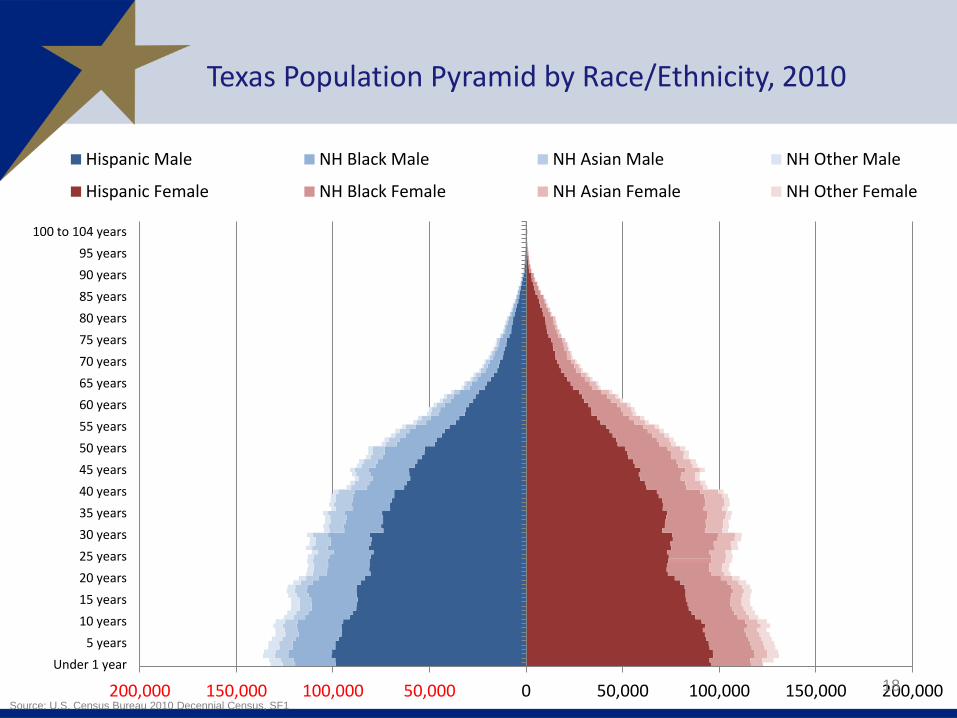
18Source: U.S. Census Bureau 2010 Decennial Census, SF1
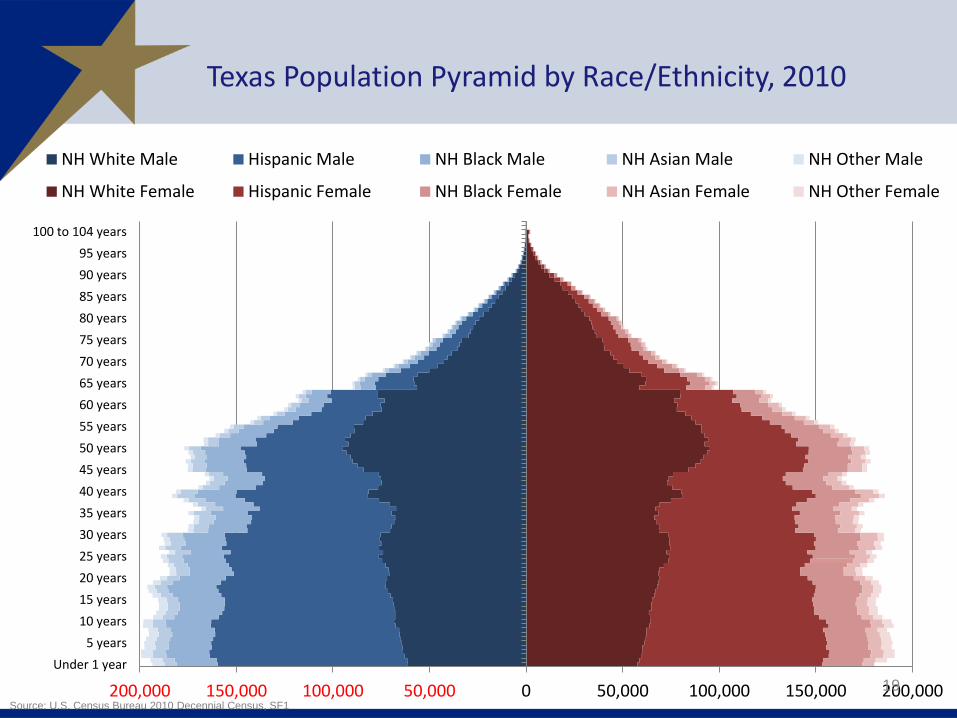
Texas Population Pyramid by Race/Ethnicity, 2010
200,000 150,000 100,000 50,000 0 50,000 100,000 150,000 200,000
Under 1 year
5 years
10 years
15 years
20 years
25 years
30 years
35 years
40 years
45 years
50 years
55 years
60 years
65 years
70 years
75 years
80 years
85 years
90 years
95 years
100 to 104 years
NH White Male Hispanic Male NH Black Male NH Asian Male NH Other Male
NH White Female Hispanic Female NH Black Female NH Asian Female NH Other Female
19Source: U.S. Census Bureau 2010 Decennial Census, SF1
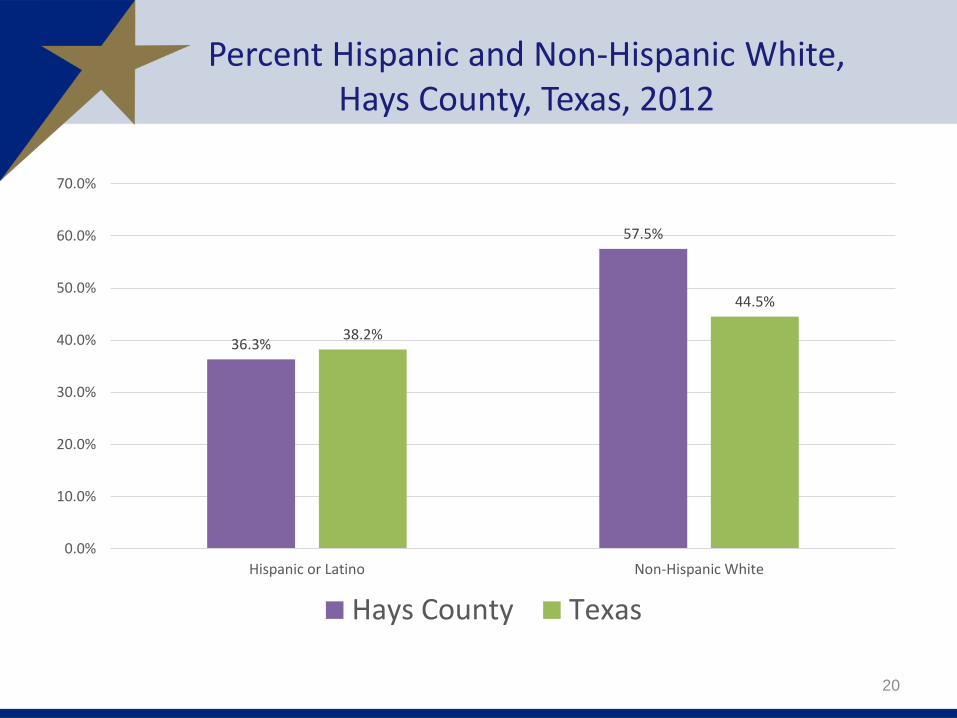
Percent Hispanic and Non-Hispanic White, Hays County, Texas, 2012
36.3%
57.5%
38.2%
44.5%
0.0%
10.0%
20.0%
30.0%
40.0%
50.0%
60.0%
70.0%
Hispanic or Latino Non-Hispanic White
Hays County Texas
20
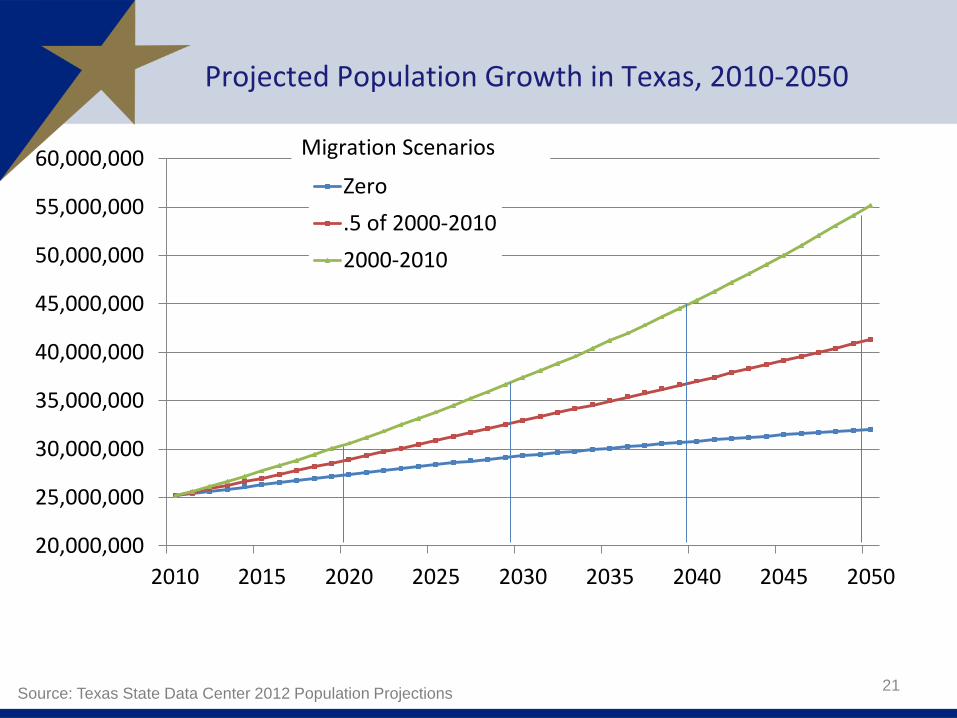
Projected Population Growth in Texas, 2010-2050
20,000,000
25,000,000
30,000,000
35,000,000
40,000,000
45,000,000
50,000,000
55,000,000
60,000,000
2010 2015 2020 2025 2030 2035 2040 2045 2050
Zero
.5 of 2000-2010
2000-2010
Migration Scenarios
21Source: Texas State Data Center 2012 Population Projections
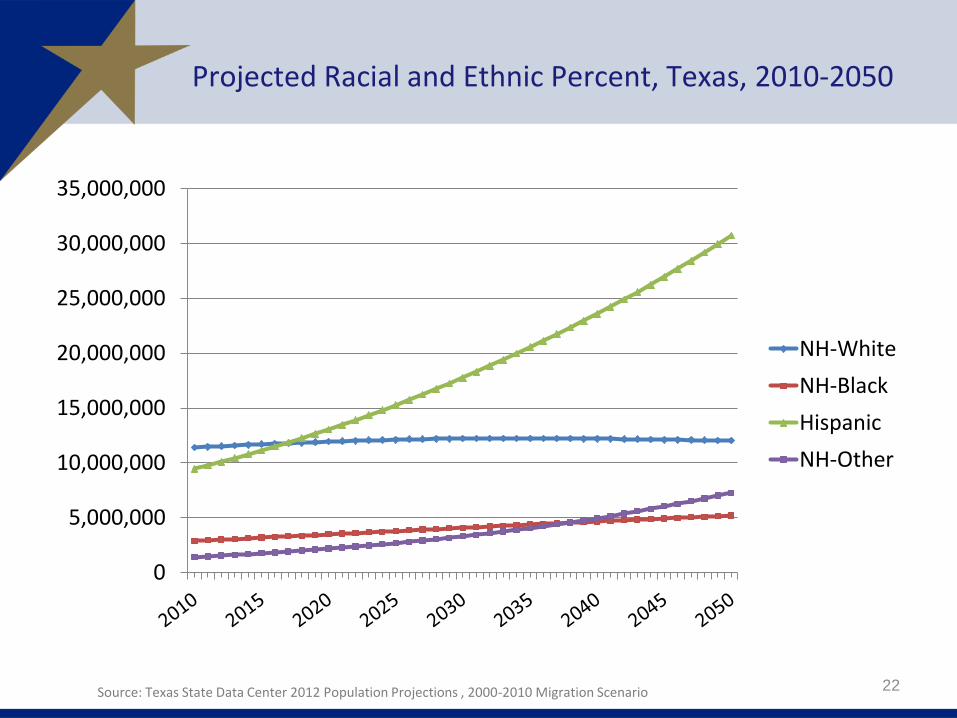
Projected Racial and Ethnic Percent, Texas, 2010-2050
0
5,000,000
10,000,000
15,000,000
20,000,000
25,000,000
30,000,000
35,000,000
NH-White
NH-Black
Hispanic
NH-Other
22Source: Texas State Data Center 2012 Population Projections , 2000-2010 Migration Scenario
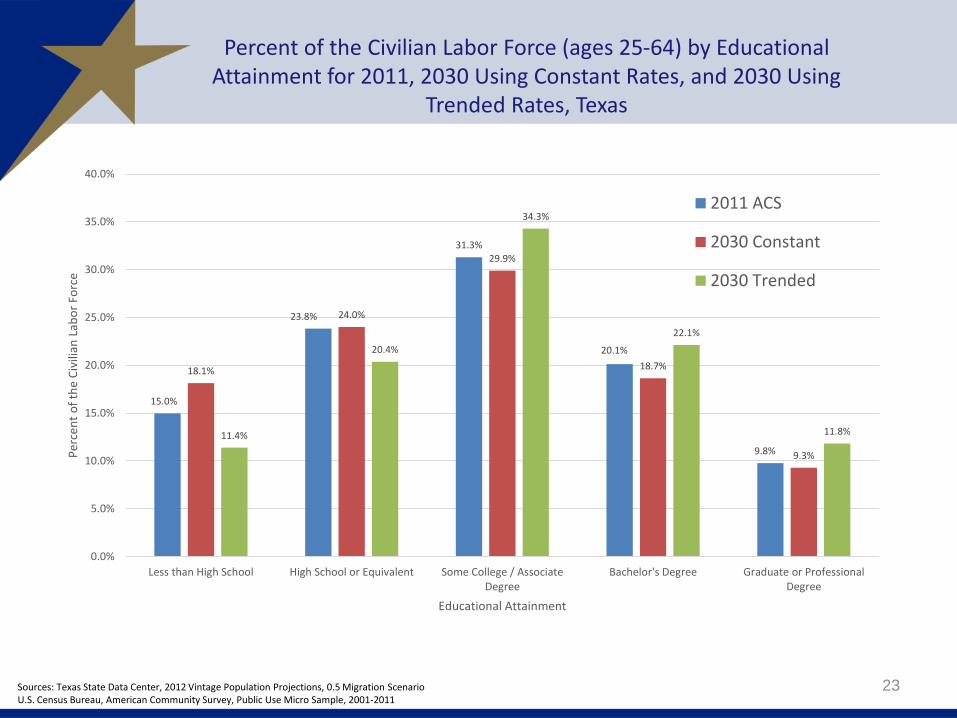
Percent of the Civilian Labor Force (ages 25-64) by Educational Attainment for 2011, 2030 Using Constant Rates, and 2030 Using
Trended Rates, Texas
23
15.0%
23.8%
31.3%
20.1%
9.8%
18.1%
24.0%
29.9%
18.7%
9.3%
11.4%
20.4%
34.3%
22.1%
11.8%
0.0%
5.0%
10.0%
15.0%
20.0%
25.0%
30.0%
35.0%
40.0%
Less than High School High School or Equivalent Some College / AssociateDegree
Bachelor's Degree Graduate or ProfessionalDegree
Per
cen
t o
f th
e C
ivili
an L
abo
r Fo
rce
Educational Attainment
2011 ACS
2030 Constant
2030 Trended
Sources: Texas State Data Center, 2012 Vintage Population Projections, 0.5 Migration ScenarioU.S. Census Bureau, American Community Survey, Public Use Micro Sample, 2001-2011
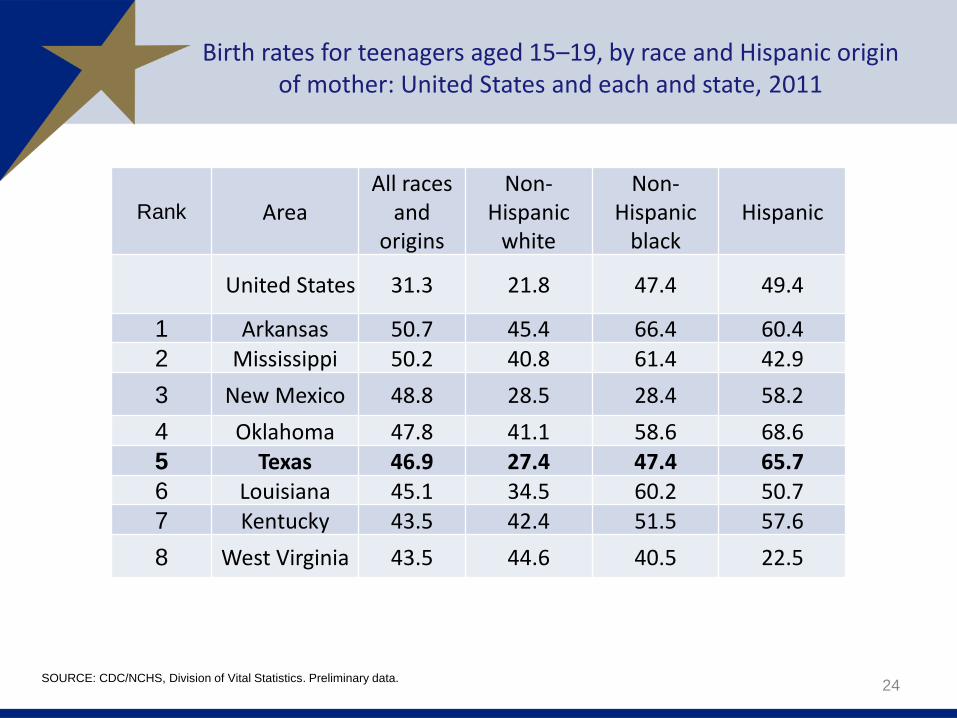
Birth rates for teenagers aged 15–19, by race and Hispanic origin of mother: United States and each and state, 2011
Rank Area All races
and origins
Non-Hispanic
white
Non-Hispanic
blackHispanic
United States 31.3 21.8 47.4 49.4
1 Arkansas 50.7 45.4 66.4 60.42 Mississippi 50.2 40.8 61.4 42.9
3 New Mexico 48.8 28.5 28.4 58.2
4 Oklahoma 47.8 41.1 58.6 68.65 Texas 46.9 27.4 47.4 65.76 Louisiana 45.1 34.5 60.2 50.77 Kentucky 43.5 42.4 51.5 57.6
8 West Virginia 43.5 44.6 40.5 22.5
24SOURCE: CDC/NCHS, Division of Vital Statistics. Preliminary data.
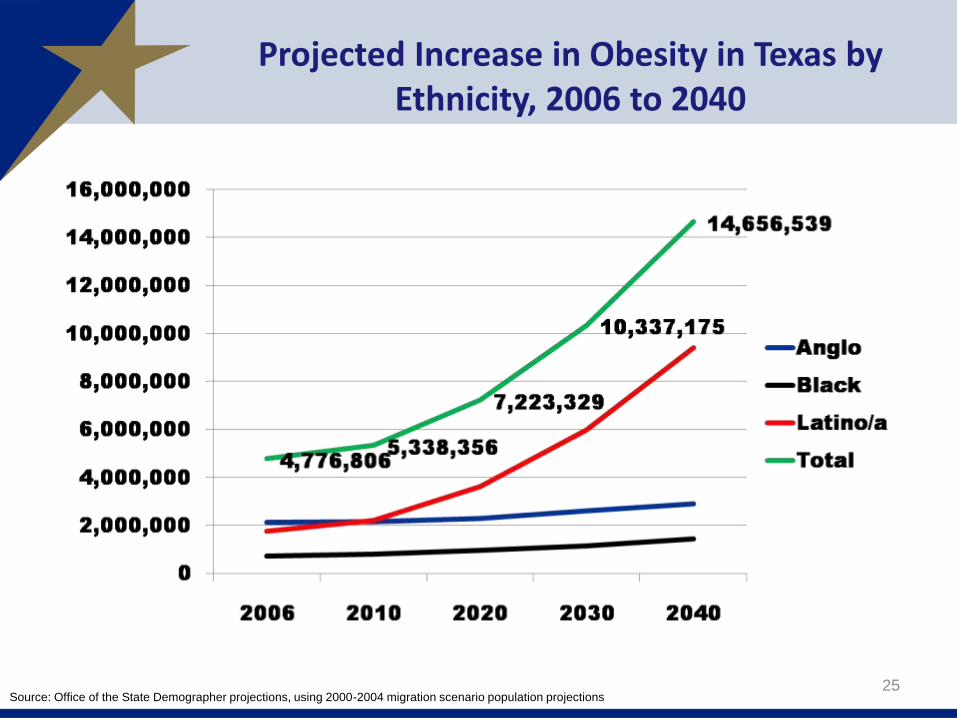
Projected Increase in Obesity in Texas by Ethnicity, 2006 to 2040
25Source: Office of the State Demographer projections, using 2000-2004 migration scenario population projections
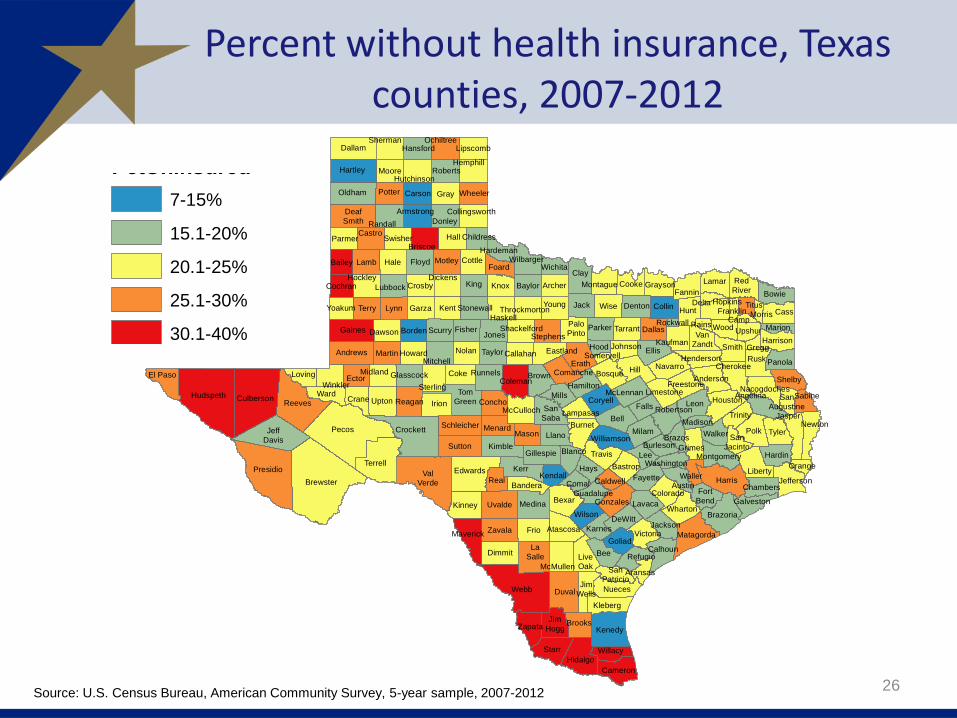
Percent without health insurance, Texas counties, 2007-2012
26
Dallas
Howard
FoardFloyd
Brewster
FranklinHunt
Newton
Starr
Kinney
Collingsworth
Tom
Green
Coleman
Brazoria
Leon
Duval
Lamb
Morris
Smith
Jackson
Medina
Wheeler
Dallam
Callahan
Lamar
Coryell
Gaines
Kendall
Nacogdoches
Milam
Hays
Willacy
Johnson
Reagan
Webb
Shackelford
Bowie
Scurry
Kenedy
Somervell
Oldham
Taylor
King
Borden
Walker
Stephens
Deaf
Smith
Roberts
Tyler
Val
Verde
Brown
Parker
Harris
Zapata
Red
River
Karnes
Palo
Pinto
GlasscockShelby
Wood
Crosby
Refugio
Burnet
Sterling
Montgomery
San
Augustine
Rains
Nueces
Jack
Swisher
Camp
Brazos
Orange
Colorado
Pecos
Cochran
Parmer
FreestoneWinkler
Wichita
Gray
Schleicher
Hardeman
TravisGillespie
Yoakum
Fayette
Uvalde
Grimes
Van
Zandt
Throckmorton
Falls
Grayson
Ellis
Hall
Dickens
Trinity
Reeves
Marion
Terrell
Lynn
La
Salle
Jasper
Jones
Castro
Victoria
Kleberg
Briscoe
Clay
Matagorda
Brooks
Runnels
Carson
Liberty
Lee
Hale
Bexar
Garza
Montague
Upton
Hamilton
FisherDawson
Dimmit
Limestone
Hutchinson
Llano
Presidio
Eastland
Sabine
Wharton
Rusk
Tarrant
Lavaca
Childress
Hidalgo
Kaufman
Moore
Menard
Edwards
San
Patricio
Terry
Crockett
Houston
Waller
Coke
Ward
Titus
Lampasas
Haskell
Martin
Atascosa
HemphillHartley
Young
Burleson
Hardin
Gonzales
McMullen
Erath
Galveston
Hopkins
McLennan
Madison
McCulloch
Donley
Kent
Real
Sutton
Midland
Hudspeth
Zavala
Harrison
Comanche
MitchellNavarro
Crane
Lubbock
Wise
Washington
Jeff
Davis
El Paso
Gregg
Williamson
Lipscomb
Mason
Henderson
Hansford
Chambers
Hill
Potter
Jim
Wells
DeltaStonewall
Ector
Cameron
Maverick
Collin
Baylor
Panola
Guadalupe
Bastrop
Austin
Andrews
Anderson
Blanco
DeWitt
Bandera
Bell
Aransas
Archer
Armstrong
Bee
Angelina
Bailey
Jefferson
Frio
Fannin
Goliad
Loving
Cass
Fort
Bend
Bosque
Hockley
San
Saba
Kerr
Mills
Cooke
Wilbarger
Irion
Caldwell
Jim
Hogg
Culberson
Upshur
Cherokee
Denton
Concho
Randall
Kimble
Knox
Polk
Hood
San
Jacinto
Robertson
Wilson
Nolan
Cottle
Calhoun
Rockwall
Live
Oak
Motley
Sherman Ochiltree
Comal
Legend
tl_2010_48_county10
PctUninsured
7-15%
15.1-20%
20.1-25%
25.1-30%
30.1-40%
Source: U.S. Census Bureau, American Community Survey, 5-year sample, 2007-2012
Demographics and Destiny
27
Contact
Office: (512) 463-8390 or (210) 458-6530
Email: [email protected]
Internet: http://osd.state.tx.us
28
Lloyd Potter, Ph.D.