Embed Size (px)
Citation preview

TESTING OP THE ‘DISPLACEMENT EFFECT’
ASSOCIATED WITH A 'NON-GLOBAL* SOCIAL
DISTURBANCE IN INDIA
*>y
P. Nagaraj an
NATIONAL INSTITUTE OF PUBLIC FINANCE AMD POLICY
12, RAJENDRA PLACE
NEW DELHI, INDIA

3 6'-55/✓ )5 T
l B
Dr. P. Nagarajan is Associate Professor and Chairman
of the Department of Economics, University of P .E .I .,
Canada, currently spending his sabbatical year 1977-78,
as a visiting Prcfessor, at the National Institute of
Public Finance and Policy, New Delhi, India. The study
was supported by a Canada Council Research Grant
(No. 576-1143) and a grant from the Senate Research
Committee of the University of P .E .I . The author
acknowledges gratefully all the excellent research
facilities that have been made available to him by
Dr. Raja J. Chelliah, Director of the National
Institute of Public Finance and Policy., He wishes
to think Subhas Chakraborthy, research investigator,
for doing the computational work. The author also
acknowledges useful comments by Mr. M. Govinda Rao
and Mr, M.M. Jain. Of course, the author alone is
responsible for errors, if any.

I . INTRODUCTION
Peacock and Wiseman/ in a notable study of the
h isto rical patterns of the B ritish government expenditure
over the 1890-1955 period , formulated the 'displacement
hypothesis' that may help to explain the time p ro file of
government expenditure growth also in other countries and
at other times (Peacock and Wiseman, 1 9 6 lJ . They found
that government expenditure in the United Kingdom grew ,in
d iscrete steps rather than contin fB^ly , the steps or
'p lateau ' occurring at times of social disturbances caused
by the World wars. Their d e fin it io n of 'displacem ent1
involves
" . . . . large-scale social d isturbances , such as
major w ars. Such disturbances may create a displacement e f fe c t , s h ift in g public revenues and expenditures to new le v e ls . After the disturbance is over new ideas of tolerable tax levels emerge, and a new plateau of expenditure may be reached, w ith public expenditure again taking a broadly constant share of gross national product, though a d iffe ren t share from the former” j~ Peacock and Wiseman, 1 96 7 , p.XXXIVJ .
Several studies have investigated the evidence of
'displacem ent e f f e c t ' , in a number of cou ntries , as a
consequence of major social upheavals^
1 For a good b ib lio g rap h y , see the follow ing sources:Peacock and Wiseman 1967 , especially Introduction
and chapter 2 ; Pryor, 1968 ; ■ Musgrave, 1 969 ,especially chapter 4 ; Gupta, 1967 ; Diamond, 1977 ;
B ird , 19723 .
- 2 -
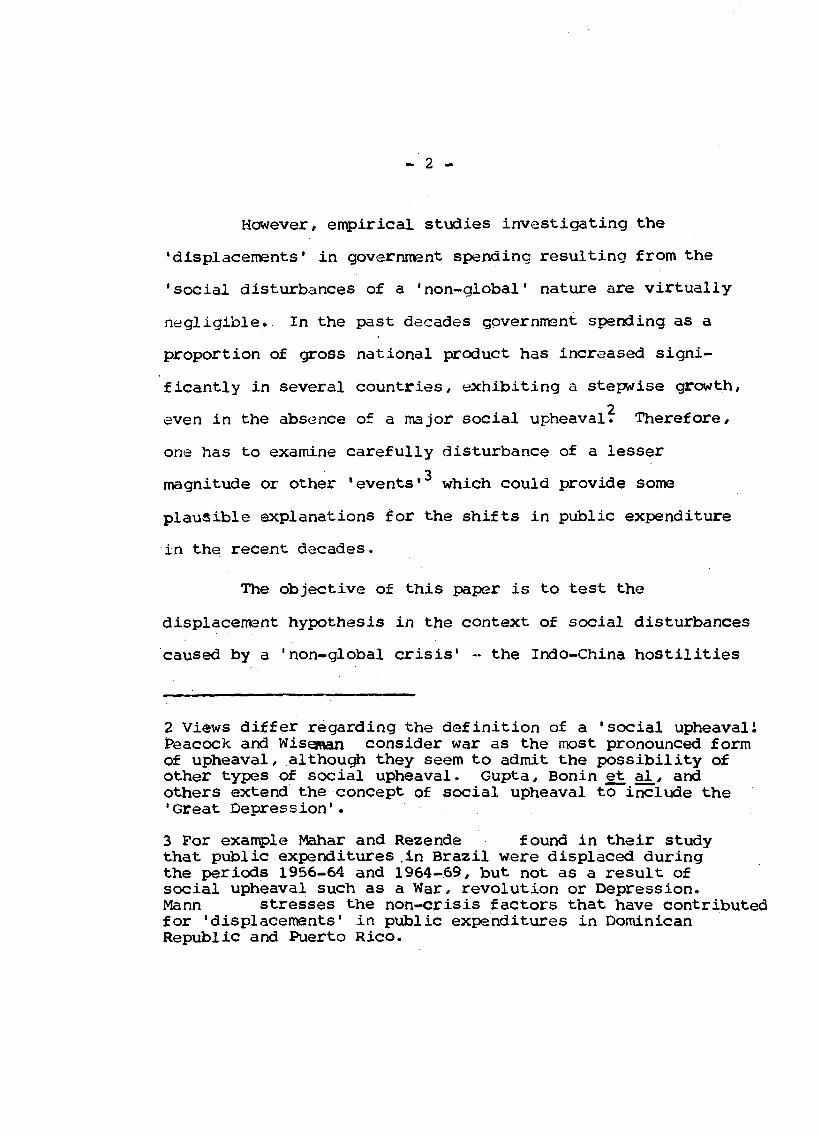
However/ em pirical studies investigating the
'd isplacem ents’ in government spending resulting from the
‘ social disturbances of a 'non-global' nature are v irtu a lly
n eg lig ib le . In the past decades governmant spending as a
proportion of gross national product has increased s ig n i
f ica n tly in several co u n tries , e x h ib itin g a stepwise growth,
2even in the absence of a major social upheaval. Therefore/
one has to examine carefully disturbance of a lesser
3magnitude or other ‘ events' which could provide some
p lausib le explanations for the sh ifts in public expenditure
in the recent decades.
The objective of this paper is to test the
displacement hypothesis in the context of social disturbances
caused by a 'non-global c r is is ' - the Indo-China h o st ilit ie s
2 Views d if fe r regarding the d e fin it io n of a 'social upheavali Peacock and Wiseman consider war as the most pronounced form of upheaval, although they seem to admit the p o ss ib ility of Other types of social upheaval. Gupta, Bonin et al_, and others extend the concept of social upheaval to include the 'Great Depression' .
3 For example Mahar and Rezende found in their studythat public expenditures in Brazil were displaced during the periods 1956-64 and 1964-69, but not as a result of social upheaval such as a W ar, revolution or Depression.Mann stresses the non-crisis factors that have contributedfor 'displacem ents' in public expenditures in Dominican Republic and Puerto R ico .

of 1962? The interpretation of the 'displacement e ffe c t '
is b r ie fly reviewed in Section I I* In Section I I I / the
hypothesis concerning the change in the pattern and timing
of Central government expenditure growth in India associated
with the 'c r i s i s ' of the 1962 is sp ecified for empirical
testing . The sta tistic a l results of the 'displacement
e ffect ' are presented in Section IV . F in a lly , in Section V ,
a, b r ie f summary and conclusion of the study are given.
I I . DISPLACEMENT EFFECT : INTERPRETATION
The basic thrust of the displacement: hypothesis
is to explain the> time profile of government spending, and
the, underlying explanation l ie s in the concept of a
4 Following the outbreak of Indo-China h o s t il it ie s , a national emergency was imposed in November 1962 . The country's immediate task , in the wake of emergency, was to undertake a massive defence m obilization as quickly as possible without upsetting the general balance of the economy. The expenditure on defence services as a per cent of total central government expenditure increased from 3 1 .0 0 in 1961-62 to 4 2 .0 0 in
. 1963-64. In absolute terms defence expenditure (on revenue account) increased from Rs.2 .8 9 5 b il l io n in 1961-62 to approximately Rs.7 .0 4 0 b il l io n in 1963 -64, an increase of 143 per cen t . During th is period , capital expenditure on defence items increased from Rs.22 9 .5 m illion to approximately Rs.1 .1 2 0 b i l l io n , an increase of 388 percent. The prospect of a larger defence budget obviously called fo r re-examination of economic p r io rities and fis c a l d ec isio n s ' in the context of the changed 'environment' resulting from the 'c r i s i s ' . The
economy was subjected to severe stress and strain . With a view to mobilize resources for defence e ffo r t , various schemes were introduced. In the wake of emergency, a campaign to educate public opinion was also launched and the 'Gold Bonds' were introduced as a f i r s t step towards weaning people away from gold.

- 4 -
tolerable burden of taxation . People generally become more
tolerant to a higher level of tax es , that would previously
have been thought intolerable# during a period of ‘ .social
up h ea v a ls '. The contention of Peacock-Wiseman is that
once expenditures and taxes have risen (as a proportion
of gross national produce) to a higher level as a consequence
of social d isturban ces , it is unlikely that expenditures
and taxes would fa l l back to the pre-disturbance le v e l /
thou^i the rate of growth in expenditures and taxes may
subside . Once the threshold of resistance to higher tax
level is overcome during the period of 'c r i s i s ' / the
threashold of resistance then would s h ift to another le v e l ,
followed by a further s h ift in the level of public expenditure
This explains why the long-term time pattern of government
expenditure tends to look lik e a stepwise growth.
There are two versions of the displacement e ffe c t .
The original or orthodox version iniplies that 'so c ia l
d isturbances ' would tend to increase the leve of government
spending in relatio n to national output, accornpanied by a
s h ift in the level of taxes* The less orthodox version
does not stress sh ifts in the r a t io of government spending
to national output. It is l ik e ly that 'in sp ectio n process'
may generate a d iffe re n t kind of displacement - an inter
functional sh ift without s h ift in g the levels of aggregate
spending and taxes . B ird ricflitly contends that such
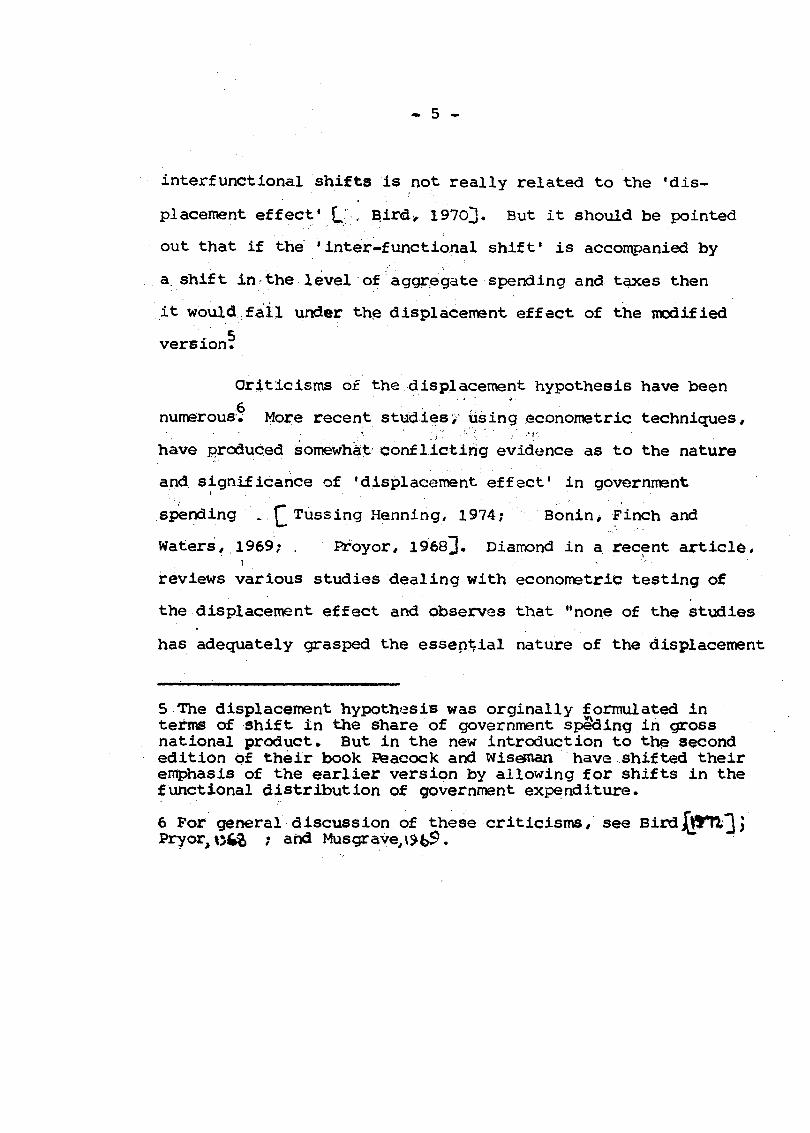
interfunctional shifts is not really related to the 'dis
placement effect1 L ’ , Bird* 197C>3« But it should be pointed
out that if the 'inter-functional shift' is accorr\panied by
a shift in the level of aggregate spending and taxes then
it would.fail under the displacement effect of the modified
version^
Criticism s of the displacement hypothesis have been
6numerous. More recent s tu d ie s ; using econometric techniques,
have produced somewhat c o n flic t in g evidence as to the nature
and s ignificance of 'displacem ent e ffe c t ' in government
spending . £ Tussing Henning, 1974 ; Bonin# Finch and
W aters, 1 96 9 ; . Proyor, 1 9 6 8 ^ . Diamond in a recent a r t ic le ,1 >
reviews various studies dealing with econometric testing of
the displacement effect and observes that "none of the studies
has adequately grasped the essential nature of the displacement
5 The displacement hypothesis was orginally formulated in terms of s h ift in the share of government spading in gross national product. But in the new introduction to the second ed ition of th e ir book Psacock and Wisetnan have shifted their errtphasis of the e a r lie r version by allow ing fo r sh ifts in the functional d istr ib u tio n of government expenditure.
6 For general d iscussio n of these c r itic ism s , see BirdJfo'ftQ?Pryor, ; and Musgrave,i£fe$.

- 6 -
effect and because of t h is , they have misinterpreted th eir
empirical resu lts " £ Diamond, 1 97 7 , p . 3963* He adds
" . . . the Peacock-Wiseman analysis of displacement can be interpreted as a theory of the ' structural b r e a k " . Thus the c etris paribus - assumption that t a s te s , preferences , and institutio ns remain constant is den ied . On the contrary , they concentrate on times of major social upheaval where these factors can safely be assumed to change. Then they analyse the resulting change in public expenditure growth and attempt to construct a model to explain why thase sh ifts occurred. Ultim ately , that model describesv institutional changes w ithin and outside the public sector-or in other words, variation in parameters which are normally assumed constant in enpirical research" , Diamond, 1977 , p p .396- ^73.
Diamond argues that G upta 's approach in testin g
the 'displacement e ffe c t ' must be favoured to that of Bonin
et a l , though it is an incomplete test of the 'structural
break' hypothesis.
A scanty c o n flic tin g evidence of the displacement
e f fe c t , resulting from the 'in terp retatio n ' of the hypo
thesis and the methodology used in testin g i t , could not
invalidate the displacement hypothesis, though it tends
to case doubt on the general a p p licab ility of the hypothesis
to explain the time pattern of government speq»3in(f.
I f the 'displacem ent e ffe c t ' is linked solely to
response to social disturbances caused by the World wars,
then this hypothesis would obviously f a i l to explain the
sh ifts in government spending in many countries in the 1 9 6 0 's
and 1 9 7 0 's . It is quite conceivable that a ' non-global'

- 7 -
upheaval is lik e ly to have a greater impact, in terms of
the magnitude of social d isturb an ces , at the national level
in many developing countries . Such disturbances could
very well contribute to the 'displacem ents' and bring about
a change in the p u b l ic 's notion of a tolerable tax burden.
Empirical studies testin g the nature and s ignificance of
the 'displacement e ffe c t ' in government spending as a
consequence of the 'so c ia l disturbances ' caused by a 'non-
global' c r is is would be quite useful for the purpose of
broadening the scope of the displacement hypothesis.
I I I . HYPOTHESES AMD STATISTICAL’ TECHNIQUE
The follow ing null hypotheses are formulated fo r
7the s ta tistica l testin g of the displacement e ffect in
' \
Central government expenditure in India as a consequence
of a less pronounced 'so c ia l upheaval' ~ the Indo-China
7 For testing the displacem ent e ffect Gupta — Q.9673measuresthe sh ift in thelevel and change in the income-elasticity of government expenditure during the period after a social upheaval. Bird - (1972} rightly points out that it is onlythe sh ift in the level of government spending is an illustration of the displacement effect# and the change in income-elasticity of government spending would reflect something d iffe r e n t . It
is fo r this reason. tha 1YPothes;i-%xlp ^ li^ i12i!5,eto change in income-elasticity of government^?as not cested using Gupta's s ta tistica l technique.

- 8 -
h o s t il it ie s in 1962 .
(l ) The 'c r is is * of 1962 is not associated with a
s h ift in the level of Central Government spending, either
in the aggregate or in terms of functional categories,
w ith relation to the national income growth;
( i i ) the income-elasticity c o e ffic ien ts of government
spending both the aggregate and functional categories ,
between the periods before and after the 'c r i s i s ' do not
Od if f e r s ig n ific a n tly . This is to test the 'structural breaks'
associated w ith the 'c r i s i s ' of the 1962 ; and
( i i i ) the percentage of functional categories of expenditure
in the total government expenditure (g i /G ) is not s ig n i
fic a n tly greater a fter the 'c r i s i s ' than from the average
before the 'c r i s i s ' . This is to test the significance of
compositional changes in government spending associated
with the 'c r i s i s ' .
8 Diamond- \19773 interprets the displacement effect as a structural break theory. He uses the technique pioneered by Rao and Chow to test fo r 'structural breaks' associated w ith social upheavals.

- 9 -
To test the significance of a sh ift ( i .e . to test
9the null hypothesis N o :l ) Gupta 's formula as given below
was used :
S h ift w ith v s ^ - 2 degrees of freedom
where
and
< % ► ! - V
- * i >2
y A and x^ denote the observed values of Log G (G= government
expenditure) and Log Y (Y= national income) respectively
during the period before the c r is is , y^ denotes estimated
value of log G calculated from the regression equation
(Log G= Log a+b Log Y ) for the period before thQ 'c r i s i s ' .
To measure the 's h i f t ' in the level of government
spending w ith relation to national income associated with
the 'c r i s i s ' , the level of government expenditure in the
year immediately a fter the sh ift w ith reference to the
regression equation for the sub-period prior to t h e c r isis
9 G upta 's s ta tistica l technique is used w ith certain m odifications in the grouping of data into sub-periods. Gupta leaves out the c r is is years, and h is comparisons of public expenditures are between normal years. In our study the period 1950-51 - 1969-70 has been considered, and no year has been le ft out as an abnormal year . The 1950-51 - 1969-70 period has been sub-divided into two periods, 1950-51 to 1961- 62, and 1962-63 - 1969-70. The 'c r i s i s ' (indo-China h o s t il it ie s ) took place around the last quarter of the yaar 1962 . Thus we have made a crucial assumption that the 'c r i s i s ' d id not affect the public expenditure in 1961-62, and the impact of the c r is is was fe lt from 1962-63 onwards.

- 12 -
Ths X^S used in the above tests are ratios of
functional categories of expenditure to the total government
-expenditure.
The necessary sta tistic a l series fo r the period
1950-51 - 1969-70 are taken from the report published
12by the Trade Development Authority.
IV STATISTICAL RESULTS
Results of the 'displacement e ffe c t ' tests , for
both agcregate expenditure and functional categories , are
presented in Table 1 . By the statistical tests of s ig n i
fic a n c e , the null hypothesis No .l is rejected at o .l%
level for the follow ing categories of government spending
suggesting thereby that the sh ifts in the level of expenditure
occurred as a consequence of the 'c r i s i s ' of the 1962 :
(a )Total government expenditure
(b)Defence expenditure
(c )D ebt .serv ices
(d)Contributions to States and miscellaneous adjustments
(e )C iv il adm inistration
( f )Non-defence expenditure ( i . e . total government expenditure minus defence and debt serv ic es ).
12 Data on the Indian Economy: 1951 to 1 97 1 , Research and Analysis D iv is io n , Trade Development Authority , New D e lh i / 1972 .

13 -
All the above categories of expenditure, except
c iv il adm inistration , were displaced upward (postive s h i f t ) .
Although expenditure on social and development service was
d isplaced d ownward (a negative s h ift ) it was not found to
be s ta tis tic a lly s ig n ific a n t .
Table 2 presents results of teats for 'structural
in s t a b il it y * . The empirical results confirm structural
in s ta b ility for all the categories of expenditure at the
.001 level of s ig n ific a n c e . This leads to the rejection
of the null hypothesis N o .2 suggesting that income elastic ity
co effic ien ts of government expenditure, both aggregate and
functional categories , between the periods befcre and after
the 'c r i s i s ' , are s ig n ific a n tly d if fe r e n t . Although the
'structural break' associated w ith the 'c r i s i s ' is s ignificant
for >11 the categories of expenditure, the 'break ' appears
to be more pronounced for debt services than for c iv il
adm inistration , social and development services , and contribu~
tions to the State governments.
The sta tistic a l tests fo r the s ignificance of
the changes in the composition of government expenditure
are shown in Table 3 . The results confirm that s ign ificant
changes in the composition of government expenditure have
taken place as a consequence of the 'c r i s i s ' , of the 1962 .
Expenditures on social and development services , and c iv il
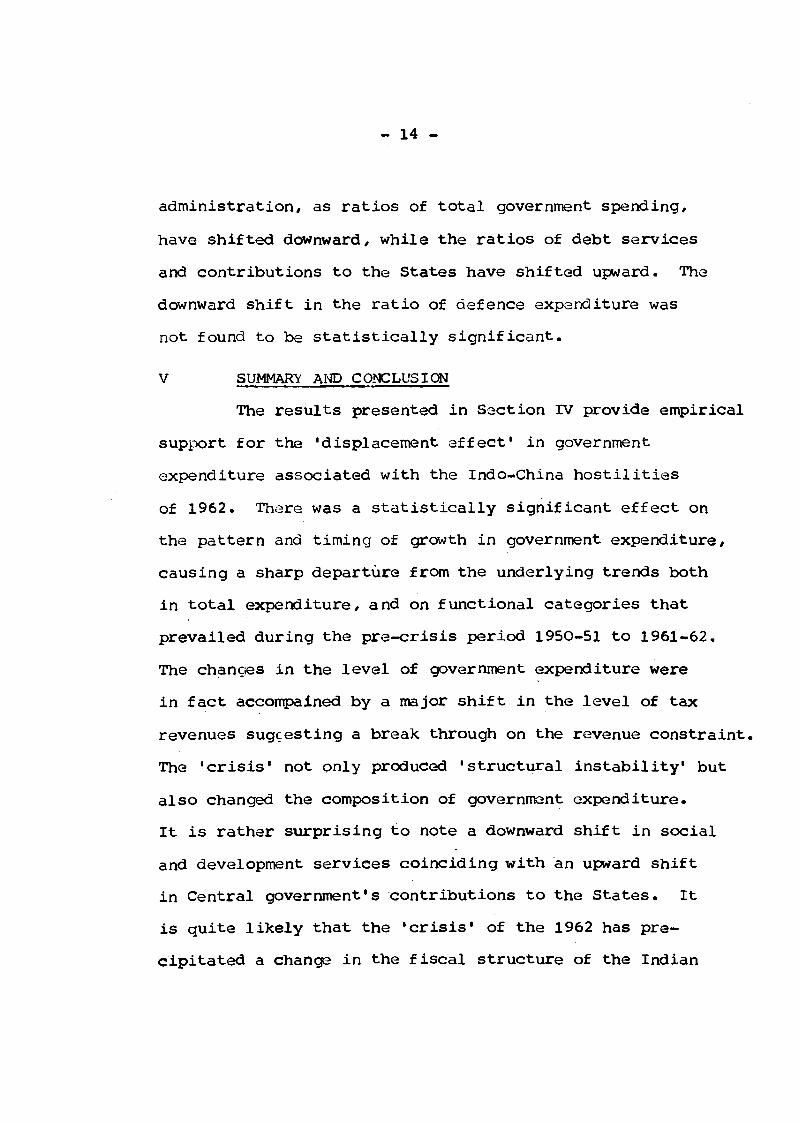
- 14 -
adm inistration, as ratios of total government spending,
nave shifted downward, w hile the ratios of debt services
and contributions to the States have shifted upward. The
downward sh ift in the ratio of defence expenditure was
not found to be s ta t is t ic a lly s ig n ific a n t .
v SUMMARY AND CONCLUSION
The results presented in Section IV provide empirical
support for the 'displacem ent a ffe c t ' in government
expenditure associated with the Indo-China h o s t ilit ie s
of 1962 . There was a s ta tis tic a lly s ign ifican t e ffe c t on
the pattern and timing of growth in government expenditure,
causing a sharp departure from the underlying trends both
in total expenditure, and on functional categories that
prevailed during the pre-crisis period 1950-51 to 1961-62.
The changes in the level of government expenditure were
in fact accorrrpained by a major s h ift in the level of tax
revenues suggesting a break through on the revenue constraint.
The 'c r i s i s ' not only produced 'structural in s ta b ility ' but
also changed the composition of government expenditure.
It is rather surprising to note a downward sh ift in social
and development services co in cidin g w ith an upward shift
in Central government's contributions to the States . It
is quite lik e ly that the 'c r i s i s ' of the 1962 has pre
cip itated a change in the fis c a l structure of the Indian

- 15 -
federal setup by g iv ing a greater role; for the State
governments in the sphere of social and development services
by transfering re lativ e ly more resources from the Centre
to the States .
One of the plausible explanations is that the s h i f t -
that occurred in the 1 svel of tax revenues of the Central
government associated w ith the, 'c r i s i s ' of 1962 might/have
generated pressures for increased spending on social and
development serv ices , resulting from the 'inspection process'
after the 'c r i s i s ' . The respo nsibility for handling social
and development programs; for most part, comes under the
purview of the State governments. It is quite conceivable
•.s.th at , given the re lativ e ly less e la st ic tax revenue sources
v/ .
of the State governments as compared to the centre , an
increasing transfer of resources from the Centre to the
States was probably necessary for carrying out expanding
social and development serv ices ,at che State le v e l . This
prpbably resulted in a downward s h ift in the ratio of Central
government expenditure on social and development services
to the total budcet, accompanied by an upward s h ift in the
ratio of Central transfers to the State governments. Thus
it can be concluded that the social upheaval of a lesser
magnitude (upheaval of a non-global nature) could also,
r>roduce 'displacem ents' by changing the pattern and timing
of public expenditure growth.

REFERENCES
Andie, S . , and Veverka, J . , "The Growth in Government
Expenditure in Germany since the U n ific a t io n "/ F inanzarchiv , N .F . Band 23 , 1963-4’, pp. 169-278.
B ird , Richard M . , "The Displacement E ffe c t : A
c r it ic a l N o te ", Finan2a rc h iv , v o l .3 0 , N o .3 , 1972 , p p .454-63.
B ird , Richard M. The Growth of Government Spending
in Canada, (Toronto: Canadian Tax Foundation, 1970)
Bonin , J .M . , F inch , B .W . , and Waters, J .B . , "A lternative Tests of the Displacement E f fe c t " ,Public F inance , v o l .2 4 , 1969 , p p .441-452
Diamond, J . , "Econometric Testing of the 'Displacement
E ffe c t ' ,a Reconsideration- V F inanzarchiv , Bond 3 ,1977 p p .387-404.
Goffman, I . J . and Mahar D . J . , "The Growth of Public Expenditures in selected Developing Countries: S ix Carribean Countries, 1940- 65", Public Finance, v ^ l .2 6 , p p .57-74
Gupta, S .P . "Public Expenditure and Economic Growth:A Time Series A n a ly s is ", Public F inance , v o l .22,N o .4 , p p .423-61.
Holmans, A .E . , "The Growth of Public Expenditure in the United Kingdom Since 1 9 5 0 " , Manchester School of Economics and Social S tu d ies , v o l .3 6 , 1966, p p .313-327.
Hook, E . , "The Expans ion of Public Sector - A Study of the development of Public Expenditures in Sweden During the years 1912- 1958", Public F inance , v o l .1 7 , 1 962 , p p .289-312.
Mahar. J . , and Rezende, Fernado A . , "The Growth and Pattern of Public Expenditure in B r a z i l " ,Public Finance Quarterly , v o l .3 , N o .4 , pp.380-99.
M artin , A . , and Lewis W .A . , "Patterns oiL,Public Revenue and Expenditure", The M anchester^Pgconom ics and Social S tu d ies , v o l . 24 , N o .3 , 1 95 6 , p p .203-44.

Mann, Arthur J . / "Public Expenditure Patterns in
the Dominican Republic and Puerto R ico , 1930 -1970",
Social and Economic S tu d ies , v o l .24 , N o .l , 1975.
Musgrave, Richard A . , Fiscal Systems (New Haven:Yala Univarsity Press, 1 96 9 ),
Peacock, Alan T . , and Jack Wiseman, The Growth of Public Expenditure in the United Kingdom^ TPrlnceton N . J . : Princeton University Press, 1 9 6 1 ) .
Peacock and Jack Wiseman, The Growth of Public Expenditure in the United Kingdom, revised ed itio n , (London: George Allen and Unwin LTD, 1 9 6 7 ) .
Pryor, Frederic L . , Public Expenditures in Communist and C ap italis t Nations (Homewood: Richard D Irw in , 1968 )7
Rosenfeld, Barry D . , "The Displacement Effect in the Growth of Canadian Government Expenditures", Public F in an ce , v o l .28, 1 97 3 , p p .301-314
Tussing A .D . , and Henning, J .A . , "Long-run Growth of Nondefense Government Expenditures in the United S t a t e s " , Public Finance Quarte r ly , v o l .2 , 1974 , pp. 202- 222 .

TABLE I
Arinjvfiis of 1 Shift* in Total Central Government Expenditure
(Revenue Account) and Selected Functional Categories
Year
Nationalincome
Total Central government exp enditure
Totaltaxrevenue
C; viladmris-tration
Defenceservices
(net)
Rs. crore (at current prices)
1950-51 9530 346.64 357.00 21 .29 164.13
1 951 -52 9970 381.40 459.99 24.10 170.96
1 952-53 9820 390.67 381.06 23.30 179.52
1953-54 10480 401.30 363.28 20.74 186.30
1 954-55 9610 416.35 399.26 30.63 186.66
1955-56 9980 440.74 411.47 33.57 172.23
1956-57 11310 473.83 493.76 38.06 192.15
1 957-58 11390 631.33 575.33 42.01 256.72
1 958-59 12600 675.46 553.06 48.11 250.93
1959-60 12950 736.04 642.44 52.04 230.86
1 960-61 14150 826.21 730.14 58.66 247.55
1 961 -62 14780 911.94 875.37 59.17 289.54
1962-63 15380 1314.13 1060.98 75.18 425.30
1963-64 17200 1658.60 1374.33 77.51 704.15
1961-65 20400 1806.69 1562.80 81 .87 692.85
1965-66 20700 2000.63 1784.62 ^5.40 726.18
1 966-67 23670 2244.46 1 933.96 122„97 797.80
1 967-68 27630 2449.65 1 936.67 136.48 862.21
1 968-69 27930 2678.91 2018.84 153.52 921.05
1 969-70 31174 2934.70 2110.37 177.32 966.00ConstantCa)
1 951 -1 962 -13.3583 -1 0.3570 -17.0067 -5.19491963-1 970 -2.8938 _ . -1 .4320 —8-1512 -2.6693Elasticity coefficient (b)
1951 -1962 2.1032 1.7765 2.2069 1.12851963-1970 1.0511 0.8846 1 .2824 0.9270"t" value for shift
-+ + +12.276 12.061*'''+ 6.710**!) 23.076*+++
contd..2/-

TABLE I (contdi)
Analysis of * Shift* in Total Central Government Expenditure
(Revenue Accourt) and Selected Functional Oate&ories
Year
Debt ITon-defe^ce Social services expenditure and
(total expendi- C-evelop- ture minus debt ment services and services defence
R:. crore (at current prices)
Contributions to States and adjustments between States and Centre
1 950-51 37.36 145.15 39.50 15.59
1951-52 39.00 171.44 42.4-9 17.31
1 952-53 36.50 174.85 41 .72 22.80
1 953-54 40.82 174.18 51 .53 25.91
1 954-55 39.72 169.97 5B..-7 29.79
1 955-56 43.14 225.37 82.41 35.87
1 956-57 39.06 242.62 108.09 28.261 957-58 42.08 332.53 154.14 45.9C
1 958-59 48.63 375.90 175.74 46.25
1 959-60 69.38 435.80 21 0.09 48.94
1 950-61 77.09 501.57 232.40 48.55
' 9Si -62 82.85 539.55 176.29 198.01
1 9C2 — 63 245.43 643.40 1 86.09 1 98.45
> 963-64 278-35 575.10 172. U\ 238.40
1 9o.'-65 316.41 797.43 199.88 272.90
1965-66 370.62 867.83 214.90 328.83
1966-67 463.45 983.21 232.9" 411 .67
> 967-68 510.43 IO8S0OI 271.84 473.69
1968-69 528.02 1221.84 298.31 484.84
1 969-70 565.00 1371.00 310.25 514.54
Constant (a)
1951 -1 962 -12.5702 -21.3149 -39.5771 -1 9.03901 963-1970 -6.5393 -4.0240 -2.2812 -8.9840
Elasticity coefficient (b)
1951-1 962 1 .76U 2.882 9 4.7355 2.4151
1 963-1 970 1 .2489 1 .0836 0.7711 1 .482211 .it .t value
for shift 20. 1 95+++ 5.850+++NS
=.463C-)_ _ _/-+ + + 9.586
+++ denotes significance at 0.1 per cent level; ++ denotessignificance at 1 per cent level; + denotes significance at5 per cent level; NS denotes not significant; C-) denotes negative shift.
Data Sources Data for the year 1950-51-1969-70 are taken from Data on the Indian Economy; 1951 to 1971* compiled by the Research and Analysis Division of the Trade and Development Authority,New Delhi, India.The expenditure on revenue account includes all those categories of expenditures which lead to the provision of goods and services during the year concerned or in the very immediate future.For want of adequate ‘deflators* all the data are expressed in current prices.One crore rupees = 1 0 million rupees.

TABLE 2
TESTS FOR ' STRUCTURAL IINSTABILITY1 ASSOCIATED WITH THE 'C R IS IS ' OF THE .1962:
EMPIRICAL RESULTS
1950-51 “ 1961"62
1 £62-62 -1969-70
1£50-51 .1969-70
1 . Total Government ConstantExpenditure E la stic ityLog G=Log a+b Log NI R
NChow F test
2* Total Tax Revenue ConstantE la stic ity
Log T= Log a+b Log NI RNChow f test
Constant
E lastic ity
Log Gd= Log a+b Log N INChow F test
*3. Non-defence
Expenditure
4 . C iv il Administration ConstantE la stic ity
R2Log CA=Log a+b Log NI N
Chow F test
5 . Defence (net' ConstantE lastic ity
Log D= Log a+b Log NI R2N
6 . Debt Services
Chow F test
Constant
E lastic ityLog DS= Log a+b L o g N lR ^
NChow F test
7 . Social &c Development ConstantE lastic ity
R2Log SD=Log a+b Log N I N
Chow F test
8« Contributions to the Constant
, States & other E la stic ityadjustments r 2Log X= Log a+b Log NI N
Chow F test 9* Per Capita Government Constant
expenditure E la stic ity
R2Log G =Log a+b Log NI N
* Per capita Chow F test
ab
ab
ab
ab
ab
a
b
ab
ab
a
b
-13.358 2 .091
.93
12
- 10.357 1 .7 7 6
.87
12
-21.32.5 2 .883
.92
12
-17.0072 .207
.8712
- 5.1591 .1 2 9
.3/.12
-’12 • 570
1 .761 .85 12
- 39*^773 .9 95
.8112
- 19,0393 .5 3 9
.7012
-2.8941 .0 6 0
.97
8
-1.432• 885 .9 0
8
-4.0241 .0 83
.988
-8.1511 ,2 8 2
,938
-2.669.934.8 0
8
- 6.539
1 .2 4 9.97
8
- 2.2810 .8 3 1
.89
8
- 8.9841 .533
.9*7
-12.3442 .6 4 7
.7 912
-2.7531 .061
.95
8
-11.12b 1 . 8 /
.96
20 *
24 .714
-9.02C 1.63-7
.95 20 ...
16 .688
-11.2791 .8 07
.93
2C *22.511
-11 - 549 1 .622
.95
2° * 9 .513
-10.125 1 .665
.94
20 * 1 6 .92x
-21.075 2 .684
.93 20 *
4 4 .3 9 1-10.179
1 .5 72
.68 20 *
15 .511
-26.272
3 .2 0 6
.91
20 * 9 .127
- 9.946
2 . 230 .92
20 * 1 6 .38 6
Notess * denotes significance at 1% le v e l . NI denotes national incc.ne.
The chow F test shown in column 3 tests for ' structural in s ta b ility ' w ith in the period.

Structural Changes in the Central Government rfrqeaflit-UES
(Revenue Account ) of India. 1951 *=20
(j 7. .i A R 0 Total ‘Hbcpenditure 0 0 aa a ?2rcentage of 0 0 national Income5 o0 o 1 ________ 0
000
I0
ITon-Defence 'Expenditure as a percentage of I'Tational Income
000
I0
Tax Revenue as 1/ a percentage of 0 national Income 0
I0
1950-51 3.64 1.52 3.75
1951-52 3.82 1.72 4.61
1952-53 3,98 1.78 3.94
1953-54 3.83 1.66 3.47
1954-55 4.33 1.98 4.15
1955-56 4.41 2.26 4.12
1956-57 4.19 2.15 4.37
1957-58 5.54 2.92 5.05
1958-59 5.36 2.98 4.39
1959-60 5.68 3.36 4.96
1960-61 5.84 3.54 5.16
1961-62 6.17 3.65 5.92
Avarage
1951 to 1970 4.73 2.46 4.49
1962-63 8.54 4.18 6.90
1963-64 9.64 3.92 7.99
1954-65 8.86 3.91 7.66
1965—65 9.66 4.19 8.62
1966-67 9.48 4.15 8.17
1967-68 8.87 3.93 7.01
1968-69 9*59 4.37 7.23
1969-70 9.31 4.40 6.77
Average
1963 to 1970 9.24 4.13 7.54
"t" Value -6.52+++r / v » + + +
-6.03++♦
-10.32
(Jontd..Tal>le 3

TA.3L3 3
0 0 0 0
S I
liraendi+ure bv ]?imotion, a s a Percenta:TO .of Total Lxpenditure
Civil jj Admini-jj stra- ; tion v
Defence * (Wet). I
0
Social a and Deve- a lopment asarvices
Debt S Servi-A ces jj
Grants, aids to states and adjustment between states and centre
1950-51 6,14 47.35 11 #40 10.78 4.50
1951-52 6.32 44.82 11.14 10.23 4.54
1952-53 5.96 45.95 10.68 9.34 5.84
1953-54 6.66 46.42 12.84 10.17 6.46
1954-55 7.36 44.83 13.97 9.54 7.16
1955-55 7.62 39.08 18.70 9.79 8.14
1956-57 8.03 40.55 22.81 8.24 5.96
1957-58 6.65 40.66 24.42 6.67 7.27
1958-59 7.12“ 37.15 26.02 7.20 6.85
1959-60 7.07 31.37 28.53 9.43 6.65
1960-61 7.10 29.96 28.61 9.33 5.88
1961 -62 6.49 31.75 19.33 9.09 21.71
Average
1951 to 197 0 6.88 39.99 19.04 9.15 7.58
1962-63 5.72 32.36 14.16 18.68 15.16
1963-64 4.67 42.45 10.40 10.78 14.37
1964-65 4.53 38.35 11.06 17.51 15.11
1965-66 4.77 38.10 10.74 18.53 16.44
1966-67 5.48 35.55 10.38 20.65 18.34
1967-68 5.57 35.20 11.10 20.47 19.34
1968-69 5.73 34.68 11.14 19.71 18.10
1969-70 6.03 33.29 10.57 19.47 17.53
Average
1963 to 1970 5.31•
36.25 11.19 18.98 16.80
"t" Value> /Nrt + + + *•6.02 1.17 3.14++ -17.83
+++ ♦++ -5.39
Uotesj +++ denotes significance at*0.1$ level; ++ denotes significance at V;o level; + denotes significance at 5^ level* Negative sign of the *t* Value denotes upward shift in the ratio; positive sign of the *t* Value denotes downward shift in the ratio*