Embed Size (px)
Citation preview

MICHAEL R. HAGERTY?
TESTING MASLOW’S HIERARCHY OF NEEDS: NATIONALQUALITY-OF-LIFE ACROSS TIME
(Accepted 26 April, 1998)
ABSTRACT. Maslow’s hierarchy-of-needs theory is used to predict developmentof Quality of Life (QOL) in countries over time. Previous data sets have not hadsufficient power to test these development trends among countries. Therefore anew database was developed that includes annual quality of life time-series for88 countries from 1960 to 1994, covering measures on all five of Maslow’s need-levels. Results showed significant agreement with some of Maslow’s predictions,including his sequence of need achievement, and parts of an S-shaped trajectoryin QOL. However, his mechanism of growth – that countries must slow growth inone area to increase growth in another – was disconfirmed.
INTRODUCTION
The ruling party of China believes that a nation’s “more basic needs”must be met before democracy can be successfully established.In contrast, Russia was advised by the U.S. to establish democ-racy at once, regardless of peoples’ other needs. Which policy willincrease their citizens’ QOL most quickly? Maslow’s “hierarchyof needs” theory addresses this type of question. In this paper, wetest Maslow’s predictions on the experiences of a large sample ofcountries across 35 years.
Maslow’s (1970) hierarchical theory of human motivation isincluded in every text in introductory psychology. It has receivedmoderate experimental support (Wicker et al., 1993) in predictinghow individuals develop. Sirgy (1986) has suggested that it canalso describe hownationsdevelop and improve their quality of life.Maslow classifies all of human striving as an attempt to fill one
? Thanks are due to Richard Bennett for the Correlates of Crime database, toPrasad Naik and Barbara Atkinson for many helpful comments, and to my tirelessresearch assistant, Susan He.
Social Indicators Research46: 249–271, 1999.© 1999Kluwer Academic Publishers. Printed in the Netherlands.

250 MICHAEL R. HAGERTY
of 5 needs. The first need he labels as physiological, such as air,water, and sufficient calories and nutrients to live. The second needis safety, such as safety from assault, from murder, and from chaos.The third need is belongingness and love, including friends, a fam-ily, a community, and “having roots”. The fourth need is esteem,where a person is valued as a wise decision-maker, has a certain sta-tus and confidence. The fifth need is self-actualization, where eachindividual makes maximum use of his or her individual gifts andinterests, “to become everything that one is capable of becoming”(p. 46).
Maslow arranges these 5 needs in ahierarchy, where their ful-fillment follows a fixed sequence. The physiological needs are filledfirst. (When they are missing, almost all effort goes to filling thesemore basic needs.) Once these are nearing complete satisfaction,effort is allocated to the next level of the hierarchy – safety. Oncesafety is nearing satisfaction, effort is allocated to the next level,and so on for each of the higher needs. “The chief principle oforganization in human motivational life is the arrangement of basicneeds in a hierarchy of lesser or greater priority” (p. 59).
Maslow offers this as a theory ofindividual need fulfillment,but it is natural to inquire whether it can be extended to describethe need fulfillment ofnations, as well. His theory has severalimplications that can be tested by observing nations’ developmentthrough time. They are stated as 4 hypotheses that can be tested ontime-series of nations’ actual development over time.
H1. Nations will increasingly fill their needs over time. This ishis simplest prediction. Maslow sees individuals aslearning suc-cessfully over time, thereby fulfilling their lower-level needs andprogressing on to higher-level needs.
H2. A nation’s trajectory of need fulfillment will follow an S-shaped pattern over time. Figure 1 demonstrates this prediction,where need fulfillment is plotted as a function of time. The curveon the left shows predicted achievement trajectory for a lower-levelneed, and the curve on the right measures achievement of the next-higher-level need. As nations place effort into lower-level needsfirst, achievement of higher level needs will show little improvement(as shown in the right-hand curve from year 5 to year 10). But once

NATIONAL QUALITY-OF-LIFE ACROSS TIME 251
Figure 1. Hypothetical S-shaped curves predicting time path of fulfillment fortwo needs.
lower-level needs are nearing attainment, they will place more effortinto the next need-level, causing a much higher slope on the growthtrajectory (see the right-hand curve from year 10–15.) Finally, asneeds at this level approach fulfillment, effort is allocated awayto the third-level needs, causing lowered growth again (right-handcurve from year 15–20). This produces two “kinks” in each curve,which should be observable as an S-shape.
H3. Nations’ sequenceof need fulfillment will follow Maslow’ssequence, from physiological needs, to security, to belonginess, toesteem, to actualization. This sequence is his most publicized pre-diction, but it has not been tested for nations’ development of qualityof life.
H4. Higher growth in one need area should be correlated with lowergrowth in other need areas for the same time period. This is becauseMaslow argues that effort can only be allocated to one need-levelat a time. Figure 1 also shows this prediction, where growth inthe right-hand curve is slower during years 5–10, while effort isexpended on the more basic left-hand curve during the same period.In contrast, other theories might suggest that “synergies” could existamong levels: for example, improvements in health will also causeimprovements in GDP at the same time.
Maslow’s 5 needs allow the extension of traditional economicdevelopment theory to a broader measure of QOL. Traditional eco-
252 MICHAEL R. HAGERTY
nomic development theory considers money-income as the quantityto be maximized in human endeavor. Education, poverty, and healthare also considered, but primarily as “human capital” and as meansto the end of increasing money and the things it can buy. In con-trast, Maslow’s theory allows non-economic quantities to be validmeasures of QOL. For example, many people in developed coun-tries now consider “belongingness” and a sense of community to beimportant elements of QOL. Yet traditional economic developmentis silent on these. The present paper introduces some first measuresof Maslow’s higher needs, such as “belongingness”.
Previous Research
Sirgy (1986) was first to suggest that Maslow’s theory coulddescribe Quality of Life development among nations. However, test-ing the theory has not been possible until now because it requiresa sufficiently longtime-seriesof each country’s progress on eachneed-level. In contrast, most previous research on nations’ quality oflife has beencross-sectional. For example, Diener’s (1995) nationalQOL index covered a broad range of measures for 77 countries, butfor only one time period – 1991. Similarly Veenhoven and Ehrhardt(1995) performed extensive analysis but used only cross-sectionaldata for the 1980’s. Mazumdar (1995) and Majumder et al. (1995)developed the first time-series database of countries’ QOL, but itincluded only 4 time periods – 1960, 1970, 1980, and 1990. Whilethis covers a broad period of time, the data are very sparse. Thisseverely limits the modeling that can be done on each country. Forexample, an S-shaped curve requires 4 data points just to estimate.Hence their data could not test the S-shape with any power.
The data set described here solves these problems by collectingannual measures over 35 years on each country. It also contains12 variables directly aimed at measuring achievement on Maslow’shierarchy of 5 levels. It provides the best database yet to testMaslow’s theory of QOL development.
DATA
Table I shows the 12 indicators collected in the database, groupedby Maslow’s need hierarchy. The first row lists the physiological

NATIONAL QUALITY-OF-LIFE ACROSS TIME 253
TABLE I
Maslow’s hierarchy of needs, with measures of a country’s status on each need
Maslow’s Need Hierarchy Measures for a Country
1. Physiological Daily calories available per person
GDP per person
2. Safety Safety from War (1-War Rate)
Safety from Murder (1-Homicide Rate)
High Life Expectancy
3. Belongingness and Love Low Divorce Rate (1-Divorce Rate)
Low Child Death Rate (1-Infant Mortality Rate)
4. Esteem Political Rights
Women’s participation in work for pay
5. Self-Actualization Tertiary Education Enrollment
Secondary Education Enrollment
Primary Education Enrollment (?)
needs, measured by daily calories available per person, and grossdomestic product per person (GDP/person). Daily calories availableper person were from the Food and Agriculture Organization (1995)database. They defined daily calories as the caloric equivalent ofall food in the country over a year, after accounting for importsand exports, subtracting food used for seed or for animal feed.They point out that this measure has the shortcoming that it cannotaccount for inequitable distribution, or for differences in consumertastes. GDP per person was collected from the World Bank (1997).GDP was measured in constant 1987 US dollars, and divided bymidyear population estimates for each year.
Safety needs were measured by safety from war, safety frommurder, and by total life expectancy in the country. Safety from warwas calculated as one minus the probability of dying from war orrebellion in that year. Deaths from wars for each country were com-puted from Eckhardt (1989), and supplemented by SIPRI (1995).Deaths from war included not only military deaths, but deaths ofcivilians, and not only international wars, but also civil wars. All

254 MICHAEL R. HAGERTY
conflicts were recorded that resulted in total deaths of more than1000 people. Total deaths were converted to average deaths per yearfrom each conflict, divided by midyear population of each country.Homicide rate was collected from Bennett’s (1991) Correlates ofCrime database, and supplemented by Interpol reports of intentionalhomicides for all reporting countries. Life Expectancy was collectedfrom the World Bank and supplemented by the annual UN Statisti-cal Yearbook. Note that Life Expectancy is logically inclusive ofboth deaths from war and homicides. But we include them becausepeople perceive war and crime as far more threatening and chaoticthan death from disease.
Measures of “belongingness” and love were related to the riskof a “broken family” – the risk of divorce, as well as the risk of achild in the family dying. Many parents report that the death of theirchild is the greatest suffering a parent can endure. Similarly, divorcecauses great stress and suffering for the entire family. Divorce rateper thousand population and infant mortality per thousand live birthswere recorded from the annual UN Demographic Yearbook.
Measures of esteem were political freedom and women’s partic-ipation in the work force. Davies (1991) suggested both of theseas measures of Maslow’s fourth-level needs. Political freedom wascollected from the Polity III database of Jaggers and Gurr (1995).These political scientists provide expert ratings of the degree ofdemocracy enjoyed by each country for each year, based on govern-ment and media reports. Women’s work force participation attemptsto measure whether women have equal opportunity to compete withmen. The World Bank provided data on the percent of the workforcethat is female, where workforce is defined as all people in a countrypaid money for their work.
Finally, self-actualization was measured as access to higher edu-cation. Sirgy (1986) suggested thathigher education encouragescreativity and knowledge-generation. In contrast, he suggests thatprimary education is oriented toward skills-training and satisfyingmore basic needs. Therefore, we place a question mark in Table Iafter the primary education entry, to denote that it may be associ-ated with more basic need levels. We will test Sirgy’s distinctionby examining three levels of education: primary, secondary, andtertiary. The education measures are limited because they tap only

NATIONAL QUALITY-OF-LIFE ACROSS TIME 255
one type of creativity and self-actualization that Maslow cited.Other types of self-actualization are artistic expression, and reli-gious expression. Unfortunately, we did not have data to test theseother possible measures of self-actualization. Education data werecollected from the annual UNESCO yearbook as the percent ofeligible age groups enrolled in primary, secondary, and tertiaryeducation.
Data were collected for a total of 88 countries from 1960 to1994. The countries are listed in Appendix A. They were chosen toinclude the 77 reported by Diener (1995), and augmented to includeformerly socialist countries in central Europe. Three countries splitapart after 1990: USSR, Czechoslovakia, and Yugoslavia. For thesecountries, we followed the practice of the World Bank to designatea successor country to each. The successor country to the USSRis considered Russia. The successor country to Czechoslovakia isthe Czech Republic, and the successor country to Yugoslavia isSlovenia. To ensure the consistency of the time-series, data priorto the splits were revised to reflect only the provinces representingthe successor countries. Two countries merged after 1990: East andWest Germany. Data for West Germany only were collected after1990 to maintain consistency. The 88 countries account for 87% ofthe current world population. Countries were drawn from all strataof development as defined by the World Bank.
Some data was missing because not all countries reported tointernational agencies every year. Across all 12 measures and overall 35 years, 28% of the data was missing, equivalent to 1 out ofevery 4 years missing. The percent of missing data varied from 0%for safety from war, to 64% missing for homicide rate. As expected,more data was missing for less developed countries than for moredeveloped. The analysis methods that were used ensured that coun-tries with less data would be given the same weight as countries withmore.
RESULTS
The four hypotheses were tested by observing the growth of eachmeasure over time. Figures 2–13 plot the growth of the 12 measuresover time, with the top curve of each figure representing the mean

256 MICHAEL R. HAGERTY
Figure 2. Calories per person per day since 1960, by top 50% (plotted as “+”)and bottom 50% (plotted as “x”) of nations.
of the top 50% of nations on that measure, and the bottom curvethe bottom 50% of nations. Separate curves for top and bottom per-formers are plotted because each might capture a different part ofthe S-shaped pattern theorized in Figure 1. For example, Figure 2contains the growth curves on calories per person. The top curve isthe average of the 44 nations that ranked in the top 50% on caloriesper person (averaged over all years), and the bottom curve is theaverage of the 44 nations that ranked in the bottom 50%. (For pur-poses of plotting, any missing data for a country were interpolatedby a cubic polynomial regression to ensure that all countries arerepresented in each point.) The figures appear quite orderly, withonly a few exceptions. For example, an outlier appears in Figure 4for the year 1994. It was caused by Rwanda, where over 8% of itscitizens were killed by genocide in that year.
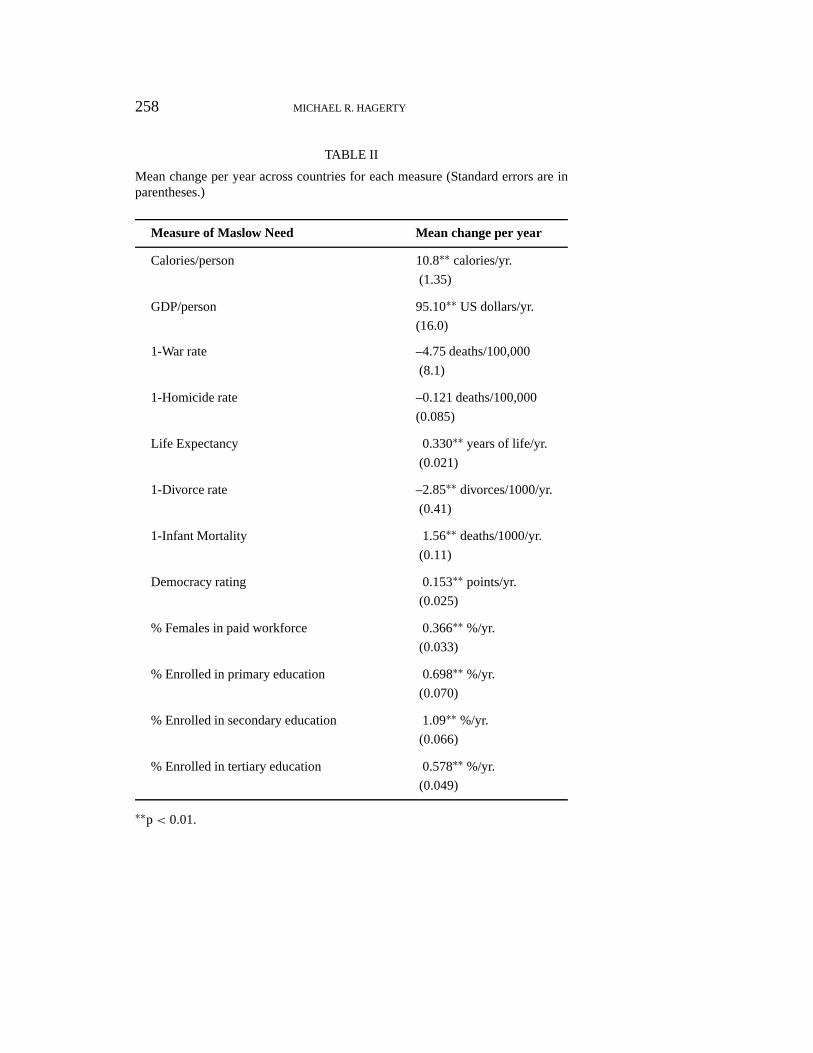
Hypothesis 1 was tested by examining the linear time trends foreach measure. A separate linear regression was run for each country,predicting each measure from the number of years since 1960. Theregression coefficients are shown in Table II. Nine of the twelve

NATIONAL QUALITY-OF-LIFE ACROSS TIME 257
Figure 3. GDP per person, in 1987 US dollars, since 1960, by top 50% (plottedas “+”) and bottom 50% (plotted as “x”) of nations.
Figure 4. Probability of surviving war per 100,000 (1-War Rate) since 1960, bytop 50% (plotted as “+”) and bottom 50% (plotted as “x”) of nations.
258 MICHAEL R. HAGERTY
TABLE II
Mean change per year across countries for each measure (Standard errors are inparentheses.)
Measure of Maslow Need Mean change per year
Calories/person 10.8∗∗ calories/yr.
(1.35)
GDP/person 95.10∗∗ US dollars/yr.
(16.0)
1-War rate –4.75 deaths/100,000
(8.1)
1-Homicide rate –0.121 deaths/100,000
(0.085)
Life Expectancy 0.330∗∗ years of life/yr.
(0.021)
1-Divorce rate –2.85∗∗ divorces/1000/yr.
(0.41)
1-Infant Mortality 1.56∗∗ deaths/1000/yr.
(0.11)
Democracy rating 0.153∗∗ points/yr.
(0.025)
% Females in paid workforce 0.366∗∗%/yr.
(0.033)
% Enrolled in primary education 0.698∗∗%/yr.
(0.070)
% Enrolled in secondary education 1.09∗∗ %/yr.
(0.066)
% Enrolled in tertiary education 0.578∗∗%/yr.
(0.049)
∗∗p< 0.01.

NATIONAL QUALITY-OF-LIFE ACROSS TIME 259
Figure 5. Probability of surviving homicide per 100,000 (1-Homicide Rate) since1960, by top 50% (plotted as “+”) and bottom 50% (plotted as “x”) of nations.
Figure 6. Life Expectancy (in years) since 1960, by top 50% (plotted as “+”) andbottom 50% (plotted as “x”) of nations.

260 MICHAEL R. HAGERTY
Figure 7. Number of intact marriages per 1000 population (1-Divorce Rate) since1960, by top 50% (plotted as “+”) and bottom 50% (plotted as “x”) of nations.
are positive and significant, consistent with Maslow’s predictions.Of the remaining 3, two were negative but not significant. Only“1-Divorce Rate” has been declining significantly over the last 35years among these 88 countries. Hence H1 is largely confirmed.This is not to say that measuresneverdecline for some period oftime. Measures for individual countries often decline for some time,because of recessions, revolutions, famines, etc. Even the mean ofmanycountries may decline for some time, as in the democracyratings of Figure 9. It shows that the lowest 50% of nations droppedeven lower on democracy during the 1970’s, then began a climb thatended in the 1990’s with their highest ratings yet. Maslow predictedonly that the generaltrendwould be upward as individuals met newchallenges and learned to overcome them.
Hypothesis 2 was tested by examining the growth trajectories foreach country for conformance to the S-shaped curves in Figure 1.Ideal evidence for Maslow’s theory would be for each figure to dis-play the S-shape pattern, with the early years showing accelerating

NATIONAL QUALITY-OF-LIFE ACROSS TIME 261
Figure 8. Infant survival rates per 1000 (1-Infant Mortality) since 1960, by top50% (plotted as “+”) and bottom 50% (plotted as “x”) of nations.
Figure 9. Ratings of democracy since 1960, by top 50% (plotted as “+”) andbottom 50% (plotted as “x”) of nations.

262 MICHAEL R. HAGERTY
TABLE III
Quadratic regression coefficients for top and bottom countries on each measure(Standard errors are in parentheses.)
Measure Mean coefficient Mean coefficientfor top 50% of for bottom 50% ofcountries countries
Calories/person –0.207∗ (0.088) –0.261∗∗ (0.076)
GDP/person –2.65 (1.79) –0.298∗ (0.129)
1-War Rate 0 –7.8E-7 (7.7E-7)
1-Homicide Rate –1.1E-6 (3E-6) –2.E-6∗∗ (6.4E-7)
Life Expectancy –0.001 (0.002) –0.0076 (0.006)
1- Divorce Rate 0.136∗∗ (0.029) 0.082∗∗ (0.020)
1-Infant Mortality 0.025 (0.016) –0.014∗∗ (0.004)
Democracy rating 0.0025 (0.0013) 0.21∗∗ (0.001)
% Females in paid workforce –0.0064∗∗ (0.002) –0.0065∗∗ (0.003)
% Enrolled in primary education –0.041∗∗ (0.004) –0.034∗∗ (0.008)
% Enrolled in secondary education –0.006 (0.007) 0.0018 (0.005)
% Enrolled in tertiary education 0.0054 (0.004) 0.0026 (0.003)
∗p< 0.05.∗∗p< 0.01.
growth, and the later years showing growth decelerating toward anasymptote. Further, the bottom curve should be accelerating morethan the top curve, since the nations in the bottom curve are fartherfrom satiation on that measure. Instead, none of the 24 curves has astrong S-shape. However, many display thetoppart of the S (growthis decelerating toward an asymptote).
To quantify these observations, a third degree polynomial regres-sion was estimated, where the 3 predictor variables were the cube,the square, and the first power of the number of years since 1960.None of the 24 regressions yielded a significant improvement whenthe cubic term was added. This is consistent with visual inspectionthat no full S-shapes appear. However, many regressions showedsignificant improvement when thesquareof the year was added.This indicates that curves from the top or bottom half of the S-shapeare present. Table III shows these quadratic coefficients. Of the 12×

NATIONAL QUALITY-OF-LIFE ACROSS TIME 263
Figure 10. Percent of the paid workforce that is female since 1960, by top 50%(plotted as “+”) and bottom 50% (plotted as “x”) of nations.
2 = 24 curves in the figures, the quadratic trend was significant in 12,or half. Of these, 10 had negative signs. The negative sign is consis-tent with the top part of the S-curve, showing growth deceleratingtoward an asymptote. In addition, one curve had already reachedasymptote – the top 50% of countries on “1-War Rate” had achievedno deaths from war since 1960. Hence its curvature was zero, butconsistent with Maslow’s theory. The only significant positive signswere for divorce, which is already an outlier because it is the onlysignificantly declining measure.
Hypothesis 3 was tested by locating the year that each countrygrew fastest on each measure. The S-shaped curve was estimated foreach country for each measure separately, using a cubic polynomialregression equation. Each fitted measure can then be compared tothe other 11 measures, to find when each S-shape achieves its fastestgrowth and (in theory) when it achieves asymptote, similar to thetwo curves in Figure 1. If Maslow’s theory fits the data, then hissequence should predict the actual sequence of need achievement ofnations, with Physiological needs achieved first, then Safety, etc.

264 MICHAEL R. HAGERTY
TABLE IV
Timeline showing year of fastest growth for each of 12 needs measures
Measure Actual Year that Measure Sequence Predictedachieved fastest growth by Maslow
Primary Education 1966.4 ?
GDP per person 1973.7 1
1-War 1974.0 2
Calories per person 1974.1 1
Life Expectancy 1975.8 2
1-Divorce 1976.2 3
Secondary Education 1976.9 5
Female Workforce Part. 1977.2 4
Tertiary Education 1981.5 5
1-Homicide 1980.0 2
1-Infant Mortality 1983.5 3
Democracy 1985.7 4
Table IV presents the year of fastest growth from the best-fittingS-curve for each measure, averaged over all countries. The top rowshows that of the 12 measures, primary education enrollment wasthe first to achieve its fastest growth. The year of fastest growthwas 1966.4, averaged over the 88 countries. The next row showsthe measure that achieved its fastest growth next – GDP/person,in 1973.7. The actual sequence displayed by the 12 measues canbe compared with Maslow’s predicted sequence, shown in the lastcolumn. Spearman’s rho shows that the two columns are highly cor-related (rho = 0.69, p< 0.02), consistent with Maslow’s predictions.
The three measures of education show some of the largestdeviations between predicted and actual. Consistent with Sirgy’ssuggestion, primary education seems to occur early in development,reflecting it’s ability to fulfill more basic needs. Secondary educa-tion occurs near the middle, while tertiary occurs later yet. Basedon their observed sequences, it seems that only tertiary education isappropriate as a measure of self-actualization.

NATIONAL QUALITY-OF-LIFE ACROSS TIME 265
Figure 11. Percent of eligible age group that is enrolled in primary educationsince 1960, by top 50% (plotted as “+”) and bottom 50% (plotted as “x”) ofnations.
Hypothesis 4 was tested by computing correlations among thegrowth measures. Annual changes were computed for each nationfor each year, then normalized by the nations’s score on that measurefor that year. This yielded a “percent change score”,1, for eachnation and measure that was comparable across nations:1 = (mit –mit−1)/mit.
These “percent change scores” were then correlated with per-cent change scores on the other measures, and the results shownin Table V. Each correlation was computed from 88 nations× 34years = 2992 observations (when no observations were missing).Maslow’s theory predicts that all correlations across measures besignificant and negative, as Figure 1 demonstrates. Instead, only 9of the 66 possible correlations were significant, and 7 of these werepositive, contrary to Maslow’s predictions. Table V shows that anincrease in calories is associated with an increase in GDP/person, anincrease in safety from war, and an increase in female participationin the work force. GDP/person is also associated with increases insafety from war and female participation. Improvements in infant

266M
ICH
AE
LR
.HA
GE
RT
Y
TABLE V
Correlations among percent change scores for the 12 measures of Maslow’s theory
Measure 1 2 3 4 5 6 7 8 9 10 11 12
Calories/person (1) 1.00
GDP/person (2) 0.29∗ 1.00
1-War rate (3) 0.10∗ 0.28∗ 1.00
1-Homicide rate (4) 0.02 0.03 –0.05 1.00
Life Expectancy (5) 0.06 0.05 –0.02 0.00 1.00
1- Divorce rate (6) –0.03 –0.01 0.00 0.01 0.01 1.00
1-Infant Mortality (7) –0.01 0.03 –0.01 0.05 0.17∗ 0.01 1.00
Democracy rating (8) –0.02 –0.03 0.00 0.00 –0.07 0.00 0.00 1.00
% Females in paid workforce (9) 0.05∗ 0.06∗ 0.00 –0.02 0.05 0.01 0.09∗ 0.01 1.00
% Enrolled in primary education (10) 0.03 0.04 0.04 0.03 0.00 0.02 –0.03 0.05 –0.06∗ 1.00
% Enrolled in secondary education (11) 0.02 0.03 0.01 0.02 0.05 –0.01 0.01 0.02 –0.01 –0.16∗ 1.00
% Enrolled in tertiary education (12) –0.01 –0.05 0.01 0.01 –0.01 0.02 –0.03 0.00 0.01 0.01 –0.01 1.00
∗p< 0.05.

NATIONAL QUALITY-OF-LIFE ACROSS TIME 267
Figure 12. Percent of eligible age group that is enrolled in secondary educationsince 1960, by top 50% (plotted as “+”) and bottom 50% (plotted as “x”) ofnations.
mortality are associated with improvements in life-expectancy andin female participation (though the former is probably due to the factthat infant mortality is part of the calculation of life-expectancy).Finally, improving female participation is associated withdecliningprimary school attendance for eligible children, which itself is asso-ciated withimprovingsecondary school attendance. Overall, H4 isstrongly rejected.
DISCUSSION
A large time-series database was created to test whether Maslow’shierarchy-of-needs theory could predict the development of Qual-ity of Life in countries over time. The database is uniquely suitedto testing theories of development, because it contains a 35-yeartime series of 88 countries, capturing measures of not just economicvariables, but of family life, esteem, and self-actualization. Resultsconfirm some parts of Maslow’s theory. In particular, the time tra-jectories for most measures show significant increases over the last

268 MICHAEL R. HAGERTY
Figure 13. Percent of eligible age group that is enrolled in tertiary educationsince 1960, by top 50% (plotted as “+”) and bottom 50% (plotted as “x”) ofnations.
35 years (with the exception that divorce rates are getting worse).The shape of the trajectories is not the full S-shape predicted byMaslow, but many display the top part of the S, indicating the rate ofgrowth is slowing toward an asymptote on these measures. Finally,the sequenceof actual need fulfillment is significantly correlatedwith Maslow’s hierarchical predictions. However, the mechanismof growth suggested by Maslow, by which growth in one need areamust slow when the country focuses on growth in another need area,is disconfirmed. Instead, growth in one need area tends to be posi-tively, not negatively, correlated with growth in other need areas inthe same year.
This research can then give a partial answer to the question raisedat the beginning of this paper on whether basic needs must be metfirst before democracy is introduced. Table IV shows that fastestgrowth in democracy occurs an average of 12 yearsafter the fastestgrowth in GDP/person, consistent with the beliefs of China’s rulingparty, and contrary to the advice given to Russia. However we mustpoint out the limitations of this first study – that correlation does not

NATIONAL QUALITY-OF-LIFE ACROSS TIME 269
imply causation, and that the average relationships we have foundmay be moderated by other variables, such as previous history ofdemocratic traditions, level of wealth, etc. Future research wouldhelp clarify these questions.
Maslow’s theory also has a shortcoming when applied to nations’QOL – it fails to consider conditionsoutsidethe individual, such asenvironmental health, poverty in minority groups, etc. In contrast,Diener (1995) provides a comprehensive list of QOL indicators,based on shared values from many cultures. It would be helpful tocollect time trends for his additional values to see whether they obeythe same regularities found for the 12 measures of QOL examinedhere.
APPENDIX A: LIST OF 88 NATIONS SAMPLED
Algeria Honduras Philippines
Argentina Hong Kong Poland
Australia Hungary Portugal
Austria Iceland Romania
Bangladesh India Russian
Belgium Indonesia Rwanda
Benin Iran Senegal
Bolivia Ireland Sierra Leone
Brazil Israel Singapore
Bulgaria Italy Slovak Republic
Cameroon Japan Slovenia
Canada Jordan South Africa
Chile Kenya Spain
China Korea, Republic Sri Lanka
Colombia Luxembourg Sweden
Costa Rica Madagascar Switzerland
Cote d’Ivoire Malaysia Syria
Czech Re Mauritius Tanzania
Denmark Mexico Thailand
Dominica Morocco Togo
Ecuador Netherlands Tunisia

270 MICHAEL R. HAGERTY
Egypt New Zealand Turkey
El Salvador Nicaragua United Kingdom
Ethiopia Nigeria United States
Finland Norway Uruguay
France Pakistan Venezuela
Germany Panama Zambia
Ghana Papua New Guinea Zimbabwe
Greece Paraguay
Guatemala Peru
REFERENCES
Bennett, Richard R.: 1991, ‘Development and crime: A cross-national, time-seriesanalysis of competing models’, The Sociological Quarterly 32(3), pp. 343–363.
Davies, James C.: 1991, ‘Maslow and theory of political development: Getting tofundamentals’, Political Psychology 12(3), pp. 389–420.
Diener, Ed: 1995, ‘A value based index for measuring national quality of life’,Social Indicators Research 36, pp. 107–127.
Eckhardt, W.: 1989, “Wars and war-related deaths 1945–1989’, in R. Leger Sivard(ed.), World Military and Social Expenditures (World Priorities, Washington,D.C.).
Food and Agriculture Organization (FAO): 1995, Production Yearbook. Oncomputer files (FAO, Rome).
Jaggers, K. and T. Robert Gurr: 1995, ‘Tracking democracy’s third wave withPolity III data’, Journal of Peace Research 32(4), pp. 469–482.
Majumder, A., K. Mazumdar and S. Chakrabarti, 1995, ‘Patterns of inter-and intra-regional inequality: A socio-economic approach’, Social IndicatorsResearch 34, pp. 325–338.
Maslow, Abraham H.: 1970, Motivation and Personality (Harper and Row, NewYork).
Mazumdar, K.: 1995, ‘Classification of countries: A socio-economic approach’,Social Indicators Research34, pp. 261–273.
Sirgy, M. Joseph: 1986, ‘A quality-of-life theory derived from Maslow’s devel-opmental perspective’, American Journal of Economics and Sociology 45(3),pp. 329–342.
Stockholm International Peace Research Insititue: 1995, SIPRI Yearbook 1995:Armaments, Disarmament and International Security (Oxford University Press,New York).
Veenhoven, Ruut with the assistance of Joop Ehrhardt: 1995, ‘The cross-nationalpattern of happiness: Test of predictions implied in three theories of happiness’,Social Indicators Research 34, pp. 33–68.
NATIONAL QUALITY-OF-LIFE ACROSS TIME 271
Wicker, Frank W., G. Brown, James A. Wiehe, Anastasia S. Hagen and J. LynnReed: 1993, ‘On reconsidering Maslow: An examination of the depriva-tion/domination proposition’, Journal of Research in Personality 27, pp. 118–133.
World Bank: 1997, World Development Indicators (World Bank, Washington,D.C).
Graduate School of ManagementUniversity of CaliforniaDavis, CA 95616 USA(530)[email protected]