Embed Size (px)
Citation preview
Testing and Modelling the Oxygenation Potential of a Novel Dual-Injection Airlift Pump for Aquaculture Applications
by
Johnathan Szeliga
A Thesis
presented to
The University of Guelph
In partial fulfilment of requirements for the degree of
Master of Science
in
Animal Biosciences
Guelph, Ontario, Canada
© « Johnathan Szeliga, December, 2018 »
ABSTRACT
TESTING AND MODELLING THE OXYGENATION POTENTIAL OF A NOVEL DUAL-
INJECTION AIRLIFT PUMP FOR AQUACULTURE APPLICATIONS
Johnathan Szeliga
University of Guelph, 2018
Advisor(s):
Professor D.P. Bureau
Professor W.H. Ahmed
In aquaculture, dissolved oxygen (DO) content of the water is critical, requiring
continuous water reoxygenation. The oxygen transfer efficiency of a novel dual injection
airlift pump, with control of axial and radial modes of air injection, was examined and
modeled in this thesis. Oxygen transfer was examined at different combinations of airflow
rates, axial to radial airflow ratios, pump pipe diameters, and submergence levels. Each
parameter significantly affected oxygen transfer (p<0.0001), with pump pipe diameter
being most significant. Oxygen transfer was modeled for pumps of different pipe
diameters. This oxygen transfer model was combined with a tilapia bioenergetics and
oxygen requirement model to predict the DO level change of aquaculture systems
stocked with tilapia and aerated with the novel airlifts at different settings. The results
suggest this novel airlift design can effectively meet DO demands of fish raised in
aquaculture and potentially reduce energy consumption compared to conventional
oxygenation technology.
iii
ACKNOWLEDGEMENTS
I would first like to thank my advisor Dr. Dominique P. Bureau for all the assistance
and direction he provided me in the completion of my thesis. Despite a hectic schedule
that required him to constantly be travelling around the world, he always managed to find
the time to reply to my emails and answer any concerns or questions I had. Ever since
my undergraduate years, Dr. Bureau has provided me several opportunities to take part
in interesting projects that greatly expanded my experience and knowledge in fish
nutrition. Thank you, Dom, for all the guidance and potential you provided so I can be a
better person and professional.
I would also like to thank my co-advisor Dr. Wael H. Ahmed, for all his support in
helping me understand the engineering of airlifts, of which I had little prior knowledge of.
Thank you for the generous funding and many opportunities to go out in the field and
apply developed skills to exciting new problems. Working with you and your airlift pump
team was a truly enjoyable experience and I am so glad to have been a part of it. Thank
you also to my final advisory committee member, Professor Rich Moccia, whose insights
and attention to detail helped guide my thesis project to be clearer and more organized.
Thank you also to the members of the Fish Nutrition Research and Mechanical
Engineering Laboratories for all the support you provided in helping me complete my
thesis. Whether it was help with experimental system construction, LabVIEW setup,
computer modelling, or just being someone to talk to, I am truly grateful for having such
wonderful lab mates. I would also like to thank the Library Writing Services and the OAC

iv
Statistical Support Services, whose boot camps and workshops helped improve my skills
in writing and statistics, so I could finish my thesis in a timely manner.
Finally, I would like to thank my friends and family, whose love and encouragement
provided the motivation I needed to overcome any issues I had to face. I especially wish
to thank my wonderful parents, Wieslaw and Jolanta, whose emotional, financial, and
moral support has always helped me pursue my academic and life goals.
v
TABLE OF CONTENTS
Abstract ............................................................................................................................ii
Acknowledgements ......................................................................................................... iii
Table of Contents ............................................................................................................ v
List of Tables ................................................................................................................. viii
List of Figures ..................................................................................................................ix
List of Symbols, Abbreviations or Nomenclature ............................................................. x
Declaration of work performed ....................................................................................... xii
Chapter 1: General Introduction ...................................................................................... 1
1.1 Objective ............................................................................................................ 5
Chapter 2: Literature Review ........................................................................................... 6
2.1 Water Quality Parameters .................................................................................. 7
2.1.1 Dissolved Oxygen ........................................................................................ 7
2.1.2 Carbon Dioxide .......................................................................................... 13
2.1.3 Ammonia ................................................................................................... 14
2.1.4 Solid Wastes .............................................................................................. 16
2.2 Water Quality Management and Airlift Pump Potential .................................... 18
2.2.1 Water Flow and Exchange ......................................................................... 18
2.2.2 Aeration and Oxygenation ......................................................................... 24
2.2.3 Water Stratification Breakup ...................................................................... 28
2.2.4 Degassing .................................................................................................. 30
2.2.5 Protein Skimming / Algal Removal ............................................................ 32
2.3 Conclusion ....................................................................................................... 34
vi
Chapter 3: Measuring Oxygen Transfer and Efficiency of the Dual-Injection Airlift Pump ...................................................................................................................................... 37
3.1 Introduction .......................................................................................................... 37
3.2 Materials and Methods ........................................................................................ 39
3.2.1 Experimental Setup ................................................................................... 39
3.2.2 Data Collection and Analysis ..................................................................... 46
3.3 Results ................................................................................................................. 48
3.3.1 Experimental Precision Test ...................................................................... 48
3.3.2 SOTR Analysis .......................................................................................... 50
3.3.3 SAE Analysis ............................................................................................. 58
3.4 Discussion ........................................................................................................... 59
3.4.1 SOTR Analysis .......................................................................................... 59
3.4.2 SAE Analysis ............................................................................................. 64
3.5 Conclusion ........................................................................................................... 70
Chapter 4: Modelling Oxygen Transfer of Dual-Injection Airlifts for Aquaculture Production ..................................................................................................................... 72
4.1 Introduction .......................................................................................................... 72
4.2 Model Inputs ........................................................................................................ 74
4.2.1 Fish Requirement of Oxygen ..................................................................... 74
4.2.2 Airlift Oxygen Transfer and Efficiency ........................................................ 76
4.2.3 System Oxygen Balance and Concentration ............................................. 84
4.2.4 Modelled Experimental Setup .................................................................... 84
4.3 Model Output ....................................................................................................... 86
4.4 Discussion ........................................................................................................... 88
4.5 Conclusion ........................................................................................................... 91

vii
Chapter 5: General Conclusion ..................................................................................... 93
References .................................................................................................................... 96
viii
LIST OF TABLES
Table 1: SOTR and SAE values for pond aeration devices (Boyd and Ahmad, 1987). . 26
Table 2: Visual representation of the variables tested by each of the 4 experimental parameters. Trials were run covering each possible combination of the 4 variables resulting in 135 different combinations of parameters. .................................................. 44
ix
LIST OF FIGURES
Figure 1: Primary components of an airlift. .................................................................... 20
Figure 2: Submerged 4-inch and 2-inch pumps in the experimental tank setup. Front and side views of the 4 cm pump outside of the tank setup. ......................................... 40
Figure 3: Experimental Rotameter Setup ...................................................................... 43
Figure 4: Schematic of the experimental setup ............................................................. 45
Figure 5: SAS generated boxplot for 4-inch pump at 100% submergence and 50:50 axial-radial air distribution with 3 replicates per airflow.................................................. 49
Figure 6: Individual SOTR values for 1, 2, and 4-inch airlift pumps. .............................. 53
Figure 7: Combined SOTR values for 1,2, and 4-inch airlift pumps. ............................. 54
Figure 8: Individual SAE values for 1, 2, and 4-inch airlift pumps. ................................ 56
Figure 9: Combined SAE values for 1, 2, and 4-inch airlift pump. ................................. 57
Figure 10: Comparison of observed SOTR values with those generated by a multiple regression model based on pipe size, submergence, total airflow and axial-radial contribution. ................................................................................................................... 78
Figure 11: Regressions comparing observed and predicted SOTRs based on models that exclude one of the experimental test variables ...................................................... 80
Figure 12: Comparison of observed SOTR values with those generated by three multiple regression models based on submergence, total airflow and axial-radial contribution. ................................................................................................................... 82
Figure 13: Modelled changes in oxygen inputs, outputs and concentration in a potential feeding trial using dual-injection airlift pumps. ............................................................... 87
x
LIST OF SYMBOLS, ABBREVIATIONS OR NOMENCLATURE
General Gas Exchange Terms:
DO – Dissolved oxygen
RAS – Recirculating aquaculture system
CO2 – Carbon dioxide
O2 – Oxygen
NH3 - Ammonia
POM – Particulate organic matter
S – Submergence ratio
A – Axial contribution of airflow
R – Radial contribution of airflow
General Oxygen Transfer Calculation Variables:
SOTR – Standard oxygen transfer rate
AOTR – Actual oxygen transfer rate
SAE – Standard aeration efficiency
AAE – Actual aeration efficiency
KLaT – Oxygen transfer coefficient at experimental temperature
KLa20 – Oxygen transfer coefficient at 20 °C
C0 – Initial dissolved oxygen concentration
Ct – Final dissolved oxygen concentration
CS – Saturated dissolved oxygen concentration
t – Time required for water to reach oxygen saturation
T – Water temperature
V – Tank water volume
ρ – Water density
g – Gravitational force
HS – Static head
Qair – Airflow rate
xi
∆O2 – Oxygen concentration differential
ALQ – Airlift quantity used
Biological Model Variables:
d – Days of growth trial
BWinitial – Initial body weight of fish
BWpred – Predicted body weight of fish
HE – Heat produced
TGC – Thermal growth coefficient
DEreq – Digestible energy required
DEfeed – Digestible energy of feed
RE – Recovered energy
HeE – Energy used for basal metabolism
HiE – Heat increment of feeding
UE + ZE – Urinary and branchial losses of energy
QOX – Fish oxycalorific coefficient
O2. fish – Oxygen requirement of fish
O2. bio – Oxygen requirement of biofilter
CPfeed – Crude protein content of feed
CPfish – Crude protein content of fish
ADCCP – Dietary digestibility coefficient of crude protein
xii
DECLARATION OF WORK PERFORMED
This project was a collaboration between the Gryph Energy Laboratory, School of
Engineering and the Fish Nutrition Research Laboratory, Dept. of Animal Biosciences.
All work reported in this thesis was performed by me, except for the following:
Manufacturing of the airlift pumps and support frames was performed by students working
in Dr. Wael Ahmed’s Gryph Energy Lab, some of whom also assisted in the installation
of the pump at the Fish Nutrition Research Laboratory, Dept. of Animal Biosciences,
University of Guelph.
Installation of the LabVIEW program and connection of the Atlas D.O. probes used for
measuring dissolved oxygen content in the experimental water tank was performed by
Thariq Mohammed from the Gryph Energy Laboratory, School of Engineering, University
of Guelph.
1
Chapter 1: General Introduction
Aquaculture is partially defined as the rearing of aquatic organisms under controlled
conditions (Hannesson, 2003). Optimizing these conditions to ensure good health and
high growth performance of the cultured species is a major concern of aquaculture
operations. Key conditions that affect fish growth include the levels of certain dissolved
gases such as oxygen (O2), carbon dioxide (CO2), and ammonia (NH3) in the water. Like
other animals, fish consume O2 while producing CO2 and NH3 due to their metabolism
(Ballestrazzi et al., 1994; Page et al., 2005). However, unlike terrestrial animals that have
access to atmospheric gas of which 21 % is O2 (Boyd, 1998), fish need to respire the O2
dissolved in the water (DO) which cannot saturate past 14.6 mg/L at our atmospheric
conditions (Benson and Krause, 1984). Continuous O2 consumption by the fish often
results in a significant depletion of DO in its rearing environment, as well as the build-up
of CO2 and NH3 concentrations that can reach toxic levels (Fivelstad et al., 1998; Solstorm
et al., 2018).
Aeration equipment, such as paddle wheel aerators, aspirators, and air blowers or
compressors connected to diffusers commonly known as “airstones”, can be used to mix
atmospheric gas with the water, causing transfer of O2 to the water while stripping out
CO2 (Boyd, 1998). The provision of new oxygenated water or recirculation of existing
water through filters and water treatment infrastructure can remove or detoxify metabolic
wastes and to some extent resupply DO (Ebeling and Timmons, 2012; Ruan et al., 2015).
Oxygenation and water recirculation equipment is generally powered using electrical
motors or diesel engines which results in additional energy and maintenance costs,
2
significantly increasing production cost for many fish farms (Roque d’Orbcastel et al.,
2009). Implementing more energy efficient and robust tools that require less maintenance
could therefore help decrease production costs of many aquaculture operations.
Airlift pumps have been used in aquaculture for decades (Mitchell and Kirby, 1976;
Castro and Zielinski, 1980), and are considered a low cost and robust approach for
pumping and recirculation. Airlift pumps are operated using air blowers or compressors
that transport air through a tube underwater to the pump. The injected air displaces a
significant amount of liquid as it rises back to the surface. Releasing the air in a vertical
enclosing, such as a pipe, limits the trajectory of where the water may be displaced to
(Reinemann and Timmons, 1989). Water removed from the enclosed space results in a
decrease in pressure causing new water to enter the pipe. With sufficient and sustained
airflow, a continuous pumping effect can be achieved, displacing a significant amount of
water (Barrut et al., 2012b). Airlifts of various designs have been used for a variety of
applications in aquaculture and other fields such as river dredging and ocean floor mineral
mining (Khalil et al., 1999). Airlifts are generally considered more energy efficient than
centrifugal water pumps, since moving a certain volume of air requires considerably less
energy than moving the same volume of water and can thus offer significant energy
savings (Reinemann and Timmons, 1989).
However, design and operational constraints can limit the effectiveness, versatility
and efficiency of airlift pumps. For example, once the air bubbles reach the water surface
the buoyancy forces are no longer causing them to displace water, hence the vertical
height that the water can travel above the surface is highly limited (Reinemann and
3
Timmons, 1989). The diameter of the pipe can also cause constraints, since although
larger cross section areas allow for more water to mix with the air, it also gives more room
for the water to move laterally rather than vertically upward (Castro and Zielinski, 1980).
The air flow volume and size of the air bubbles injected can also have a substantial role
on the effectiveness of the pump (Barrut et al., 2012b). Larger volumes of air released
into the airlift tube will generally provide greater water flows, but the amount of water
displaced is not linearly related to the amount of air injected, so the energy efficiency
decreases at higher air injection volumes (Loyless and Malone, 1998). Size of the injected
air bubbles can also affect airlift pumping efficiency. The release of air through larger
openings, can create larger bubbles known as “gas slugs” which will result in higher water
flow rates compared to smaller bubbles (Reinemann and Timmons, 1989). The
modification of air flow and bubble sizes can therefore result in different water flow
volumes and patterns.
Since airlift pumps submerge air into the water column, this also provides gas
transfer and thus can oxygenate water. However, the O2 transfer efficiency of airlift pumps
is generally considered relatively poor compared to other aeration equipment (Mitchell
and Kirby, 1976; Boyd, 1998). The amount of surface area the submerged air has in
contact with the water, and the time the bubbles have available to transfer gases across
this surface area will impact the O2 transfer efficiency. Conventional airlift pumps are
generally designed to produce relatively large gas bubbles compared to those created by
diffusers commonly used in aquaculture (Loyless and Malone, 1998), as these will
increase the volume of water displacement. Bubble surface area is thus relatively small
and time available for gas diffusion low due to the high pumping rate. Airlift pumps
4
producing smaller bubbles with a larger total air surface area, could improve the O2
transfer efficiency but would result in lower water pumping performance.
Ahmed and Badr (2012) designed a novel airlift pump differing from conventional
airlifts by having dual air injection compartments. One of the compartments is designed
to produce larger air bubbles travelling axially, thus vertically up the pipe, while the other
compartment produces smaller bubbles travelling radially, thus perpendicularly to the
length of the pipe. This dual air injection design and control of bubble size has proven
very valuable to improve efficiency and versatility of the airlift pump for pumping
performance (Ahmed and Badr, 2012). This novel airlift design may also have improved
O2 transfer efficiency compared to conventional airlift pumps commonly used by
aquaculture operations. The smaller air bubbles injected radially may more effectively
contribute to gas transfer due to their higher total surface area and dispersion throughout
the water column. Research on this novel airlift design has thus far only focused on water
flow performance (Ahmed and Badr, 2012; Ahmed et al., 2016) and the O2 transfer
capacity has not been investigated. Several other characteristics of the novel airlift pump
such as its submergence, pipe diameter, and airflow rate could also influence O2 transfer
performance and should be investigated (Reinemann and Timmons, 1989; Loyless and
Malone, 1998). Contrasting O2 transfer capacity of the novel airlift at different values of
these setup conditions with the O2 demand of aquaculture species cultivated under
intensive conditions could help determine whether the novel airlift pump can meet O2
requirements of aquaculture systems and at what setup conditions. Theoretical
comparison of the energy efficiency of the novel airlift pump with conventional
5
oxygenation equipment, such as paddlewheels and diffusers, would help determine if the
novel airlift pump would be a more energy efficient alternative for intensive aquaculture.
1.1 Objective
The first objective of this study was to examine and model the O2 transfer rate and
efficiency of a novel dual-injection airlift pump based on the following four design
characteristics: submergence, inner pipe diameter, airflow rate, and axial to radial airflow
contribution. This was investigated through a series of laboratory scale experiments which
measured the change in dissolved O2 level in a water tank depleted of DO.
The second objective of this study was to determine if the O2 transfer potential of
the novel airlift pump at different settings could effectively meet the theoretical O2
requirements of fish reared under intensive aquaculture production conditions. This was
determined by combining an existing bioenergetics model for tilapia that calculates O2
requirement with a newly developed model for O2 transfer of the novel airlift pump at
different settings.
6
Chapter 2: Literature Review
Water quality management is a key issue in aquaculture. Several environmental
parameters influence the growth performance of aquatic animals and maintaining these
within an optimal range is crucial to ensure adequate health and welfare of the animals.
Parameters such as dissolved oxygen (DO), ammonia (NH3), carbon dioxide (CO2), and
total suspended solid (TSS) concentrations, as well as pH, salinity, and hardness are
considered the most important (Tidwell, 2012). Like other animals, fish consume oxygen
(O2) to sustain their metabolism, while excreting CO2 and NH3 as a by-product of these
processes (Ballestrazzi et al., 1994; Page et al., 2005). The continuous consumption of
O2 by fish in aquaculture often results in a significant depletion of DO in the rearing
environment, coupled with a rise in CO2 and NH3 concentration that can reach toxic levels
(Fivelstad et al., 1998; Solstorm et al., 2018).
In an aquaculture setting, the levels of these dissolved gases are highly dependent
on the metabolic rates of the animals, and by extension on the biomass present (i.e.
stocking density) which is determined by the number and weight of the individual animals.
Water exchange rate, waste removal or conversion, and the replenishment of consumed
DO are important processes in this regard. There are various approaches, tools, and
equipment available to aquaculturists for carrying out these processes (Boyd, 1998). For
some operations, such as those characterized by high stocking density (intensive
aquaculture operations) or those using recirculating aquaculture system (RAS)
technology, ensuring adequate water quality maintenance can be very costly and
contribute significantly to production costs (Roque d’Orbcastel et al., 2009). This presents
7
the need for efficient, economical, and reliable approaches and equipment to maintain
water quality, which in turn could also help decrease production costs for many
aquaculture operations.
Airlift pumps have been used in aquaculture for decades (Mitchell and Kirby, 1976;
Castro and Zielinski, 1980), and are considered an energy efficient and robust tool for
water pumping and circulation, as well as the promotion of gas transfer. This chapter
reviews some key water quality parameters along with the methods used to maintain
them, highlighting the potential for airlift pumps to be used through this context in
aquaculture.
2.1 Water Quality Parameters
2.1.1 Dissolved Oxygen
DO is arguably the most important water quality parameter in aquaculture. The
solubility of O2 in water is highly limited and as a result DO concentrations are very low
compared to ambient atmospheric O2 levels. About 21 % of our atmosphere consists of
O2, which will dissolve in water until it reaches saturation level (Boyd, 1998). The O2
saturation level in water depends on several environmental factors such as, temperature,
salinity, and barometric pressure.
According to Henry’s Law the dissolution of gases into water depends on the
pressure exerted from their molecules in the atmosphere, so at higher barometric
pressures more gas can saturate into the water (Henry, 1803). The effect of pressure on
gas dissolution can also be extended to hydrostatic pressure, caused by water weight.
8
This means that if air is located deeper underwater, for example in bubble form, the
additional weight of the water on the gas will result in more of the gas dissolving in water
(Enns et al., 1965). This helps explain why the water underneath dams and waterfalls will
at times be oversaturated in DO since the descending water exerts more pressure on the
trapped gases (Lindroth, 1957).
O2 saturation also decreases with higher salinity due to the dissociated components
of the salt forming an electrolyte solution that will reduce gas presence through a function
known as “salting out”’ (Lang and Zander, 1986). Salts that have a high degree of
dissociation into their respective anions and cations will in turn attract nearby polar water
molecules, reducing the potential of the water to attract atmospheric gases instead (Lang
and Zander, 1986). However, the higher intermolecular forces seen in water at greater
salinity will also increase the surface tension (Ruen-ngam et al., 2008). This means that
air submerged underwater is exposed to greater internal forces that will result in smaller
air bubbles, resulting in greater total surface area of the gas allowing for more O2 transfer
to take place (Ruen-ngam et al., 2008). Conversely, reductions in surface tension, as
observed from the presence of lipids in the water, will result in more bubbles coalescence,
decreasing surface area available for gas transfer (Guyon et al., 2001). Smaller bubble
size is theorized to be the reason why O2 transfer is similar between fresh and salt water
despite salinity reducing the saturation level of DO (Barrut et al., 2012a).
O2 saturation level decreases with increasing temperature due to the heat liberating
effects of gas absorption into water (Chatterjee and Altwicker, 2008). The mechanics of
this relationship can still be understood in the context of Le Chatelier’s Principle, despite
9
the principle being largely supplanted by the more detailed Laws of Thermodynamics in
modern research (Fernandez-Prini, 1982). The principle states that as a system in
chemical equilibrium experiences stress, the system will react to absorb the stress
(Fernandez-Prini, 1982). The solution of gaseous O2 into water to result in DO and
released heat in the water is a reversible reaction, so when the reaction is subject to
additional heat from an external source it can react to this stress by releasing the
additional heat energy through gaseous O2. Due to this reaction, the DO concentration of
water at full saturation typically decreases from 11.3 – 7.6 mg O2/L as water temperature
increases from 10 to 30 °C (Benson and Krause, 1984). The increasing temperature will
influence the physical properties of the water as well, including a decreased surface
tension (Vargaftik et al., 1983). Although a lower surface tension would generally indicate
a lower gas transfer as well, increasing temperature results in higher gas transfer
coefficients (Barrut et al., 2012a). The higher transfer coefficients may be associated with
the lower viscosity observed in higher temperature water, which would reduce the
resistance for gases to interact with the liquid, resulting in faster O2 transfer into water at
higher temperatures (Guo-Qing, 1995).
Temperature also affects water density, with a maximum density of 1000 kg/m3
observed at about 4 °C and decreasing density as the water progresses from 4 °C until it
either freezes or boils (Weast, 1973). As denser water is heavier, it will sink to the bottom
of a water body. This separation of water due to density will result in thermal stratification,
often seen in lakes where heavier water at the bottom is colder while water closer to the
surface is warmer and thus less dense (Cole, 1994). However, due to the densest water
not being at 0 °C, when the lake surface water cools in the winter and melts in the spring,
10
it will at times reach 4 °C and will mix with the bottom layer of the water column (Cole,
1994). This breakup of stratification will result in mixing of nutrients such as O2 throughout
the water body. Surface water can contain higher DO due to atmospheric air interaction
(Bryson and Suomi, 1952) and algal photosynthetic activity (del Giorgio and Peters,
1994), while deeper water can be depleted in DO due to sediment and decaying organic
matter consumption of O2 (Giga and Uchrin, 1990). The mixing therefore allows a more
uniform DO profile in the water body. Water bodies that have constantly thermally
stratified water layers will have disproportionate levels of DO which will limit available
growing space for animals like fish (Cole, 1994).
In an aquaculture setting, the DO concentration is greatly influenced by the O2
consumption of the animal and the rate at which DO is replenished in the rearing
environment (Loyless and Malone, 1998). O2 is consumed by animals as a result of
cellular respiration based on oxidative phosphorylation (Nicholls and Ferguson, 2013). O2
is the final electron acceptor in the electron transfer chain involved in the catabolism of
organic nutrients (Nicholls and Ferguson, 2013). The reactions result in the consumption
of O2 and the final products are CO2 and water (Nicholls and Ferguson, 2013).
O2 consumption of animals can be predicted using a bioenergetics framework.
Based on stoichiometry of cellular respiration, it is expected that fish will consume 1 g of
O2 per 13.6 kJ of heat production (HE) (Cho et al., 1982). Temperature has a very
significant effect on the metabolic rate and growth potential of fish. The basal metabolism
(HeE) of salmonid fish increases in a linear manner with increases in water temperature
within an optimal non-stressful range (NRC, 2011). Growth potential and thus feed
11
requirement of the animals increases proportionally to an increase in temperature or sum
of degree days (Dumas et al., 2007). The O2 consumption of a 50 g rainbow trout fed to
near-satiety kept at 15°C is estimated to be almost 0.5 g, which is nearly 3 times higher
than the amount consumed at 5°C (Cho and Burau, 1998). The increased O2
consumption of these animals combined with the lower O2 solubility results in a greater
potential for DO depletion as water temperature increases in an intensive aquaculture
setting.
Processes such as the decomposition of organic matter by microorganisms
(Hargreaves, 2003) and bacterial nitrification of NH3 (Wimberly, 1990) also involve the
consumption of O2 which can deplete DO levels in water bodies, including those used in
an aquaculture setting if organic matter accumulates. Outdoor water bodies, such as
ponds, with high algal concentration can experience dramatic daily fluctuations of their
DO due to net O2 production by the algae through photosynthesis during the day and net
O2 consumption during nighttime when no photosynthesis occurs (Hargreaves, 2003).
Nitrifying microbes are estimated to consume a total of 4.6 g of O2 for the combined
processes of converting 1 g of NH3 to nitrite (NO2-) and converting NO2
- to nitrate (NO3-)
(Summerfelt and Sherrer, 2004), providing a significant source of DO depletion for
systems relying on biofilters.
Due to the critical role of O2 in animal metabolism, exposure to low DO levels
(hypoxia) for even short periods of time can have dramatic impacts. Compared to other
aquatic animals, fish are some of the most sensitive to hypoxic conditions, intolerant of
lower DO concentrations and experiencing lethal effects in a shorter time after exposure
12
(Vaquer-Sunyer and Duarte, 2008). The full range of negative health effects experienced
by fish from hypoxia include reduced appetite and growth (Buentello et al., 2000), higher
susceptibility to disease (Pickering and Pottinger, 1989), and even death (Cooper and
Washburn, 1949). The onset of these conditions generally takes place after the DO
concentration has decreased past a level known as the Pcrit, after which point the required
O2 consumption rate of the fish for maintaining standard metabolic activity can no longer
be attained (Rogers et al., 2016). The Pcrit for fish can be highly variable, depending on
genetic factors such as species type as well as environmental factors such as seasonal
temperature acclimation, where some fish species will develop a lower Pcrit during warmer
periods of the year to compensate for lower water DO levels (Ultsch et al., 1978). The
adaptation of lower Pcrit in warmer environments might help explain the evolutionary
pressure that resulted in the observed higher tolerance to low DO levels of warm water
fishes such as tilapia compared to cold water fishes such as salmonids (Tidwell, 2012).
For example, the warm water fish, Nile tilapia, can have a Pcrit in the range of 2.5 to 6.4
mg/L (Mamun et al., 2013), while the coldwater fish, Atlantic salmon, can have a Pcrit in
the range of 3.7 to 5.2 mg/L (Remen et al., 2013). The variability in the range can be
attributed to observations of fish immediately situated in water above normal
temperatures, where due to the lower saturation of DO in water at higher temperatures,
the Pcrit of a fish will generally increase (Ott et al., 1980). Some fish such as carp also
possess adaptations for survival of hypoxic conditions through the regulation of metabolic
enzyme pathways, where a controlled metabolic depression reduces aerobic metabolism
while maintaining low lactate levels produced from anaerobic metabolism through ethanol
production (Fagernes et al., 2017). However, despite the various survival strategies for
13
hypoxic conditions, feed intake and growth will still decrease in fish exposed to a low DO
level environment. While hypoxic conditions are the main DO issue for fish, oversaturation
of O2 in water is also possible under specific conditions and is notably associated with
gas bubble disease (Espmark et al., 2010). This condition is characterized by gas bubbles
forming within the tissue of the animal, that will cause blocking of blood vessels, tissue
damage, and potentially death (Bouck, 1980).
2.1.2 Carbon Dioxide
CO2 can also be dissolved in water and is another important water quality criteria
for good fish health. Although this gas makes up a small composition of our atmosphere
at around 0.04 % (IPCC, 2007), due to its higher solubility in water compared to O2 (Lide,
1993), it will saturate to about 1.5 g/L in pure water at 25° C (Dodds et al., 1940).
Nonetheless, CO2, like all gases, will follow the same principles of gas transfer as outlined
in the description of DO (Chapter 2.1.1.), meaning it will saturate to greater concentrations
at higher barometric pressures and lower salinities and temperatures (Loyless and
Malone, 1998; Barrut et al., 2012a). Also, like other gases, if the content of CO2 in the
water rises above saturation, then it will naturally begin to degasify back into the
atmosphere, which can be expediated through turbulence in the water.
CO2 can naturally oversaturate in the water through biological processes such as
fish metabolism, with 528 g of CO2 produced for every 385 g of O2 consumed (Loyless
and Malone, 1998). The nitrification process of bacteria in RAS biofilters also produces
CO2, with a ratio of 5.9 g of CO2 for each 1 g of NH3 that gets converted to NO2- and then
to NO3- (Summerfelt and Sharrer, 2004).
14
Long term exposure to high CO2 concentrations can induce negative effects on fish
heath. High environmental levels of CO2 can affect fish by decreasing their blood pH
(Wurts and Durborow, 1992), reducing cardiac pumping output (Lee et al., 2003), and
inhibiting growth (Fivelstad et al., 1998). Most importantly, high concentrations of CO2
can impact respiration by decreasing the affinity and carrying capacity of hemoglobin for
O2 through a phenomenon known as the Root effect (Root, 1931). Maintaining CO2 levels
below a toxic threshold is therefore crucial for preventing suffocation, the level of which
will be dependent on the fish species with critical values of 60 mg/L for tilapia (Timmins
and Ebeling, 2010), 30 mg/L for catfish (Tucker and Robinson, 1990), and 26 mg/L for
Atlantic salmon (Fivelstad et al., 1998).
2.1.3 Ammonia
NH3 is a significant by-product of amino acid metabolism of fish and is an important
water quality parameter. The quantity of NH3 in the atmosphere is relatively negligible, as
it ranges in the parts per trillion to parts per billion (Gong et al., 2011), and so water
saturation of NH3 from atmospheric gas transfer is not considered an issue in aquaculture.
Rather, the appearance of NH3 in aquaculture systems overwhelmingly originates from
amino acid catabolism of fish (Brunty et al., 1997). If the water pH decreases, a certain
portion of NH3 molecules will convert to the cation ammonium (NH4+) (Martinelle and
Haggstrom, 1993). The change from a neutral to positively charged molecule will impact
some chemical properties of the NH3 that will have important implications on fish health.
Due to the presence of a positive charge, the diffusion rate of NH4+ across cell
membranes is much lower compared to that of NH3 (Knepper et al., 1989). Instead, NH4+
15
is transported across cell membranes through transport proteins intended for the
transport of other positive ions such as potassium, sodium and calcium (Kikeri et al.,
1989). This can result in abnormal cellular function, particularly through the overactivation
of NMDA receptors on nerve cells. This is believed to begin a cascade of reactions, where
the overstimulated NMDA receptors permit high levels of calcium ions to accumulate in
post-synaptic neurons, activating enzymes such as nitric oxide synthase, resulting in nitric
oxide production that inhibits antioxidant enzymes (Kosenko et al., 1999). Therefore, high
levels of NH3/NH4+ buildup can result in oxidative stress from free radicals that could
potentially cause neural cell damage and death (Randall and Tsui, 2002). High levels of
internal NH4+ can also result in reduced feeding (Alderson, 1979), gill hyperplasia
(Thurston et al., 1978) and the inhibition of enzymes involved in the tricarboxylic acid
cycle (Cooper and Plum, 1987). The wide range of toxic effects experienced by fish at
high NH3/NH4+ levels illustrate the importance of monitoring this chemical for maintaining
optimal fish health.
Toxicity levels of NH3 like with other dissolved gases is dependent on the species,
with freshwater fishes tolerating on average up to 2.79 mg NH3/L (USEPA, 1984), while
saltwater fishes tolerating on average up to 1.86 mg NH3/L (USEPA, 1989). However,
there are greater differences of NH3 tolerance between species within either group, as
both salinity and temperature are considered to only play minor roles on affecting toxicity
(Ip et al., 2001). NH3 toxicity is more affected by pH and water hardness, as higher pH
(USEPA, 1998) and lower hardness (Randall and Wicks, 2000) will result in greater NH3
toxicity. The removal of NH3 can occur naturally through the metabolic processes of
nitrogen fixing bacteria, first by converting NH3 to NO2-, and then by converting NO2
- to
16
much less toxic NO3-, which itself will be converted to N2 or consumed by plants (Stein
and Klotz, 2016). Intensive aquaculture systems often integrate biofilters whose main
function is the conversion of toxic NH3/NH4+ into NO2
- and NO3-.
2.1.4 Solid Wastes
TSS, largely originating from fecal matter egested by fish, can accumulate and is an
important water quality criterion. The amount of fecal matter produced in fish culture is
largely dependent on dietary composition. The digestibility of ingredients and the amount
of feed provided are the main determining factors for fecal waste quantity (Cho and
Bureau, 2002). Suspended organic matter is a potential substrate for pathogen
development, which in salmonid culture can lead to gill stress and onset of disease (Wold
et al., 2014). Suspended organic matter has been observed to promote the development
of bacterial organisms, notably potential pathogens, such as Renibacteriurn
salrnoninarum (Balfry et al., 1996) and Aeromonas hydrophila (Leung et al., 1992), but
can also serve as a vector for viruses, such as carp interstitial nephritis virus (Dishon et
al., 2005), and for protozoan parasites, such as Cryptosporidium molnari n. sp. (Alvarez-
Pellitero and Sitja-Bobadilla, 2002). Although various bacterial species have adapted to
proliferate at different temperature ranges, bacterial culture will generally reproduce at
the greatest rate at the top end of their optimum temperature range (Ratkowsky et al.,
1982). This means that under higher water temperatures when the fish are feeding and
therefore excreting fecal matter at a greater rate, the greater quantity of pathogenic
growth medium with greater pathogenic proliferation will result in the fish being more
susceptible to disease.
17
The importance of managing and limiting organic waste accumulation and
suspension is increasingly recognized in intensive aquaculture. Solid waste can be
effectively removed using mechanical filtration or sedimentation tanks (Cripps and
Bergheim, 2000; Brambilla et al., 2008). However, the breakup and suspension of solid
wastes makes them more difficult to remove and provides more surface area for pathogen
growth (Wold et al., 2014). Effective fecal waste removal therefore depends on
maintaining the cohesiveness of the excrements until it can be collected at a filtration or
waste settling area. Maintaining fecal cohesiveness is largely dependent on the chemical
adhesive properties of the feces, which can by improved with dietary binders (Brinker et
al., 2005), and by reducing the forces generated from the water in terms of turbulent flows
(Vittasalo et al., 1999). If these fecal pellets can then sink at a consistent rate, this will
concentrate their mass to limit potential negative effects on the surrounding environment
and provide an easier target for waste removal. The sinking rate of fecal waste is generally
increased with fecal pellet size (Smayda, 1969) and density (Wong and Piedrahita, 2000)
and decreased water turbulence (Viitasalo et al., 1999). However, aquaculture systems
that require the transport of fecal material away from the fish in a horizontal manner may
work more efficiently with floating feed that can nonetheless maintain cohesiveness and
limit turbulence generated from water transportation (Unger et al., 2015). This will require
a system design that can incorporate water flow mechanics to efficiently remove wastes
and limit potential growing space for pathogen development.
18
2.2 Water Quality Management and Airlift Pump Potential
2.2.1 Water Flow and Exchange
Water flow is crucial to maintaining adequate water quality conditions, through
replenishment of the system with clean water to ensure adequate removal of wastes,
such as solid wastes, TSS, CO2, and NH3, while replenishing DO (Fivelstad and Binde,
1994) or ensuring water recirculation through treatment equipment. The amount of water
flow required for sustaining cultured fish populations depends largely on chemical and
biological considerations as discussed above. Water flow and exchange rates need to be
adjusted as a function of water temperature, standing biomass, feeding activity of the
animals and other factors (Fivelstad, 1988).
Water flow is achieved through various means. In intensive indoor aquaculture,
rearing units may be fed by gravity which will require pumping and storing water at a
certain height or alternatively directly pumping into the system. In either case, this is
generally achieved using centrifugal motorized water pumps (Ebeling and Timmons,
2012), which are generally costly in terms of energy consumption.
It has been suggested that replacing conventional centrifugal pumps with airlifts can
provide economic benefits to aquaculture operations, due to the better energy efficiency
of the airlift pumps (Martins et al., 2010). These pumps have been used in fish culture for
decades (Mitchell and Kirby, 1976; Moses and Colt, 2018), largely due to their simple
design and potential for energy savings. The pumps have been used in other fields as
well, notably river dredging and ocean floor mineral mining (Khalil et al., 1999). The higher
19
energy efficiency of airlift pumps compared to centrifugal pumps is a result of the
movement of a certain volume of air requiring considerably less energy than moving the
same volume of water (Reinemann and Timmons, 1989). However, relying on a lighter
(less dense) substance to displace a heavier (denser) substance creates certain design
and operational constraints, which reduces the effectiveness of airlift pumps limiting their
applicability and energy efficiency. Overall, airlift pumps have lower water lift capabilities
and more design constraints compared to centrifugal pumps.
The structure of an airlift pump consists of a vertically facing enclosing, generally a
pipe, that is suspended in the water and supplied air to its underwater opening by an air
blower or compressor (Figure 1). By releasing the air in a vertical enclosing, the trajectory
of where the air may displace the water is limited, causing the water to be removed up
out of the pump along with the rising air (Reinemann and Timmons, 1989). Water
removed within the enclosed space causes a decrease in pressure causing new water to
enter the pipe. With sufficient and sustained airflow, a continuous pumping effect can be
achieved, and a significant amount of water can be pumped (Barrut et al., 2012b).
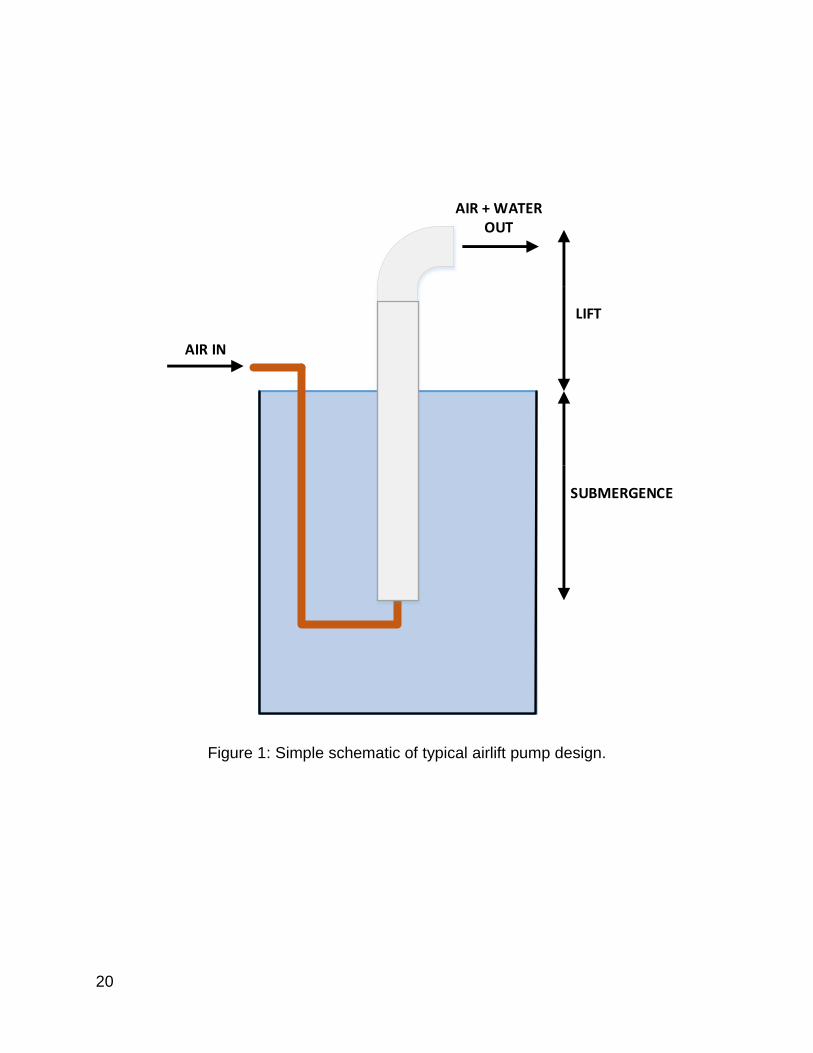
20
LIFT
AIR IN
AIR + WATER OUT
SUBMERGENCE
Figure 1: Simple schematic of typical airlift pump design.
21
The physical design of the airlift pump, specifically in terms of the pipe that air and
water mixes and travels through will influence water flow performance of the pump.
Manipulating these design parameters results in certain trade-offs, which need to be
accounted for to increase the pumping efficiency for the given function of the pump. Most
airlifts follow a consistent setup including a pipe which the water and gas travel up, and a
fitting at the pipe outlet directing the water. Modifications to this design, like increasing
the number of outlet holes to supply more tanks with water, are possible though will result
in less total water flow due to friction loss (Castro and Zielinski, 1980). Increasing the
distance of the outlet above the water surface might also be carried out if the water needs
to be pumped to a higher location. However, once the air bubbles reach the water surface,
the buoyancy forces no longer cause them to lift the water, hence the vertical height that
the water can travel above the surface is highly limited (Reinemann and Timmons, 1989).
Thus, most design changes focus on keeping the same shape while using greater
pipe diameters and submerged lengths where possible, as increasing these dimensions
has been found to improve water flow (Castro and Zielinski, 1980; Parker and Suttle,
1987; Reinemann and Timmons, 1989). However, increasing the pipe diameter can
cause constraints, since although larger cross section areas allow for more water to mix
with the air, it also gives more room for the water to move laterally rather than be moved
up vertically (Castro and Zielinski, 1980). The diameter to pipe length ratio will also affect
the pumping performance of the airlift, with a ratio of 1:15 reported as being the optimal
for maximum efficiency (Reinemann and Timmons, 1989). When the ratio is smaller than
1:15, air bubbles returning to the surface interact less with the water due to the ‘slip’ effect,
decreasing the eventual water flow (Reinemann and Timmons, 1989). When the ratio is
22
higher than 1:15 then the loss in efficiency might be attributable to the greater water
pressure at deeper air injection sites, requiring more power to submerge the gas to that
depth (Reinemann and Timmons, 1989). Therefore, culturists should try to maintain the
1:15 diameter to pipe length ratio, while increasing the total size of the pump to the
maximum possible for the best water flow performance.
Another major factor influencing airlift performance is the submergence ratio
(Loyless and Malone, 1998), referring to the submergence distance over the combined
length of the lift and submergence. At constant airflow rates, greater water flows are
observed at greater submergence ratios, with the most efficient occurring when the airlift
is completely underwater, thus having a ratio of 1:1 (Loyless and Malone, 1998). This can
create some issues in design optimizations, as generally the purpose of the pump is to
elevate the water to a new height, but the higher the pump needs to lift the water the lower
the resulting water flow will be. The submergence ratio can also be increased by injecting
the air deeper underwater, though this may create pressure issues resulting in the air
blower not being able to submerge the air to the exit holes. In some cases, it might then
be more pragmatic to use an air compressor to overcome the pressure (Barrut et al.,
2012b), though this will generally be more energy demanding. Therefore, even selecting
the location of the airlift in relation to the water column will have significant consequences
on pump performance, as the height that the water needs to travel and whether an air
blower or compressor is available will determine the resulting water flow.
Airlift pumping performance will also be influenced by the presence of certain solids
within the water. Since the presence of salt causes a greater surface tension, resulting in

23
smaller bubbles (Barrut et al., 2012b), this means that pumps in marine environments will
have lower water flows when set at similar settings to pumps in fresh water. Meanwhile,
the presence of certain surfactants in the water, such as leeched lipids from fish feed,
would reduce the water surface tension, resulting in greater air bubbles coalescence and
higher water flow rates (Barrut et al., 2012b).
The volume of air and size of the air bubbles injected can also have a substantial
role on the pumping efficiency of the airlift (Loyless and Malone, 1998; Barrut et al.,
2012a). Larger air volumes released in the airlift will generally provide greater water flows,
but the amount of water displaced is not linearly related to the amount of air injected, so
the energy efficiency decreases at higher air flow rates (Castro and Zielinski, 1980;
Reinemann and Timmons, 1989; Loyless and Malone, 1998). The reason for the
decreased efficiency at higher airflows is likely due to the aforementioned ‘slip’ effect
(Reinemann and Timmons, 1989) though the actual point where the efficiency begins to
drop will depend on the dimensions of each individual airlift in terms of pipe length and
diameter (Parker and Suttle, 1987). The size of air bubble released plays a role in the
pumping efficiency of airlift pumps. The release of air through larger openings will create
larger bubbles, which if they occupy more than 25 % of the pipe volume will create flow
patterns known as “gas slugs” that result in higher water flow rates compared to smaller
bubbles (Reinemann and Timmons, 1989). Although air volume can be used to increase
the air void fraction within the pipe and cause bubble coalescence, increasing the number
of “gas slugs”, the released air bubble size will largely be static as a product of the hole
size. The high presence of “gas slugs” can also substantially decrease the efficiency of
24
gas transfer (Reinemann and Timmons, 1989), therefore limiting the oxygenation
performance of the airlift pump.
Ahmed and Badr (2012) designed a novel airlift pump differing from conventional
airlifts by having dual air injection compartments, specifically for influencing the volume
of certain bubble size types within the airlift. One compartment releases larger air bubbles
in an axial manner so they can travel vertically up the pipe, while the other compartment
releases smaller bubbles in a radial manner so they can mix perpendicularly and directly
into the water. This dual air injection design and control of bubble size has proven very
valuable to improve the efficiency and versatility of the airlift pump (Ahmed and Badr,
2012). The incorporation of two simultaneous modes of air injection at different
proportions has allowed for further control of bubble flow patterns past bubbly and slug to
include churn and annular patterns (Kassab et al., 2009), which will affect water pumping
performance and the movement of small solids in three-phase flow (Kassab et al., 2007).
Modification of air injection frequency to create pulsating patterns can further improve the
water flow efficiency of the airlift pump, further reducing energy consumption costs
(Ahmed et al., 2016). The incorporation of new state of the art airlift pump designs could
contribute to improving the economic efficiency of aquaculture operations by reducing
energy consumption while maintaining water flow rates required to maintain water quality.
2.2.2 Aeration and Oxygenation
A variety of approaches and equipment can be used by aquaculture operations to
replenish DO levels. Aeration equipment, such as centrifugal pumps, pump sprayers,
propeller-aspirator-pumps using the Venturi effect, paddle wheels, tractor-powered
25
aerators, and air blowers or compressors that diffuse air using airstones or perforated
tubing can all be used to mix atmospheric gas with the water, causing O2 transfer to the
water (Boyd, 1998). Fish culture sites may alternatively inject pure O2 opposed to
atmospheric gas into their systems (Seginer and Mozes, 2012), as this method may better
maintain DO levels compared to the use of atmospheric air.
Although each aeration method can use a slightly different mechanism for dissolving
O2 into the water, their effectiveness is universally measured in terms of standard oxygen
transfer rate (SOTR) in kg O2/hr and standard aeration efficiency (SAE) in kg O2/kW-hr.
Research comparing the various aeration methods in ponds seems to indicate that
machines which cause more water turbulence, such as paddlewheels and propeller-
aspirator-pumps, have higher SOTR and SAE values then systems which diffuse the air
underwater (Boyd, 1998), despite requiring more electrical energy.
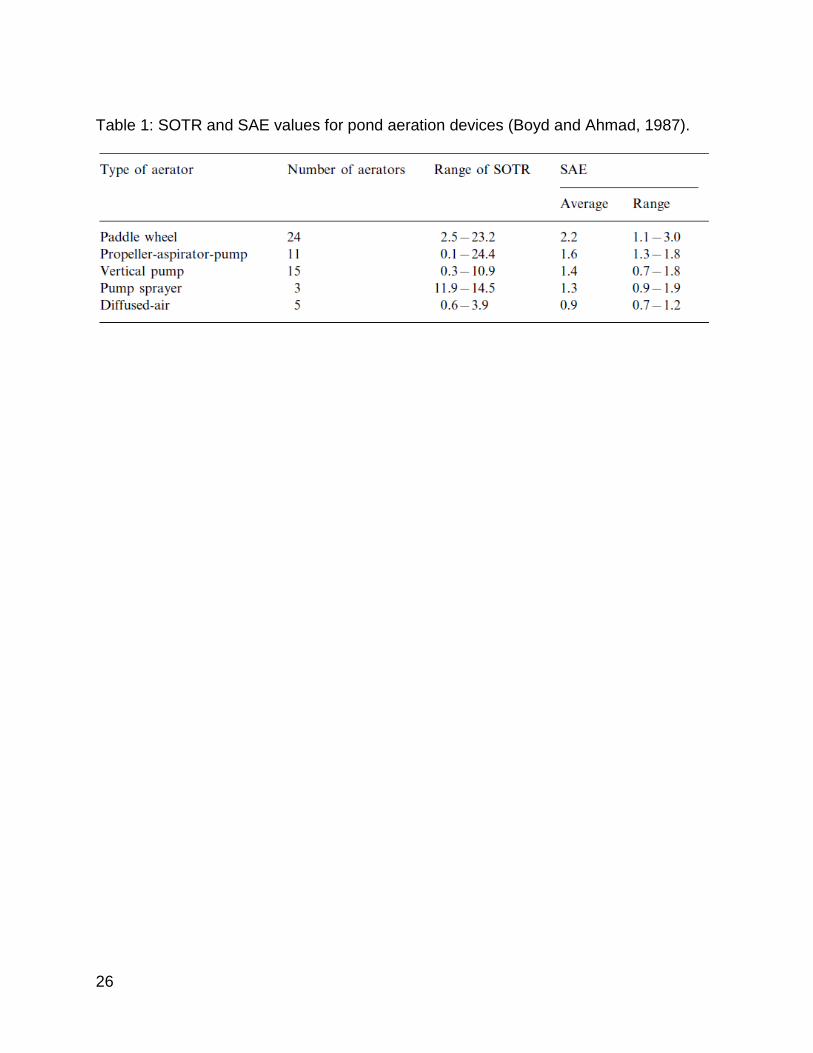
Boyd and Ahmad (1987), reported that paddlewheels are the most efficient at
increasing DO at an average SAE of 2.2 kg O2/kW-hr while diffused-air systems were the
least efficient (Table 1). SAE comparisons of different diffused-air systems are limiting;
however, the reported literature suggests that airlift pumps have lower SAEs compared
to airstone based diffusers (Mitchell and Kirby, 1976; Loyless and Malone, 1998).
Nonetheless, Boyd (1995) reports that a custom system combining diffused-air with an
airlift pump could achieve a SAE of 6.37 kg O2/kW-hr (Boyd, 1995).
26
Table 1: SOTR and SAE values for pond aeration devices (Boyd and Ahmad, 1987).
27
It is important to note that there is great variability in the design and operation
characteristics for each given type of oxygenation technology, which can have a
significant impact on cost that may not be fully recognized through simply comparing SAE
values. Costs allotted for equipment price and maintenance can affect the long term
economic sustainability of a given oxygenation technology and should be accounted for.
This can be observed when comparing effectiveness of aeration to supplying pure liquid
O2. The generation of liquid O2 generally requires more expensive technology than that
used for aeration, however it will provide a more efficient use of electrical energy for O2
transfer (Seginer and Mozes, 2012). One case study found that incorporating the capital,
maintenance, and energy costs for pure O2 supply required $ 0.23 for supplying the O2
requirements of an individual fish cultured in the study, while the cost of an airlift pump
for the same amount of O2 supply varied from $ 0.18 to $ 0.43 depending on temperature
(Seginer and Mozes, 2012). The temperature dependence of the airlift pump was
associated to lower performance at higher temperatures due to lower gas saturation
levels, which did not affect the infusion of pure O2 (Seginer and Mozes, 2012). Therefore,
apart from the capital, operational, and maintenance costs of an oxygenation system, the
versatility and compatibility with the aquatic system in question will greatly affect the
efficiency of oxygenation.
However, despite potentially having lower SAE compared to other oxygenation
equipment (Mitchell and Kirby, 1976; Boyd and Ahmad, 1987; Seginer and Mozes, 2012;
Barrut et al., 2012a), the ability of airlift pumps to efficiently move and mix water may
provide additional energy savings not provided by other forms of oxygenation equipment.
The design of airlift pumps to improve their SAE while maintaining efficient water pumping
28
could provide great benefits for maintaining various water quality parameters in an
aquaculture system.
The SAE of airlifts depends on the contact surface and contact time of the air with
water and is affected by the design characteristics of the pump. For example, if the air is
released lower in the water column, then the additional water pressure prevents the
retainment of larger bubbles, creating smaller units and therefore increasing the gas
surface area available for contact with the water (Reinemann and Timmons, 1989).
Generating higher levels of airflow will increase SOTR simply due to a higher volume of
air interacting with the water over a shorter time (Loyless and Malone, 1998). However,
the resulting increased air velocity will reduce contact time between the air and water, so
that less O2 is diffused per unit of air used causing a decrease in the SAE (Loyless and
Malone, 1998). Conventional airlift pumps are generally designed to release large gas
bubbles (Loyless and Malone, 1998) since these result in greater volumes of water
displacement. However, studies have found that using this design will provide only half
the SAE that would be seen under similar conditions if the hose ending was simply fitted
with an airstone diffuser (Loyless and Malone, 1998). The contact surface and time
available for gas diffusion of conventional airlift designs is thus relatively low. Airlift pumps
producing smaller bubbles with a larger total surface area could improve the O2 transfer
of such pumps.
2.2.3 Water Stratification Breakup
The breakup of thermocline gradients using technology such as airlifts could benefit
fish production as it could increase the available growing space by distributing the DO
29
content more evenly through the water (Parker et al., 1984). Airlift pumps have been
shown to be more effective to prevent thermal stratification in ponds compared to
centrifugal pumps and motorized propellers (Szyper, 1996). However, the breakup of
thermoclines decreases as the size of the water body increases and water is located
further from the airlift (Szyper, 1996). This reduces the effectiveness at disrupting the
thermoclines in larger bodies of water such as lakes and oceans. Using airlift pumps in
large bodies of water would require the upwelling of great volumes of cold deep water
(Leng et al., 2014), requiring extensive pipe infrastructure. Such an application could be
carried out for providing colder, oxygenated water to cage sites.
In the same way that breaking up thermal stratification can prevent the negative
effects of warmer water, airlifts can also help counter some negative effects of colder
water. Aquaculture sites in locations where ice develops can experience issues due to
damaged cages and the inability of farmers to reach their stock for feeding or harvest
(McNaughton and Lee, 2010). Although some operations allow the freezing of the cages
to occur (Fletcher et al., 1997) this is not the preferred husbandry method in other sites.
Turbulence at the water surface can prevent ice from forming above the fish pens
(McNaughton and Lee, 2010), so farms may employ motorized impellers to mix the water.
These propellers do not provide any discernible function during warmer months, so
replacing them with airlifts that can also upwell colder water in the warmer season might
be more efficient. However, the economic benefits of using airlifts in cage operations to
regulate water year-round still needs to be completed with a proper cost assessment to
determine its practicality.
30
Apart from gas mass transfer and the disruption of thermoclines, airlifts can also
improve water quality by preventing plant and nutrient stratification (Hargreaves, 2003).
During the day, aquaculture ponds will experience DO increases due to photosynthetic
activity of naturally growing algae (Tucker and Hargreaves, 2012). However, when the
sun sets, and the photosynthetic activity of the plants ceases, some of the algae will then
consume large amounts of O2 due to decomposition, causing the DO level to drop at
night. This decaying alga generally settles at the pond bottom, causing that portion of the
pond to experience the greatest drops in DO (Hargreaves, 2003). If the O2 gets depleted
at the pond bottom, this may cause anaerobic decomposition of the algae, resulting in the
production of chemicals such as volatile fatty acids and fermentation products, some of
which may be toxic to fish (Hargreaves, 2003). By mixing the pond water, airlifts can
distribute algae and DO in the water column more evenly, preventing potentially toxic
effects on the fish from anaerobic algal decay.
2.2.4 Degassing
Apart from injecting O2 into the water, airlifts can also be used to remove unwanted
gases, such as dissolved CO2. Assessing whether airlifts could successfully remove CO2,
first requires examination of the common techniques currently used for this function.
Generally, these can be divided into two categories: methods which affect CO2 level
through pH control and methods which control CO2 level through degassing (Summerfelt
et al., 2000). Seeing as the main detrimental effect of CO2 in the water is an increase in
acidity, some culturists will simply increase the pH as opposed to manually removing the
CO2. This is often done through adding bases like hydroxides and carbonates, which in
31
turn will convert the CO2 to bicarbonate (CO2−3) (Loyless and Malone, 1997). However,
this is a finite solution as the fish will continue to excrete CO2 over the course of
production, requiring a constant addition of bases to convert CO2 to CO2−3 (Hargreaves
and Brunson). Otherwise, additional CO2 could further decrease the pH and cause the
stored CO2−3 to convert back to CO2. This shows an advantage that degassing technology
has over pH control, in that it removes the CO2 itself, preventing buildup that could
negatively impact the fish. Just as CO2 can diffuse into the water to reach saturation, it
can diffuse back into the atmosphere if the water is oversaturated and has enough contact
with air, especially under higher temperatures and salinities (Barrut et al., 2012a). To
maximize this exposure, surface water needs to undergo some degree of mixing and
turbulence, which can be achieved using mechanisms like mixers, pumps, and surface
aerators (Colt and Orwicz, 1991).
Airlift pumps can also provide degassing of CO2, the efficiency of which has been
studied (Loyless and Malone, 1998; Barrut et al., 2012a). The effects of airlift pump setup
configurations on removal of CO2 mirror the effects seen on the ability of the pump to
transfer O2 into the water, as similar gas transfer principles are in effect. For example,
increasing the level of airflow that is being sent to the airlift will increase the amount of
CO2 being transferred from the water to the gas, although at a cost in efficiency (Loyless
and Malone, 1998). Decreasing the size of the bubbles increases the amount of surface
area available for gas diffusion to take place and leads to more CO2 being removed from
the water (Barrut et al., 2012a). Meanwhile higher lipid content, leeched from feed or
waste, can cause more bubble coagulation thus decreasing CO2 removal efficiency
(Barrut et al., 2012a).
32
However, since the function of the airlift is to increase the DO while removing CO2,
this will have some important implications in system setup. Since water at lower
temperatures can be saturated more with dissolved gases, systems growing cold water
species will hold more O2 as well as CO2. This would theoretically mean that fish in cold
water systems are more likely to suffer from high CO2 than from low DO. Meanwhile,
warm water systems should contain lower dissolved levels of both gases, so the fish being
cultured in them would be more likely to suffer from low DO opposed to high CO2. Since
airlifts perform oxygenation and CO2 degassing simultaneously, the efficiency of both
functions should improve with better gas transfer setups. However, there is some
evidence indicating that increasing the number of airlift pumps while maintaining the same
amount of total airflow will increase CO2 degassing while having no effect on O2 transfer
(Loyless and Malone, 1998). The implication of this data indicates that aquaculture
systems can increase CO2 degassing efficiency by using more airlift pumps even without
changing total airflow rates provided. However, apart from this one design characteristic,
airlift pumps can generally be optimized for degassing using the same methodology as
for optimizing oxygenation; meaning increasing the airflow and submergence while
decreasing the bubble size.
2.2.5 Protein Skimming / Algal Removal
Solid particulates in the water can present issues for fish health and must be
monitored to ensure optimal conditions for the livestock. Solid wastes excreted by the fish
can provide a source for harmful bacterial development, and if not mitigated can cause
disease in the fish (Wold et al., 2014). If the fecal matter begins disintegrating in the water
33
to pieces of a smaller size, it becomes referred to as particulate organic matter (POM)
and may become more difficult to remove. Lake and ocean sites may also encounter algal
blooms which, depending on the species of plant, can release toxic chemicals
(Landsberg, 2002). Contact with these blooms can pose a serious threat to the cage
aquaculture industry, being responsible for high fish mortalities and economic losses
(Corrales and Maclean, 1995).
One method through which POM can be removed is through protein skimming,
where water is aerated so that as the air bubbles rise to the surface they attach to protein
particles and create a layer of foam at the surface of the water (Timmons, 1994). The
foam can then be skimmed using a mechanical process separating the water from the
concentrated waste at the surface (Timmons, 1994). Aerating the water using an airlift
pump for the function of protein skimming has been shown to remove POM, albeit at
different rates depending on the setup of the pump (Barrut et al., 2013). It was found that
the highest rates of foam fractionation and efficiency were observed when releasing
smaller bubbles, either by smaller air injection holes or lower airflow rates (Barrut et al.,
2013). Therefore, like gas exchange, the best filtering efficiency of POM is achieved with
smaller air bubbles.
Research into effective ways for mitigating algal blooms is limiting, though it has
been suggested that airlifts could be used (Maclean, 1993). Although not tested with algal
blooms, there has been research conducted on the ability of airlifts to harvest cultured
algae (Barrut et al., 2012c), which in principle is performing the same function. The
experimentation in question removed algae from the water at a reduced cost of 10 to 100
34
times compared to conventional technology, likely due to significantly lowered electrical
energy cost of the airlift (Barrut et al., 2012c). The researchers also found that algae
removal increased with lower airflow rates and smaller bubble size (Barrut et al., 2012c),
mimicking the parameters needed to maximize foam fractionation efficiency (Barrut et al.,
2013). Algae removal was found to be more efficient in salt water (Barrut et al., 2012c),
meaning it would be more effective in marine aquaculture, where the algal bloom issue is
most prevalent. Although a similar experiment would need to be carried out in the field to
determine if it can be used for algae bloom repulsion, the potential benefit to oceanic cage
culture if successful could be substantial.
The improvement of both waste removal functions by using small bubble flow
patterns is interesting considering that past research on airlift performance has
demonstrated higher pumping of solids using larger bubble size flows such as “gas slugs”
(Kassab et al., 2007). The discrepancy in these findings may be related to the density of
the solids being pumped. POM and algae generally floats in the water while the
aforementioned study used limestone particles that were denser then the surrounding
liquid (Kassab et al., 2007). This demonstrates how airlift performance in three-phase-
flow will be dependent on the density of solids being pumped and must be considered to
obtain optimal pumping efficiencies.
2.3 Conclusion
Maintenance of appropriate water conditions is crucial for the successful rearing of
aquaculture species. Failure to do so can result in significant impacts on fish health
35
including poor growth performance and even mortality. Many water quality parameters
are directly tied to the feeding quantity and regime employed by aquaculture sites, which
must be incorporated into the general operational strategy to understand the water
maintenance demands of the system. The metabolic demands of fish for DO and the
excretion of their CO2, NH3, and fecal waste are dynamic and will be impacted by fish
growth and environmental factors such as water temperature.
Whenever the water quality conditions cannot be sustained by the natural
environment, the aquaculturist will need to accommodate for this by using various
approaches, tools, and equipment available (Boyd, 1998). This can include the generation
of water flow to transport new water to the fish while removing waste; enhancing gas
transfer to resupply O2 while removing CO2, mixing stagnant water to prevent
stratification, and the removal of wastes such as POM and algae. Past research has
shown that airlift pumps are to some degree capable of all these functions (Reinemann
and Timmons, 1989; Szyper, 1996; Loyless and Malone, 1998; Barrut et al., 2012c; Barrut
et al., 2013), and therefore have the potential to be effective water maintenance tools in
aquaculture. The use of airlifts for performing several functions simultaneously can also
reduce the need for using multiple water maintenance equipment, which can reduce
electrical energy consumption and economic costs of the operation.
However, the performance of airlift pumps for various water maintenance functions
is highly variable and depends greatly on specific design characteristics of the airlift.
Increasing the size of the released air bubbles inside the airlift pipe, especially to create
flow types such as “gas slugs”, has been shown to increase the pumping performance of
36
the airlift, benefiting in functions such as water transportation and destratification
(Reinemann and Timmons; 1989; Syper, 1996). Meanwhile, reducing the released bubble
size has been shown to be more beneficial for increasing gas transfer, as well as in
functions requiring three phase flow of floating solids such as protein skimming or algae
transportation (Loyless and Malone, 1998; Barrut et al., 2012c; Barrut et al., 2013).
Ahmed and Badr (2012) have designed a novel airlift pump that can release smaller
or larger air bubbles to affect water flow patterns and performance. Thus far, research
has only studied the water pumping performance of these novel airlifts (Ahmed and Badr,
2012; Ahmed et al., 2016). The effects that the novel design would have on gas transfer
volume and efficiency still need to be quantified. The study of design characteristics
effects on SOTR and SAE could help determine the applicability of this pump for
oxygenation in aquaculture.
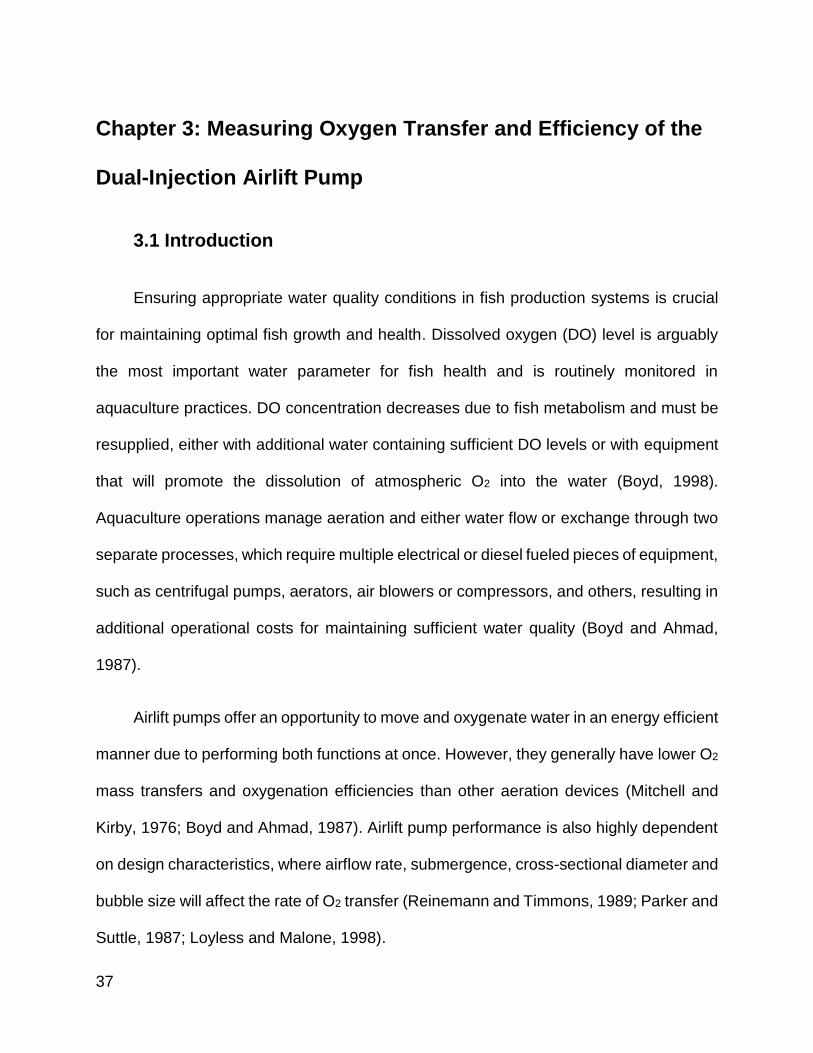
37
Chapter 3: Measuring Oxygen Transfer and Efficiency of the
Dual-Injection Airlift Pump
3.1 Introduction
Ensuring appropriate water quality conditions in fish production systems is crucial
for maintaining optimal fish growth and health. Dissolved oxygen (DO) level is arguably
the most important water parameter for fish health and is routinely monitored in
aquaculture practices. DO concentration decreases due to fish metabolism and must be
resupplied, either with additional water containing sufficient DO levels or with equipment
that will promote the dissolution of atmospheric O2 into the water (Boyd, 1998).
Aquaculture operations manage aeration and either water flow or exchange through two
separate processes, which require multiple electrical or diesel fueled pieces of equipment,
such as centrifugal pumps, aerators, air blowers or compressors, and others, resulting in
additional operational costs for maintaining sufficient water quality (Boyd and Ahmad,
1987).
Airlift pumps offer an opportunity to move and oxygenate water in an energy efficient
manner due to performing both functions at once. However, they generally have lower O2
mass transfers and oxygenation efficiencies than other aeration devices (Mitchell and
Kirby, 1976; Boyd and Ahmad, 1987). Airlift pump performance is also highly dependent
on design characteristics, where airflow rate, submergence, cross-sectional diameter and
bubble size will affect the rate of O2 transfer (Reinemann and Timmons, 1989; Parker and
Suttle, 1987; Loyless and Malone, 1998).
38
Ahmed and Badr (2012) have developed a novel dual-air injection airlift pump
design intended for improving water quality by releasing different size air bubbles through
one of two compartments. One compartment has larger holes for producing larger air
bubbles that will travel axially and thus vertically up the airlift pipe. The other compartment
has smaller holes for producing smaller air bubbles that travel radially and thus
perpendicularly to the length of the pipe. This novel airlift pump design and control of
bubble size has proven very valuable to improve efficiency and versatility of the pump for
pumping performance (Ahmed and Badr, 2012). This novel airlift design may also have
improved O2 transfer efficiency compared to other airlift pumps currently used by
aquaculture operations which generally produce larger air bubbles (Loyless and Malone,
1998). Releasing a volume of air in the form of multiple smaller air bubbles opposed to
fewer larger air bubbles will increase the total available surface area for gas diffusion;
therefore, air traveling through the radial compartment should theoretically provide
greater O2 transfers. However, research on the novel airlift pump design has thus far only
focused on water flow performance (Ahmed and Badr, 2012; Ahmed et al., 2016) and
their O2 transfer efficiency remains to be examined.
The goal of this study was to examine the O2 transfer efficiency of the novel airlift
pump with different design and operation characteristics (pipe diameter, total air flow rate,
ratio of radial to axial air flow rate, and submergence level).
39
3.2 Materials and Methods
3.2.1 Experimental Setup
A series of aquatic lab-bench trials was performed to test the O2 transfer rates and
efficiencies of the novel airlift pump. Three dual-injection airlift pumps of different
diameters were manufactured by the Gryph Energy Laboratory (School of Engineering,
University of Guelph) using polyvinyl chloride (PVC) resin and 3-D printers (Form 2,
Formlabs Inc., Somerville, Massachusetts, USA) for the 1 and 2-inch diameter pumps,
and using a mill with computer numerical control (MicroMill DSLS 3000, Microproto
Systems, Chandler, Arizona, USA) on a schedule 40 PVC pipe to create the 4-inch
diameter pump. The axial and radial holes were created in accordance with the patented
design, under US patent US 8,596,989 B2. The pumps were brought to the Fish Nutrition
Research Laboratory (Dept. of Animal Biosciences, University of Guelph) to carry out a
series of bench tests to examine their oxygenation transfer rate and efficiency (Figure 2).
The aquatic bench set up consisted a circular tank (silo) that was 74 cm in diameter
and 103 cm in height (Figure 2). The airlift pumps of different diameters were each in turn
secured in the tank with a metal frame. The pumps remained stationary during the trial.
The outflow water from the airlift pump projected into the middle of the tank. Adjustment
for different submergence ratios was carried out by changing the water level in the tank,
with 100% submergence having an injection depth of 69 cm. Air was supplied through a
high pressure (55 PSI) airline originating from three rotary-screw air compressors located
in the Central Utilities Plant of the University of Guelph.
40
a
d c
b
Figure 2: Submerged 4 (a) and 2-inch (b) diameter pumps in the experimental tank setup. Front (c) and side (d) views of the 4-inch pump outside of the tank setup.
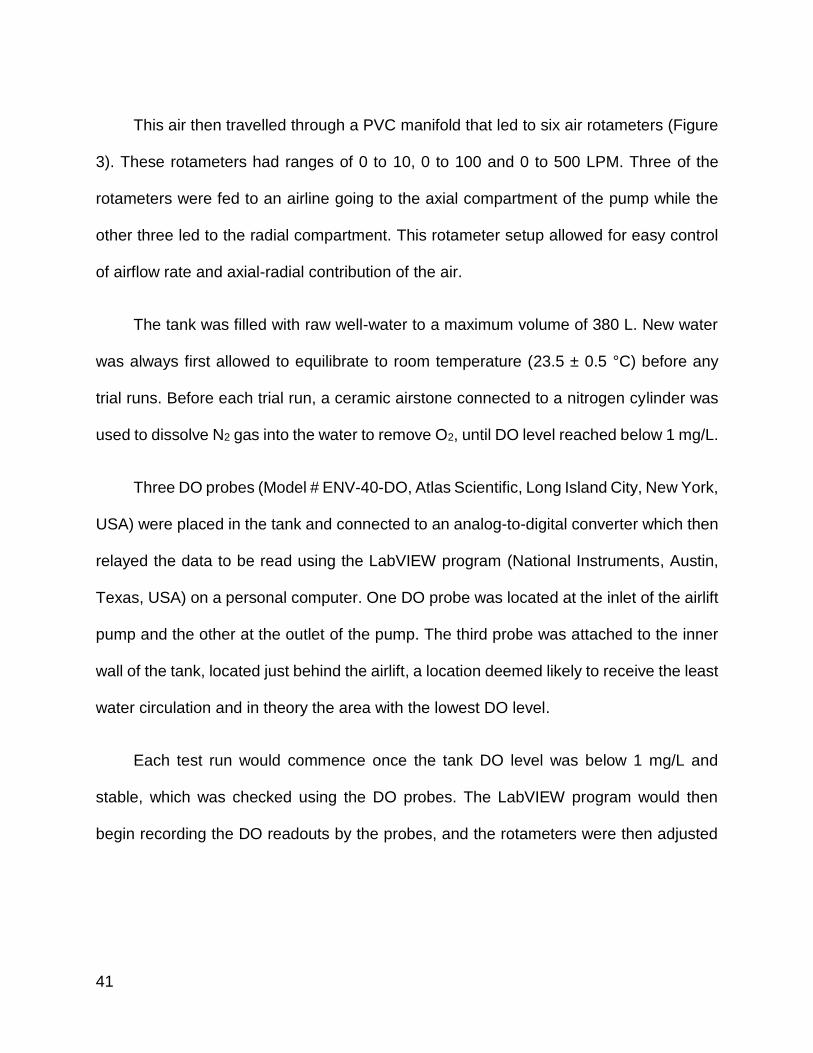
41
This air then travelled through a PVC manifold that led to six air rotameters (Figure
3). These rotameters had ranges of 0 to 10, 0 to 100 and 0 to 500 LPM. Three of the
rotameters were fed to an airline going to the axial compartment of the pump while the
other three led to the radial compartment. This rotameter setup allowed for easy control
of airflow rate and axial-radial contribution of the air.
The tank was filled with raw well-water to a maximum volume of 380 L. New water
was always first allowed to equilibrate to room temperature (23.5 ± 0.5 °C) before any
trial runs. Before each trial run, a ceramic airstone connected to a nitrogen cylinder was
used to dissolve N2 gas into the water to remove O2, until DO level reached below 1 mg/L.
Three DO probes (Model # ENV-40-DO, Atlas Scientific, Long Island City, New York,
USA) were placed in the tank and connected to an analog-to-digital converter which then
relayed the data to be read using the LabVIEW program (National Instruments, Austin,
Texas, USA) on a personal computer. One DO probe was located at the inlet of the airlift
pump and the other at the outlet of the pump. The third probe was attached to the inner
wall of the tank, located just behind the airlift, a location deemed likely to receive the least
water circulation and in theory the area with the lowest DO level.
Each test run would commence once the tank DO level was below 1 mg/L and
stable, which was checked using the DO probes. The LabVIEW program would then
begin recording the DO readouts by the probes, and the rotameters were then adjusted
42
to the desired airflow rates for that test run. The probes would continue recording until the
DO level in the tank reached 8.5 mg/L, which is the DO saturation level at 23.5 °C.
This study was designed as a 3 (axial-radial airflow contribution) x 3 (submergence
ratio) x 3 (airlift pipe diameter) x 5 (total airflow rate) multifactorial experiment (Table 2).
The axial to radial airflow contribution ratios were 25:75, 50:50, and 75:25. The
submergence ratio percentages were 100, 75, and 50 %. The airlift pipe inner diameters
were 1, 2, and 4-inches. The total airflow rates were 40, 80, 120, 160, and 200 LPM.
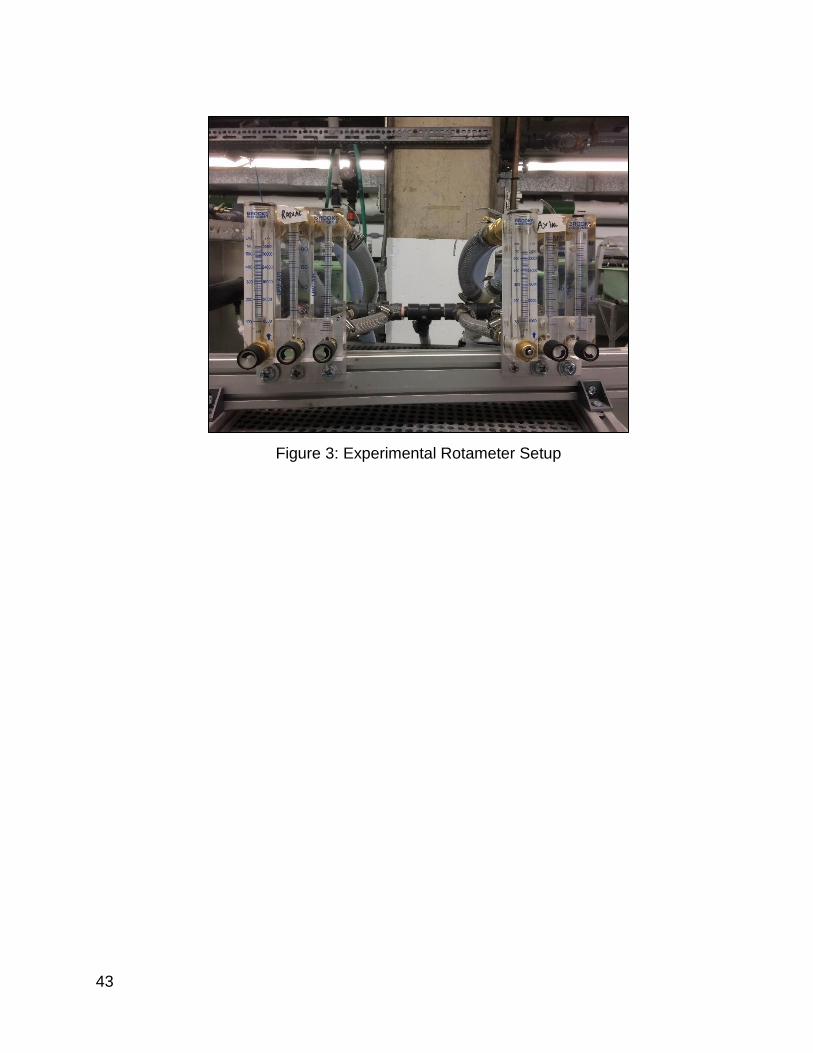
43
Figure 3: Experimental Rotameter Setup
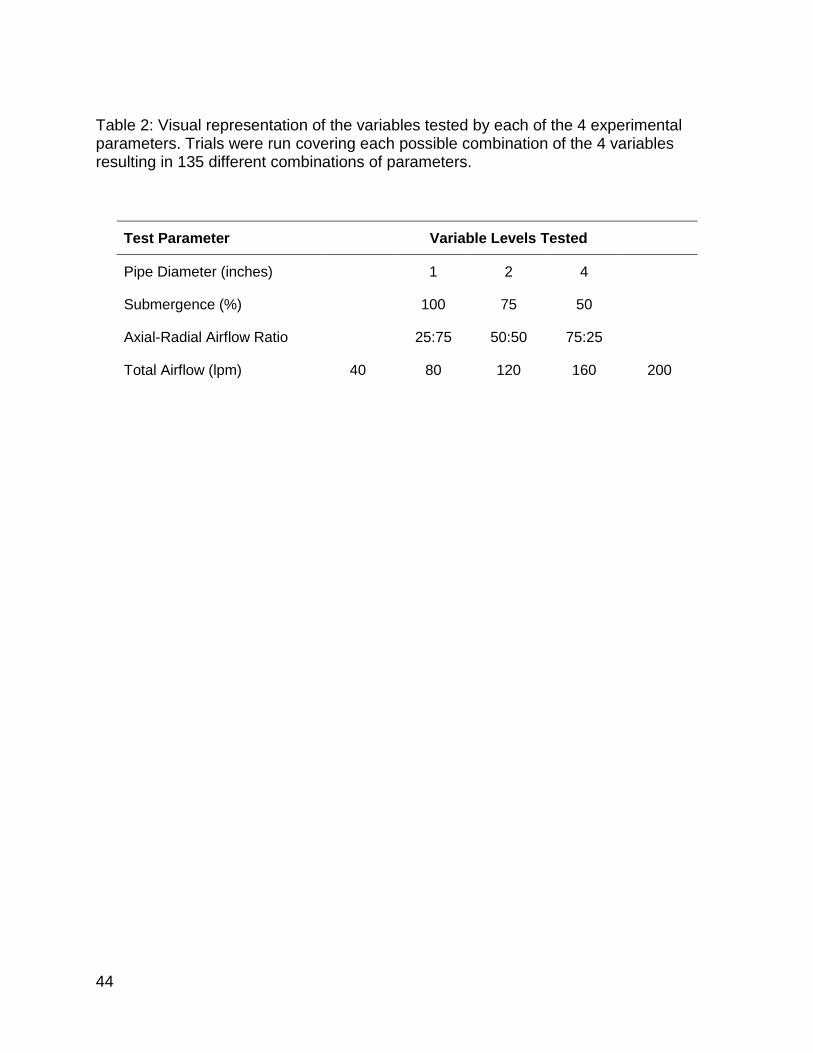
44
Table 2: Visual representation of the variables tested by each of the 4 experimental parameters. Trials were run covering each possible combination of the 4 variables resulting in 135 different combinations of parameters.
Test Parameter Variable Levels Tested
Pipe Diameter (inches) 1 2 4
Submergence (%) 100 75 50
Axial-Radial Airflow Ratio 25:75 50:50 75:25
Total Airflow (lpm) 40 80 120 160 200
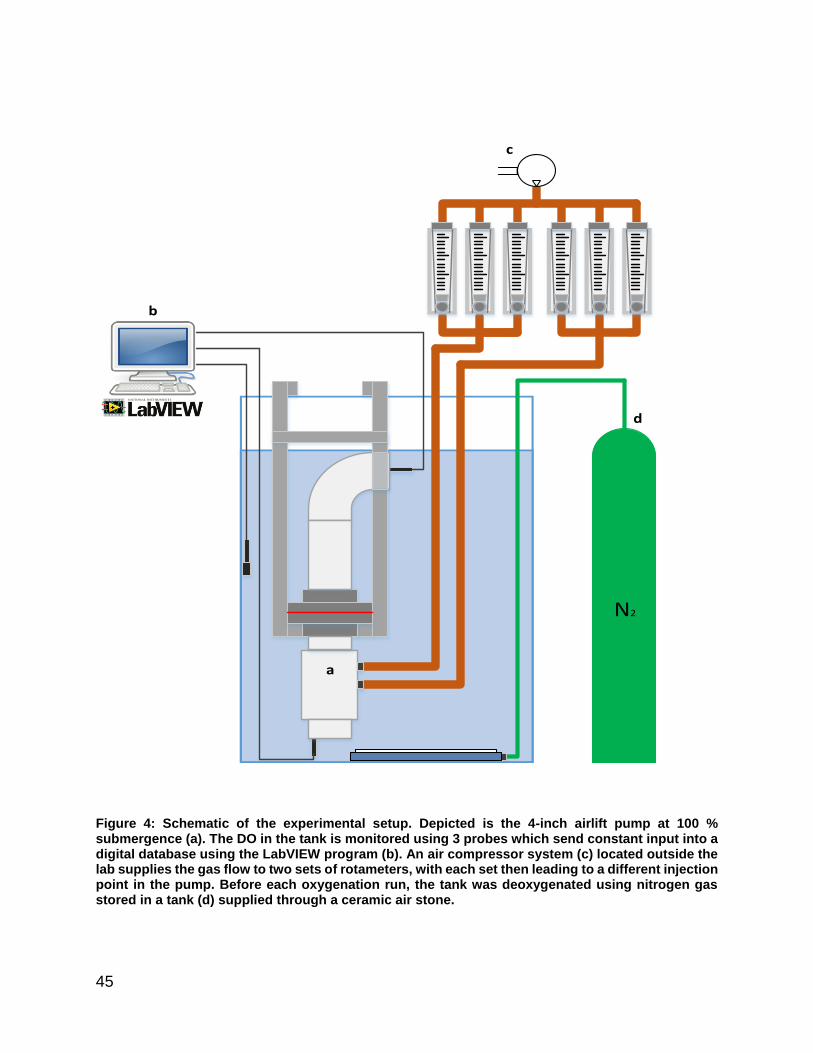
45
N2
a
b
c
d
Figure 4: Schematic of the experimental setup. Depicted is the 4-inch airlift pump at 100 % submergence (a). The DO in the tank is monitored using 3 probes which send constant input into a digital database using the LabVIEW program (b). An air compressor system (c) located outside the lab supplies the gas flow to two sets of rotameters, with each set then leading to a different injection point in the pump. Before each oxygenation run, the tank was deoxygenated using nitrogen gas stored in a tank (d) supplied through a ceramic air stone.
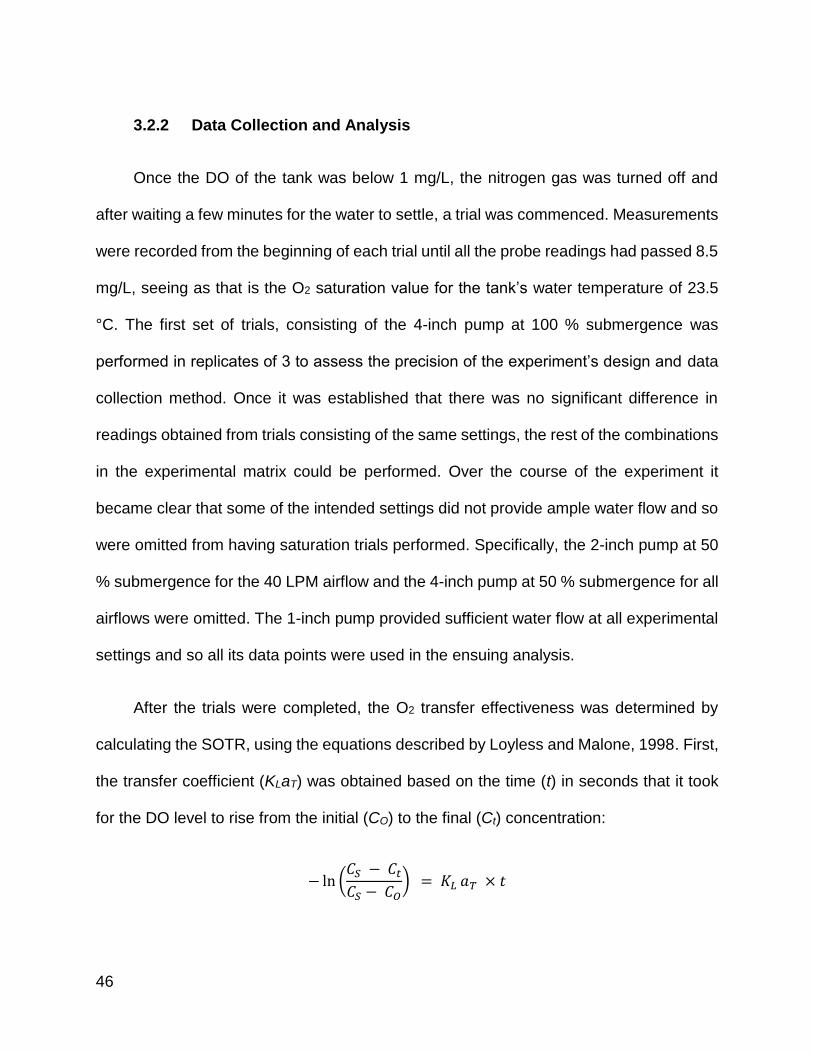
46
3.2.2 Data Collection and Analysis
Once the DO of the tank was below 1 mg/L, the nitrogen gas was turned off and
after waiting a few minutes for the water to settle, a trial was commenced. Measurements
were recorded from the beginning of each trial until all the probe readings had passed 8.5
mg/L, seeing as that is the O2 saturation value for the tank’s water temperature of 23.5
°C. The first set of trials, consisting of the 4-inch pump at 100 % submergence was
performed in replicates of 3 to assess the precision of the experiment’s design and data
collection method. Once it was established that there was no significant difference in
readings obtained from trials consisting of the same settings, the rest of the combinations
in the experimental matrix could be performed. Over the course of the experiment it
became clear that some of the intended settings did not provide ample water flow and so
were omitted from having saturation trials performed. Specifically, the 2-inch pump at 50
% submergence for the 40 LPM airflow and the 4-inch pump at 50 % submergence for all
airflows were omitted. The 1-inch pump provided sufficient water flow at all experimental
settings and so all its data points were used in the ensuing analysis.
After the trials were completed, the O2 transfer effectiveness was determined by
calculating the SOTR, using the equations described by Loyless and Malone, 1998. First,
the transfer coefficient (KLaT) was obtained based on the time (t) in seconds that it took
for the DO level to rise from the initial (CO) to the final (Ct) concentration:
− ln (𝐶𝑆 − 𝐶𝑡
𝐶𝑆 − 𝐶𝑂) = 𝐾𝐿 𝑎𝑇 × 𝑡
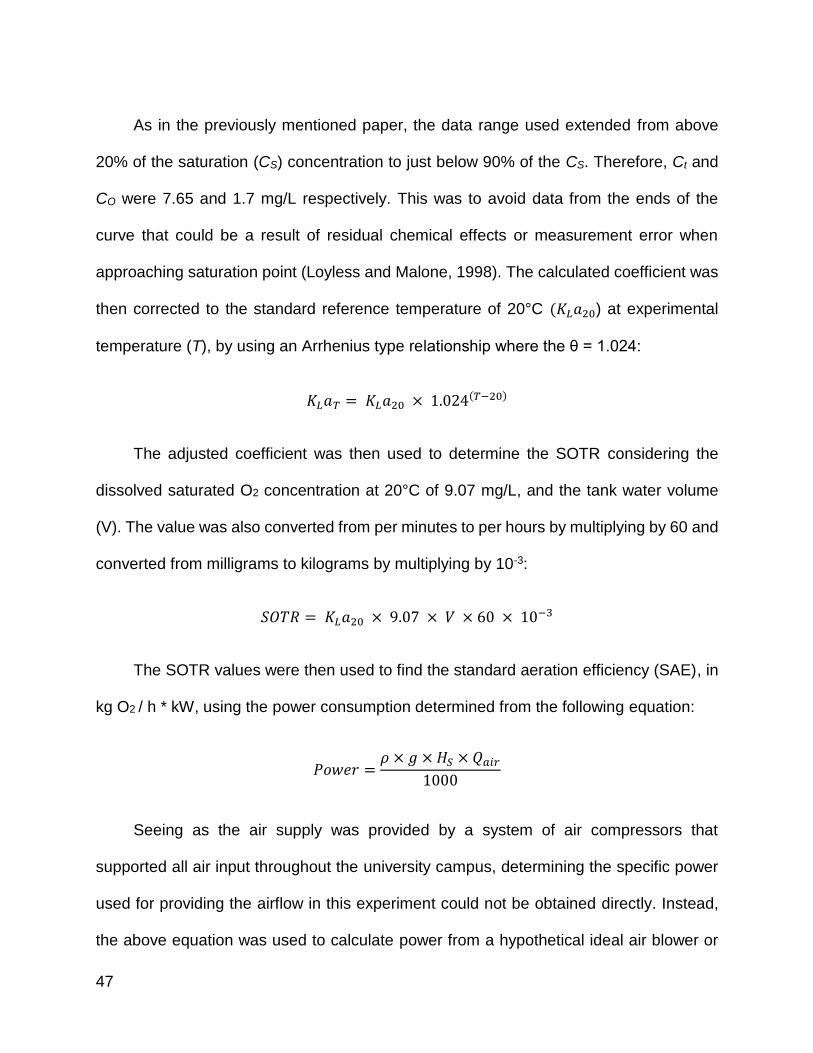
47
As in the previously mentioned paper, the data range used extended from above
20% of the saturation (CS) concentration to just below 90% of the CS. Therefore, Ct and
CO were 7.65 and 1.7 mg/L respectively. This was to avoid data from the ends of the
curve that could be a result of residual chemical effects or measurement error when
approaching saturation point (Loyless and Malone, 1998). The calculated coefficient was
then corrected to the standard reference temperature of 20°C (𝐾𝐿𝑎20) at experimental
temperature (T), by using an Arrhenius type relationship where the θ = 1.024:
𝐾𝐿𝑎𝑇 = 𝐾𝐿𝑎20 × 1.024(𝑇−20)
The adjusted coefficient was then used to determine the SOTR considering the
dissolved saturated O2 concentration at 20°C of 9.07 mg/L, and the tank water volume
(V). The value was also converted from per minutes to per hours by multiplying by 60 and
converted from milligrams to kilograms by multiplying by 10-3:
𝑆𝑂𝑇𝑅 = 𝐾𝐿𝑎20 × 9.07 × 𝑉 × 60 × 10−3
The SOTR values were then used to find the standard aeration efficiency (SAE), in
kg O2 / h * kW, using the power consumption determined from the following equation:
𝑃𝑜𝑤𝑒𝑟 =𝜌 × 𝑔 × 𝐻𝑆 × 𝑄𝑎𝑖𝑟
1000
Seeing as the air supply was provided by a system of air compressors that
supported all air input throughout the university campus, determining the specific power
used for providing the airflow in this experiment could not be obtained directly. Instead,
the above equation was used to calculate power from a hypothetical ideal air blower or
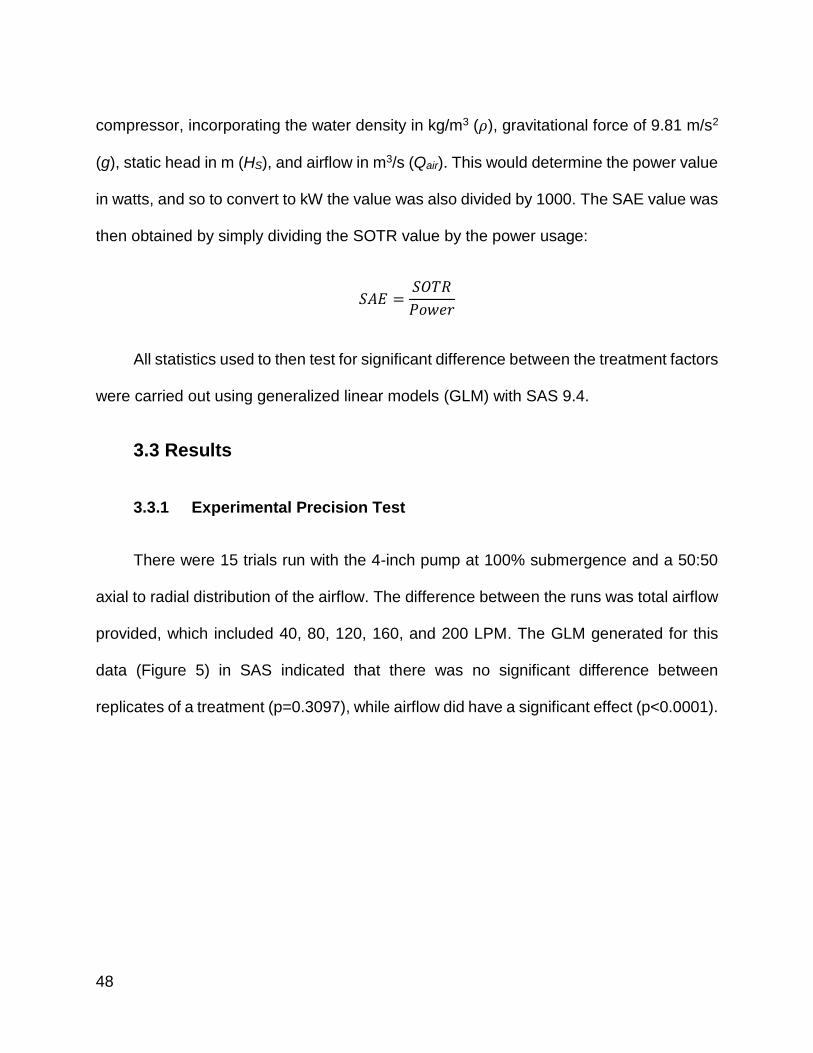
48
compressor, incorporating the water density in kg/m3 (𝜌), gravitational force of 9.81 m/s2
(g), static head in m (HS), and airflow in m3/s (Qair). This would determine the power value
in watts, and so to convert to kW the value was also divided by 1000. The SAE value was
then obtained by simply dividing the SOTR value by the power usage:
𝑆𝐴𝐸 =𝑆𝑂𝑇𝑅
𝑃𝑜𝑤𝑒𝑟
All statistics used to then test for significant difference between the treatment factors
were carried out using generalized linear models (GLM) with SAS 9.4.
3.3 Results
3.3.1 Experimental Precision Test
There were 15 trials run with the 4-inch pump at 100% submergence and a 50:50
axial to radial distribution of the airflow. The difference between the runs was total airflow
provided, which included 40, 80, 120, 160, and 200 LPM. The GLM generated for this
data (Figure 5) in SAS indicated that there was no significant difference between
replicates of a treatment (p=0.3097), while airflow did have a significant effect (p<0.0001).
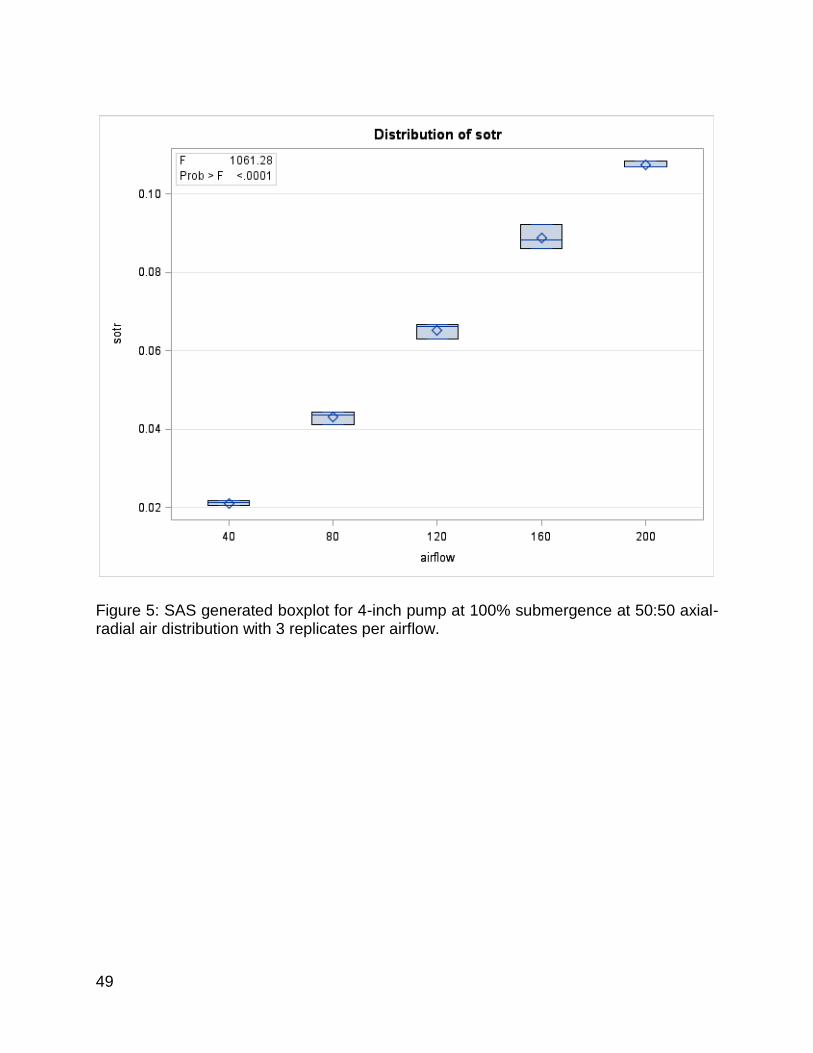
49
Figure 5: SAS generated boxplot for 4-inch pump at 100% submergence at 50:50 axial-radial air distribution with 3 replicates per airflow.
50
3.3.2 SOTR Analysis
After the precision test confirmed the replicability of the experimental procedure,
tests were conducted for the other settings of the experimental matrix without replicate. It
became evident throughout the experiment that not only did the pump size had a
significant effect on SOTR, but also on how the SOTR changed respective to the other
setup parameters. To better exemplify these results, they have been presented
individually for each pump size (Figure 6) and simultaneously for comparison between
pumps (Figure 7). Statistical analysis was then carried out to measure the significance of
each experimental setting on SOTR. When analyzing all the SOTR values together, it
was noted that each variable was significantlly relevant in affecting the resulting O2
transfer (p<0.0001). The only test results that showed no signficant difference between
the trials were interactions of axial-radial contribution with either submergence
(p=0.9408), size and submergence (p=0.2973) or airlow and submergence (p=0.9956).
Seeing as there was a different relationship in SOTR increase between the three
pump sizes, there was a following statistical analysis carried out on the effect of each of
the other setup parameters for each pump size. The results showed that once again the
individual parameters of submergence, axial-radial contribution, and airflow rate had
significant effects (p<0.0001) on the SOTR for the 2 and 4-inch pumps; however, axial-
radial contribution did not have a significant effect on the 1-inch pump SOTR. The axial-
radial contribution interaction with airflow rate also did not have significant effect for the
1-inch (p=0.9095) or 2-inch (p=0.1446) pumps. Meanwhile, the axial-radial contribution
51
interaction with submergence did not have a significant effect on the 2 (p=0.5458) or 4-
inch (p=0.4291) pumps.
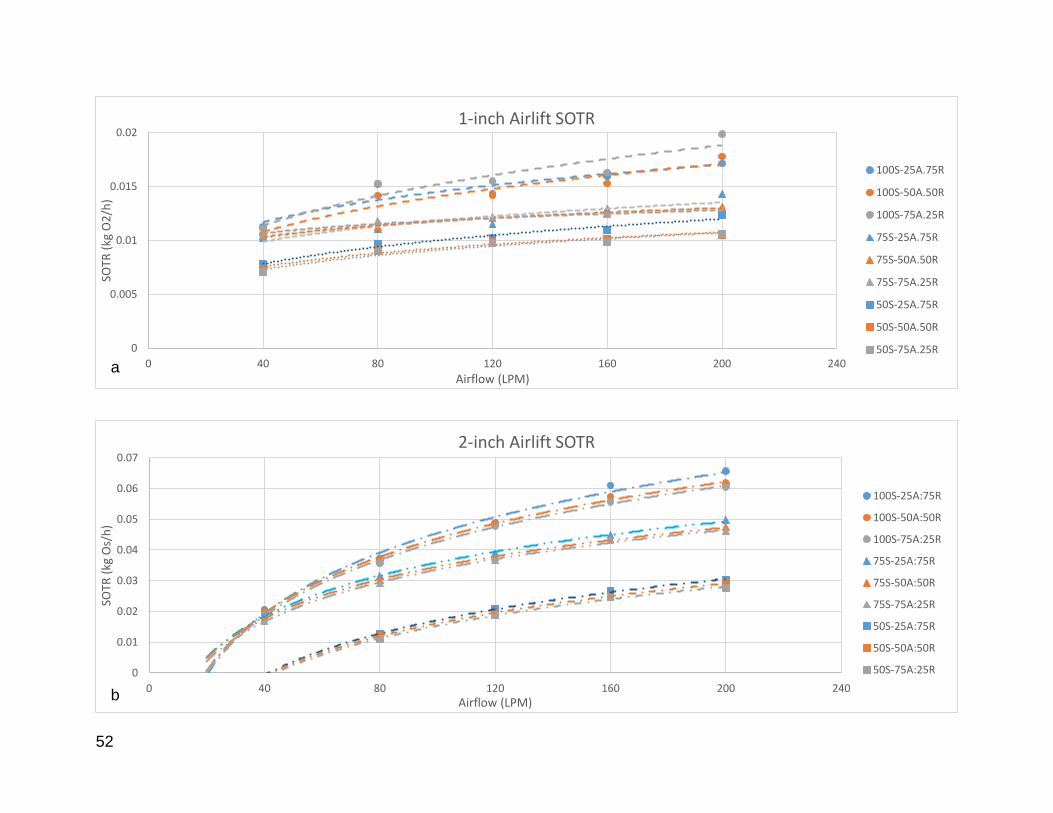
52
0
0.005
0.01
0.015
0.02
0 40 80 120 160 200 240
SOTR
(kg
O2
/h)
Airflow (LPM)
1-inch Airlift SOTR
100S-25A.75R
100S-50A.50R
100S-75A.25R
75S-25A.75R
75S-50A.50R
75S-75A.25R
50S-25A.75R
50S-50A.50R
50S-75A.25R
0
0.01
0.02
0.03
0.04
0.05
0.06
0.07
0 40 80 120 160 200 240
SOTR
(kg
Os/
h)
Airflow (LPM)
2-inch Airlift SOTR
100S-25A:75R
100S-50A:50R
100S-75A:25R
75S-25A:75R
75S-50A:50R
75S-75A:25R
50S-25A:75R
50S-50A:50R
50S-75A:25R
a
b
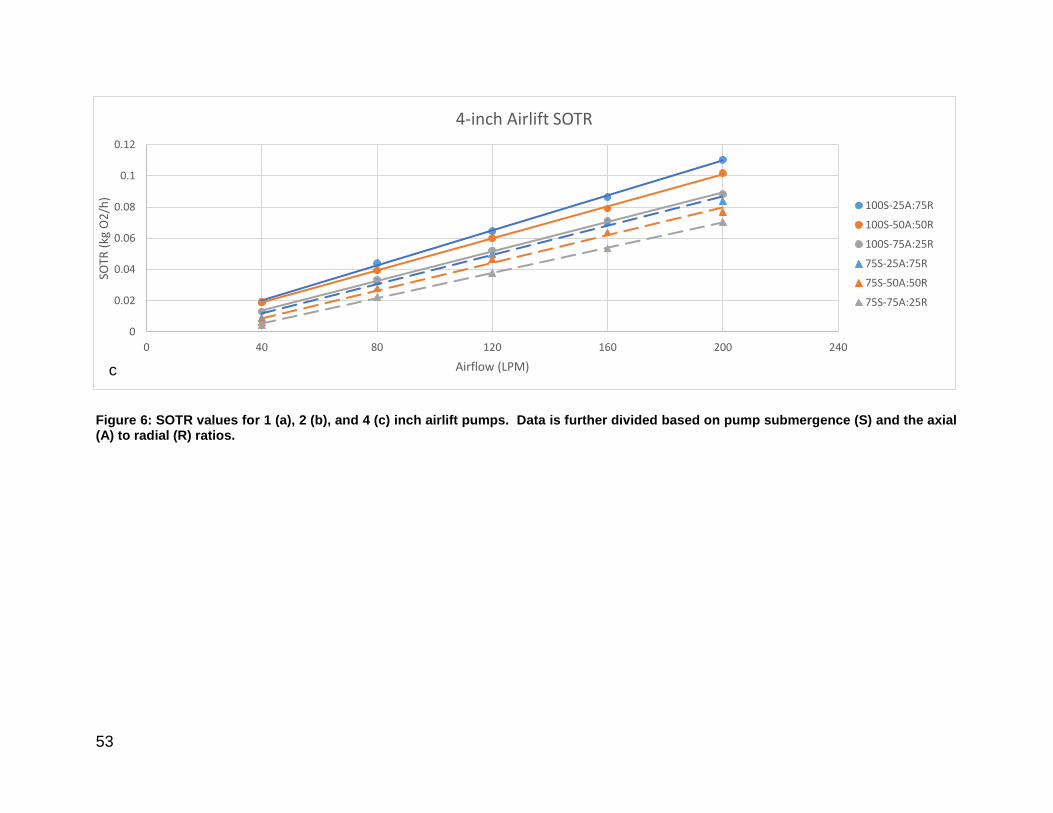
53
0
0.02
0.04
0.06
0.08
0.1
0.12
0 40 80 120 160 200 240
SOTR
(kg
O2
/h)
Airflow (LPM)
4-inch Airlift SOTR
100S-25A:75R
100S-50A:50R
100S-75A:25R
75S-25A:75R
75S-50A:50R
75S-75A:25R
Figure 6: SOTR values for 1 (a), 2 (b), and 4 (c) inch airlift pumps. Data is further divided based on pump submergence (S) and the axial (A) to radial (R) ratios.
c
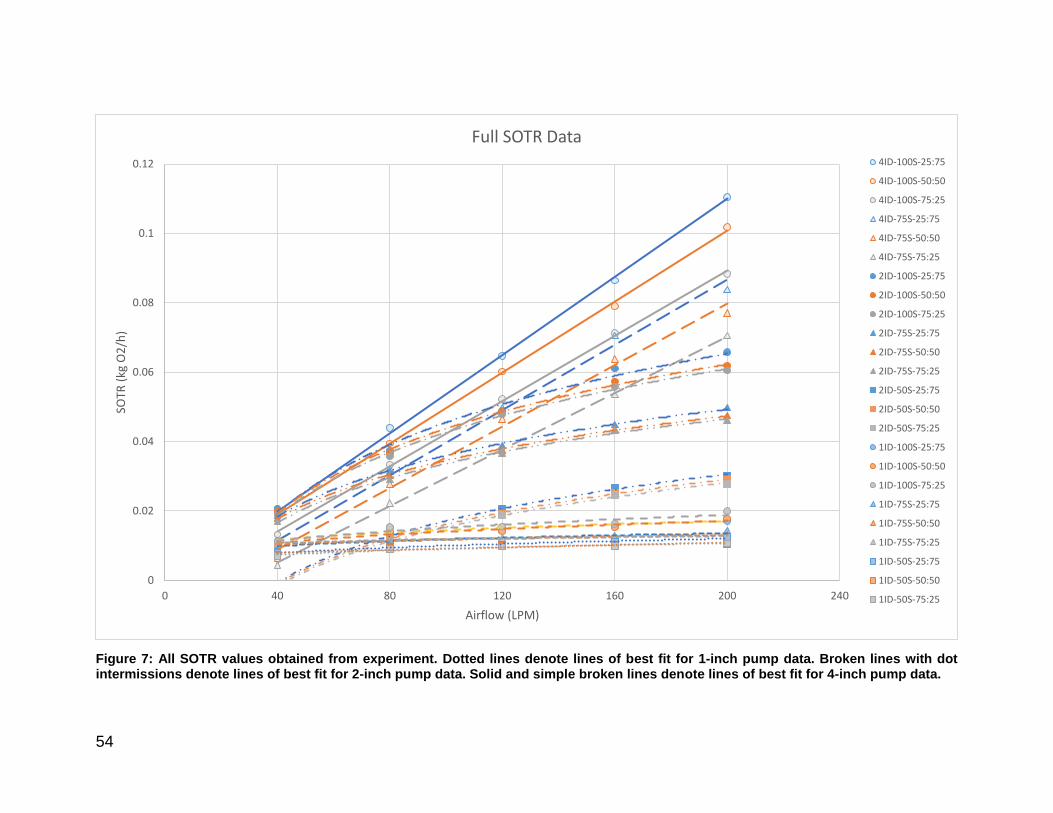
54
0
0.02
0.04
0.06
0.08
0.1
0.12
0 40 80 120 160 200 240
SOTR
(kg
O2
/h)
Airflow (LPM)
Full SOTR Data4ID-100S-25:75
4ID-100S-50:50
4ID-100S-75:25
4ID-75S-25:75
4ID-75S-50:50
4ID-75S-75:25
2ID-100S-25:75
2ID-100S-50:50
2ID-100S-75:25
2ID-75S-25:75
2ID-75S-50:50
2ID-75S-75:25
2ID-50S-25:75
2ID-50S-50:50
2ID-50S-75:25
1ID-100S-25:75
1ID-100S-50:50
1ID-100S-75:25
1ID-75S-25:75
1ID-75S-50:50
1ID-75S-75:25
1ID-50S-25:75
1ID-50S-50:50
1ID-50S-75:25
Figure 7: All SOTR values obtained from experiment. Dotted lines denote lines of best fit for 1-inch pump data. Broken lines with dot intermissions denote lines of best fit for 2-inch pump data. Solid and simple broken lines denote lines of best fit for 4-inch pump data.
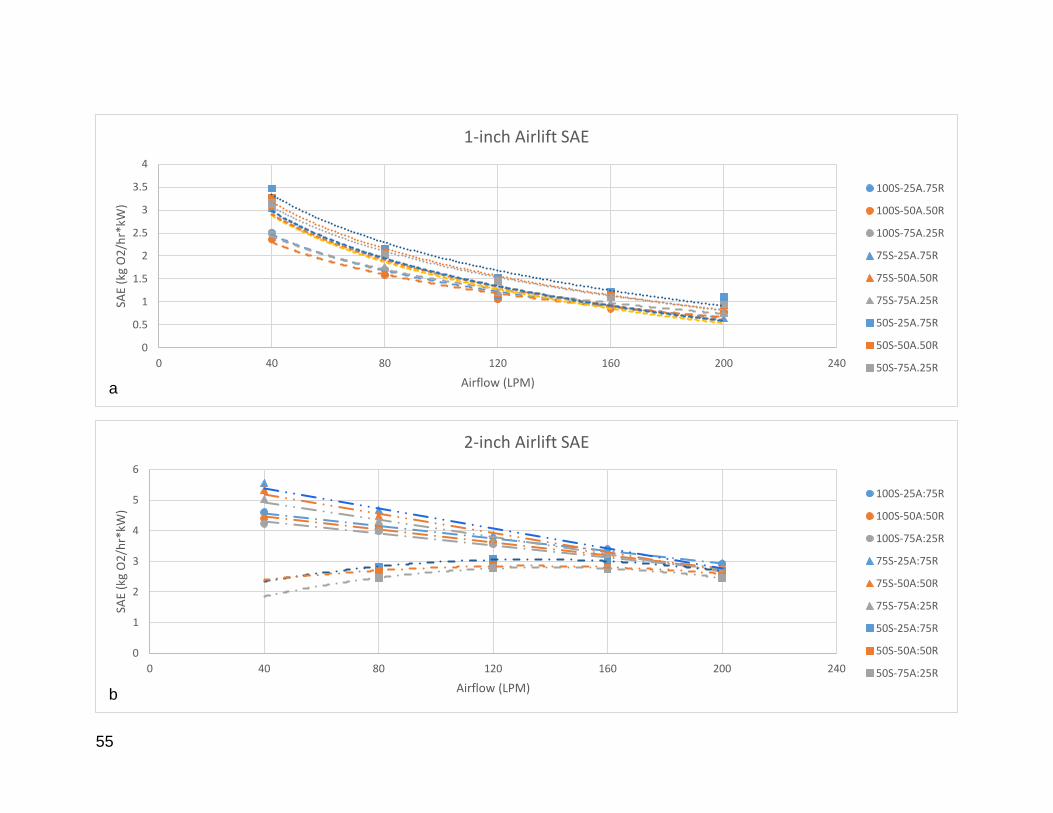
55
0
0.5
1
1.5
2
2.5
3
3.5
4
0 40 80 120 160 200 240
SAE
(kg
O2
/hr*
kW)
Airflow (LPM)
1-inch Airlift SAE
100S-25A.75R
100S-50A.50R
100S-75A.25R
75S-25A.75R
75S-50A.50R
75S-75A.25R
50S-25A.75R
50S-50A.50R
50S-75A.25R
0
1
2
3
4
5
6
0 40 80 120 160 200 240
SAE
(kg
O2
/hr*
kW)
Airflow (LPM)
2-inch Airlift SAE
100S-25A:75R
100S-50A:50R
100S-75A:25R
75S-25A:75R
75S-50A:50R
75S-75A:25R
50S-25A:75R
50S-50A:50R
50S-75A:25R
a
b
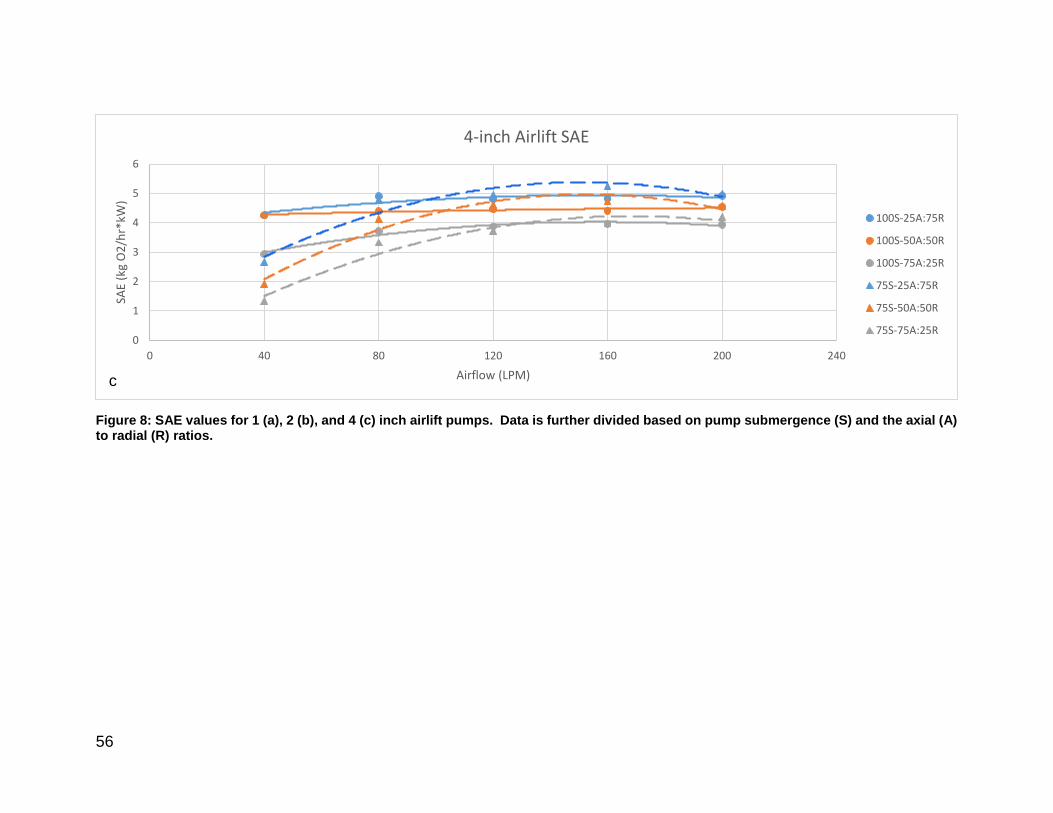
56
Figure 8: SAE values for 1 (a), 2 (b), and 4 (c) inch airlift pumps. Data is further divided based on pump submergence (S) and the axial (A) to radial (R) ratios.
0
1
2
3
4
5
6
0 40 80 120 160 200 240
SAE
(kg
O2
/hr*
kW)
Airflow (LPM)
4-inch Airlift SAE
100S-25A:75R
100S-50A:50R
100S-75A:25R
75S-25A:75R
75S-50A:50R
75S-75A:25R
c
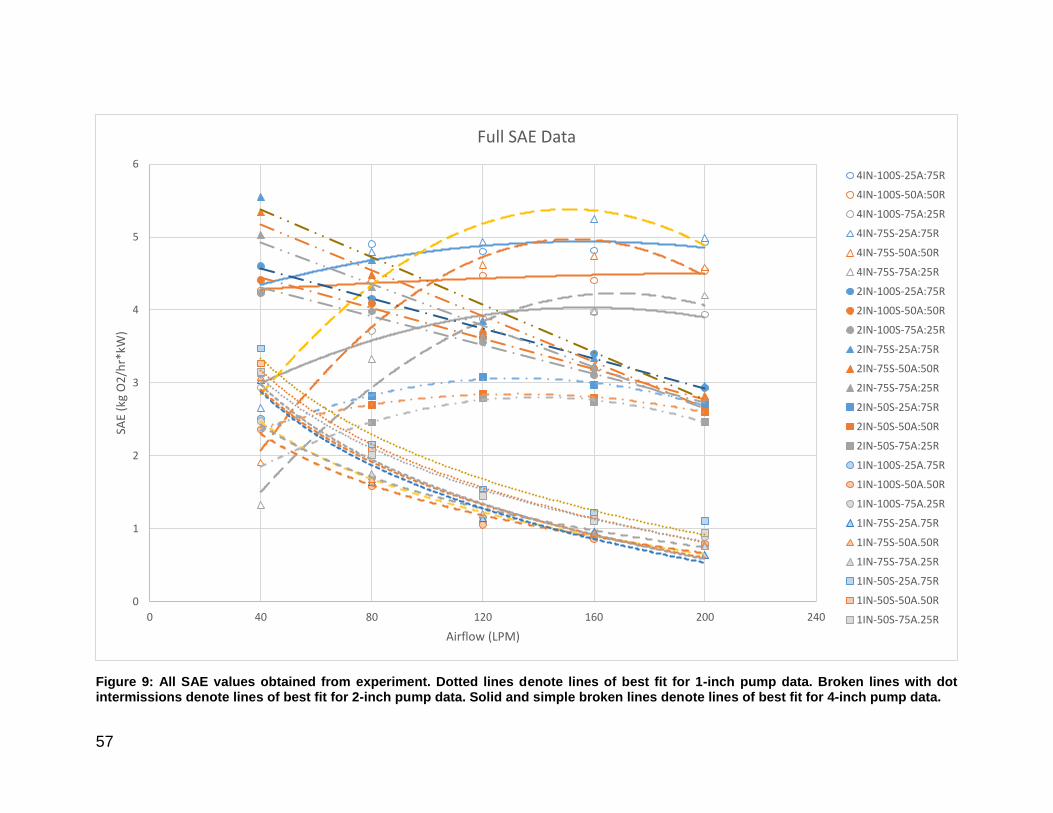
57
Figure 9: All SAE values obtained from experiment. Dotted lines denote lines of best fit for 1-inch pump data. Broken lines with dot intermissions denote lines of best fit for 2-inch pump data. Solid and simple broken lines denote lines of best fit for 4-inch pump data.
0
1
2
3
4
5
6
0 40 80 120 160 200 240
SAE
(kg
O2
/hr*
kW)
Airflow (LPM)
Full SAE Data
4IN-100S-25A:75R
4IN-100S-50A:50R
4IN-100S-75A:25R
4IN-75S-25A:75R
4IN-75S-50A:50R
4IN-75S-75A:25R
2IN-100S-25A:75R
2IN-100S-50A:50R
2IN-100S-75A:25R
2IN-75S-25A:75R
2IN-75S-50A:50R
2IN-75S-75A:25R
2IN-50S-25A:75R
2IN-50S-50A:50R
2IN-50S-75A:25R
1IN-100S-25A.75R
1IN-100S-50A.50R
1IN-100S-75A.25R
1IN-75S-25A.75R
1IN-75S-50A.50R
1IN-75S-75A.25R
1IN-50S-25A.75R
1IN-50S-50A.50R
1IN-50S-75A.25R
58
3.3.3 SAE Analysis
Once all the SOTR values were obtained, they were then used to calculate the
respective SAE values. These were then also plotted, first on an individual pump size
basis (Figure 8) and then all together (Figure 9). Although the individual variables all had
significant effects on aeration efficiency (p<0.0001), there were several interaction effects
that did not show significant difference in the results. Like with the SOTR analysis, there
was no statistical significance in the SAE response based on the submergence to axial-
radial contribution interaction (p=0.2075), or to the interaction of submergence and axial-
radial contribution with either pump size (p=0.3838) or airflow rate (p=0.4726). However,
there was also no significant effect when looking at the interaction of axial-radial airflow
contribution with total airflow (p=0.0625) or with the interaction of axial-radial contribution
with total airflow and size (p=0.6597).
Interestingly, the analysis showed that contrary to the SOTR data, when analyzing
solely the 1-inch pump, there was a significant difference from the axial-radial contribution
on the SAE (p=0.0322). However, in conjunction with the SOTR analysis, there was no
significant effect seen from the total airflow interaction with the axial-radial airflow
contribution (p=0.2998). The mass transfer and efficiency analysis did show similar
statistical results for the 2-inch pump, where there was no significant effect from the
interaction of axial radial contribution with the submergence (p=0.5244) or the total airflow
(p=0.2578). Similarly, the 4-inch pump analysis also showed no statistical significance on
efficiency from the interaction effect of axial-radial contribution to submergence
(p=0.4408) or total airflow (p=0.5982).
59
3.4 Discussion
3.4.1 SOTR Analysis
The current study quantified the effects of different experimental setups on the airlift
pump’s O2 transfer capabilities to indicate how they would influence the effectiveness of
the pump for aeration. In general, increases in pump size, airflow rate, submergence and
radial airflow contribution resulted in greater SOTR values as was predicted. However, it
should be noted that these increases were not always linear and deserve more
investigation to better understand how the pump would perform under various conditions
encountered in different aquaculture systems.
Throughout the experiment, airflow rate was a statistically significant parameter for
all pump sizes (p<0.0001), with higher airflow rates resulting in increased SOTR given all
other factors were consistent. The only point at which an increase in airflow rate resulted
in a decrease of SOTR was with the 1-inch pump at 100% submergence and a 25:75
axial-radial distribution going from 80 to 120 LPM. This discrepancy in the pattern may be
related to pump size, as when visually examining the data (Figure 6), it can be observed
that with increasing pump size the changes in airflow rate have a larger impact on SOTR.
For example, the average differences in SOTR between the lowest and highest airflow
rates for the 1, 2, and 4-inch pumps are increases of around 50, 200, and 800 %,
respectively. Therefore, since the smallest pump had the smallest proportional increase
in SOTR with increasing airflows, there was a higher probability of experimental error
causing an observed drop in the upward pattern. The reason as to why larger pump size
60
causes greater increases in SOTR with higher airflow rates could be due to the pipe’s
void fraction. If a pump has a smaller cross-section, then a greater proportion of its pipe
will be filled with gas compared to a pump with a larger pipe cross section at similar airflow
rates. This higher void fraction will result in the air bubbles coalescing and taking on new
flow patterns such as slug, churn, and annular (Mahrous and Matrawy, 2014). Such
patterns will have lower bubble surface areas and thus be less efficient at gas transfer
(Reinemann and Timmons, 1989). Thus, the experimental airflow rate range might have
been at levels which produced coalesced air bubbles known as gas slugs or other low
surface area flows in the 1-inch pump, resulting in lower O2 transfer increases with higher
airflow rates.
Another source of inconsistency in the data stems from the results comparing axial
to radial contribution for the 1-inch airlift pump, which did not have a significant impact on
the SOTR (p=0.099). The data for the 2 and 4-inch pumps shows a consistent trend of
higher SOTR values with greater radial airflow contributions, and the results do point to a
significant impact of the bubble size on O2 transfer (p<0.0001). This is in accordance with
the theory of the pump’s design where the higher axial contribution is intended to increase
water flow while higher radial contribution should increase O2 transfer due to greater
bubble surface area available for gas transfer. The reason as to why this was not
observed with the 1-inch data might be due to inconsistencies in flow pattern once the
pump has passed a certain void fraction threshold as suggested with the airflow rate data
interpretation. This can be inferred from the difference in high to low radial contribution
effect on the 4 and 2-inch pump SOTRs, which on average had 37 and 4 % increases
respectively when going from 25 to 75 % radial airflow contribution (Figure 6). These
61
numbers further support the idea that the pump size will affect flow pattern at similar
airflows, so that greater bubble coalescence occurs in smaller airlifts due to higher void
fraction, leading to less efficient O2 transfers. This would therefore negate the aeration
benefits of radial air injections once the void fraction has passed a certain level, creating
significant implications on system design. The data suggests that smaller size pumps will
need lower airflow rates to see an advantage of radial airflow over axial on oxygenation.
Meanwhile, at higher airflows the radial effect is negated so the user may as well just use
higher axial contribution to obtain higher water flow, as no effect will be seen on
oxygenation.
Throughout the study, higher submergence always had a positive effect on SOTR
increase, given that all other factors remained consistent. However, it should be
addressed that some points in the experimental matrix could not be obtained under
certain conditions. For example, when the 2-inch pump was set at 50% submergence,
the provision of total airflow at 40 LPM was unable to generate any consistent water flow
out of the airlift. This does however make sense when reviewing the curve for the pump’s
SOTR generated by the other 50% submergence data, as it predicts there to be no O2
transfer at 40 LPM (Figure 5b). Although air is still being released and providing gas
transfer to the water in the pipe, since it is not being pumped out of the airlift at that setting
the actual increase in DO would not be enough to justify such a setup. Meanwhile, the 4-
inch pump did not generate any results at 50% submergence, namely because either the
water could not be pumped out or it was at such an insignificant trickle as to not warrant
any further investigation. All these examples contrast with the 1-inch pump which
consistently showed results for all points in its data matrix regardless of how low the
62
submergence was. This might simply indicate the amount of airflow and submergence
required for the 1-inch airlift to pump water out is at a lower threshold then for the 2 and
4-inch pumps. This relationship might also be a result of gas slugs which would form
easier in a smaller cross section of pipe, and then aide in moving water. The creation of
these larger bubble flows in the pump could provide an advantage for pumps with smaller
pipe cross sections, since as was seen in the study (Figure 7) there were greater O2
transfers for the 1-inch pump compared to the other two at lower airflows and
submergences. Therefore, if an aquaculture system is limited by low airflow rates or
needs to pump water to an elevated level as would be seen in recirculating or aquaponics
system (Huguenin and Colt, 2002), then it might be more reasonable to implement small
diameter airlift pumps for better oxygenation. This helps to illustrate how higher values
for the four test variables do not always yield greater SOTR responses, and that they can
influence each other to affect O2 transfer.
When comparing how the different variables will interact with one another to affect
SOTR, there is significant interaction (p<0.0001 – 0.0021) between all of them except for
submergence with axial-radial injection (p=0.9408). This likely indicates that the depth or
head of the pump will not change the capability of higher radial flows to provide more O2
transfer even at lower submergence levels. This lack of significant interaction between
submergence and axial-radial contribution is also seen when analyzing the data for solely
the 4-inch (p=0.4291) and 2-inch (p=0.5458) pumps, but not for the 1-inch (p=0.0189). It
should be noted though that the injected bubble size did not have a significant effect on
the 1-inch pump data (p=0.099), hence its significant interaction with submergence may
be simply a result of statistical artifact. However, the axial-radial injection also did not
63
have a significant interaction effect with airflow for both the 1 (p=0.9095) and 2-inch
(p=0.1446) airlift pumps. This would again imply that the airflow rate would not
significantly impact the axial to radial airflow ratio’s effect on O2 transfer. It is then
noteworthy to mention how there was a significant interaction between these two
variables for the 4-inch pump data (p=0.0261), since as can be seen from the data the
improvement in SOTR by higher radial airflow contributions is greater at higher airflow
rates (Figure 6c). Although the reason as to why this pattern was observed for the largest
pump and not the other two is unclear, it could be possible that it was simply due to the
statistical analysis being based on less observations. For example, the data for the 2-inch
pump SOTRs (Figure 6b) also appears visually to indicate higher O2 transfer at high radial
airflow contributions when at greater airflows rates, yet the analysis does not indicate this
as a significant effect (p=0.1446). To resolve whether these results were simply due to
experimental design, future research could examine a narrower experimental matrix for
the 4-inch pump to avoid setups that will not yield results as was seen at 50 %
submergence for this airlift size. Nonetheless, these analyses suggest that although there
are significant interactions between the airlift setup variables on the resulting O2 transfers,
the exact relationship between the injected bubble size with the other parameters
warrants further investigation.
The results and analyses of this study have shown that each of the test variables
had a significant effect on pump performance, yet the greatest effect was likely due to
pump size. The impact this variable had on SOTR is likely best realized when reviewing
the lines of best fit that were used to illustrate the patterns of O2 transfer observed in the
experiment (Figure 7). As can be seen, when at constant axial-radial and submergence
64
settings, greater airflow rates will increase the SOTR of the 1, 2, and 4-inch pumps in a
power-based, logarithmic and linear fashion respectively. These results most likely imply
that increasing airflow will cause an overall logarithmic rate of SOTR increase, where
eventually the higher airflow rates do not yield better O2 transfers due to greater void
fraction. The reason as to why this was not the best relationship for the 1 and 4-inch pump
data may be due to the experimental matrix not containing points where higher airflow
rates reach the optimal O2 transfer efficiency before then plateauing SOTR with higher
airflows. In other words, to observe a logarithmic pattern there would likely need to be
more samples taken at higher airflows for the 4-inch pump, and at lower airflows for the
1-inch pump. This can have important implications on system design as it means the
optimal aeration efficiency will be at different settings for each pump. For this reason, the
pump efficiency also had to be calculated to determine how the airlift setups would impact
energy usage for O2 transfer.
3.4.2 SAE Analysis
Unlike SOTR which showed a nearly constant positive trend with increasing airflow,
the SAE would mostly decline with higher airflows. This result makes sense considering
that the efficiency is calculated in part based on airflow used, so higher airflow rates will
require more electrical consumption thus decreasing the energy efficiency. Interestingly,
although increased airflow rates always decreased aeration efficiency for the 1-inch pump
so long as other design characteristics remained consistent (Figure 8a) this was not
always observed for the 2 and 4-inch airlifts. For the 2-inch pump at 50 % submergence,
the data shows better aeration efficiency when the airflow rate increases from 80 to 120
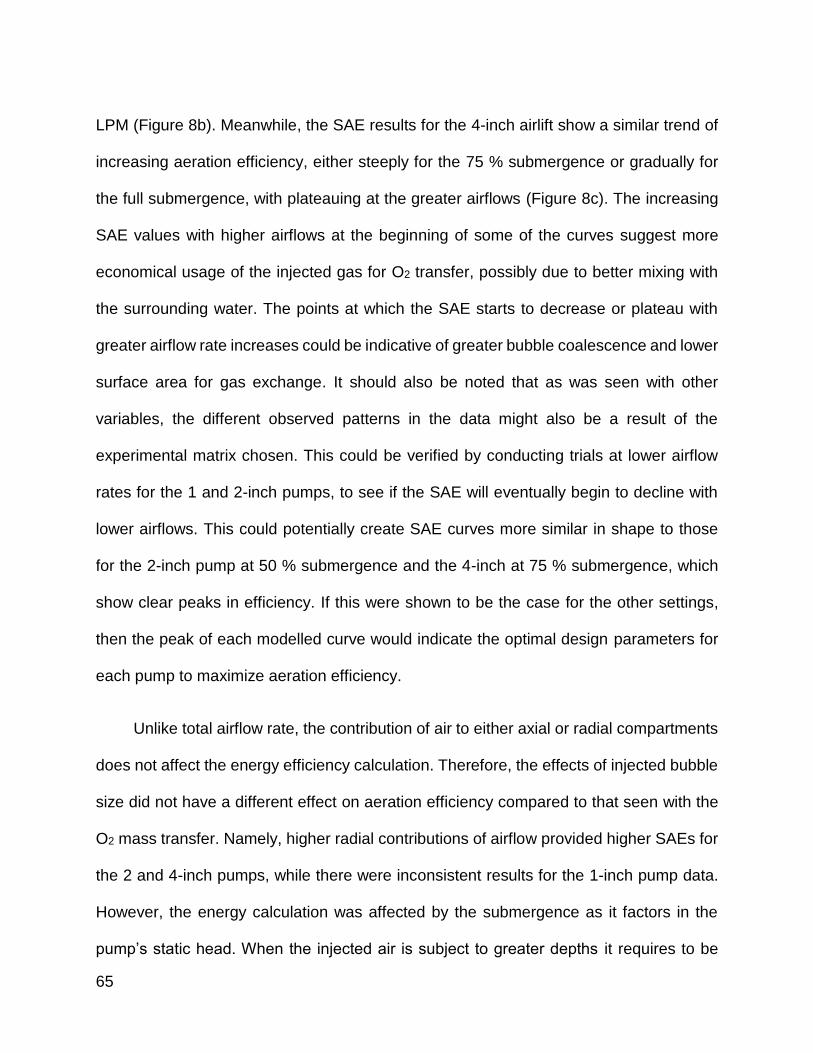
65
LPM (Figure 8b). Meanwhile, the SAE results for the 4-inch airlift show a similar trend of
increasing aeration efficiency, either steeply for the 75 % submergence or gradually for
the full submergence, with plateauing at the greater airflows (Figure 8c). The increasing
SAE values with higher airflows at the beginning of some of the curves suggest more
economical usage of the injected gas for O2 transfer, possibly due to better mixing with
the surrounding water. The points at which the SAE starts to decrease or plateau with
greater airflow rate increases could be indicative of greater bubble coalescence and lower
surface area for gas exchange. It should also be noted that as was seen with other
variables, the different observed patterns in the data might also be a result of the
experimental matrix chosen. This could be verified by conducting trials at lower airflow
rates for the 1 and 2-inch pumps, to see if the SAE will eventually begin to decline with
lower airflows. This could potentially create SAE curves more similar in shape to those
for the 2-inch pump at 50 % submergence and the 4-inch at 75 % submergence, which
show clear peaks in efficiency. If this were shown to be the case for the other settings,
then the peak of each modelled curve would indicate the optimal design parameters for
each pump to maximize aeration efficiency.
Unlike total airflow rate, the contribution of air to either axial or radial compartments
does not affect the energy efficiency calculation. Therefore, the effects of injected bubble
size did not have a different effect on aeration efficiency compared to that seen with the
O2 mass transfer. Namely, higher radial contributions of airflow provided higher SAEs for
the 2 and 4-inch pumps, while there were inconsistent results for the 1-inch pump data.
However, the energy calculation was affected by the submergence as it factors in the
pump’s static head. When the injected air is subject to greater depths it requires to be
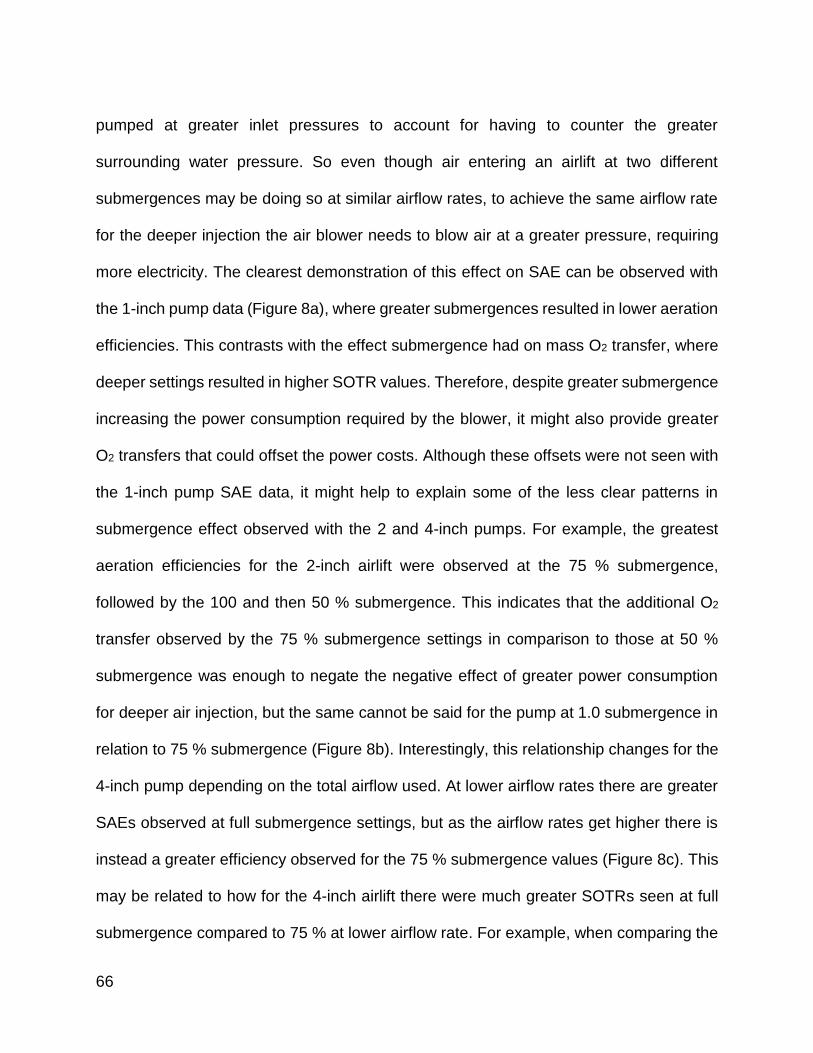
66
pumped at greater inlet pressures to account for having to counter the greater
surrounding water pressure. So even though air entering an airlift at two different
submergences may be doing so at similar airflow rates, to achieve the same airflow rate
for the deeper injection the air blower needs to blow air at a greater pressure, requiring
more electricity. The clearest demonstration of this effect on SAE can be observed with
the 1-inch pump data (Figure 8a), where greater submergences resulted in lower aeration
efficiencies. This contrasts with the effect submergence had on mass O2 transfer, where
deeper settings resulted in higher SOTR values. Therefore, despite greater submergence
increasing the power consumption required by the blower, it might also provide greater
O2 transfers that could offset the power costs. Although these offsets were not seen with
the 1-inch pump SAE data, it might help to explain some of the less clear patterns in
submergence effect observed with the 2 and 4-inch pumps. For example, the greatest
aeration efficiencies for the 2-inch airlift were observed at the 75 % submergence,
followed by the 100 and then 50 % submergence. This indicates that the additional O2
transfer observed by the 75 % submergence settings in comparison to those at 50 %
submergence was enough to negate the negative effect of greater power consumption
for deeper air injection, but the same cannot be said for the pump at 1.0 submergence in
relation to 75 % submergence (Figure 8b). Interestingly, this relationship changes for the
4-inch pump depending on the total airflow used. At lower airflow rates there are greater
SAEs observed at full submergence settings, but as the airflow rates get higher there is
instead a greater efficiency observed for the 75 % submergence values (Figure 8c). This
may be related to how for the 4-inch airlift there were much greater SOTRs seen at full
submergence compared to 75 % at lower airflow rate. For example, when comparing the
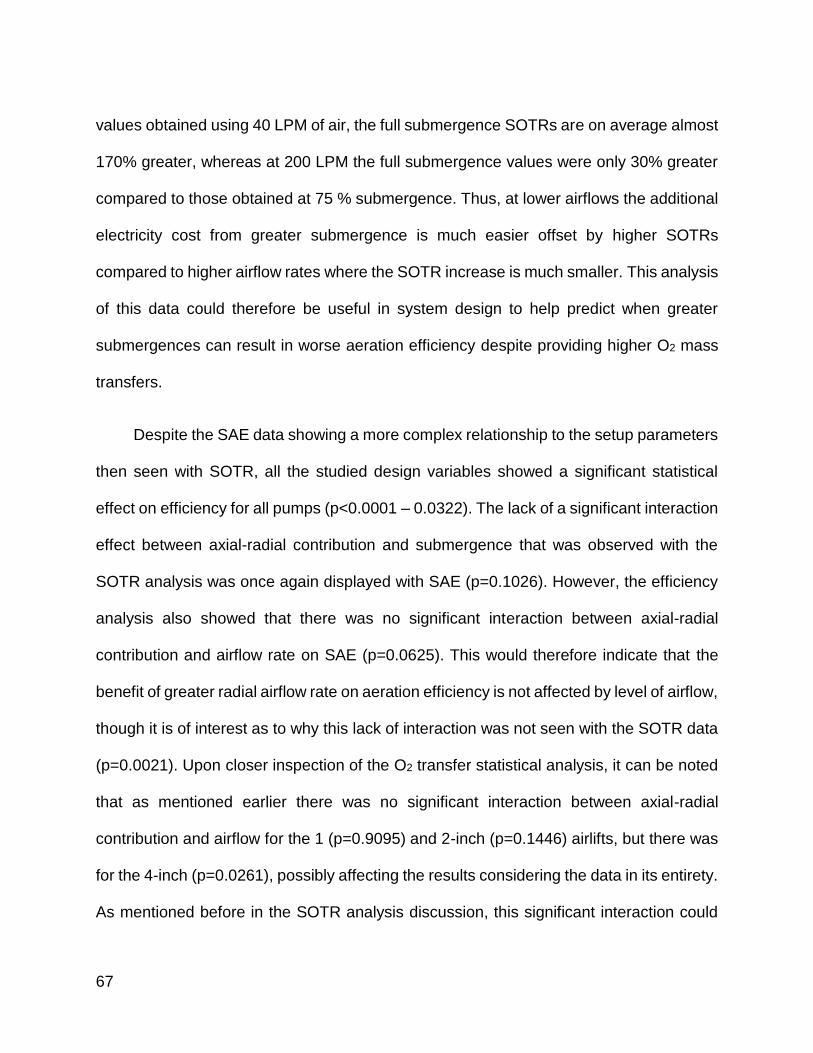
67
values obtained using 40 LPM of air, the full submergence SOTRs are on average almost
170% greater, whereas at 200 LPM the full submergence values were only 30% greater
compared to those obtained at 75 % submergence. Thus, at lower airflows the additional
electricity cost from greater submergence is much easier offset by higher SOTRs
compared to higher airflow rates where the SOTR increase is much smaller. This analysis
of this data could therefore be useful in system design to help predict when greater
submergences can result in worse aeration efficiency despite providing higher O2 mass
transfers.
Despite the SAE data showing a more complex relationship to the setup parameters
then seen with SOTR, all the studied design variables showed a significant statistical
effect on efficiency for all pumps (p<0.0001 – 0.0322). The lack of a significant interaction
effect between axial-radial contribution and submergence that was observed with the
SOTR analysis was once again displayed with SAE (p=0.1026). However, the efficiency
analysis also showed that there was no significant interaction between axial-radial
contribution and airflow rate on SAE (p=0.0625). This would therefore indicate that the
benefit of greater radial airflow rate on aeration efficiency is not affected by level of airflow,
though it is of interest as to why this lack of interaction was not seen with the SOTR data
(p=0.0021). Upon closer inspection of the O2 transfer statistical analysis, it can be noted
that as mentioned earlier there was no significant interaction between axial-radial
contribution and airflow for the 1 (p=0.9095) and 2-inch (p=0.1446) airlifts, but there was
for the 4-inch (p=0.0261), possibly affecting the results considering the data in its entirety.
As mentioned before in the SOTR analysis discussion, this significant interaction could
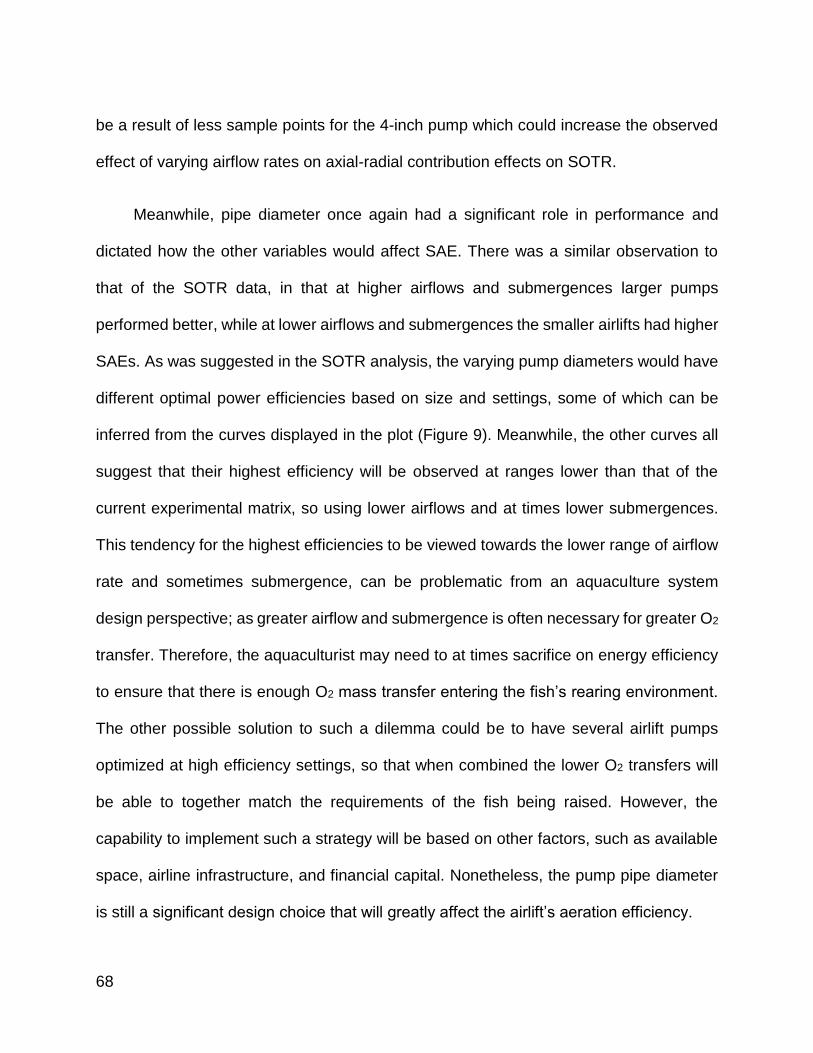
68
be a result of less sample points for the 4-inch pump which could increase the observed
effect of varying airflow rates on axial-radial contribution effects on SOTR.
Meanwhile, pipe diameter once again had a significant role in performance and
dictated how the other variables would affect SAE. There was a similar observation to
that of the SOTR data, in that at higher airflows and submergences larger pumps
performed better, while at lower airflows and submergences the smaller airlifts had higher
SAEs. As was suggested in the SOTR analysis, the varying pump diameters would have
different optimal power efficiencies based on size and settings, some of which can be
inferred from the curves displayed in the plot (Figure 9). Meanwhile, the other curves all
suggest that their highest efficiency will be observed at ranges lower than that of the
current experimental matrix, so using lower airflows and at times lower submergences.
This tendency for the highest efficiencies to be viewed towards the lower range of airflow
rate and sometimes submergence, can be problematic from an aquaculture system
design perspective; as greater airflow and submergence is often necessary for greater O2
transfer. Therefore, the aquaculturist may need to at times sacrifice on energy efficiency
to ensure that there is enough O2 mass transfer entering the fish’s rearing environment.
The other possible solution to such a dilemma could be to have several airlift pumps
optimized at high efficiency settings, so that when combined the lower O2 transfers will
be able to together match the requirements of the fish being raised. However, the
capability to implement such a strategy will be based on other factors, such as available
space, airline infrastructure, and financial capital. Nonetheless, the pump pipe diameter
is still a significant design choice that will greatly affect the airlift’s aeration efficiency.
69
Apart from having to choose the size of airlift that would be most efficient for aeration
at a specific range of settings, the aquaculturist would also need to decide whether such
a dual-injection airlift is the most practical choice for their system. In a comparison of
conventional aeration technology that is used for oxygenating catfish ponds, researchers
observed a SAE range of 0.7 – 3.0 kg O2 / hr * kW by these various tools (Boyd and
Ahmad, 1987). The results from the current study indicate that the dual-injection airlift is
more efficient, delivering over 5 kg O2 / hr * kW under certain tested settings, and
averaging 2.9 kg O2 / hr * kW for all the conditions observed. However, it should be noted
that these values were calculated assuming air blowers that are 100% efficient, which in
the field will not be the case; so, the lower blower efficiency will also decrease airlift pump
efficiency. Also, despite the conventional technologies mentioned being less energy
efficient, they can generate much greater O2 transfers to the ones observed from this
study, ranging from 0.1 to 23.2 kg O2 / hr (Boyd and Ahmad, 1987). Meanwhile, the
highest transfer observed by the dual injection airlifts was 0.11 kg O2 / hr, and the average
for all the settings was 0.03 kg O2 / hr. Although the plotted SOTR data indicates that at
higher radial airflow contributions, total airflow rates, submergences and pipe diameters
than those in the experimental matrix, the pumps will transfer more O2 (Figure 6), some
of these changes might then result in decreased power efficiency (Figure 8). For this
reason, a practical usage of this technology for aquaculture might require the application
of several airlifts, as they could all be functioning using a single air blower, while the sum
of their combined performance could possibly generate sufficient O2. Another factor that
is being ignored in this analysis relates to the pump having the dual function of aeration
and water flow. So apart from replacing less energy efficient aeration tools in a system,
70
the airlifts might also replace some centrifugal water pumps that would be used for water
turnover or transportation. This would eliminate additional energy consuming
technologies and provide more electricity to be used by blowers for more airlifts. Overall,
the studied dual-injection airlifts when implemented correctly have a good potential to
replace conventional technology being used in aquaculture by reducing electricity
consumption while providing the necessary O2 transfers.
3.5 Conclusion
The current study quantified the O2 transfers and efficiencies of the dual-injection
airlift pump, which by doing so illustrated the strengths and weaknesses that can be
encountered based on system design settings. In general, larger pipe size diameters,
greater airflow rates, higher radial airflow contributions and deeper submergences
provided better O2 transfers as is expected according to gas transfer physics (Reinemann
and Timmons, 1989; Loyless and Malone, 1998; Barrut et al., 2012a). The data,
especially for the 1-inch airlift pump, also suggests that greater airflow rates can
eventually contribute to a larger void fraction which can increase bubble coalescence and
therefore size in the pipe, possibly negating the positive effects of radial contribution on
O2 transfer. However, the possible presence of higher void fraction might also then
generate more slug-like flow patterns which can increase water flow and overcome
pumping issues encountered at low submergences. The issue of low submergences not
providing ample water flow resulted in missing data within the experimental matrix. The
results from the current study can indicate what the optimal operating ranges are for
different airlifts to generate O2 transfer results, which could help future studies in selecting
71
functional operating conditions to better map out the transfers at specific settings. Such
research, along with some of the curves generated in the plots from the current study,
can present the optimal aeration efficiencies from a power consumption perspective.
Overall, higher airflow rates showed lower aeration efficiencies, possibly from greater
bubble coalescence that would decrease available surface area for gas transfer. Higher
submergence also showed lower efficiency at some settings, which along with the airflow
rate data shows an opposing relationship on SOTR and SAE values. Users of these airlifts
will therefore need to remember that increasing settings for higher O2 transfers can lead
to worse power efficiency, so the design choices of every system will need to reflect their
individual requirements and constraints. The amount of O2 required as well as available
electricity to power air blowers or compressors will need to be considered before
implementing an airlift. However, the efficiency values are comparable to those of tools
being currently used for aeration (Boyd and Ahmad, 1987; Barrut et al., 2012a), and as
such demonstrate potential to be successfully implemented in aquaculture. To obtain
maximum savings on power from these pumps, the users may need to implement creative
solutions in their designs, such as installing more airlifts to have higher efficiency at lower
individual transfer rates and using them in place of any centrifugal water pumps to remove
additional power uptakes. By taking note of how the different setup parameters will affect
the O2 transfers and efficiencies, airlift pumps could be successfully installed in
aquaculture systems and save unnecessary electrical consumption for the user.
72
Chapter 4: Modelling Oxygen Transfer of Dual-Injection
Airlifts for Aquaculture Production
4.1 Introduction
A key component of maintaining optimum water quality in aquaculture sites is the
monitoring and controlling of DO in the water. O2 is an essential component for the
metabolism of fish but can be easily depleted under intensive feeding conditions due to
the low solubility of O2 in water (Benson and Krause, 1984). Exposure to hypoxic
conditions can have negative consequences on fish health, including death (Cooper and
Washburn, 1949), so maintaining DO levels that can satisfy the metabolic demands of
the fish is critical for maintaining their health. Some aquaculture operations can maintain
appropriate DO levels through natural water currents that will continually and naturally
supply the fish with new O2 (Page et al., 2005). Operations that lack such currents will
need to provide O2 using available aeration and oxygenation technology. However, the
use of such technology can provide additional operating costs, including maintenance
and electrical energy costs. Aquaculturists therefore need to select the equipment that
will provide the least amount of economic costs while maintaining the required DO levels.
Airlifts pumps are an efficient tool for providing water flow and mixing for aquaculture
operations (Martins et al., 2010). Although these pumps can also provide O2 transfer to
the water, they are in general less efficient at this function compared to other forms of
aeration equipment (Boyd and Ahmad, 1987). Ahmed and Badr (2012) have designed a
novel dual-injection airlift pump which has high water flow efficiency, but also the potential
73
to provide SAEs comparable to that of other aeration equipment. The efficiency of this
design is predicated on possessing two different modes of air injection. The axial mode
of injection releases larger air bubbles directly vertically up the pump for greater water
flows, while the radial mode of injection releases smaller bubbles horizontally into the pipe
of the pump to provide better mixing and gas transfer. A series of lab-bench trials testing
the O2 transfers and efficiencies of the pumps at different settings indicate that the airlifts
can efficiently oxygenate the water compared to other aeration equipment, but also that
the level of each setting can greatly impact the oxygenation potential (Chapter 3). In
general, higher O2 transfers were observed when using greater pump pipe diameters,
deeper submergences, higher airflow rates, and greater percentages of radial injection.
The influence of all these factors on the O2 transfer of the pump could be modelled to
better represent the potential of the airlift for oxygenation in aquaculture.
The O2 requirement of fish is directly related to their metabolic rate, which will
increase at higher temperatures and with greater weights, activity levels and feed
consumption rates of the animal (NRC, 2011). Finfish and shrimp consume an estimated
200 to 400 mg of O2 per kg of body weight each hour (Boyd, 1990), and it has been
estimated that around 220 g of O2 are required for each kg of feed consumed (Huguenin
and Colt, 1989). However, these values of O2 requirement are also affected by feed
composition and several other factors. It has been reported that the O2 requirement of
fish can be predicted with good accuracy using bioenergetics approaches, such as the
Fish-PrFEQ framework (Cho, 1992; Cho and Bureau,1998; Bureau et al., 2002; 2003).
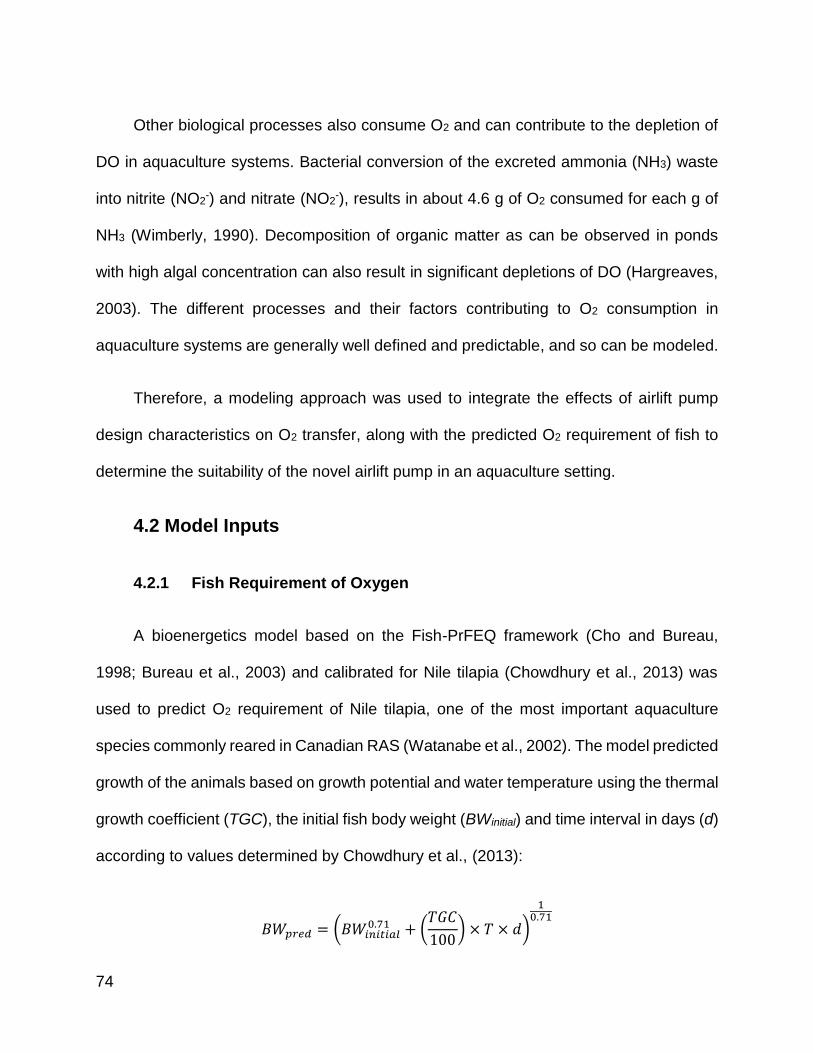
74
Other biological processes also consume O2 and can contribute to the depletion of
DO in aquaculture systems. Bacterial conversion of the excreted ammonia (NH3) waste
into nitrite (NO2-) and nitrate (NO2
-), results in about 4.6 g of O2 consumed for each g of
NH3 (Wimberly, 1990). Decomposition of organic matter as can be observed in ponds
with high algal concentration can also result in significant depletions of DO (Hargreaves,
2003). The different processes and their factors contributing to O2 consumption in
aquaculture systems are generally well defined and predictable, and so can be modeled.
Therefore, a modeling approach was used to integrate the effects of airlift pump
design characteristics on O2 transfer, along with the predicted O2 requirement of fish to
determine the suitability of the novel airlift pump in an aquaculture setting.
4.2 Model Inputs
4.2.1 Fish Requirement of Oxygen
A bioenergetics model based on the Fish-PrFEQ framework (Cho and Bureau,
1998; Bureau et al., 2003) and calibrated for Nile tilapia (Chowdhury et al., 2013) was
used to predict O2 requirement of Nile tilapia, one of the most important aquaculture
species commonly reared in Canadian RAS (Watanabe et al., 2002). The model predicted
growth of the animals based on growth potential and water temperature using the thermal
growth coefficient (TGC), the initial fish body weight (BWinitial) and time interval in days (d)
according to values determined by Chowdhury et al., (2013):
𝐵𝑊𝑝𝑟𝑒𝑑 = (𝐵𝑊𝑖𝑛𝑖𝑡𝑖𝑎𝑙0.71 + (
𝑇𝐺𝐶
100) × 𝑇 × 𝑑)
10.71
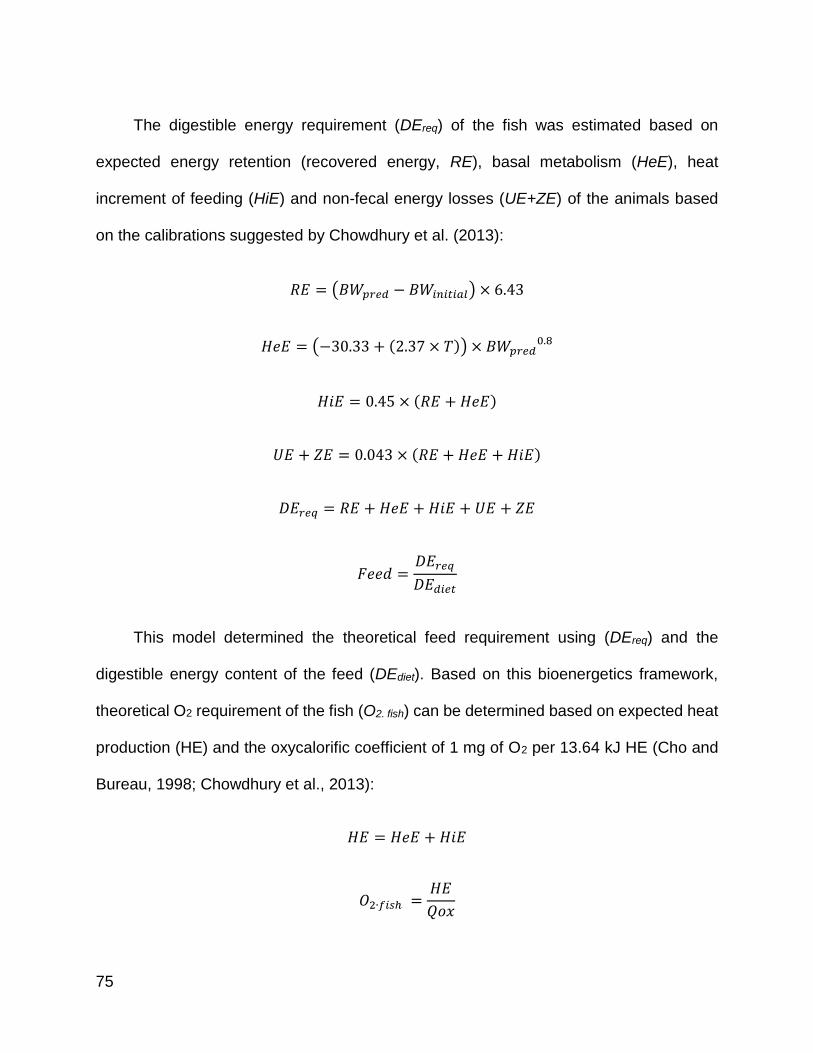
75
The digestible energy requirement (DEreq) of the fish was estimated based on
expected energy retention (recovered energy, RE), basal metabolism (HeE), heat
increment of feeding (HiE) and non-fecal energy losses (UE+ZE) of the animals based
on the calibrations suggested by Chowdhury et al. (2013):
𝑅𝐸 = (𝐵𝑊𝑝𝑟𝑒𝑑 − 𝐵𝑊𝑖𝑛𝑖𝑡𝑖𝑎𝑙) × 6.43
𝐻𝑒𝐸 = (−30.33 + (2.37 × 𝑇)) × 𝐵𝑊𝑝𝑟𝑒𝑑0.8
𝐻𝑖𝐸 = 0.45 × (𝑅𝐸 + 𝐻𝑒𝐸)
𝑈𝐸 + 𝑍𝐸 = 0.043 × (𝑅𝐸 + 𝐻𝑒𝐸 + 𝐻𝑖𝐸)
𝐷𝐸𝑟𝑒𝑞 = 𝑅𝐸 + 𝐻𝑒𝐸 + 𝐻𝑖𝐸 + 𝑈𝐸 + 𝑍𝐸
𝐹𝑒𝑒𝑑 =𝐷𝐸𝑟𝑒𝑞
𝐷𝐸𝑑𝑖𝑒𝑡
This model determined the theoretical feed requirement using (DEreq) and the
digestible energy content of the feed (DEdiet). Based on this bioenergetics framework,
theoretical O2 requirement of the fish (O2. fish) can be determined based on expected heat
production (HE) and the oxycalorific coefficient of 1 mg of O2 per 13.64 kJ HE (Cho and
Bureau, 1998; Chowdhury et al., 2013):
𝐻𝐸 = 𝐻𝑒𝐸 + 𝐻𝑖𝐸
𝑂2∙𝑓𝑖𝑠ℎ =𝐻𝐸
𝑄𝑜𝑥
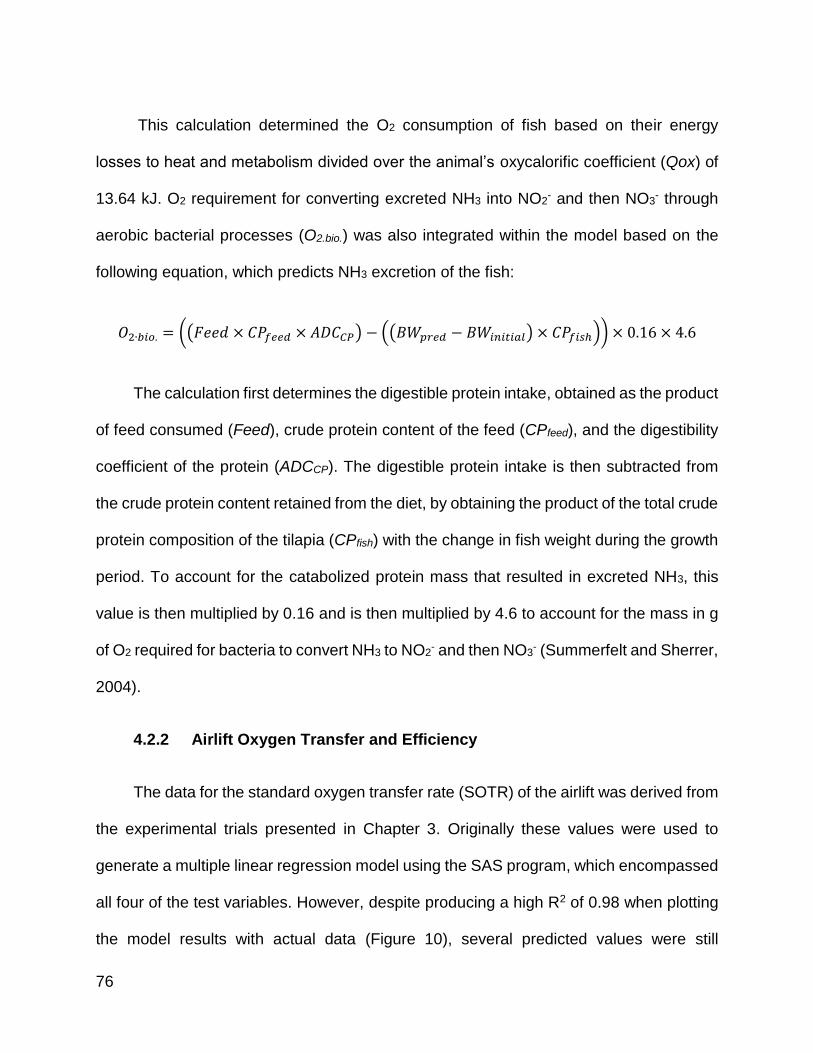
76
This calculation determined the O2 consumption of fish based on their energy
losses to heat and metabolism divided over the animal’s oxycalorific coefficient (Qox) of
13.64 kJ. O2 requirement for converting excreted NH3 into NO2- and then NO3
- through
aerobic bacterial processes (O2.bio.) was also integrated within the model based on the
following equation, which predicts NH3 excretion of the fish:
𝑂2∙𝑏𝑖𝑜. = ((𝐹𝑒𝑒𝑑 × 𝐶𝑃𝑓𝑒𝑒𝑑 × 𝐴𝐷𝐶𝐶𝑃) − ((𝐵𝑊𝑝𝑟𝑒𝑑 − 𝐵𝑊𝑖𝑛𝑖𝑡𝑖𝑎𝑙) × 𝐶𝑃𝑓𝑖𝑠ℎ)) × 0.16 × 4.6
The calculation first determines the digestible protein intake, obtained as the product
of feed consumed (Feed), crude protein content of the feed (CPfeed), and the digestibility
coefficient of the protein (ADCCP). The digestible protein intake is then subtracted from
the crude protein content retained from the diet, by obtaining the product of the total crude
protein composition of the tilapia (CPfish) with the change in fish weight during the growth
period. To account for the catabolized protein mass that resulted in excreted NH3, this
value is then multiplied by 0.16 and is then multiplied by 4.6 to account for the mass in g
of O2 required for bacteria to convert NH3 to NO2- and then NO3
- (Summerfelt and Sherrer,
2004).
4.2.2 Airlift Oxygen Transfer and Efficiency
The data for the standard oxygen transfer rate (SOTR) of the airlift was derived from
the experimental trials presented in Chapter 3. Originally these values were used to
generate a multiple linear regression model using the SAS program, which encompassed
all four of the test variables. However, despite producing a high R2 of 0.98 when plotting
the model results with actual data (Figure 10), several predicted values were still
77
significantly different from the model. For example, the experimental SOTR values for the
1-inch pump at 200 LPM airflow and 0.5 submergence were double of those predicted in
the model. This prompted the need for a more accurate SOTR prediction method that
would not create such great outliers. To resolve this issue, the model was segmented into
smaller sub-models, each one pertaining to a value of a specific test variable. The best
variable to choose for these sub-models was likely size, based on visual observations of
the SOTR curves developed in the experimental chapter (Figure 7).
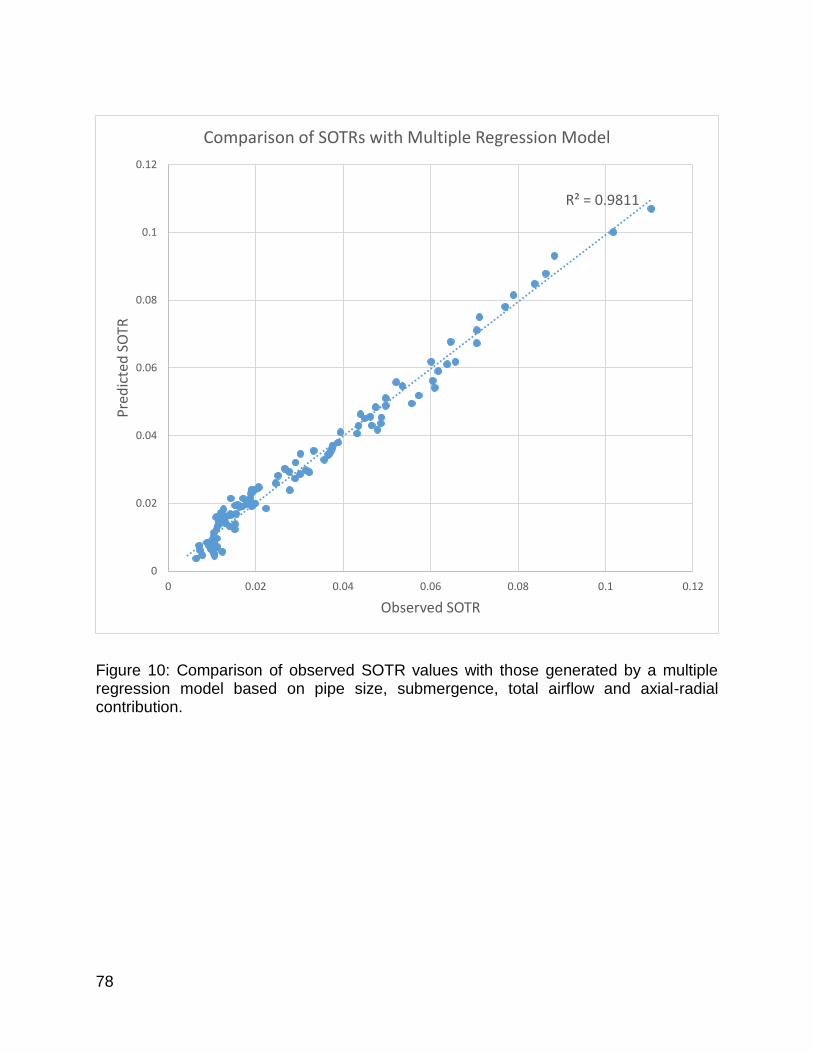
78
Figure 10: Comparison of observed SOTR values with those generated by a multiple regression model based on pipe size, submergence, total airflow and axial-radial contribution.
R² = 0.9811
0
0.02
0.04
0.06
0.08
0.1
0.12
0 0.02 0.04 0.06 0.08 0.1 0.12
Pre
dic
ted
SO
TR
Observed SOTR
Comparison of SOTRs with Multiple Regression Model
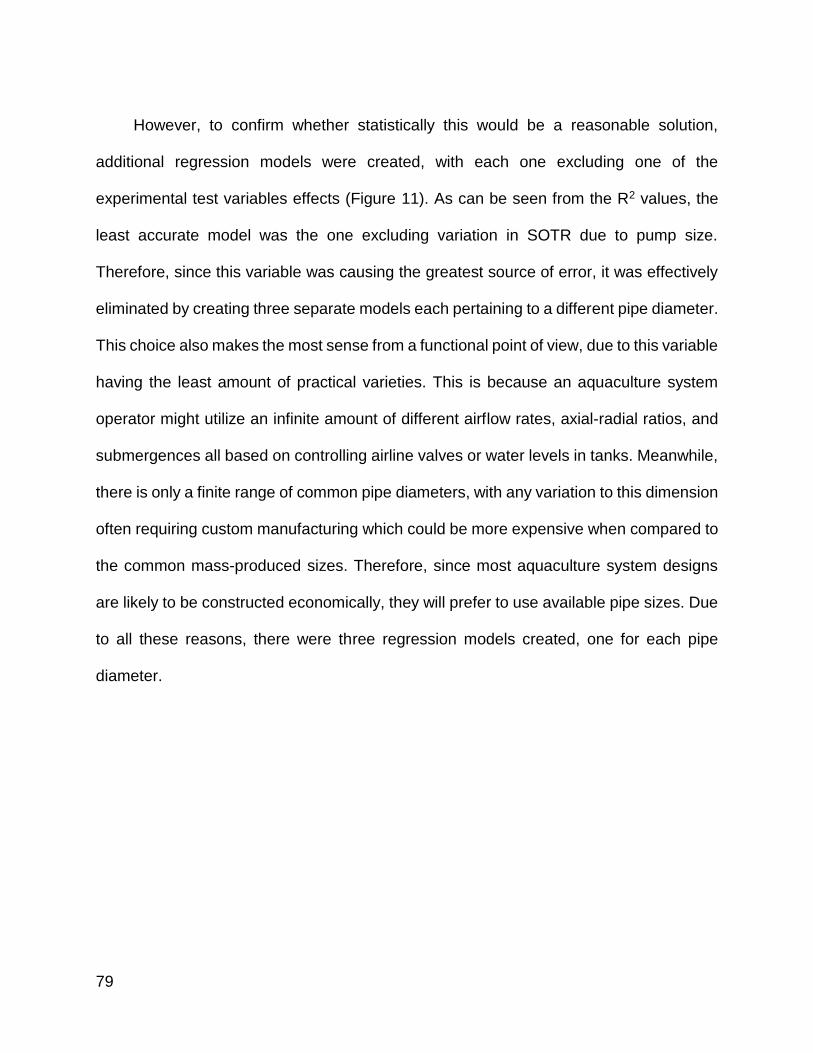
79
However, to confirm whether statistically this would be a reasonable solution,
additional regression models were created, with each one excluding one of the
experimental test variables effects (Figure 11). As can be seen from the R2 values, the
least accurate model was the one excluding variation in SOTR due to pump size.
Therefore, since this variable was causing the greatest source of error, it was effectively
eliminated by creating three separate models each pertaining to a different pipe diameter.
This choice also makes the most sense from a functional point of view, due to this variable
having the least amount of practical varieties. This is because an aquaculture system
operator might utilize an infinite amount of different airflow rates, axial-radial ratios, and
submergences all based on controlling airline valves or water levels in tanks. Meanwhile,
there is only a finite range of common pipe diameters, with any variation to this dimension
often requiring custom manufacturing which could be more expensive when compared to
the common mass-produced sizes. Therefore, since most aquaculture system designs
are likely to be constructed economically, they will prefer to use available pipe sizes. Due
to all these reasons, there were three regression models created, one for each pipe
diameter.
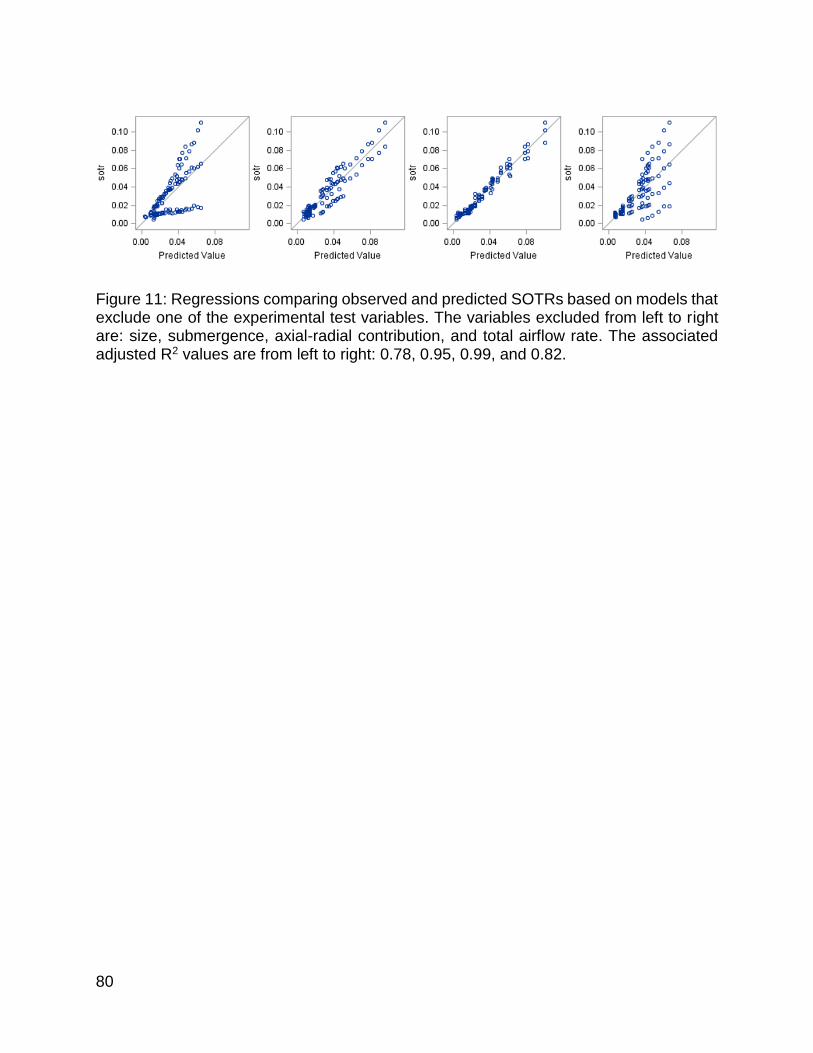
80
Figure 11: Regressions comparing observed and predicted SOTRs based on models that exclude one of the experimental test variables. The variables excluded from left to right are: size, submergence, axial-radial contribution, and total airflow rate. The associated adjusted R2 values are from left to right: 0.78, 0.95, 0.99, and 0.82.
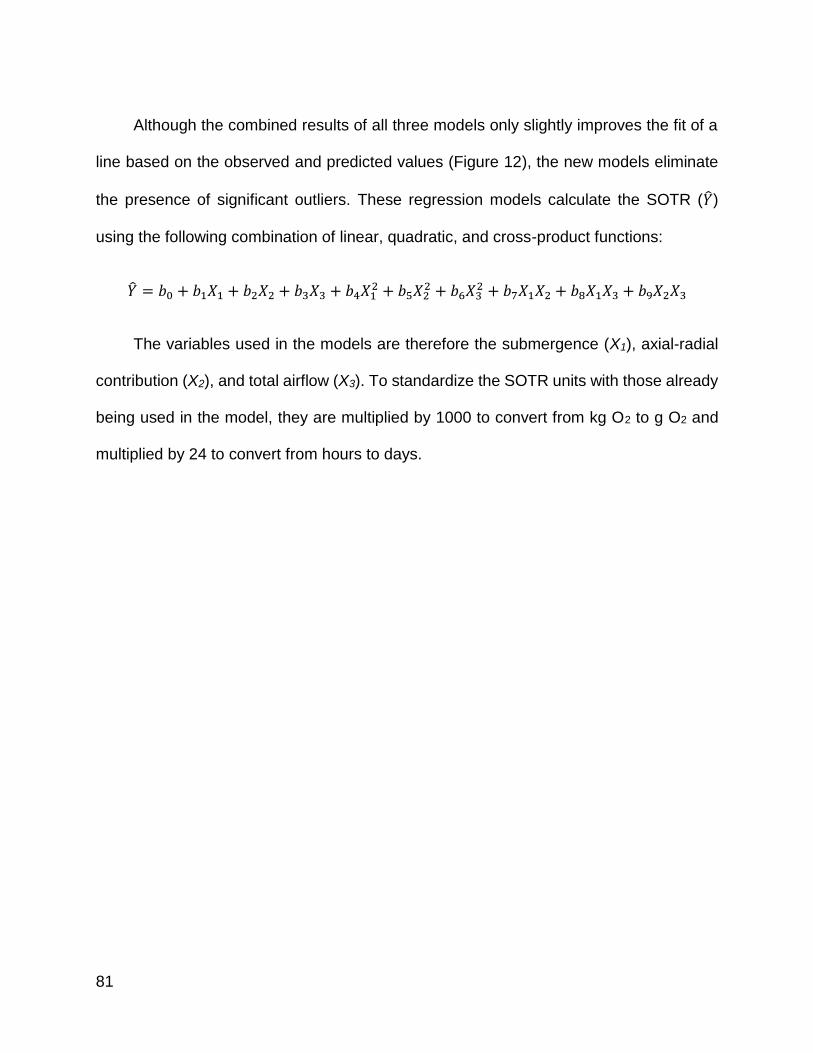
81
Although the combined results of all three models only slightly improves the fit of a
line based on the observed and predicted values (Figure 12), the new models eliminate
the presence of significant outliers. These regression models calculate the SOTR (�̂�)
using the following combination of linear, quadratic, and cross-product functions:
�̂� = 𝑏0 + 𝑏1𝑋1 + 𝑏2𝑋2 + 𝑏3𝑋3 + 𝑏4𝑋12 + 𝑏5𝑋2
2 + 𝑏6𝑋32 + 𝑏7𝑋1𝑋2 + 𝑏8𝑋1𝑋3 + 𝑏9𝑋2𝑋3
The variables used in the models are therefore the submergence (X1), axial-radial
contribution (X2), and total airflow (X3). To standardize the SOTR units with those already
being used in the model, they are multiplied by 1000 to convert from kg O2 to g O2 and
multiplied by 24 to convert from hours to days.
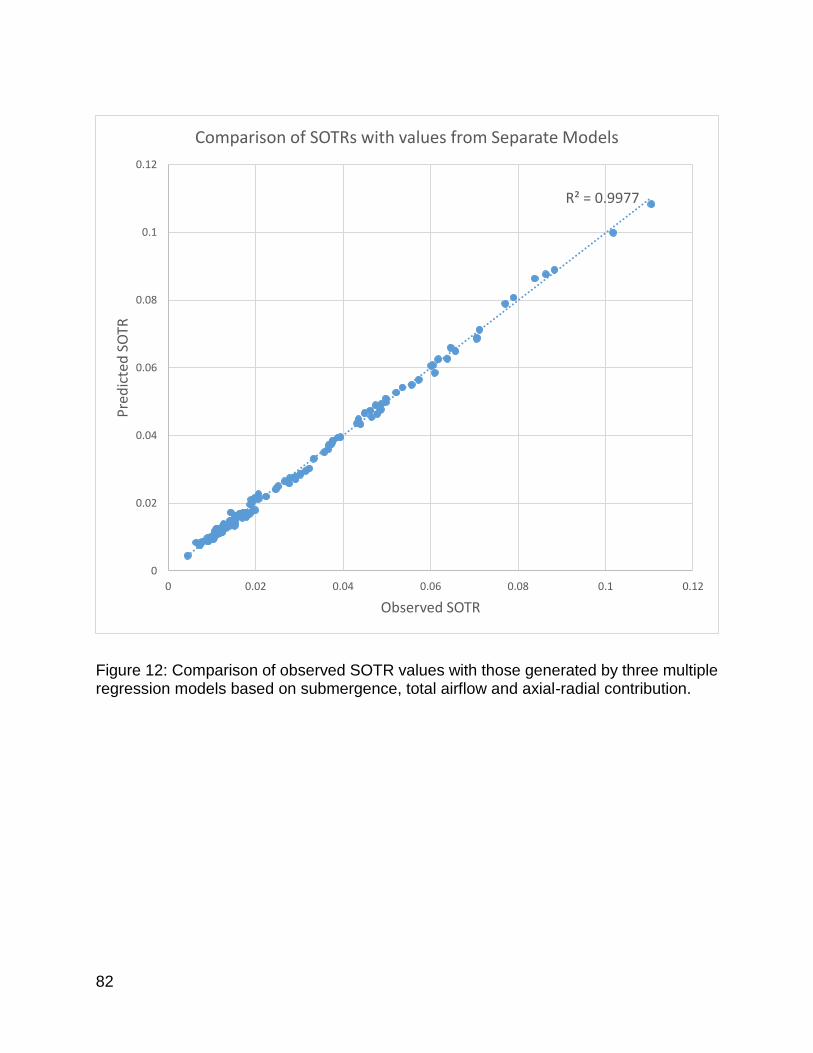
82
Figure 12: Comparison of observed SOTR values with those generated by three multiple regression models based on submergence, total airflow and axial-radial contribution.
R² = 0.9977
0
0.02
0.04
0.06
0.08
0.1
0.12
0 0.02 0.04 0.06 0.08 0.1 0.12
Pre
dic
ted
SO
TR
Observed SOTR
Comparison of SOTRs with values from Separate Models
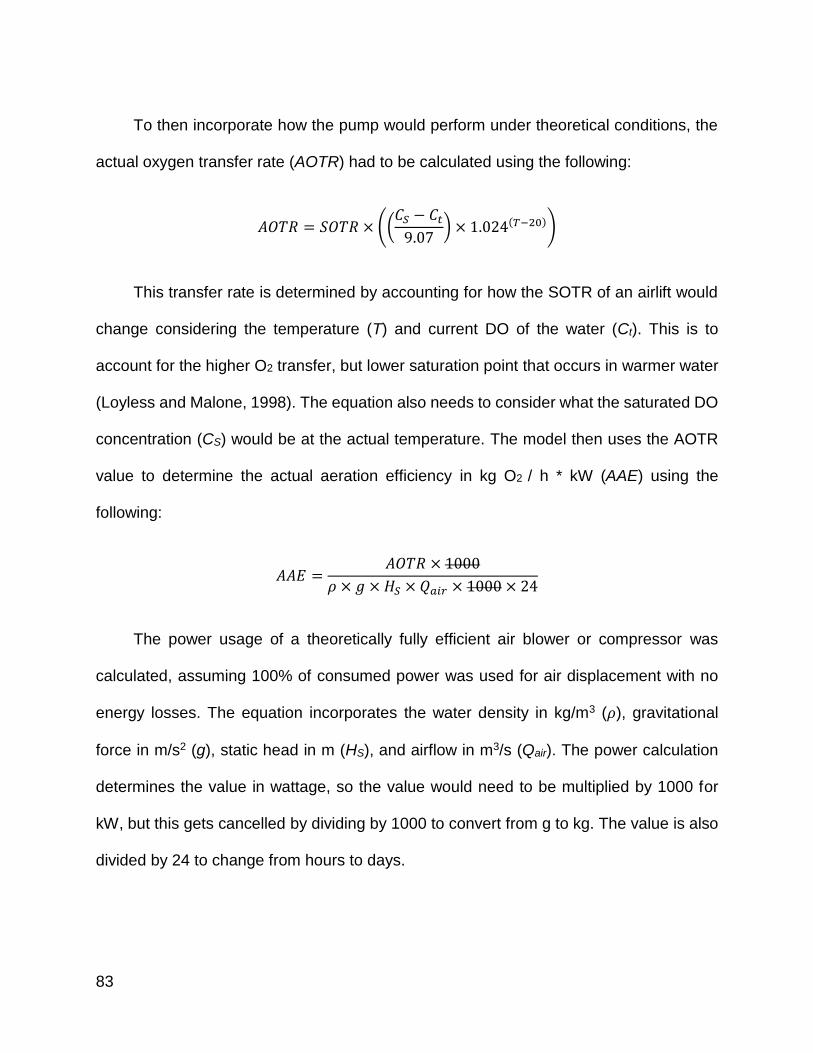
83
To then incorporate how the pump would perform under theoretical conditions, the
actual oxygen transfer rate (AOTR) had to be calculated using the following:
𝐴𝑂𝑇𝑅 = 𝑆𝑂𝑇𝑅 × ((𝐶𝑆 − 𝐶𝑡
9.07) × 1.024(𝑇−20))
This transfer rate is determined by accounting for how the SOTR of an airlift would
change considering the temperature (T) and current DO of the water (Ct). This is to
account for the higher O2 transfer, but lower saturation point that occurs in warmer water
(Loyless and Malone, 1998). The equation also needs to consider what the saturated DO
concentration (CS) would be at the actual temperature. The model then uses the AOTR
value to determine the actual aeration efficiency in kg O2 / h * kW (AAE) using the
following:
𝐴𝐴𝐸 =𝐴𝑂𝑇𝑅 × 1000
𝜌 × 𝑔 × 𝐻𝑆 × 𝑄𝑎𝑖𝑟 × 1000 × 24
The power usage of a theoretically fully efficient air blower or compressor was
calculated, assuming 100% of consumed power was used for air displacement with no
energy losses. The equation incorporates the water density in kg/m3 (𝜌), gravitational
force in m/s2 (g), static head in m (HS), and airflow in m3/s (Qair). The power calculation
determines the value in wattage, so the value would need to be multiplied by 1000 for
kW, but this gets cancelled by dividing by 1000 to convert from g to kg. The value is also
divided by 24 to change from hours to days.
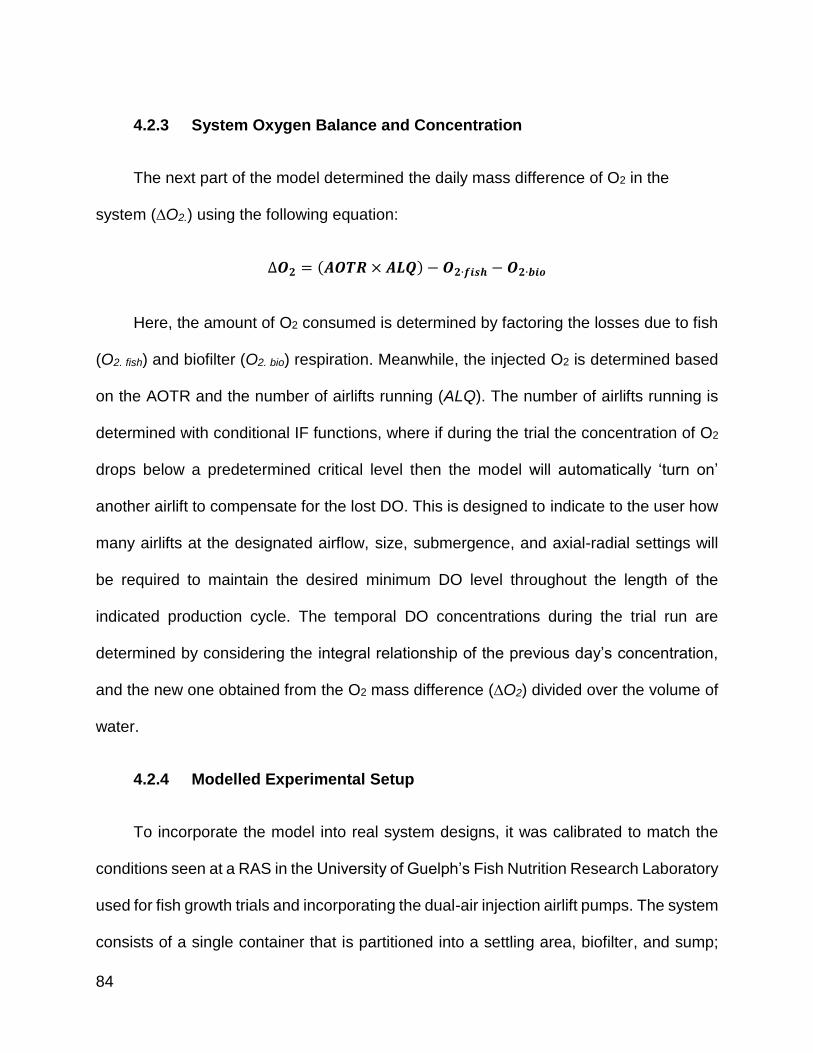
84
4.2.3 System Oxygen Balance and Concentration
The next part of the model determined the daily mass difference of O2 in the
system (∆O2.) using the following equation:
∆𝑶𝟐 = (𝑨𝑶𝑻𝑹 × 𝑨𝑳𝑸) − 𝑶𝟐∙𝒇𝒊𝒔𝒉 − 𝑶𝟐∙𝒃𝒊𝒐
Here, the amount of O2 consumed is determined by factoring the losses due to fish
(O2. fish) and biofilter (O2. bio) respiration. Meanwhile, the injected O2 is determined based
on the AOTR and the number of airlifts running (ALQ). The number of airlifts running is
determined with conditional IF functions, where if during the trial the concentration of O2
drops below a predetermined critical level then the model will automatically ‘turn on’
another airlift to compensate for the lost DO. This is designed to indicate to the user how
many airlifts at the designated airflow, size, submergence, and axial-radial settings will
be required to maintain the desired minimum DO level throughout the length of the
indicated production cycle. The temporal DO concentrations during the trial run are
determined by considering the integral relationship of the previous day’s concentration,
and the new one obtained from the O2 mass difference (∆O2) divided over the volume of
water.
4.2.4 Modelled Experimental Setup
To incorporate the model into real system designs, it was calibrated to match the
conditions seen at a RAS in the University of Guelph’s Fish Nutrition Research Laboratory
used for fish growth trials and incorporating the dual-air injection airlift pumps. The system
consists of a single container that is partitioned into a settling area, biofilter, and sump;
85
which then provides water into two sets of a dozen fish tanks each, that then drains back
into the filter. One of the tank sets is provided water from a centrifugal motorized pump,
while its O2 is replenished using air stones releasing air into each tank. The second set
of tanks has the water supplied using airlift pumps, with each pump being used to provide
water into two different tanks for a total of six airlifts used. The airflow supplied into these
airlifts is also used as a method to dissolve O2 into the tanks.
Each tank has a water holding volume of 60 L at a regulated temperature between
26 to 28 °C for trials using Nile tilapia. The saturated DO level at the average of this
temperature range is 8 mg O2/L. When starting feed trials, the system is first run without
fish for a few weeks so that a bacterial colony can develop in the biofilter giving plenty of
time for the water to saturate with DO. Therefore, the model water was also set at an
initial concentration of 8 mg O2/L. The model simulation was set for 56 days as that is the
minimum length of a feeding trial conducted in the lab. The model fish were given the
same initial average weight as those currently in the lab at 83 g, which were distributed
at 10 fish a tank to not exceed the tank’s carrying capacity of the fish at the end of the
trial, given how much they would grow with the bioenergetics model. The crude protein
content of the feed was 30 % (Chowdhury et al., 2013), while the apparent digestibility
coefficient of the protein was at 0.9 and the DEdiet was estimated at 13.9 kJ/g.
The airlift settings of the model were set to the same submergence, airflow rate, and
axial-radial airflow contribution observed in the laboratory system. The static head was at
0.4572 m in height, while the total submergence ratio was at 0.41. The total airflow rate
going to each airlift was 37 LPM while the axial-radial contribution ratio was 50:50. The
86
model was run starting with just one airlift to see if that would be enough to carry the
tank’s biomass throughout the feeding trial.
4.3 Model Output
The output generated from the model indicated that one airlift would be sufficient to
carry the biomass of the tank for the duration of the feeding trial, seeing as the dissolved
concentration does not drop below the critical level of 5 mg/L (Figure 13a). It can be noted
from the results that the amount of O2 being provided by the airlift is nearly matching the
sum of O2 consumed by the fish and biofilter, but not exceeding it. The resulting DO
concentration decline may seem counterintuitive as the SOTR value for the airlift at the
model settings was 174.96 g O2/day, which is well over the combined amount of O2 being
taken up by the fish and biofilter, estimated to only reach 43.4 g O2/day at the end of the
56-day trial. However, when calculating the AOTR, the SOTR gets adjusted to account
for the temperature and current DO concentration in the water. When the DO
concentration is closer to saturation, the O2 transfer coefficient of the airlift pump
decreases, explaining the low AOTR at the beginning of the test run. Although the
decreased DO concentration after the first day will result in a higher O2 transfer coefficient
of the airlift pump, at the modelled experimental settings the pump cannot fully
compensate for the lost O2, as the fish are continually eating and consuming greater
amounts of O2. If the model had begun at a lower DO concentration, the airlift pump at
the current settings would have been transferring greater amounts of O2, until the fish and
bacterial demand was too great for the airlift to consistently maintain (Figure 13b)
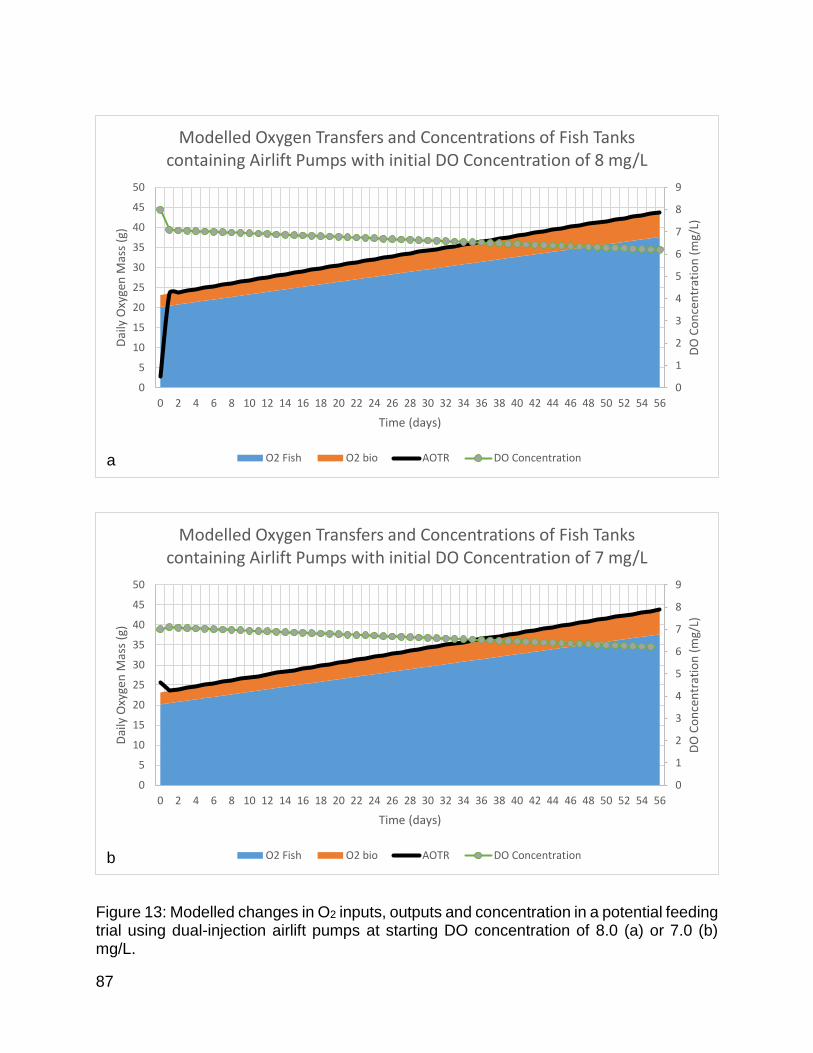
87
Figure 13: Modelled changes in O2 inputs, outputs and concentration in a potential feeding trial using dual-injection airlift pumps at starting DO concentration of 8.0 (a) or 7.0 (b) mg/L.
0
1
2
3
4
5
6
7
8
9
0
5
10
15
20
25
30
35
40
45
50
0 2 4 6 8 10 12 14 16 18 20 22 24 26 28 30 32 34 36 38 40 42 44 46 48 50 52 54 56
DO
Co
nce
ntr
atio
n (
mg/
L)
Dai
ly O
xyge
n M
ass
(g)
Time (days)
Modelled Oxygen Transfers and Concentrations of Fish Tanks containing Airlift Pumps with initial DO Concentration of 8 mg/L
O2 Fish O2 bio AOTR DO Concentration
0
1
2
3
4
5
6
7
8
9
0
5
10
15
20
25
30
35
40
45
50
0 2 4 6 8 10 12 14 16 18 20 22 24 26 28 30 32 34 36 38 40 42 44 46 48 50 52 54 56
DO
Co
nce
ntr
atio
n (
mg/
L)
Dai
ly O
xyge
n M
ass
(g)
Time (days)
Modelled Oxygen Transfers and Concentrations of Fish Tanks containing Airlift Pumps with initial DO Concentration of 7 mg/L
O2 Fish O2 bio AOTR DO Concentration
a
b
88
4.4 Discussion
The current model provides a prediction of the oxygenation capability of the novel
dual-injection airlift pump for maintaining DO levels in an aquaculture setting. The model
accomplishes this by combining the effects of certain design characteristics on the O2
transfer of the airlift pump along with the estimated O2 requirement for maintaining the
metabolic function of Nile tilapia and the bacterial conversion of NH3 to NO2- and then
NO3-. The resulting model output indicates that the novel airlift can maintain the DO levels
required by the fish and bacteria for the modelled time-period. The output also indicates
that due to the increased feeding rates of the tilapia over the course of the modelled run,
the DO concentration will be continually declining, and likely eventually surpass the Pcrit
of the fish. However, the equations required for generating this model are affected by
several factors pertaining to system design and fish bioenergetics, therefore changing
any of these values could greatly affect the model results.
Compared to the airlift pump settings that had been previously tested (Chapter 3),
the pump setup in the Fish Nutrition Research Laboratory included design characteristics
that would most likely result in lower O2 transfers. The lab-bench trials were conducted
using submergence percentages of 50 to 100 %, whereas the submergence in the model
was at 0.41 submergence. The air flow rates used in the lab-bench trial ranged from 40
to 200 LPM, while the modelled airflow was set at 37 LPM. Although the modelled design
characteristic values are only slightly lower below the tested range, they still constitute
the lower range of O2 transfer performance and oxygenation efficiency (Figure 7, 9). Small
pipe diameters also reduce the oxygenation performance and efficiency, however, at the
89
modelled low airflow and submergence settings the 1-inch pump that was used would
provide better O2 transfers then the 2 and 4-inch pumps that had also been tested.
Overall, the model output predicts that even at design characteristic values lower than
those in the lab-bench experiment range, the novel airlift pumps can provide sufficient O2
transfer for a fish feeding trial using RAS technology.
The effectiveness of the airlift pump will also depend on the target DO
concentrations it needs to maintain considering the O2 consumption by the fish and
nitrogen fixing bacteria. Overall, the modelled respiration demands of the tilapia caused
a continuous decline in DO concentration. However, the model did also predict the ability
of the airlift pump to increase DO concentration levels at the beginning of a trial (Figure
13b), likely from a combination of low O2 demand from smaller fish and a lower initial DO
concentration that would result in a higher O2 transfer coefficient. Therefore, at certain
airlift pump settings it might be possible to maintain DO concentrations for longer periods
of time, though this would require determining the fish biomass carrying capacity of an
airlift when subject to certain design parameters. The fish biomass would increase based
on the quantity, size, and expected growth rate of the fish, which would result in higher
O2 demands and therefore require higher O2 transfer by the airlift pump.
It is also important to note some limitations that the predictions may contain when
applying the model values to aquaculture systems. For example, the model assumes that
all O2 additions and depletions are taking place in one body of water, which contains both
the fish and the airlift pump(s). However, many systems that circulate water will utilize
additional containers for treating the water, including solid waste settling areas and NH3
90
treating biofilters. Therefore, the DO concentration at different components of such an
integrated system can be different, which would then affect the O2 transfer coefficient of
the airlift pump. Given that the outlet to inlet water pathways can be interrupted with
several intermediary components that can affect DO concentration, it might be useful to
study the O2 transfer that takes place directly in the airlift between the inlet to outlet water.
However, measuring solely the difference between inlet and outlet DO would not be able
to determine the SOTR that the airlift could provide to the water body, as it would not
account for the effects of water flow. For example, if an airlift pump is circulating water
through a tank at a higher rate, well-oxygenated water would pass through the inlet faster,
decreasing the DO difference between the inlet and outlet water which could incorrectly
suggest that the O2 transfer is less efficient at that setting. Therefore, the measurements
would also need to account for the water flow and diffusion rate within the tank to
accurately predict SOTR. However, the SOTR could still be affected by other design
parameters, such as how lift and submergence would affect the mixing of atmospheric air
with the outflow water as it leaves the pump. For this reason, the SOTR values from the
current study (Chapter 3) were obtained by simply tracking the inlet DO, as it would factor
in all the mentioned effects that would be seen on the tank DO level at different airlift
settings. However, if future studies or analyses could account for all these additional
factors, then that would improve the application potential of the model in aquaculture
systems with different water flow setups.
91
4.5 Conclusion
Overall, the current model can be used to predict the O2 concentration change of
aquaculture systems using the dual-injection airlift, albeit certain factors must be
considered to determine the most accurate results. The design characteristics of the airlift
in terms of axial to radial airflow distribution, pump pipe diameter, submergence
percentage, and total airflow rate will all influence the capability of the airlift pump to
oxygenate the water. However, the O2 transfer coefficient will decrease in water
approaching saturation, resulting in lower AOTR values. Certain qualities of the fish such
as feeding rate, quantity and size will impact the decline of DO in the water, both for
sustaining O2 requirements of fish and nitrogen-fixing bacteria. The amount of digestible
protein in the diet of the fish will also impact the amount of DO required for the nitrogen-
fixing bacteria.
The model output suggests that the novel airlift pump design could maintain
necessary DO levels required in aquaculture. However, the DO concentration would
generally decrease over time due to the higher O2 demands of the fish as they grow.
Nonetheless, it is possible for airlifts to maintain required DO levels over longer time-
periods though it will depend on available pump setup and O2 consumption of the fish
over time. Determining the setup requirements to maintain high and constant DO levels
can help aquaculture systems plan their system design to ensure sufficient O2 for fish
metabolism.
92
Although this model can be a useful tool for determining whether certain airlift setups
can generate enough O2 transfer to meet the metabolic requirements of fish in an
aquaculture system, further research should be carried out to increase the scope and
accuracy of the predicted results. By integrating the O2 transfer component with other
pump effects such as water flow and diffusion, the model can predict additional water
quality variables, resulting in a more useful tool for planning dual-injection airlift pump
integration in aquaculture systems.
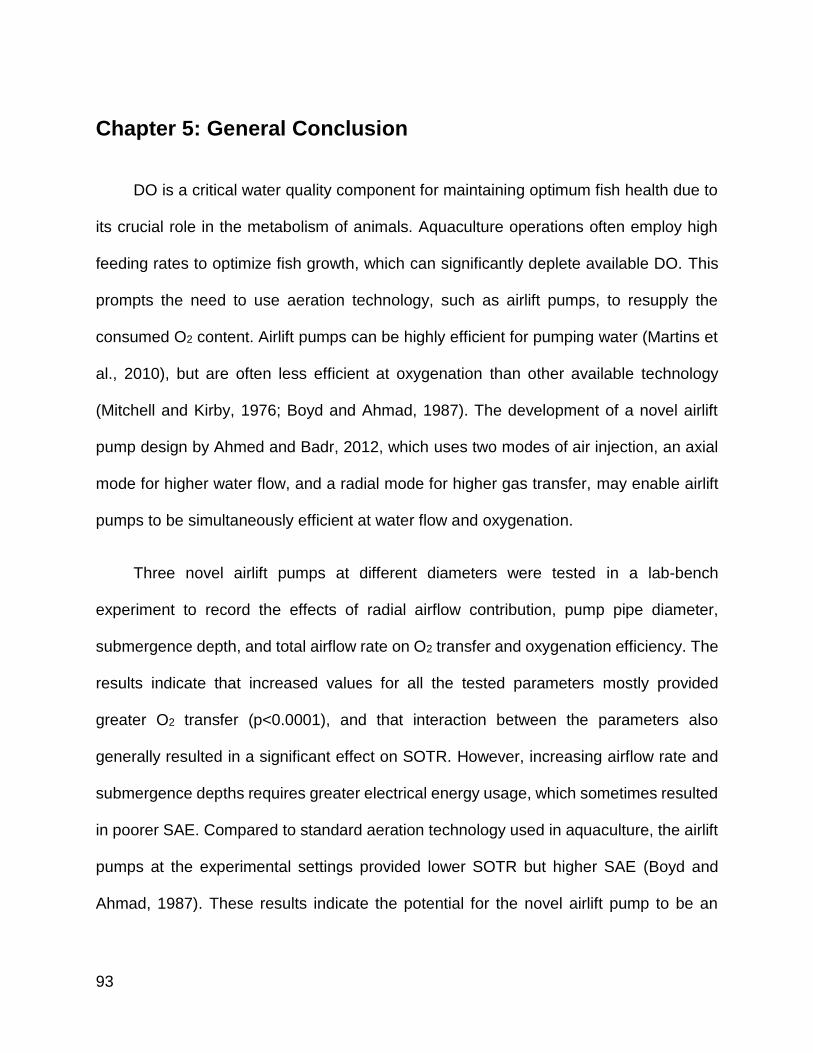
93
Chapter 5: General Conclusion
DO is a critical water quality component for maintaining optimum fish health due to
its crucial role in the metabolism of animals. Aquaculture operations often employ high
feeding rates to optimize fish growth, which can significantly deplete available DO. This
prompts the need to use aeration technology, such as airlift pumps, to resupply the
consumed O2 content. Airlift pumps can be highly efficient for pumping water (Martins et
al., 2010), but are often less efficient at oxygenation than other available technology
(Mitchell and Kirby, 1976; Boyd and Ahmad, 1987). The development of a novel airlift
pump design by Ahmed and Badr, 2012, which uses two modes of air injection, an axial
mode for higher water flow, and a radial mode for higher gas transfer, may enable airlift
pumps to be simultaneously efficient at water flow and oxygenation.
Three novel airlift pumps at different diameters were tested in a lab-bench
experiment to record the effects of radial airflow contribution, pump pipe diameter,
submergence depth, and total airflow rate on O2 transfer and oxygenation efficiency. The
results indicate that increased values for all the tested parameters mostly provided
greater O2 transfer (p<0.0001), and that interaction between the parameters also
generally resulted in a significant effect on SOTR. However, increasing airflow rate and
submergence depths requires greater electrical energy usage, which sometimes resulted
in poorer SAE. Compared to standard aeration technology used in aquaculture, the airlift
pumps at the experimental settings provided lower SOTR but higher SAE (Boyd and
Ahmad, 1987). These results indicate the potential for the novel airlift pump to be an
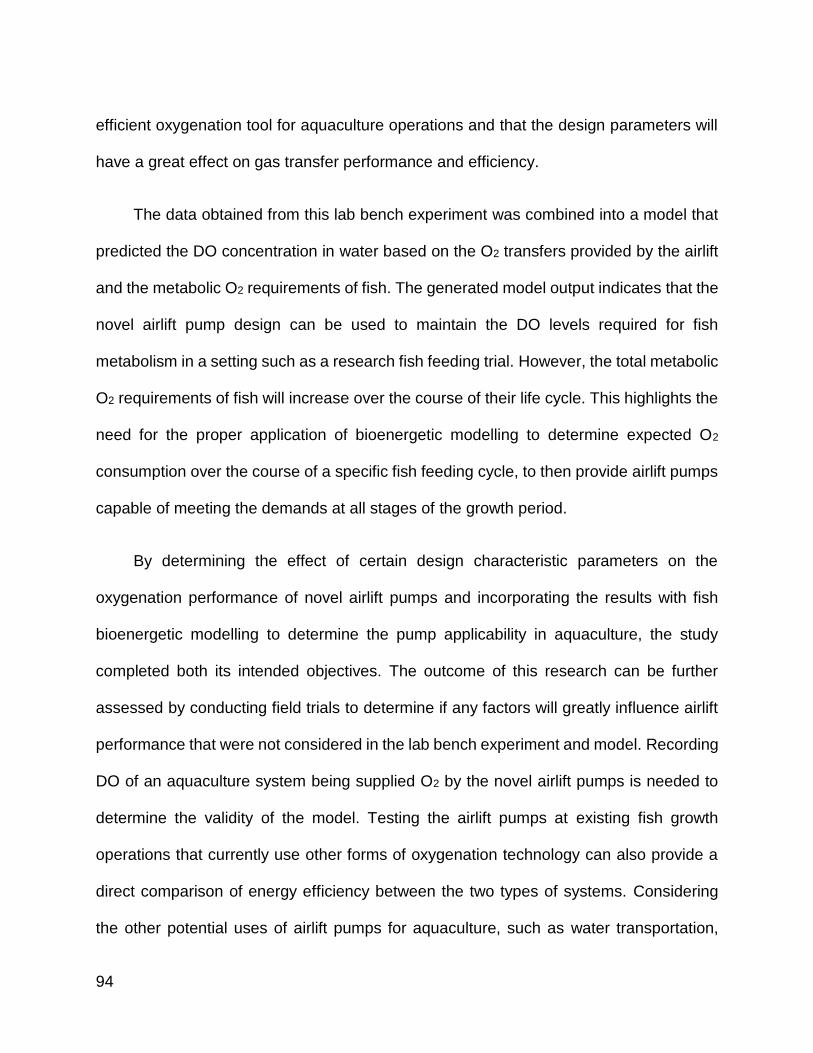
94
efficient oxygenation tool for aquaculture operations and that the design parameters will
have a great effect on gas transfer performance and efficiency.
The data obtained from this lab bench experiment was combined into a model that
predicted the DO concentration in water based on the O2 transfers provided by the airlift
and the metabolic O2 requirements of fish. The generated model output indicates that the
novel airlift pump design can be used to maintain the DO levels required for fish
metabolism in a setting such as a research fish feeding trial. However, the total metabolic
O2 requirements of fish will increase over the course of their life cycle. This highlights the
need for the proper application of bioenergetic modelling to determine expected O2
consumption over the course of a specific fish feeding cycle, to then provide airlift pumps
capable of meeting the demands at all stages of the growth period.
By determining the effect of certain design characteristic parameters on the
oxygenation performance of novel airlift pumps and incorporating the results with fish
bioenergetic modelling to determine the pump applicability in aquaculture, the study
completed both its intended objectives. The outcome of this research can be further
assessed by conducting field trials to determine if any factors will greatly influence airlift
performance that were not considered in the lab bench experiment and model. Recording
DO of an aquaculture system being supplied O2 by the novel airlift pumps is needed to
determine the validity of the model. Testing the airlift pumps at existing fish growth
operations that currently use other forms of oxygenation technology can also provide a
direct comparison of energy efficiency between the two types of systems. Considering
the other potential uses of airlift pumps for aquaculture, such as water transportation,
95
designing a system that can fully take advantage of the multiple functions of these tools
could provide high improvements of energy efficiency compared to conventional
aquaculture system designs. Further research on the water quality maintenance
capability of the novel airlift pumps could therefore help determine the potential energy
savings for aquaculture operations.
96
REFERENCES
Ahmed, W.H. and H.M., Badr. 2012. Dual-Injection Airlift Pumps: An Enhanced
Performance. Particulate Science and Technology. 30: 497 – 516.
Ahmed, W.H., Aman, A.M., Badr, H.M. and Al-Qutub, A.M. 2016. Air injection methods:
The key to a better performance of airlift pumps. Experimental Thermal and Fluid
Scence. 70: 354 – 365.
Alderson, R. 1979. The effect of ammonia on the growth of juvenile Dover sole, Solea
solea (L.) and turbot, Seophthalmus maximus (L.). Aquaculture. 17: 291 – 309.
Alvarez-Pellitero, P. and Sitja-Bobadilla, A. 2002. Cryptosporidium molnari n. sp.
(Apicomplexa: Cryptosporidiidae) infecting two marine fish species, Sparus
aurata L. and Dicentrarchus labrax L. International Journal for Parasitology. 32
(8): 1007 – 1021.
Azevedo, P., Bureau, D.P., Leeson, S. and Cho, C.Y. 2002. Growth and efficiency of
feed usage by Atlantic salmon (Salmo salar) fed diets with different dietary
protein: Energy ratios at two feeding levels. Fisheries Science. 68 (4): 878 – 888.
Ballestrazzi, R., Lanari, D., D’Agaro, E. and Mion, A. The effect of dietary protein level
and source on growth, body composition, total ammonia and reactive phosphate
excretion of growing sea bass (Dicentrarchus labrax). Aquaculture. 127 (2 - 3):
197 – 206.
Balfry, S.K., Albright, L.J. and Evelyn, T.P. 1996. Horizontal transfer of Renibacterium
salmoninarum among farmed salmonids via the fecal-oral route. Diseases of
Aquatic Organisms. 25: 63 – 69.
Barrut, B., Blancheton, J.P., Champagnec, J.-Y. and Grasmick, A. 2012a. Mass transfer
efficiency of a vacuum airlift - Application to water recycling in aquaculture
systems. Aquacultural Engineering. 46: 18 – 26.
Barrut, B., Blancheton, J.-P., Champagne, J.-Y. and Grasmick, A. 2012b. Water delivery
capacity of a vacuum airlift – Application to water recycling in aquaculture
systems. Aquacultural Engineering. 48: 31– 39.
97
Barrut, B., Blancheton, J.-P., Muller-Feuga, A., René, F., Narváez, C., Champagne, J.-
Y. and Grasmick, A. 2012c. Separation efficiency of a vacuum gaslift –
Application to microalgae harvesting. Bioresource Technology. 128: 235-240.
Barrut, B., Blancheton, J.-P., Callier, M., Champagne, J.-Y., and Grasmick, A. 2013.
Foam fractionation efficiency of a vacuum airlift—Application to particulate matter
removal in recirculating systems. Aquacultural Engineering. 54: 16-21.
Benson, B.B. and Krause, D., Jr. 1984. The concentration and isotopic fractionation of
oxygen dissolved in freshwater and seawater in equilibrium with the atmosphere.
Limnology and Oceanography. 29(3): 620–632.
Bouck, G.R. 1980. Etiology of Gas Bubble Disease. Transactions of the American
Fisheries Society. 109 (6): 703 – 707.
Boyd, C.E. 1990. Water Quality in Ponds for Aquaculture, Alabama Agricultural
Experiment Station, Auburn University, Alabama, pp. 482.
Boyd, C.E., 1995. Deep water installation of a diffused-air aeration system in a shallow
pond. Journal of Applied Aquaculture. 5: 1–10.
Boyd, C.E. 1998. Pond water aeration systems. Aquacultural Engineering. 18: 9-40.
Boyd, C.E. and Ahmad, T. 1987. Evaluation of aerators for channel catfish farming,
Bulletin 584, Alabama Agricultural Experiment Station, Auburn University,
Alabama, pp. 52
Brambilla, F., Antonini, M., Ceccuzzi, P., Terova, G. and Saroglia, M. 2008. Foam
fractionation efficiency in particulate matter and heterotrophic bacteria removal
from a recirculating seabass (Dicentrarchus labrax) system. Aquacultural
Engineering. 39: 37–42.
Brinker, A., Koppe, W. and Rosch, R. 2005. Optimised effluent treatment by stabilized
trout faeces. Aquaculture. 249: 125 – 144.
Brunty, J.L., Bucklin, R.A., Davis, J., Baird, C.D. and Nordstedt, R.A. 1997. The
influence of feed protein intake on tilapia ammonia production. Aquacultural
Engineering. 16 (3): 161 – 166.
Bryson, R.E. and Suomi, V.E. 1952. The circulation of Lake Mendota. Transactions of
the American Geophysical Union. 33 (5): 707 – 712.
98
Buentello, J.A., Gatlin III, D.M. and Neill, W.H. 2000. Effects of water temperature and
dissolved oxygen on daily feed consumption, feed utilization and growth of
channel catfish (Ictalurus punctatus). Aquaculture. 182 (3-4): 339 – 352.
Bureau, D.P., Gunther, S.J. and Cho, C.Y. 2003. Chemical Composition and
Preliminary Theoretical Estimates of Waste Outputs of Rainbow Trout Reared in
Commercial Cage Culture Operations in Ontario. North American Journal of
Aquaculture. 65 (1): 33 – 38.
Castro, W.E., and Zielinski, P.B. 1980. Pumping Characteristics of Small Airlift Pumps.
Proceedings from the World Mariculture Society. 11: 163-174.
Chatterjee, S.G. and Altwicker, E.R. 2008. Film-Penetration Model for Nonisothermal
Physical Gas Absorption. Industrial & Engineering Chemistry Research. 47: 7368
– 7374.
Cho, C.Y. 1992. Feeding systems for rainbow trout and other salmonids with reference
to current estimates of energy and protein requirements. Aquaculture. 100 (1):
107 – 123.
Cho, C.Y., Slinger, S.J. and Bayley, H.S. 1982. Bioenergetics of salmonid fishes:
energy intake, expenditure and productivity. Comparative Biochemistry and
Physiology. 73B (1): 25-41
Cho, C.Y. and Bureau, D.P. 1998. Development of Bioenergetic Models and the Fish-
PrFEQ software to estimate production, feeding ratio and waste output in
aquaculture. Aquatic Living Resources. 11(4): 199-210.
Cho, C.Y. and Bureau, D.P. 2002. A review of diet formulation strategies and feeding
systems to reduce excretory and feed wastes in aquaculture. Aquaculture
Research. 32 (1): 349 – 360.
Chowdhury, M.A.K., Siddiqui, S., Hua, K. and Bureau, D.P. 2013. Bioenergetics-Based
Factorial Model to Determine Feed Requirement and Waste Output of Tilapia
Produced under Commercial Conditions. Aquaculture. 410-411: 138-147.
Cole, G.A. 1994. Density, Layering, and Lake Classification. Pages 194-217 in
Textbook of Limnology: Fourth Edition. Waveland Press, Inc. Prospect Heights,
Illinois, USA.
99
Colt, J.E. and K. Orwicz. 1991. Aeration in intensive culture. In: Brune, D.E., Tomasso,
J.R. (Eds.), Aquaculture and Water Quality. World Aquaculture Society,
Louisiana State University, Baton Rouge, LA, pp. 198–271.
Cooper, G.P. and Washburn, G.N. 1949. Relation of Dissolved Oxygen to Winter
Mortality of Fish in Michigan Lakes. Transactions of the American Fisheries
Society. 76: 23 – 33.
Cooper, J.L. and Plum, F. 1987. Biochemistry and physiology of brain ammonia.
Physiological Reviews. 67: 440 – 519.
Corrales, R.A. and Maclean, J.L. 1995. Impacts of harmful algae on seafarming in the
Asia-Pacific areas. Journal of Applied Phycology. 7: 151-162.
Cripps, S.J. and Bergheim, A. 2000. Solids management and removal for intensive
land-based aquaculture production systems. Aquacultural Engineering. 22: 33–
56.
del Giorgio, P.A. and Peters, R.H. 1994. Patterns in planktonic P: R ratios in lakes:
Influence of lake trophy and dissolved organic carbon. Limnology and
Oceanography. 39 (4): 772 – 787.
Dishon, A., Perelberg, A., Bishara-Shieban, J., Ilouze, M., Davidovich, M., Werker, S.
and Kotler, M. 2005. Detection of Carp Interstitial Nephritis and Gill Necrosis
Virus in Fish Droppings. Applied and Environmental Microbiology. 71 (11): 7285
– 7291.
Dodds, W.S., Stutzman, L.F. and Sollami, B.J. 1956. Carbon Dioxide Solubility in Water.
Industrial and Engineering Chemistry. 1 (1): 92 – 95.
Dumas, A., France, J. and Bureau, D.P. 2007. Evidence of three growth stanzas in
rainbow trout (Oncorhynchus mykiss) across life stages and adaptation of the
thermal-unit growth coefficient. Aquaculture. 267: 139 – 146.
Ebeling, J.M. and Timmons, A.B. 2012. Recirculating Aquaculture Systems. Pages 245-
277 in J. H. Tidwell, editor. Aquaculture Production Systems. Wiley-Blackwell,
Ames, Iowa, USA.
Enns, T. Scholander, P.F. and Bradstreet, E.D. 1965. Effect of Hydrostatic Pressure on
Cases Dissolved in Water. The Journal of Physical Chemistry. 69 (2): 389 – 391.
100
Espmark, Å.M., Hjelde, K. and Baeverfjord, G. 2010. Development of gas bubble
disease in juvenile Atlantic salmon exposed to water supersaturated with oxygen.
Aquaculture. 306 (1-4): 198 – 204.
Fagernes, C.E., Stenslokken, K.-O., Rohr, A.K., Berenbrink, M., Ellefsen, S. and
Nilsson, G.E. 2017. Extreme anoxia tolerance in crucian carp and goldfish
through neofunctionalization of duplicated genes creating a new ethanol-
producing pyruvate decarboxylase pathway. Scientific Reports. 7 (7884).
doi:10.1038/s41598-017-07385-4
Fernandez-Prini, R. 1982. Le Chatelier’s Principle and the Prediction of the Effect of
Temperature on Solubilities. Journal of Chemical Education. 59 (7): 550 – 553.
Fivelstad, S. 1988. Waterflow Requirements for Salmonids in Single-pass and Semi-
closed Land-based Seawater and Freshwater Systems. Aquacultural
Engineering. 7: 183 – 200.
Fivelstad, S. and Binde, M. 1994. Effects of Reduced Waterflow (Increased Loading) in
Soft Water on Atlantic Salmon Smolts (Salmo salar L.) While Maintaining Oxygen
at Constant Level by Oxygenation of the Inlet Water. Aquacultural Engineering.
13: 211 – 218.
Fivelstad, S., Haavik, H., Løvik, G. and Olsen, A.B. 1998. Sublethal effects and safe
levels of carbon dioxide in seawater for Atlantic salmon postsmolts (Salmo salar):
ion regulation and growth. Aquaculture. 160: 305–316.
Fletcher, G.L., Wroblewski, J.S., Hickey, M.M., Ming, B.B., Kao, H. and Goddard, S.V.
1997. Freezing resistance of caged Atlantic cod (Gadus morhua) during a
Newfoundland winter. Canadian Journal of Fisheries and Aquatic Sciences. 54:
94-98.
Giga, J.V. and Uchrin, C.G. 1990. Laboratory and in situ sediment oxygen demand
determinations for a passaic river (NJ) case study. Journal of Environmental
Science and Health. A25: 833 – 845.
Gong, L., Lewicki, R., Griffin, R.J., Flynn, J.H., Lefer, B.L., and Tittel, F.K. 2011.
Atmospheric ammonia measurements in Houston, TX using an external-cavity
101
quantum cascade laser-based sensor. Atmospheric Chemistry and Physics. 11:
9721 – 9733.
Guo-Qing, L., Shou-Zhi, Y., Zhao-Ling, C. and Jia-Yong, C. 1995. Mass transfer and
gas–liquid circulation in an airlift bioreactor with viscous non-newtonian fluid. The
Chemical Engineering Journal and the Biochemical Engineering Journal. 56:
B101 – B107.
Guyon, E., Hulin, J.P. and Petit, L. 2001. Hydrodynamique physique. EDP Sciences, pp.
674.
Hannesson, R. 2003. Aquaculture and Fisheries. Marine Policy. 27 (2): 169-178
Hargreaves, J.A. 2003. Pond Mixing. Southern Regional Aquaculture Center
Publication.4602. (https://agrilifecdn.tamu.edu/fisheries/files/2013/09/SRAC-
Publication-No.-4602-Pond-Mixing.pdf)
Hargreaves, J. and Brunson, M. 1996. Carbon Dioxide in Fish Ponds. Southern
Regional Aquaculture Center Publication. No. 468
Henry, W. 1803. Experiments on the quantity of gases absorbed by water, at different
temperatures, and under different pressures. Philosophical Transactions of the
Royal Society. 93: 29 – 274.
Huguenin, J.E. and Colt, J. 1989. Design and Operating Guide for Aquaculture
Seawater Systems, Elsevier, New York.
Huguenin, J.E. and Colt, J. 2002. Design and Operating Guide for Aquaculture
Seawater Systems Second Edition, Elsevier, Amsterdam.
Ip, Y.K., Chew, S.F. and Randall, D.J. 2001. Ammonia Toxicity, Tolerance, and
Excretion. Fish Physiology. 20: 109 – 148.
IPCC, in Climate Change 2007: The Physical Science Basis. Contribution of Working
Group I to the Fourth Assessment Report of the Intergovernmental Panel on
Climate Change, S. Solomon et al., Eds. (Cambridge Univ. Press, Cambridge,
2007), pp. 1–18.
Kassab, S.Z., Kandil, H.A., Warda, H.A. and Ahmed, W.H. 2007. Experimental and
analytical investigations of airlift pumps operating in three-phase flow. Chemical
Engineering Journal. 131: 273 – 281.
102
Kassab, S.Z., Kandil, H.A., Warda, H.A. and Ahmed, W.H. 2009. Air-lift pumps
characteristics under two-phase flow conditions. International Journal of Heat
and Fluid Energy. 30: 88 – 98.
Khalil, M.F., Elshorbagy, K.A., Kassab, S.Z. and Fahmy, R.I. 1999. Effect of air injection
method on the performance of an air lift pump. International Journal of Heat and
Fluid Flow. 20: 598 – 604.
Kikeri, D., Sun, A., Zeidel, M.L. and Herbert, S.C. 1989. Cell membranes impermeable
to NH3. Nature. 339: 478 – 480.
Knepper, M.A., Packer, R. and Good, D.W. 1989. Ammonium transport in the kidney.
Physiological Reviews. 69: 179 – 249.
Kosenko, E., Kaminski, Y., Lopata, O., Muravyov, N. and Felipo, V. 1999. Blocking
NMDA receptors prevents the oxidative stress induced by acute ammonia
intoxication. Free Radical Biology and Medicine. 26 (11-12): 1369 -1374.
Kutty, M.N. 1987. Site Selection for Aquaculture: Chemical Features of Water. Lectures
presented at ARAC for the Senior Aquaculturists course. African Regional
Aquaculture Centre, Port Harcourt, Nigeria. FAO.
Landsberg, 2002. The Effects of Harmful Algal Blooms on Aquatic Organisms.
Reviews in Fisheries Science 10: 113-390.
Lang, W. and Zander, R. 1986. Salting-Out of Oxygen from Aqueous Electrolyte
Solutions: Prediction and Measurement. Industrial and Engineering Chemistry
Fundamentals. 25: 775 – 782.
Lee, K.S., Kita, J. and Ishimatsu, A. 2003. Effects of lethal levels of environmental
hypercapnia on cardiovascular and blood‐gas status in yellowtail, Seriola
quinqueradiata. Zoological Science. 20 (4): 417 – 422.
Leng, J., Chen, J., Huang, H., Lin, S., Liu, M. and Liu, J. 2014. Impact of Structure
Design of Artificial Upwelling Tube. Applied Mechanics and Materials. 496-500:
547-550.
Leung, C.-K., Huang, Y.-W. and Pancorbo, O.C. 1992. Bacterial Pathogens and
Indicators in Catfish and Pond Environments. Journal of Food Protection. 55 (6):
424 – 427.
103
Lide, D.R. (Ed.), 1993. Handbook of Chemistry and Physics, 73rd ed. CRC Press, Boca
Raton, FL.
Lindroth, A. 1957. Abiogenic gas supersaturation of river water. Archive fur
Hydrobiologie. 53: 589 – 597.
Loyless, J.C. and Malone, R.F. 1997. A sodium bicarbonate dosing methodology for pH
management in freshwater-recirculating aquaculture systems. Progressive Fish-
Culturist. 59: 198–205.
Loyless, J.C. and Malone, R.F. 1998. Evaluation of air-lift pump capabilities for water
delivery, aeration, and degasification for application to recirculating aquaculture
systems. Aquacultural Engineering. 18: 117-133.
Maclean, J.L. 1993. Developing-country aquaculture and harmful algal blooms. In Pullin
RSV, Rosenthal H, Maclean JL (eds), Environment and aquaculture in
developing countries. ICLARM Conf. Proc. 31: 252-284.
Mahrous, A.-F. and Matrawy, K.K. 2014. Effect of Air Injection Strategy on Airlift Pump
Performance. International Journal of Control, Automation and Systems. 3(4): 20-
25.
Mamun, S.M., Focken, U. and Becker, K. 2013. A respirometer system to measure
critical and recovery oxygen tensions of fish under simulated diurnal fluctuations
in dissolved oxygen. Aquaculture International. 21 (1): 31 – 44.
Martinelle, K. and Haggstrom, L. 1993. Mechanisms of ammonia and ammonium ion
toxicity in animal cells: Transport across cell membranes. Journal of
Biotechnology. 30: 339 – 350.
Martins, C.I.M., Eding, E.H., Verdegem, M.C.J., Heinsbroek, L.T.N., Schneider, O.,
Blancheton, J.P., Roque d’Orbcastel, E., and Verreth, J.A.J. 2010. New
developments in recirculating aquaculture systems in Europe: A perspective on
environmental sustainability. Aquacultural Engineering. 43: 83-93.
McNaughton, K.A. and Lee, P.F. 2010. Water Quality Effects from an Aquaculture
Operation in a Meromictic Iron Pit Lake in Northwestern Ontario, Canada. Water
Quality Research Journal. 45(1): 13-24.
104
Mitchell, R.E. and Kirby Jr., A.M. 1976. Performance Characteristics Of Pond Aeration
Devices. Proceedings of the annual meeting - World Mariculture Society. 7 (1‐4):
561 -581.
Moses, D. and Colt, J. 2018. Impact of fish feed on airlift pumps in aquaculture systems.
Aquacultural Engineering. 80: 22-27.
National Research Council. 2011. Nutrient requirements of fish and shrimp. The
National Academies Press, Washington, USA.
Nicholls, D.G. and Ferguson, S.J. 2013. Respiratory Chains Pages 91-157 in
Bioenergetics (Fourth Edition). Academic Press, Cambridge, Massachusetts,
USA
Ott, M.E., Heisler, N. and Ultsch, G.R. 1980. A re-evaluation of the relationship between
temperature and the critical oxygen tension in freshwater fishes. Comparative
Biochemistry and Physiology Part A: Physiology. 67 (3): 337 – 340.
Page, F.H., Losier, R., McCurdy, P., Greenberg, D., Chaffey, J. and Chang, B. 2005.
Dissolved Oxygen and Salmon Cage Culture in the Southwestern New
Brunswick Portion of the Bay of Fundy. In: Hargrave B.T. Environmental Effects
of Marine Finfish Aquaculture. Handbook of Environmental Chemistry, vol 5M.
Springer, Berlin, Heidelberg.
Parker, N.C., Suttle, M.A. and Fitzmayer, K. 1984. Total Gas Pressure and Oxygen and
Nitrogen Saturation in Warmwater Ponds Aerated with Airlift Pumps. Aquacultural
Engineering. 3: 91-102.
Parker, N.C. and Suttle, M.A. 1987. Design of Airlift Pumps for Water Circulation and
Aeration in Aquaculture. Aquacultural Engineering. 6: 97-110.
Pickering, A.D. and Pottinger, T.G. 1989. Stress responses and disease resistance in
salmonid fish: Effects of chronic elevation of plasma cortisol. Fish Physiology and
Biochemistry. 7(1-6): 253-258.
Randall, D.J. and Tsui, T.K.N. 2002. Ammonia toxicity in fish. Marine Pollution Bulletin.
45 (1-12): 17-23.
Randall, D.J. and Wicks, B.J. 2000. Fish: ammonia production, excretion and toxicity.
Proceedings of the Fifth International Symposium on Fish Physiology, Toxicology
105
and Water Quality. 10 - 13 November 1998, City University of Hong Kong. p. 41 –
50.
Ratkowsky, D.A., Olley, J., McMeekin, T.A. and Ball, A. 1982. Relationship Between
Temperature and Growth Rate of Bacterial Cultures. Journal of Bacteriology. 149
(1): 1 – 5.
Reinemann, D.J. and Timmons, M.B. 1989. Prediction of Oxygen Transfer and Total
Dissolved Gas Pressure in Airlift Pumping. Aquacultural Engineering. 8: 29-46.
Remen, M., Oppedal, F., Imsland, A.K., Olsen, R.E. and Torgersen, T. 2013. Hypoxia
tolerance thresholds for post-smolt Atlantic salmon: Dependency of temperature
and hypoxia acclimation. Aquaculture. 416-417: 41 – 47.
Rogers, N.J., Urbina, M.A., Reardon, E.E., McKenzie, D.J. and Wilson, R.W. 2016. A
new analysis of hypoxia tolerance in fishes using a database of critical oxygen
level (Pcrit). Conservation Physiology. 4 (1): cow012;
doi:10.1093/conphys/cow012.
Roque d’Orbcastel, E., Blancheton, J.-P., and Aubin, J. 2009. Towards environmentally
sustainable aquaculture: Comparison between two trout farming systems using
Life Cycle Assessment. Aquacultural Engineering. 40: 113-119.
Root, R.W. 1931. The Respiratory Function of the Blood of Marine Fishes. Biological
Bulletin. 61 (3): 427 – 456.
Ruan, Y.-J., Guo, X.-S., Ye, Z.-Y., Liu, Y. and Zhu, S.-M. 2015. Bacterial Community
Analysis of Different Sections of a Biofilter in a Full-Scale Marine Recirculating
Aquaculture System. North American Journal of Aquaculture. 77 (3): 318-326.
Ruen-ngam, D., Wongsuchoto, P., Limpanuphap, A., Charinpanitkul, T. and Pavasant,
P. 2008. Influence of salinity on bubble size distribution and gas–liquid mass
transfer in airlift contactors. Chemical Engineering Journal. 141: 222–232.
Seginer, I. and Mozes, N. 2012. A note on oxygen supply in RAS: The effect of water
temperature. Aquacultural Engineering. 50: 46-54.
Smayda, T.J. 1969. Some Measurements of the Sinking Rate of Fecal Pellets.
Limnology and Oceanography. 14 (4): 621 – 625.
106
Solstorm, D., Oldham, T., Solstorm, F., Klebert, P., Stien, L.H., Vagseth, T. and
Oppedal, F. 2018. Aquaculture. Dissolved oxygen variability in a commercial sea-
cage exposes farmed Atlantic salmon to growth limiting conditions. 486: 122-129.
Stein, L.Y. and Klotz, M.G. 2016. The Nitrogen Cycle. Current Biology. 26 (3): R94 –
R98.
Summerfelt, S.T. and Sharrer, M.J. 2004. Design implication of carbon dioxide
production within biofilters contained in recirculating salmonid culture systems.
Aquacultural Engineering. 32: 171-182
Summerfelt, S.T., Vinci, B.J., and Piedrahita, R.H. 2000. Oxygenation and carbon
dioxide control in water reuse systems. Aquacultural Engineering. 22: 87-108.
Szyper, J.P. 1996. Comparison of Three Mixing Devices in Earthen Culture Ponds of
Four Different Surface Areas. Aquacultural Engineering. 15(5): 381-396.
Thurston, R.U., Russo, R.C., and Smith, C.E. 1978. Acute toxicity of ammonia and
nitrite to cutthroat trout fry. Transactions of the American Fisheries Society. 107:
361 – 368.
Tidwell, J.H. 2012. Functions and Characteristics of All Aquaculture Systems. Pages
51-63 in J. H. Tidwell, editor. Aquaculture Production Systems. Wiley-Blackwell,
Ames, Iowa, USA.
Timmons, M.B. 1994. Use of foam fractionation in aquaculture. Aquaculture Water
Reuse System: Engineering Design and Management. Elsevier, Amsterdam, pp.
247–279
Timmons, M.B. and Ebeling, J.M. 2010. Recirculating Aquaculture 2nd Ed. Cayuga
Aquaculture Ventures, Ithaca, NY, USA, 948 p.
Tucker, C.S. and Robinson, E.H. 1990. Channel Catfish Farming Handbook. Van
Nostrand-Reinhold, New York.
Tucker, C. and Hargreaves, J. 2012. Ponds. Pages 192-244 in J. H. Tidwell, editor.
Aquaculture Production Systems. Wiley-Blackwell, Ames, Iowa, USA.
Ultsch, G.R., Boschung, H. and Ross. M.J. 1978. Metabolism, Critical Oxygen Tension,
and Habitat Selection in Darters (Etheostoma). Ecology. 59 (1): 99 – 107.
107
Unger, J., Schumann, M. and Brinker, A. 2015. Floating faeces for a cleaner fish
production. Aquaculture Environment Interactions. 7: 223 – 238.
USEPA (United States Environmental Protection Agency) 1984. Ambient water quality
criteria for ammonia––1984. National Technical Information Service, Springfield,
VA.
USEPA (United States Environmental Protection Agency) 1989. Ambient water quality
criteria for ammonia (saltwater). National Technical Information Service,
Springfield, VA.
USEPA (United States Environmental Protection Agency) 1998. Addendum to “Ambient
Water Quality Criteria for Ammonia--1984.” National Technical Information
Service, Springfield, VA.
Vaquer-Sunyer, R. and Duarte, C.M. 2008. Thresholds of hypoxia for marine
biodiversity. Proceedings of the National Academy of Sciences of the United
States of America. 105 (40): 15452 – 15457.
Vargaftik, N.B., Volkov, B.N. and Voljak, L.D. 1983. International Tables of the Surface
Tension of Water. Journal of Physical and Chemical Reference Data. 12: 817 –
820.
Viitasalo, M., Rosenberg, R., Heiskanen, A.-S. and Koski, M. 1999. Sedimentation of
copepod fecal material in the coastal northern Baltic Sea: Where did all the
pellets go?. Limnology and Oceanography. 44: 1388 – 1399.
Watanabe, W.O., Losordo, T.M., Fitzsimmons, K. and Hanley, F. 2002. Tilapia
Production Systems in the Americas: Technological Advances, Trends, and
Challenges. Reviews in Fisheries Science. 10 (3-4): 465 – 498.
Weast, R.C. 1973. Page F4 in Handbook of Chemistry and Physics 53rd Edition.
Chemical Rubber Co. Boca Raton, Florida, USA.
Wimberly, D.M. 1990. Development and Evaluation of a Low-Density Media Biofiltration
Unit For Use in Recirculating Finfish Culture Systems. MS thesis, Louisiana State
University, Baton Rouge, LA.
Wold, P.-A., Holan, A.B., Øie, G., Attramadal, K., Bakke, I., Vadstein, O. and Leiknes,
T.O. 2014. Effects of membrane filtration on bacterial number and microbial
108
diversity in marine recirculating aquaculture system (RAS) for Atlantic cod
(Gadus morhua L.) production. Aquaculture. 422: 69-77.
Wong, K.B. and Piedrahita, R.H. 2000. Settling velocity characterization of aquacultural
solids. Aquacultural Engineering. 21: 233 – 246.
Wurts, W.A. and Durborow, R.M. 1992. Interactions of pH, Carbon Dioxide, Alkalinity
and Hardness in Fish Ponds. Southern Regional Aquacultural Center. Publication
No. 464.