Embed Size (px)
Citation preview

remote sensing
Article
Novel Machine Learning Approaches for Modellingthe Gully Erosion Susceptibility
Alireza Arabameri 1 Omid Asadi Nalivan 2 Subodh Chandra Pal 3 Rabin Chakrabortty 3 Asish Saha 3 Saro Lee 45 Biswajeet Pradhan 6789 and Dieu Tien Bui 10
1 Department of Geomorphology Tarbiat Modares University Tehran 14117-13116 Iranaarabamerimodaresacir
2 Department of Watershed Management Gorgan University of Agricultural Sciences and NaturalResources (GUASNR) Gorgan 3184761174 Iran Omidasadiutacir
3 Department of Geography The University of Burdwan West Bengal 713104 Indiascpalgeoburunivacin (SCP) rabingeo8gmailcom (RC) asishsaha01gmailcom (AS)
4 Geoscience Platform Research Division Korea Institute of Geoscience and Mineral Resources (KIGAM)124 Gwahak-ro Yuseong-gu Daejeon 34132 Korea
5 Department of Geophysical Exploration Korea University of Science and Technology 217 Gajeong-roYuseong-gu Daejeon 34113 Korea
6 Centre for Advanced Modelling and Geospatial Information Systems (CAMGIS) Faculty of Engineering andInformation Technology University of Technology Sydney Ultimo NSW 2007 Australiabiswajeetpradhanutseduau
7 Department of Energy and Mineral Resources Engineering Sejong University Choongmu-gwan209 Neungdong-ro Gwangjin-gu Seoul 05006 Korea
8 Center of Excellence for Climate Change Research King Abdulaziz University PO Box 80234Jeddah 21589 Saudi Arabia
9 Earth Observation Center Institute of Climate Change Universiti Kebangsaan Malaysia Bangi 43600 UKMSelangor Malaysia
10 Institute of Research and Development Duy Tan University Da Nang 550000 Vietnambuitiendieuduytaneduvn
Correspondence leesarokigamrekr (SL)
Received 6 July 2020 Accepted 25 August 2020 Published 1 September 2020
Abstract The extreme form of land degradation caused by the formation of gullies is a majorchallenge for the sustainability of land resources This problem is more vulnerable in the aridand semi-arid environment and associated damage to agriculture and allied economic activitiesAppropriate modeling of such erosion is therefore needed with optimum accuracy for estimatingvulnerable regions and taking appropriate initiatives The Golestan Dam has faced an acute problemof gully erosion over the last decade and has adversely affected society Here the artificial neuralnetwork (ANN) general linear model (GLM) maximum entropy (MaxEnt) and support vectormachine (SVM) machine learning algorithm with 9010 8020 7030 6040 and 5050 randompartitioning of training and validation samples was selected purposively for estimating the gullyerosion susceptibility The main objective of this work was to predict the susceptible zone with themaximum possible accuracy For this purpose random partitioning approaches were implementedFor this purpose 20 gully erosion conditioning factors were considered for predicting the susceptibleareas by considering the multi-collinearity test The variance inflation factor (VIF) and tolerance(TOL) limit were considered for multi-collinearity assessment for reducing the error of the modelsand increase the efficiency of the outcome The ANN with 5050 random partitioning of the sample isthe most optimal model in this analysis The area under curve (AUC) values of receiver operatingcharacteristics (ROC) in ANN (5050) for the training and validation data are 0918 and 0868respectively The importance of the causative factors was estimated with the help of the Jackknifetest which reveals that the most important factor is the topography position index (TPI) Apart fromthis the prioritization of all predicted models was estimated taking into account the training and
Remote Sens 2020 12 2833 doi103390rs12172833 wwwmdpicomjournalremotesensing
Remote Sens 2020 12 2833 2 of 32
validation data set which should help future researchers to select models from this perspectiveThis type of outcome should help planners and local stakeholders to implement appropriate land andwater conservation measures
Keywords land degradation gully erosion random partitioning approaches machine learningalgorithm jackknife test
1 Introduction
In the last few decades modern societies have witnessed various types of degradation of naturalresources above all soil and water have become more prominent [1] Land degradation throughwater-induced soil erosion is the most critical threat to human life and a number of environmentalproblems are occurring particularly in the arid and semi-arid region of Iran [2] Soil erosion is notonly an extreme form of land degradation it is also responsible for a gradual decline in agriculturalproductivity [3ndash5] The formation of soil is a natural process although the net loss of soil is much higherthan the formation of regolith due to the gradual degradation of this resource and the influence ofanthropogenic activities [67] It has been estimated that almost 6 million hectares of fertile land are lostannually on a global scale due to soil erosion [8] In the case of Iran it is approximately 2 to 25 billiontons per year and ranks second in the world in terms of soil erosion [9] In Iran therefore the rate of soilerosion is occurring at an alarming rate making it a national threat [10] This enormous amount of soilerosion is mainly due to arid and semi-arid climatic conditions and more than 75 of the area is exposedto water-induced soil erosion ie erosion in the form of gullies [10] More specifically there is a longdry season with a short wet season which influences extreme rainfall and causes maximum surfacerunoff over infiltration [10] It has also been reported that Iran is facing several intimidating gullyincisions around the world [1112] Various types of environmental problems such as desertificationsedimentation in rivers as well as reservoirs floods and soil fertility losses have occurred due tothe severe impact of gully erosion [1314] In recent times due to its large impact on environmentaldegradation and national economic losses the threat of gully erosion has been taken into account in anappropriate manner Therefore in order to understand the mechanism of water-induced gully erosionand to overcome this problem in an optimal way gully erosion susceptibility mapping (GESM) is a keystrategy and must be considered as an initial task The GESM is derived from the relationship betweendifferent geo-environmental conditioning factors and occurrences of gullies [15]
Gully erosion is water-induced soil erosion and is one of the most destructive forms of soil erosionin the world [1617] A gully can be defined as a permanent vertical deep channel with a temporaryflow of water the depth varies from 30 cm to several meters and sometimes it is several hundredmeters long [18ndash20] Apart from this the existence of one type of gully is limited during the wet seasonwhich is called the ephemeral gully Gully erosion is a very complicated process and it correlates withmany factors such as topography soil characteristics lithology rainfall land use and the nature ofvegetation [21ndash23] Running surface water is responsible for the initiation and development of gulliesby removing soil particles and ultimately transporting them in the downslope direction [24] Primarilytwo types of approaches have been recognized to evaluate the occurrences of gully erosion [25ndash27]First using a regression analysis we explored the relationship between the occurrence of gullyerosion and the topographical condition Second gully erosion response curves were prepared usingmachine learning techniques [28] The predictive regression approach is considered to estimate andidentify the conditioning relation among variables Regression solutions estimated using variousprinciples (eg optimization minimal square etc) are not inherently similar [29] Machine learningmay analyze vast quantities of data and identify complex changes and nature that would not beobvious to individuals This algorithm is well suited for resolving multi-dimensional and multi-varietyinformation and can do so in complex or unpredictable situations As this algorithm learns its skills
Remote Sens 2020 12 2833 3 of 32
it continues to develop in terms of accuracy and performance Machine learning needs the training oflarge volumes of data which should have been inclusivetrue and of an excellent standard There mayalso be occasions when they wait to produce additional knowledge ML requires ample time tolet algorithms learn and improve sufficiently to perform their tasks with reasonable precision andrelevance It also requires huge sources for it to operate This might mean extra computing power needsfor analysis Another major obstacle is the ability to analyze the algorithm-generated output precisely
Over the last few decades with the arrival of remote sensing (RS) geographic information system(GIS) and various statistical approaches susceptible areas have been identified in various fields such asgully erosion [30] landslide [31] groundwater potential zone [32] etc Basically there are three types ofsusceptibility mapping based on multi-criteria decision analysis (MCDA) statistical analysis and morerecently the widely used machine learning algorithm Extensive literature surveys show that differenttypes of models have been used throughout the world over time to map the susceptibility of gullyerosion It is indeed necessary to remember that the MCDA models presume that the improvement ofthe attribute does not influence the preferences of the different criteria This feature recognized bythe technical resource of reciprocal preferred autonomy is related to the particular question and thenature of the research [33] Experts must always determine if autonomy is an expectation for fieldsand if not recommend quite complicated MCDA (multi-criteria decision analysis) systems thatintegrate relationships [34] Most importantly knowledge-based MCDA [11] and statistical analysisbased on continuous binary and categorical data such as the information value [2335] conditionalprobability [36] certainty factor [37] frequency ratio [38] evidential belief function [2] index of entropy(IoE) [39] weights of evidence (WoE) [40] and logistic regression [241] has been widely used byseveral researchers In the case of the machine learning algorithm the most successful models forGESM are the multi-layer perception approach (MLPC) [42] multivariate adaptive regression spline(MARS) [39] artificial neural network (ANN) [43] classification and regression trees (CART) [23]maximum entropy (ME) [44] decision tree (DT) [45] boosted regression tree [15] stochastic gradienttreeboost (SGT) [46] random forest (RF) [47] bagging best-first decision tree [48] general linear model(GLM) [49] maximum entropy [50] etc In general GESM with machine learning models is moreproficient at predicting susceptible areas than statistical analysis Simulation focuses in a number ofways on the related mechanism used including machine learning or deep learning Computationalproducts are formulated to predict missing parameters objects or events as their name impliesThey sometimes rely on grouping convergence and object image processing algorithms [51]
In the current study semi-humid semi-arid and Mediterranean climate types in the provinceof Golestan Iran were chosen to map the susceptibility of gully erosion due to its serious damageand the major environmental problems caused by gully erosion Therefore the causes of extensivegully erosion their development and susceptibility mapping for management and planning purposesmust be identified Therefore the objectives of our current research work were to identify the mostreliable maps of gully erosion susceptibility and to recognize the main conditioning factors responsiblefor their development Therefore in order to meet our objectives a maximum entropy (MaxEnt)artificial neural network (ANN) support vector machine (SVM) and general linear model (GLM)machine learning algorithm with 9010 8020 7030 6040 and 5050 random partitioning of trainingand validation samples were selected for the purpose of estimating the susceptible part of gully erosionThe selection of the machine learning models for gully erosion susceptibility mapping was based onthe previous literature in this region as well as the same climatic conditions [394352ndash54] The optimalmodels suggested by the various researchers were considered for the estimation of gully erosionsusceptibility In previous studies researchers have attempted to increase the accuracy of the model byconsidering ensemble approaches rather than a single model In this perspective this kind of approachwas avoided in order to avoid the problem of over-fitting Apart from this the study considered themodification of existing models by considering the random partition of samples The final result ofdifferent GESM models was validated through the area under receiver operating characteristic curve(AUROC) In addition the jackknife test was used to give different GECFs importance regarding the
Remote Sens 2020 12 2833 4 of 32
susceptibility to gullies This type of machine learning algorithm is not only capable of estimatingsusceptibility with adequate accuracy but is also capable of handling the large amount of data of thepredicted models Supervised ML approaches usually involve partitioning information into multipleparts for clustering algorithm training validation and final testing Training and validation are usuallyperformed on a test set to discover the perfect variables for a classification model It was accompaniedby the implementation of a classification algorithm for a different test sample with optimal factors forestimating the generalization efficiency of the classification model For minimal data this differentiationof the test dataset results in a difficult trade-off among several predictive significances in the classifieroutput estimation against improved simulation analysis and significant optimal fitting Apart from themodels the optimum separation capacity of the samples in the appropriate manure may increase theefficiency of the models without compromising the importance of the classifier In terms of uniquenessthis study is capable of estimating the importance of sample partitioning approaches to improve modelperformance and to reduce predictive bias This approach is used for the first time in gully erosionsusceptibility modeling taking into account the optimal capacity of the model Finally GES mapswill provide appropriate strategies for restoration in the various sectors ie agriculture land useand watershed management planners in a sustainable manner
2 Materials and Methods
21 Study Area
The study area occupies an area of 790 km2 and lies between 3730prime00rdquo to 3750prime00rdquo N and 5531prime40rdquoto 562prime10rdquo E in the northeast part of Golestan province Elevation ranges between 160 and 1490 mtmean sea level (MSL) (Figure 1) More than half of the basin has mountainous morphology withgentle slopes and is a part of the Alborz Mountains The slope angle at steep slopes reaches up to118 The average annual rainfall varies from 346 to 610 mm with the maximum rainfall conductedin southern parts The minimum and maximum temperatures are 8 and 16 C Three main climaticcharacteristics of semi-humid semi-arid and Mediterranean are evident in the study area Agricultureas the predominant land cover is conducted in most of the study area (ie 4535) followed byrangelands (3807) forests (1595) and residential areas (064) (Table 1) Geologically thelargest portion of the region corresponds to the grey to black shale and thin layers of siltstone andsandstone (7394) followed by Ammonite bearing shale with the interaction of limestone (1248)grey thick-bedded limestone and dolomite (626) and the remaining area is dominated by otherformations described in detail in Table 2
Remote Sens 2020 12 2833 5 of 32
Figure 1 Location of the study area
Table 1 Land use classes in the study area
Land Use Area (he) Area ()
Forest 1251304 1595Residential Areas 4986 064
Rangelands 298588 3807Agricultural 355682 4535
Table 2 Lithology of the study area
Geo Unit Description Age Area (ha) Area ()
Qm Swamp Cenozoic 216948 277
Qsw Grey to block shale and thin layers ofsiltstone and sandstone Cenozoic 5800092 7394
Ksn Ammonite bearing shale withinteraction of limestone Mesozoic 978663 1248
Ksr Grey thickmdashbedded limestoneand dolomite Mesozoic 49065 626
Jmz Olivemdashgreen shale and sandstone Mesozoic 185768 237
Ekh Swamp Cenozoic 171573 219
22 Methodology
The present study followed several steps as follows
(i) The gully erosion inventory map and gully erosion causality factors preparations In the currentstudy a total of 1115 gully head cut locations were identified using the high-resolution imagesfield investigation global positioning system (GPS) and a number of gullies were receivedfrom Natural Resources and Watershed Management Organization of the Golestan ProvinceThe 20 environmental factors were considered for the modeling purpose
(ii) Multi-collinearity analysis among the gully erosion factors using the variance inflation factor(VIF) and tolerance limit was done using SPSS software
(iii) The significance and effectiveness of factors was carried out using the MaxEnt model(Jackknife test)
Remote Sens 2020 12 2833 6 of 32
(iv) GES maps were prepared using the MaxEnt ANN SVM and GLM models(v) The GESM modelrsquos performance was validated through the area under receiver operating
characteristic curve (AUROC)
The detailed methodology for estimating the susceptibility of gully erosion in the light of thesenovel approaches is shown in Figure 2
23 Gully Inventory Map
The gully erosion inventory map (GEIM) is the basic tool for creating the GESMs GEIM showsthe spatial distribution of gullies and geometry Through the historical and present gully distributionsone can predict the future risk of the gully erosion of the area In the present study the RS and GIStechniques were applied to generate the GEIM The geographical location of gullies was partiallyacquired from the archived data of Natural Resources and Watershed Management Organization ofthe Golestan Province (NRWMOGP) Further extensive field surveys were conducted supported bygeoinformatics (Google Earth images and a handheld GPS device) through which the previous gullyinventory map was amended and an all-inclusive map was generated in ArcGIS 103 The producedinventory map was then randomly split into two sets of training and validation data in five replicateseach of which possessed a different trainingvalidation balance The balance values commencedin favor of the training dataset as it held 90 of the gullies while the remaining was cast-off forfurther validation and perpetually more samples were transmitted to the validation dataset As suchfive trainingvalidation samples of 9010 8020 7030 6040 and 5050 were considered toinvestigate how the datasetrsquos transient distribution can influence modelsrsquo performances Some majorerosion-prone areas are shown in Figure 3 due to the nature and vulnerability of the erosion that wecan easily understand
Figure 2 Flowchart of research in the study area
Remote Sens 2020 12 2833 7 of 32
Figure 3 Some of the mapped gullies in the study area (a) Lat 3770123 Long 4183012 (b) Lat 3928126Long 41769656 (c) Lat 3892262 Long 41734135
24 Data Preparation
Different geo-environmental factors such as topographic hydrological geological soiland environmental factors are important parameters for GESM (gully erosion susceptibility mapping)(Table 3) It is also an important step in the selection of the various appropriate geo-environmentalfactors for the preparation of GESM using different machine learning models [15] In this studybased on a previous literature review [102355] the availability of data extensive field surveyand multi-collinearity analysis we selected 20 GECFs namely the topography position index (TPI) [56]plan curvature [57] elevation aspect [58] slope [58] height above nearest drainage (HAND) [59]drainage density [60] distance from stream [61] terrain ruggedness index (TRI) [42] distance fromroad [62] bulk density [63] mineral soil clay content sand content relative slope position (RSP) [64]silt content valley depth land use soil texture and lithology (Figure 4andasht)
Remote Sens 2020 12 2833 8 of 32
Figure 4 Cont
Remote Sens 2020 12 2833 9 of 32
Figure 4 Gully erosion factors are showing (a) Topography position index (TPI) (b) Plan curvature(c) Elevation (d) Aspect (e) Slope (f) Height above nearest drainage (HAND) (g) Drainage density(h) Distance from stream (i) Terrain ruggedness index (TRI) (j) Distance from road (k) Bulk density(l) Mineral Soil (m) Clay content (n) Sand content (o) Relative slope position (RSP) (p) Silt content(q) Valley depth (r) Land use (s) Soil Texture (t) Lithology
Table 3 Detailed information about the database
Sl No Conditioning Factors Source Time SpatialResolutionScale
1 Topography positionindex (TPI) ALOSPALSER DEM 12082012 125 mt
2 Plan curvature ALOSPALSER DEM 12082012 125 mt
3 Elevation ALOSPALSER DEM 12082012 125 mt
4 Aspect ALOSPALSER DEM 12082012 125 mt
5 Slope ALOSPALSER DEM 12082012 125 mt
6 Height above nearestdrainage (HAND) ALOSPALSER DEM 12082012 125 mt
7 Drainage density ALOSPALSER DEM 12082012 125 mt
8 Distance from stream ALOSPALSER DEM 12082012 125 mt
9 Train ruggness index (TRI) ALOSPALSER DEM 12082012 125 mt
Remote Sens 2020 12 2833 10 of 32
Table 3 Cont
Sl No Conditioning Factors Source Time SpatialResolutionScale
10 Distance from road
Google Earth images Landsat8 satellite images by USGS and
Topographical map byNational GeographicOrganization of Iran
(wwwngo-orgir)
17062019 30 mt
11 Bulk densitySoil and Water Research
Institute (SWRI)(httpwwwiranswricom)
18062019 11000000
12 Mineral SoilSoil and Water Research
Institute (SWRI)(httpwwwiranswricom)
18062019 11000000
13 Clay contentSoil and Water Research
Institute (SWRI)(httpwwwiranswricom)
18062019 11000000
14 Sand contentSoil and Water Research
Institute (SWRI)(httpwwwiranswricom)
18062019 11000000
15 Relative slopeposition (RSP) ALOSPALSER DEM 12082012 125 mt
16 Silt contentSoil and Water Research
Institute (SWRI)(httpwwwiranswricom)
18062019 11000000
17 Valley depth ALOSPALSER DEM 12082012 125 mt
18 Land use
Google Earth images Landsat8 satellite images by USGS and
Topographical map byNational GeographicOrganization of Iran
(wwwngo-orgir)
17062019 30 mt
19 Soil TextureSoil and Water Research
Institute (SWRI)(httpwwwiranswricom)
18062019 11000000
20 Lithology Geological Society of Iran(GSI) (httpwwwgsiir) 14072019 1100000
All these factors were derived from different sources The Advanced Land Observing Satellite(ALOS) digital elevation model (DEM) 125 m resolution data were downloaded from the AlaskaSatellite Facility (ASF) for the extraction of topographic and hydrological factors such as the topographyposition index (TPI) plan curvature elevation aspect slope drainage density distance from streamterrain ruggedness index (TRI) and relative slope position (RSP) The geological map was collected fromGeological Society of Iran (GSI) (httpwwwgsiir) at a scale of 1100000 to generate the lithology mapThe topographic map was acquired from National Geographic Organization of Iran (wwwngo-orgir)at a scale of 1150000 along with Google Earth images and Landsat 8 satellite images which were alsoused to produce land use and roads network maps
Topography position index (TPI)More specifically TPI is used to measure topographic slope positions TPI is the measure
of differences between the elevation at the central point and the average elevation around it [65]
Remote Sens 2020 12 2833 11 of 32
The following equations were used to estimate the TPI The TPI map is shown in Figure 4a and thevalue ranges from minus388 to 548
TPI =EPixel
ESurrounding (1)
where EPixel is the elevation at the central point and ESurrounding is the average elevation of theneighboring areas
Plan curvaturePlan curvature signifies the overland flow of water in terms of its diverging and converging and
plays an important factor in gully erosion studies [35] The value of plan curvature ranges from minus61 to91 (Figure 4b)
ElevationElevation influences the rainfall and related runoff process which is largely employed in geo-hazard
modelling like GESM [66] The elevation of this region ranges from 160 to 1490 m (Figure 4c)Slope aspectSolar radiation vegetation covers and evapo-transpiration largely depend on the slope aspect [67]
which is considered to be one of the major parameters for geo-hazard susceptibility mapping The aspectmap of this study area is shown in Figure 4d
SlopeSlope angle largely affects the surface runoff infiltration pattern of drainage density and soil
erosion [3568] Therefore slope angle has always been used as one of the major factors for mappingGESM In this region the angle of slope varies from 0 to 118 (Figure 4e)
Height above nearest drainage (HAND)The HAND model emphasizes the relative heights beside the drainage network and influences
the soil gravitational potential [59] HAND is calculated by using the DEM and DEM flow field in aGIS environment [69] The value of the HAND map ranges from 0 to 494 (Figure 4e)
Drainage densityDrainage density has a major influence on erosion in the form of the initiation and development of
rills gullies etc a higher drainage density has a minimum infiltration rate and higher runoff capacityand vice versa [66] Drainage density was calculated by using the following equation [70] The valueof drainage density ranges between 0 and 332 kmkm2 (Figure 4f)
DD =
sumni=1 Si
a (2)
wheresumn
i=1 Si indicates the total length of all drainages in km and lsquoarsquo is the total area of the drainagebasin in km2
Distance from streamGullies are primarily associated with the drainage system and there is a significant positive
relationship between the distance from the stream and the occurrence of gullies [71] The distancefrom the stream map is shown in Figure 4g and the range varies from 0 to 1959 m
Terrain ruggedness index (TRI)The concavity and convexity of an area is indicated by TRI which also influences gully erosion
occurrences [72] Apart from this different pedo-geomorphic processes can directly influence theamount of TRI in a specific geomorphic region The following equation was used to calculate TRIThe value of TRI ranges between 0 and 37 (Figure 4h)
TRI =radic|X|(max2 minusmin2) (3)
where X represents the altitude of every neighbor cell to a definite cell and max and min are the highestand smallest altitude among different neighboring cells
Distance from road
Remote Sens 2020 12 2833 12 of 32
The distance from the road is another important parameter for the gully erosion and the preparationof the GESM Due to the construction of the road the stress and strain of the slope can be increasedand as a result there were disturbances and failures of the slope [62] The distance from the road mapis shown in Figure 4i and the value ranges from 0 to 4532 m
Bulk densityBulk density is defined as the mass per unit volume of the loose powder bed [63] Bulk density
was estimated by using the following equation The range of the bulk density in this region variesfrom 14 to 16 gmm in the study area (Figure 4j)
BD =MVo
(4)
where M represents the mass in grams and Vo indicates the untapped apparent volume in millilitersMineral soil clay content and sand contentThe value of mineral soil clay and sand varies from 16 to 35 17 to 35 and 15 to 44
respectively (Figure 4kndashm)Relative slope position (RSP)RSP helps to understand the various topographical characteristics such as flat surface valley
ridge-top foot-slope mid-slope and upper slope [73] The value of the RSP map for the current studyarea varies from o to 1 (Figure 4n)
Silt content and valley depthSilt content and valley depth are also important factors for GESM In the present study the silt
content and valley depth varies from 31 to 55 and 0 to 391 respectively (Figure 4op)Land useThe formation of gullies and associated land degradation depends to a large extent on land use
The land use map of the area was prepared using the maximum likelihood algorithm of the supervisedclassification technique [74] Table 2 shows different land use types and their geographical areasie forest agricultural land range and residential areas (Figure 4q)
Soil texture and lithologySoil texture in this study area has been categorized into four types namely clay loam salty clay
loam loam and silty loam (Figure 4r) The land surface process of the area is highly influenced bylithological characteristics and one of the most significant factors for large-scale erosion such as thecreation and development of gullies [3575] In this study six types of lithological units were found(Figure 4s) and their description is given in Table 2
25 Multi-Collinearity Assessment
Multi-collinearity analysis can be defined as the relationship between two or more variables inthe data set and the linear relationship among variables [2] Generally various geo-environmentalconditioning factors have been used to prepare GESM Thus multi-collinearity analysis was thereforeused to identify the perfect relationship between the variables Multi-collinearity occurs when there isa very high correlation between variables and the accuracy of the result is reduced [31] Thereforehigh multi-collinearity factors need to be removed from the entire analysis in order to achievebetter results [76] Various researchers throughout the world have been used in multi-collinearityanalysis to get better output by using machine learning models ie in the field of GESM [28]landslide susceptibility mapping [77] etc Generally the variance inflation factor (VIF) and tolerance(TOL) are widely used to understand the multi-collinearity of a dataset TOL and VIF were calculatedby using the following equations
TOL = 1minusR2j (5)
VIF =1
TOL (6)
Remote Sens 2020 12 2833 13 of 32
where R2j represent the regression value of j on other different variables in a dataset Thus in a general
way the multi-collinearity problem occurs when the tolerance value is lt010 or 020 and VIF value isgt5 or 10
26 Methods for Gully Erosion Susceptibility
261 Artificial Neural Network (ANN)
ANN is a type of machine learning model in which human minds can work in a precise way andhave always been the inspiration for it [7879] In general it is a non-linear statistical data analysismodel ANN has various algorithms to analyze and predict the statistical dataset including multilayerperception (MLP) which is the most up-to-date algorithm for this machine learning model [80]The ANN model is more advanced than conventional statistical methods and involves some basicknowledge of the structure of input data and the nature of the relationship between variablesie linear or non-linear [81] In the MLP algorithm of the ANN model there are three layersnamely the input layer hidden layer and output layer [81] The information of a data structure ismeasured by nodes of hidden layers if the input layers are not sufficiently involved to do so [52] In thiscase the input layers such as the various GECFs and the gully erosion training points are connected tothe output layer After that the input and hidden layer systematically predict the model structure of theinput nodes and evaluates the result in a dynamic function [82] In the ANN model there is a structuredcode that determines the input and output nodes In each pixel the output nodes are equivalent tothe Boolean value ie 1 or 0 where 1 indicates the possibility of gully erosion and 0 indicates nopossibility of gully erosion Hidden layers are used to determine the trial and error of the model [83]The back propagation algorithm for ANN was discussed in the following equations [84]
netlj(t) =
sump
i=o(yiminus1
i (t)wlji(t)) (7)
The net input of the jth neuron of layer l and I iteration
ylj(t) = f (net(l)j (t) (8)
f (net) =1
1 + e(minusnet) (9)
e j(t) = c j(t) minus a j(t) (10)
δlj(t) = el
j(t)a j(t)[1minus a jx(t)
] (11)
The δ factor for the neuron jth in the output layer ith
δlj(t) = yl
j(t)[1minus y j(t)
]sumδl
j(t)w(l+1)kj (t) (12)
The δ factor for the neuron jth in the hidden layer ith
wlji(t + 1) = wl
ji(t) + α[wl
ji(t) minuswlji(tminus 1)
]+ nδ(l)j (t)y(lminus1)
j (t) (13)
where α represents the momentum rate and n represents the learning rate
262 General Linear Model (GLM)
GLM is a statistical probability method with a logit function and it is extensively used for differentnatural hazardsrsquo modeling [5585] The GLM (logistic regression) is the modified version of the classicgeneral linear regression model [8286] The GLM was first introduced by Nelder and Wedderburnin 1972 [87] The function of GLM is much simpler therefore it is widely used in the broad sense of
Remote Sens 2020 12 2833 14 of 32
statistical analysis [88] The link function (ie identity and logistic) between the dependent variableand various independent variables are assumed by this statistical-based machine learning modelthrough a linear relationship [89] Depending on the existence or non-existence dataset GLM canproduce a binary data model using a logistic regression model [90] The logit link function in GLM isused for modelling a fractional response to handle the dataset of the binary value ie 0 and 1 [54]The function for GLM can be expressed as follows [91]
Y = Pr(y = 1) =eC0+C1X1+middotmiddotmiddot+CnXn
1 + eC0+C1X1+middotmiddotmiddot+CnXn (14)
where Y (logit) represents the probability of an event happening and it varies from 0 to 1 X1 Xn
indicates the values of different controlling factors and C1 Cn indicates their coefficient
263 Maximum Entropy (MaxEnt)
MaxEnt is a predictive model and is developed on the basis of the principle of entropymaximization [92] The principle of entropy maximization is based on the statistical and informationtheory associated with this principle it also provides an appropriate estimate of the uncertain probabilitydistribution [93] It is also said that from all probabilistic constraints the MaxEnt model choosesthe one with the highest entropy [92] MaxEnt is a widely used machine learning model based onthe presence-only features [94] The presence-only feature has significance for the machine learningmodel because it is far more trustworthy for inaccessible areas [95] MaxEnt generally found for anunidentified target allocation and true distribution (π) over all the pixels in the arearsquos location of Xcomprised by individual pixels x [96] In this study of GESM modelling the MaxEnt model wasexpected to identify the gully occurrence probability distribution at the arearsquos location of X A briefstatistical explanation of the MaxEnt model can be found in [949798] with the following equation
P(y = 1∣∣∣x) = P(x
∣∣∣y = 1)P(y = 1)
P(x) (15)
where P(y = 1∣∣∣x) represents the probability of the gully being present at the location of x
where P(x∣∣∣y = 1) represents being at the site of given x P(y = 1) is the overall prevalence and P(x) is
the probability of picking the location x The above equation can also be rewritten as follows
P(y = 1∣∣∣x) = π(x)P(y = 1)|x| (16)
The calculation of P(x) can also be done by the probability distribution of marginalizing such as
P(x) =sum
yP(x y) = P(x
∣∣∣y = 1)P(y = 1) + P(x∣∣∣y = 0)P(y = 0) (17)
The generative model basically deals with P(x y) and P(y) The simplest equation for the equalprobability (P (y = 0) = P (y = 1) = 05) of MaxEnt is as follows
P(y = 1∣∣∣x) = P(x
∣∣∣y = 1)
P(x∣∣∣y = 1) + (P(x
∣∣∣y = 0) (18)
264 Support Vector Machine (SVM)
SVM was introduced by Vapnik and Chervonenk is in the year of 1963 It is a supervised machinelearning method based on the principle of statistical learning and structural risk minimization [99]In both fields ie classification and regression SVM can be used to resolve statistical data [100]Basically it was used for a variety of classification functions along with error analysis and generalizationof the overall function [101] SVM will generally find the hyperplane to distinguish between the two
Remote Sens 2020 12 2833 15 of 32
classes in this case gully and non-gully datasets [102] The optimal hyper plane and training datasetare closer to each other and called the support vectors [103] Two concepts are employed in SVMmodelling on statistically induced problems The very first is to separate statistical data patterns byusing a linear hyperplane separation The second is to convert non-linear data patterns to linearlyseparable data patterns using kernel functions [104]
Two SVM modelling classes were described in the following section [105106] Regard as a setof linear separate training vectors xi(i = 1 2 n) Training vectors have two classes ie yi = plusmn1The primary aim of the SVM is to look for an n-dimensional hyperplane which differentiates twoclasses by using the maximum gap This can be written as
12||W||2 (19)
The following constraints of the subject are
yi = ((wxi) + b ge 1 (20)
where ||W|| represents the hyperplane b represents the scalar base and () represents the scalar productThe cost function of SVM can be defined by using the Lagrangian multiplier such as
L =12||W||2 minus
sumn
i=1λi(yi(((wxi) + b) minus 1 (21)
where λi represents the Lagrangian multiplier In the case of the non-separable function the constraintscan be modified by introducing slack variables
yi((wxi) + b ge 1minus ζi (22)
Finally the equation becomes as follows
L =12||W||2 minus
1vn
sumn
i=1ζi (23)
where v (0 1) is generated in order to account for misclassification [107] In addition to this the kernelfunction K
(xi x j
)was introduced by Vapnik in the year of 1995 as an explanation for the non-linear
decision boundary
27 Measuring the Importance of GECFs by the Jackknife Test
In this study the jackknife test [108] was employed to evaluate which GECFs have the strongestconsequences on the GESM predictive outcome In general the jackknife test was used to betterunderstand the pattern of gully erosion In particular the AUC-based statistical coefficient is reliableon the jackknife test which accepts practical problems in a broader sense [109] This test identifiedthe most important conditioning factors in a particular model and calibrated all parameters [110]Therefore the jackknife test finds the major conditioning factors of gully erosion patterns by AUCThe percentage of the relative decrease (PRD) of the AUC was used for the analysis of the contributingfactors The equation of PRD is as follows [111]
PRDi = 100 lowast[AUCall minusAUCi]
AUCall (24)
where AUCall represents the AUC value calculated from the prediction by every factor AUCi is theindividual factor value and PRDi is the relative decrease of AUC in the percentage when the ith factorhas been removed from the whole prediction analysis
Remote Sens 2020 12 2833 16 of 32
28 Validation and Accuracy Assessment
The validation and evaluation of the accuracy assessment of GESM is very much importantotherwise the final output result has less significance Thus it is necessary to validate all machinelearning models in this case ANN SVM MaxEnt and GLM have been validated to get better resultsand analysis The area under the receiver operating characteristic (AUROC) curve is a standardtool that is widely used to establish the accuracy of the model [112] The AUROC method has beenwidely used to evaluate the accuracy of several natural hazard susceptibility mappings [11113]The ROC curve is based on two terms ie events and non-event phenomena therefore this curve istwo-dimensional [114] The ROC curve plotted on the X-axis known as the sensitivity based on thefalse positive rate and the Y-axis known as the 1-speficity based on the true positive rate Generallythe sensitivity detects gullies and the specificity detects non-gullies accurately and in both casesthe optimum value is 1 [115] The AUC value ranges between 05 (represents poor performance)and 10 (represents good performance) The accuracy of AUC values were classified into four levelsie poor fair good and excellent and their ranges are 06 to 07 07 to 08 08 to 09 and 09 to 10respectively [116] In this study ROC curves were plotted on the basis of both datasets ie training andvalidation points Here 5050 6040 7030 8020 and 9010 split were used for GESM The followingequations were used to complete the ROC curve
Sensitivity =TP
TP + FN (25)
Speci f icity =TN
FP + TN (26)
AUC =(sum
TP +sum
TN)
(P + N) (27)
where TP represents the true positive FN represents the false negative TN represents thee true negativeFP represents the false positive P indicates the number of total gullies and N indicates the number oftotal non-gullies
3 Results
31 Multi-Collinearity Assessment
Here a multi-collinearity assessment was conducted in order to select the appropriate factorsfor gully erosion susceptibility modelling In order to maintain the accuracy of the predicted modelsand free them from bias it was estimated that the VIF and TOL values would select the appropriateparameters without any problems with multi-collinearity The ranges of TOL and VIF are 0231 to 0923and 1079 to 4749 respectively The ranges of VIF and TOL are far from the permissible thresholdso there is no problem with multi-collinearity in this analysis The details of the multi-collinearity ofall selected parameters are shown in Table 4
32 Gully Erosion Susceptibility Modelling
Gully erosion susceptibility was estimated by considering the ANN GLM MaxEnt and SVMmachine learning algorithms for this region The overall data were randomly divided into differentratios (9010 8020 7030 6040 and 5050) as training and validation data to estimate the outcomeof all predicted models with optimum accuracy The all output raster of the susceptibility map wasreclassified into different qualitative classes (very high high moderate low and very low) consideringJenksrsquo natural break classifier technique in the GIS environment
Remote Sens 2020 12 2833 17 of 32
321 Gully Erosion Susceptibility Modelling Using Artificial Neural Network (ANN)
The GESMs were prepared by using the ANN method in different sample ratios as training andvalidation data In ANN the overall data was randomly classified as training and validation data indifferent ratios (9010 8020 7030 6040 and 5050) The areal percentage in the ANN (9010 ratio)model for very low low moderate high and very high gully erosion susceptible areas are 40523527 1101 65 and 67 respectively (Figures 5a and 6a) In the case of the ANN (8020 ratio)model the areal coverage for very low low moderate high and very high gully erosion susceptibleareas are 6447 390 430 813 and 1924 respectively (Figure 5b) In the ANN (7030 ratio)model the areal percentage of very low low moderate high and very high gulling susceptibleareas are 2787 3702 1505 948 and 1057 respectively (Figure 5c) The areal coveragepercentage in the ANN (6040 ratio) model for very low low moderate high and very high gullyerosion susceptible areas are 3909 2394 1375 1023 and 1299 respectively (Figure 5d)The areal coverage in the ANN (5050 ratio) model for very low low moderate high and very highgully erosion susceptible areas are 4407 905 852 1914 and 1921 respectively (Figure 5e)
322 Gully Erosion Susceptibility Modelling Using the General Linear Model (GLM)
The GESMs was prepared by using the GLM method in different sample sizes (random partitioningof the samples) as training and validation data In GLM the overall data was randomly classifiedas training and validation data in different ratios (9010 8020 7030 6040 and 5050) The arealpercentage in the GLM (9010 ratio) model for very low low moderate high and very high gully erosionsusceptible areas are 2393 2310 2119 1778 and 1392 respectively (Figures 6b and 7a)The areal percentage in the GLM (8020 ratio) model for very low low moderate high and very highgully erosion susceptible areas are 2519 2276 2046 1681 and 1477 respectively (Figure 6b)The areal percentage in the GLM (7030 ratio) model for very low low moderate high and very highgully erosion susceptible areas are 2444 2318 2074 1679 and 1486 respectively (Figure 6c)The areal percentage in the GLM (6040 ratio) model for very low low moderate high and very highgully erosion susceptible areas are 2473 2283 2037 1747 and 1459 respectively (Figure 6d)The areal percentage in the GLM (5050 ratio) model for very low low moderate high and very highgully erosion susceptible areas are 2544 2339 2057 1615 and 1447 respectively (Figure 6e)
Figure 5 Gully erosion susceptibility mapping using the ANN model (a) 5050 (b) 6040 (c) 7030(d) 8020 and (e) 9010
Remote Sens 2020 12 2833 18 of 32
Table 4 Multi-collinearity analysis of the gully conditioning factors
Conditioning FactorsCollinearity Statistics
Tolerance VIF
TPI 0923 1079HAND 0921 1118Valley depth 0916 1124Lithology 0915 1127Land use 0888 1279RSP 0823 1483Bulk density 0813 1492Distance from road 0778 1532Soil texture 0754 1611Plan 0745 1721Distance from stream 0743 1865Mineral Soil 0739 1897Slope 0728 1932Drainage density 0425 2364TRI 0387 2624Elevation 0346 2715Aspect 0345 2817Silt 0233 3534Clay 0313 3696Sand 0231 4749
Figure 6 Gully erosion susceptibility mapping using the GLM model (a) 5050 (b) 6040 (c) 7030(d) 8020 (e) 9010
Remote Sens 2020 12 2833 19 of 32
Figure 7 Gully erosion susceptibility mapping using the MaxEnt model (a) 5050 (b) 6040 (c) 7030(d) 8020 (e) 9010
323 Gully Erosion Susceptibility Modelling Using Maximum Entropy (MaxEnt)
The GESMs were prepared by using the MaxEnt method in different sample sizes as training andvalidation data In MaxEnt the overall data was randomly classified as training and validation data indifferent ratios (9010 8020 7030 6040 and 5050) The areal percentage in the MaxEnt (9010 ratio)model for very low low moderate high and very high gully erosion susceptible areas are 21812330 2250 1965 and 1375 respectively (Figures 6c and 8a) The areal percentage in theMaxEnt model (8020 ratio) is 2394 2310 2105 1761 and 1430 respectively for very lowmoderate high and very high gully erosion susceptible areas (Figure 7b) The areal percentage in theMaxEnt (7030 ratio) model for very low low moderate high and very high gully erosion susceptibleareas are 2232 2180 2214 1981 and 1393 respectively (Figure 7c) The areal percentagein the MaxEnt (6040 ratio) model for very low low moderate high and very high gully erosionsusceptible areas are 2251 2129 2202 2029 and 1390 respectively (Figure 7d) The arealpercentage in the MaxEnt (5050 ratio) model for very low low moderate high and very high gullyerosion susceptible areas are 2339 2214 2263 1795 and 1389 respectively (Figure 7e)
324 Gully Erosion Susceptibility Modelling Using Support Vector Machine (SVM)
The GESMs were prepared by using the SVM method in different sample sizes as training andvalidation information In SVM the overall data was randomly classified as training and validationdata in different ratios (9010 8020 7030 6040 and 5050) The areal percentages in the SVM(9010 ratio) model for very low low moderate high and very high gully erosion susceptible areas are2989 2078 1832 1599 and 1502 respectively (Figure 8a) The areal percentages in the SVM(8020 ratio) model for very low low moderate high and very high gully erosion susceptible areas are3066 2098 1756 1594 and 1486 respectively (Figures 8b and 9d) The areal percentages in
Remote Sens 2020 12 2833 20 of 32
the SVM (7030 ratio) model for very low low moderate high and very high gully erosion susceptibleareas are 2915 2081 1841 1655 and 1508 respectively (Figure 8c) The areal percentages inthe SVM (6040 ratio) model for very low low moderate high and very high gully erosion susceptibleareas are 2829 2124 1845 1664 and 1538 respectively (Figure 8d) The areal percentages inthe SVM (5050 ratio) model for very low low moderate high and very high gully erosion susceptibleareas are 2881 2145 1823 1603 and 1548 respectively (Figure 8e)
Figure 8 Gully erosion susceptibility mapping using the SVM model (a) 5050 (b) 6040 (c) 7030(d) 8020 (e) 9010
Figure 9 Area percent classes in the ANN (a) GLM (b) MaxEnt (c) and SVM (d) model
Remote Sens 2020 12 2833 21 of 32
33 Assessing the Importance of the Factors
The importance of the variables for estimating the GESMs was estimated with the help of thejackknife AUC values The maximum importance variables for gully erosion susceptibility are thetopography position index (TPI) relative slope position (RSP) valley depth height above nearestdrainage (HAND) land use drainage density distance from river plan curvature and distancefrom road respectively The lowest importance variables for gully erosion susceptibility are lithologysand content soil texture slope and elevation (Figure 10) The maximum and minimum importancevariables for gully erosion susceptibility are the topography position index and lithology with AUCvalues of 067 and 052 respectively This type of assessment is helpful to estimate the importance ofthe variables and the influences of it in a dynamic way
Figure 10 Jackknife test for important factors
34 Validation of the Models
The accuracy of all predicted models was measured with the help of the area under curve (AUC)of the receiver operating characteristics (ROC) curve It is a reliable tool for the accurate estimation ofmodel performance In the ANN model the AUC values for the training datasets of 9010 8020 70306040 and 5050 are 0885 0910 0872 0917 and 0918 respectively (Figure 11) In the ANN modelthe AUC values for the validation datasets of 9010 8020 7030 6040 and 5050 random partition are0867 0804 0837 0825 and 0868 respectively (Figure 12)
Remote Sens 2020 12 2833 22 of 32
Figure 11 Area under the curve based on training datasets in the ANN (a) MaxEnt (b) SVM (c)and GLM (d) model
Figure 12 Area under the curve based on validation datasets in the ANN (a) MaxEnt (b) SVM (c)and GLM (d) model
In the case of the GLM model the AUC values for the training datasets of 9010 8020 7030 6040and 5050 random partitioning are 0826 0834 0837 0813 and 0833 respectively In the GLM modelthe AUC values for the validation datasets of 9010 8020 7030 6040 and 5050 random partition are0818 0788 0790 0837 and 0816 respectively
In the case of the MaxEnt model the AUC values for the training datasets of 9010 8020 70306040 and 5050 random partitioning are 0809 0821 0810 0786 and 0808 respectively In theMaxEnt model the AUC values for the validation datasets of 9010 8020 7030 6040 and 5050random partition are 0784 0764 0799 0819 and 0796 respectively
Remote Sens 2020 12 2833 23 of 32
In the case of the SVM model the AUC values for the training datasets of 9010 8020 7030 6040and 5050 random partitioning are 0870 0877 0875 0859 and 0866 respectively In the SVM modelthe AUC values for the validation datasets of 9010 8020 7030 6040 and 5050 random partition are0864 0819 0828 0835 and 0834 respectively
4 Discussion
Gully erosion is one of the common environmental issues caused by the natural environmentbut the mechanism for the formation and development of gullies can accelerate by anthropogenicactivities [2352] In the arid and semi-arid environment the formation and development of gulliesis the most problematic issue with global concerns that are related with ecological imbalances of theparticular environment The loss of fertile soil due to severe erosion not only reduces the amount of soilbut also reduces soil fertility and associated agricultural productivity [42] The climatic characteristicsof this region relate to the semi-arid semi-humid and Mediterranean nature The impact of extremeclimatic conditions is therefore significant and has an impact on the large-scale erosion in the form ofgullies The formation and development of gullies is caused by different environmental conditions andtheir importance should be analyzed for appropriate modelling and management purposes [117]
The unpredictability of each outcome is mainly due to mechanisms beyond the researcherrsquosinfluence Predictive accuracy is mostly based on the instability of both the quality of the data and theselection of the model [118] Multiple factors can also be attributed to the unpredictability of gullyerosion vulnerability models (i) Insufficient experience of the physical environment and its associatedmechanism which must be analyzed (ii) the distance over which the analysis can indeed be performedin each of these time or space (iii) the randomization of the estimation method for the development ofa model where gullies exist or are lacking and (iv) an approximation for some computational methodfor the physical phenomenon [119] In this work our main objective was to highlight the susceptibleareas with lees or marginal uncertainty within the predicted models
In todayrsquos research the application of different machine learning algorithms is one of the reliablepredicting tools for predicting the susceptibility of various natural hazards and disasters For thispurpose different machine learning algorithms have been developed by different decision scienceresearchers In this regard the spatial perspective of decision-making was considered to be the mostreliable component in the various disciplines Various machine learning models (eg ANN GLMMaxEnt and SVM) are used in this study to estimate areas susceptible to gully erosion In orderto estimate results for better accuracy the training and validation data were randomly dividedinto different quantities (eg 9010 8020 7030 6040 and 5050) ANN 5050 is the best trainingand validation dataset model although all models are associated with higher accuracy Accordingto the training datasets apart from the ANN 5050 other optimal models are ANN 6040 (0917)ANN 8020 (0910) and ANN 9010 (0885) According to the validation datasets the most optimalmodel is ANN 5050 (0868) and other optimal models are ANN 9010 (0867) SVM 9010 (0864) andANN 7030 (0837) The importance of all conditioning factors was estimated with the help of thejackknife test from the MaxEnt model Jackknife checks the individual gully erosion conditional factorrsquossignificance in the creation of the predicted models relative to all conditioning factors (red bars) foreach predictor variable alone (blue bars) and the decrease in the training benefit when the variable isexcluded from the overall model (navy green bars) The topography position index (TPI) relative slopeposition (RSP) valley depth and height above nearest drainage (HAND) were recorded consistently asthe key determinants of gully erosion as also was the case in similar research [50120ndash122] The AUCvalues in the jackknife test of TPI RSP valley depth and HAND are 067 0665 065 and 064respectively Apart from this the lower importance is associated with geological components likelithology (052) in gully erosion susceptibility modelling The variable importance of other conditionfactors ie aspect bulk density clay content elevation drainage density distance from streamland use mineral soil plan curvature distance from road sand silt slope soil texture and TRIare 058 056 0615 062 0635 063 0635 0585 0625 062 054 0575 0565 0552 and 0575
Remote Sens 2020 12 2833 24 of 32
respectively From an evaluative point of view the topographic indices themselves are not attributesthat could be integrated with erosion at the same time Strategic planners are therefore unable to startestimating soil erosion susceptibility on the basis of topographic indices As a result not only is thespatial dimension of erosion shown in the form of gullies but it is also capable of giving us a theoreticalframework and its associated causendasheffect relationship between variables and associated erosionApart from this the topographic variables may influence other factors of the condition that may havean influential role in the process of erosion In this analysis the maximum values of the TPI are mostfavorable for the development of large- and medium-sized gullies in the Golestan Dam Watershed as awhole The relative slope position is one of the dominant factors in the control of pedogeomorphicprocesses and associated erosion Higher valley depth is an important factor that directly acceleratesthe rate of large-scale erosion In the wet season the higher depth of the valley is recommended tosevere erosion in the form of gullies where rainfall and its associated runoff can play an essential rolein this respect Rainfall with high kinetic energy is associated with extensive erosion in most of thearid and semi-arid environments It is also responsible for chemical weathering which has an indirecteffect on the rate of formation and development of the gully This process confirms the transformationof the various minerals into secondary minerals In this region the process of water-induced erosion isaccelerating to a height above the nearest drainage point It is capable of controlling and determiningriver activity and associated erosion where primary direction and orientation play a vital role in theerosion process The presence of vegetation in this region is very marginal in nature and only asmall part of the area is associated with agricultural activity indicating the presence of bare soil andmountain topography with higher slopes This association is most favorable to large-scale erosion invarious forms of erosion eg the creation and development of rills and gullies etc The absence ofvegetation cover helps to create the maximum amount of runoff which is directly and indirectly linkedwith erosion and its associated sedimentation Higher amounts of rainfall and runoff indicated thegreeter probability of erosion in any region The maximum amount of the drainage network and theexistence of gullies are positively linked with each other The effects of rainfall and drainage during thewet season are not only favorable to the development of new gullies but are also responsible for theexpansion of existing gullies The formation of ephemeral gullies during the wet season is one of themain causes of serious erosion and loss of topsoil The creation of ephemeral gullies and the associatedloss of soil is a major problem in any arid and semi-arid environment Furthermore the impact ofthe road network is the result of the anthropogenic destruction of natural hydrological processesestablishing impervious soil surfaces accumulates runoff and results in large-scale soil erosion [41]
The erosion-prone gulling areas of this region were successfully assessed with an appropriatealgorithm and random partitioning of the samples in order to maintain optimum accuracyPrediction model accuracy was disturbed by a non-linear relationship which is complex innature [123124] Due to its role in the representation and disclosure of hidden properties and interactionsANNs implemented in an appropriate manner can provide a robust replacement [112125126]In contrast to any conventional simulation ANN also has no limitations on the source and residualproportions [127128] The fault and lack of information can be resolved by ANN and the presence ofthis type of inadequacy is capable of predicting the scenario with higher accuracy [129]
Models Prioritization
The final task was to select the optimal models according to their performance and relatedaccuracy level For this purpose the prioritization of all predicted models for both training andvalidation databases was carried out with regard to the performance and robustness of accuracyThe prioritization method is generally used as a sub-catchment priority in morphometric studies withthe consideration of different elements [130] The same method was considered for the selection of theoptimal model and the categorization of the models by performance Based on training datasets thatconsider AUC values the most optimal model is ANN 5050 (0918) followed by ANN 6040 (0917)ANN 8020 (0885) ANN 9010 (0885) SVM 8020 (0877) SVM 7030 (0872) SVM 9010 (087)
Remote Sens 2020 12 2833 25 of 32
SVM 5050 (0866) SVM 6040 (0859) GLM 7030 (0837) GLM 8020 (0834) GLM 5050 (0833)GLM 9010 (0826) MaxEnt 8020 (0821) GLM 6040 (0813) MaxEnt 7030 (0810) MaxEnt 9010 (0809)MaxEnt 5050 (0808) and MaxEnt 6040 (0786) Based on the validation datasets considering AUCvalues the most optimal model is ANN 5050 (0868) followed by ANN 9010 (0867) SVM 9010 (0864)GLM 6040 (0837) ANN 7030 (0837) SVM 6040 (0835) SVM 5050 (0834) SVM 7030 (0828)ANN 6040 (0825) MaxEnt 6040 (0819) SVM 8020 (0819) GLM 9010 (0818) GLM 5050 (0816)ANN 8020 (0804) MaxEnt 7030 (0799) MaxEnt 5050 (0796) GLM 7030 (079) GLM 8020 (0788)MaxEnt 9010 (0784) and MaxEnt 8020 (0764) (Table 5)
Table 5 Area under the curve values of training and validation data in different divisions
Row ModelsAUC Prioritizing
Training Validation Priority Basedon Training
Priority Basedon Validation
1 GLM 9010 0826 0818 14 102 GLM 8020 0834 0788 12 163 GLM 7030 0837 079 11 154 GLM 6040 0813 0837 16 45 GLM 5050 0833 0816 13 116 MaxEnt 9010 0809 0784 18 177 MaxEnt 8020 0821 0764 15 188 MaxEnt 7030 081 0799 17 139 MaxEnt 6040 0786 0819 20 9
10 MaxEnt 5050 0808 0796 19 1411 ANN 9010 0885 0867 4 212 ANN 8020 091 0804 3 1213 ANN 7030 0872 0837 7 414 ANN 6040 0917 0825 2 815 ANN 5050 0918 0868 1 116 SVM 9010 087 0864 8 317 SVM 8020 0877 0819 5 918 SVM 7030 0875 0828 6 719 SVM 6040 0859 0835 10 520 SVM 5050 0866 0834 9 6
5 Conclusions
This region is severely confronted with the extreme problem of land degradation in differentforms of erosion like the formation of rills gullies etc That is why not only the economy of this regionis affected but the natural environment and its associated ecosystem are also affected a number of timesApart from large-scale erosion construction such as roads rail and bridges is also associated withlarge-scale erosion Various machine learning approaches with random sample partitioning have beenmade to estimate the most accurate vulnerable regions with maximum possible accuracy The mainobjective of this research was to determine the optimal model of gully erosion susceptibility in thisregion and the development of conceptual backgrounds for the orientation and partitioning of thedata for prediction with maximum accuracy Apart from this with the random partitioning of thetraining and validation datasets we are able to know the data handling model nature and its associatedoptimal capacity In this research the ANN (5050) is the most optimal model for both training andvalidation data sets The second and third optimal model considering the validation datasets wereANN 9010 and SVM 9010 respectively Though the ANN model in different random partitioningwas not capable of estimation with maximum accuracy This approach should be applicable in anypart of the world with different climatic conditions The role of the gully erosion conditioning factorsis very much optimistic for the creation and development of gullies In this region the importanceof the topographic parameters is the maximum for susceptibility to gully erosion compared to otherparameters Apart from secondary sources an extensive field visit was carried out to validate the
Remote Sens 2020 12 2833 26 of 32
entire modelsrsquo outcome in a more precise way The nature of the erosion and its impact on society wasalso identified at the time of the field visit The impact of erosion in agricultural resources and the roleof the stakeholders are the most conflicting issues in terms of sustainable land management practicesAccording to the ANN 5050 model 3687 of the area of this watershed is associated with very highto moderate gully erosion susceptible zones Most of the erosion-prone areas of this region are locatednear the drainage network So special watershed management strategies have to be incorporatedin the vulnerable regions to escape this type of situation It may be helpful to develop a conceptualbackground based on a theoretical perspective on the erosion of the gully which may be applicable indifferent regions Obviously this type of outcome should be useful and applicable to decision-makersand local stakeholders in order to avoid this kind of serious problem by considering appropriatemeasures The contribution and task of future research is to develop a model with the appropriatemodification of the algorithm and partitioning of the samples and to link it to the socio-politicalenvironmental dilemma
Author Contributions Conceptualization AA Methodology AA formal analysis AA OANinvestigation AA resources AA supervision AA writingmdashoriginal draft preparation AA SCP RC ASwritingmdashreview and editing AA SCP RC AS SL OAN BP DTB All authors have read and agreed tothe published version of the manuscript
Funding This research received no external funding
Acknowledgments This research was supported by the Basic Research Project of the Korea Institute of Geoscienceand M ineral Resources (KIGAM) and Project of Environmental Business Big Data Platform and Center Constructionfunded by the Ministry of Science and ICT
Conflicts of Interest The authors declare no conflict of interest
References
1 Magliulo P Assessing the susceptibility to water-induced soil erosion using a geomorphologicalbivariate statistics-based approach Environ Earth Sci 2012 67 1801ndash1820 [CrossRef]
2 Arabameri A Pradhan B Rezaei K Yamani M Pourghasemi HR Lombardo L Spatial modelling ofgully erosion using evidential belief function logistic regression and a new ensemble of evidential belieffunctionndashlogistic regression algorithm Land Degrad Dev 2018 29 4035ndash4049 [CrossRef]
3 Pal SC Chakrabortty R Simulating the impact of climate change on soil erosion in sub-tropical monsoondominated watershed based on RUSLE SCS runoff and MIROC5 climatic model Adv Space Res 2019 64352ndash377 [CrossRef]
4 Pal SC Chakrabortty R Modeling of water induced surface soil erosion and the potential risk zone predictionin a sub-tropical watershed of Eastern India Modeling Earth Syst Environ 2019 5 369ndash393 [CrossRef]
5 Pal SC Shit M Application of RUSLE model for soil loss estimation of Jaipanda watershed West BengalSpat Inf Res 2017 25 399ndash409 [CrossRef]
6 Lal R Societal value of soil carbon J Soil Water Conserv 2014 69 186Andash192A [CrossRef]7 Renard K Yoder D Lightle D Dabney S 8 Universal Soil Loss Equation and Revised Universal Soil Loss
Equation In Handbook of Erososion Modelling Morgan RPC Nearing M Eds Wiley Hoboken NJ USA2011 Volume 137
8 Bobe BW Evaluation of Soil Erosion in the Harerge Region of Ethiopia Using Soil Loss Models RainfallSimulation and Field Trials PhD Thesis University of Pretoria Pretoria South Africa 2005
9 Karimzadeh H Alizadeh M Spatial estimation of soil erosion in Iran using RUSLE modelIran J Ecohydrol 2018 [CrossRef]
10 Arabameri A Chen W Loche M Zhao X Li Y Lombardo L Cerda A Pradhan B Bui DT Comparison ofmachine learning models for gully erosion susceptibility mapping Geosci Front 2019 [CrossRef]
11 Arabameri A Rezaei K Pourghasemi HR Lee S Yamani M GIS-based gully erosion susceptibilitymapping A comparison among three data-driven models and AHP knowledge-based techniqueEnviron Earth Sci 2018 77 628 [CrossRef]
12 Arabameri A Pradhan B Rezaei K Conoscenti C Gully erosion susceptibility mapping using GIS-basedmulti-criteria decision analysis techniques Catena 2019 180 282ndash297 [CrossRef]
Remote Sens 2020 12 2833 27 of 32
13 Torri D Poesen J Borselli L Bryan R Rossi M Spatial variation of bed roughness in eroding rills andgullies Catena 2012 90 76ndash86 [CrossRef]
14 Zhang X Fan J Liu Q Xiong D The contribution of gully erosion to total sediment production in a smallwatershed in Southwest China Phys Geogr 2018 39 246ndash263 [CrossRef]
15 Rahmati O Tahmasebipour N Haghizadeh A Pourghasemi HR Feizizadeh B Evaluation of differentmachine learning models for predicting and mapping the susceptibility of gully erosion Geomorphology 2017298 118ndash137 [CrossRef]
16 Nampak H Pradhan B Mojaddadi Rizeei H Park H Assessment of land cover and land use changeimpact on soil loss in a tropical catchment by using multitemporal SPOT-5 satellite images and R evised Universal Soil L oss E quation model Land Degrad Dev 2018 29 3440ndash3455 [CrossRef]
17 Saha A Ghosh M Pal SC Understanding the Morphology and Development of a Rill-Gully An EmpiricalStudy of Khoai Badland West Bengal India In Gully Erosion Studies from India and Surrounding RegionsSpringer Cham Switzerland 2020 pp 147ndash161
18 Imeson A Kwaad F Gully types and gully prediction Geografisch Tijdschrift 1980 14 430ndash44119 Poesen J Contribution of gully erosion to sediment production In Erosion and Sediment Yield Global and
Regional Perspectives Proceedings of the International Symposium Exeter UK 15ndash19 July 1996 Walling DEWebb B Eds IAHS Wallingford UK 1996 p 251
20 Arabameri A Pradhan B Rezaei K Spatial prediction of gully erosion using ALOS PALSAR data andensemble bivariate and data mining models Geosci J 2019 23 669ndash686 [CrossRef]
21 Kong B Yu H Estimation model of soil freeze-thaw erosion in Silingco watershed wetland of northernTibet Sci World J 2013 2013 636521 [CrossRef]
22 Guerra AJT Fullen MA Jorge MdC Bezerra JFR Shokr MS Slope processes mass movement andsoil erosion A review Pedosphere 2017 27 27ndash41 [CrossRef]
23 Arabameri A Pradhan B Pourghasemi HR Rezaei K Kerle N Spatial Modelling of Gully ErosionUsing GIS and R Programing A Comparison among Three Data Mining Algorithms Appl Sci 20188 1369 [CrossRef]
24 Kirkby M Bracken L Gully processes and gully dynamics Earth Surf Process Landf J Br Geomorphol ResGroup 2009 34 1841ndash1851 [CrossRef]
25 Daba S Rieger W Strauss P Assessment of gully erosion in eastern Ethiopia using photogrammetrictechniques Catena 2003 50 273ndash291 [CrossRef]
26 Gomez Gutierrez A Schnabel S Feliciacutesimo AacuteM Modelling the occurrence of gullies in rangelands ofsouthwest Spain Earth Surf Process Landf J Br Geomorphol Res Group 2009 34 1894ndash1902 [CrossRef]
27 Garosi Y Sheklabadi M Conoscenti C Pourghasemi HR Van Oost K Assessing the performance ofGIS-based machine learning models with different accuracy measures for determining susceptibility to gullyerosion Sci Total Environ 2019 664 1117ndash1132 [CrossRef]
28 Arabameri A Yamani M Pradhan B Melesse A Shirani K Bui DT Novel ensembles of COPRASmulti-criteria decision-making with logistic regression boosted regression tree and random forest for spatialprediction of gully erosion susceptibility Sci Total Environ 2019 688 903ndash916 [CrossRef]
29 Seber GA Lee AJ Linear Regression Analysis John Wiley amp Sons Hoboken NJ USA 2012 Volume 329ISBN 1-118-27442-3
30 Arabameri A Pourghasemi HR Spatial modeling of gully erosion using linear and quadraticdiscriminant analyses in GIS and R In Spatial Modeling in GIS and R for Earth and Environmental SciencesElsevier Amsterdam The Netherlands 2019 pp 299ndash321
31 Arabameri A Pourghasemi HR Yamani M Applying different scenarios for landslide spatial modelingusing computational intelligence methods Environ Earth Sci 2017 76 832 [CrossRef]
32 Arabameri A Lee S Tiefenbacher JP Ngo PTT Novel Ensemble of MCDM-Artificial IntelligenceTechniques for Groundwater-Potential Mapping in Arid and Semi-Arid Regions (Iran) Remote Sens 202012 490 [CrossRef]
33 Kujawski E Multi-Criteria Decision Analysis Limitations Pitfalls and Practical Difficulties 2003 Lawrence BerkeleyNational Laboratory Berkley CA USA 2007
34 Reilly T Making Hard Decisions with Decision Tools Duxbury Thomson Learning Boston MA USA 2001ISBN 0-534-36597-3
Remote Sens 2020 12 2833 28 of 32
35 Conforti M Aucelli PPC Robustelli G Scarciglia F Geomorphology and GIS analysis for mapping gullyerosion susceptibility in the Turbolo stream catchment (Northern Calabria Italy) Nat Hazards 2011 56881ndash898 [CrossRef]
36 Rahmati O Tahmasebipour N Haghizadeh A Pourghasemi HR Feizizadeh B Evaluating the influenceof geo-environmental factors on gully erosion in a semi-arid region of Iran An integrated frameworkSci Total Environ 2017 579 913ndash927 [CrossRef]
37 Hosseinalizadeh M Kariminejad N Rahmati O Keesstra S Alinejad M Mohammadian Behbahani AHow can statistical and artificial intelligence approaches predict piping erosion susceptibilitySci Total Environ 2019 646 1554ndash1566 [CrossRef]
38 Zabihi M Mirchooli F Motevalli A Khaledi Darvishan A Pourghasemi HR Zakeri MA Sadighi FSpatial modelling of gully erosion in Mazandaran Province northern Iran Catena 2018 161 1ndash13 [CrossRef]
39 Azareh A Rahmati O Rafiei-Sardooi E Sankey JB Lee S Shahabi H Ahmad BB Modellinggully-erosion susceptibility in a semi-arid region Iran Investigation of applicability of certainty factor andmaximum entropy models Sci Total Environ 2019 655 684ndash696 [CrossRef] [PubMed]
40 Rahmati O Haghizadeh A Pourghasemi HR Noormohamadi F Gully erosion susceptibility mappingThe role of GIS-based bivariate statistical models and their comparison Nat Hazards 2016 821231ndash1258 [CrossRef]
41 Arabameri A Chen W Lombardo L Blaschke T Tien Bui D Hybrid Computational Intelligence Modelsfor Improvement Gully Erosion Assessment Remote Sens 2020 12 140 [CrossRef]
42 Roy P Chakrabortty R Chowdhuri I Malik S Das B Pal SC Development of Different MachineLearning Ensemble Classifier for Gully Erosion Susceptibility in Gandheswari Watershed of West BengalIndia In Machine Learning for Intelligent Decision Science Rout JK Rout M Das H Eds Algorithms forIntelligent Systems Springer Singapore 2020 pp 1ndash26 ISBN 9789811536885
43 Pourghasemi HR Yousefi S Kornejady A Cerdagrave A Performance assessment of individual and ensembledata-mining techniques for gully erosion modeling Sci Total Environ 2017 609 764ndash775 [CrossRef]
44 Amiri M Pourghasemi HR Ghanbarian GA Afzali SF Assessment of the importance of gully erosioneffective factors using Boruta algorithm and its spatial modeling and mapping using three machine learningalgorithms Geoderma 2019 340 55ndash69 [CrossRef]
45 Geissen V Kampichler C Loacutepez-de Llergo-Juaacuterez JJ Galindo-Acaacutentara A Superficial and subterraneansoil erosion in Tabasco tropical Mexico Development of a decision tree modeling approach Geoderma 2007139 277ndash287 [CrossRef]
46 Angileri SE Conoscenti C Hochschild V Maumlrker M Rotigliano E Agnesi V Water erosion susceptibilitymapping by applying Stochastic Gradient Treeboost to the Imera Meridionale River Basin (Sicily Italy)Geomorphology 2016 262 61ndash76 [CrossRef]
47 Hosseinalizadeh M Kariminejad N Chen W Pourghasemi HR Alinejad M Mohammadian Behbahani ATiefenbacher JP Gully headcut susceptibility modeling using functional trees naiumlve Bayes tree and randomforest models Geoderma 2019 342 1ndash11 [CrossRef]
48 Hosseinalizadeh M Kariminejad N Chen W Pourghasemi HR Alinejad M Mohammadian Behbahani ATiefenbacher JP Spatial modelling of gully headcuts using UAV data and four best-first decision classifierensembles (BFTree Bag-BFTree RS-BFTree and RF-BFTree) Geomorphology 2019 329 184ndash193 [CrossRef]
49 Gayen A Pourghasemi HR Spatial Modeling of Gully Erosion In Spatial Modeling in GIS and R for Earth andEnvironmental Sciences Elsevier Amsterdam The Netherlands 2019 pp 653ndash669 ISBN 978-0-12-815226-3
50 Saha S Roy J Arabameri A Blaschke T Tien Bui D Machine Learning-Based Gully Erosion SusceptibilityMapping A Case Study of Eastern India Sensors 2020 20 1313 [CrossRef]
51 Varshney KR Alemzadeh H On the safety of machine learning Cyber-physical systems decision sciencesand data products Big Data 2017 5 246ndash255 [CrossRef] [PubMed]
52 Arabameri A Asadi Nalivan O Saha S Roy J Pradhan B Tiefenbacher JP Thi Ngo PT Novel EnsembleApproaches of Machine Learning Techniques in Modeling the Gully Erosion Susceptibility Remote Sens2020 12 1890 [CrossRef]
Remote Sens 2020 12 2833 29 of 32
53 Javidan N Kavian A Pourghasemi HR Conoscenti C Jafarian Z Data Mining Technique (MaximumEntropy Model) for Mapping Gully Erosion Susceptibility in the Gorganrood Watershed Iran In Gully ErosionStudies from India and Surrounding Regions Shit PK Pourghasemi HR Bhunia GS Eds Advances inScience Technology amp Innovation Springer International Publishing Cham Switzerland 2020 pp 427ndash448ISBN 978-3-030-23242-9
54 Garosi Y Sheklabadi M Pourghasemi HR Besalatpour AA Conoscenti C Van Oost K Comparison ofdifferences in resolution and sources of controlling factors for gully erosion susceptibility mappingGeoderma 2018 330 65ndash78 [CrossRef]
55 Pourghasemi HR Rossi M Landslide susceptibility modeling in a landslide prone area in MazandarnProvince north of Iran A comparison between GLM GAM MARS and M-AHP methods Theor Appl Clim2017 130 609ndash633 [CrossRef]
56 De Reu J Bourgeois J Bats M Zwertvaegher A Gelorini V De Smedt P Chu W Antrop MDe Maeyer P Finke P et al Application of the topographic position index to heterogeneous landscapesGeomorphology 2013 186 39ndash49 [CrossRef]
57 Heerdegen RG Beran MA Quantifying source areas through land surface curvature and shape J Hydrol1982 57 359ndash373 [CrossRef]
58 Zevenbergen LW Thorne CR Quantitative analysis of land surface topography Earth Surf Process Landf1987 12 47ndash56 [CrossRef]
59 Nobre AD Cuartas LA Hodnett M Rennoacute CD Rodrigues G Silveira A Waterloo M Saleska SHeight Above the Nearest DrainagemdashA hydrologically relevant new terrain model J Hydrol 2011 40413ndash29 [CrossRef]
60 Horton RE Erosional development of streams and their drainage basins hydrophysical approach toquantitative morphology Geol Soc Am Bull 1945 56 275 [CrossRef]
61 Trigila A Iadanza C Esposito C Scarascia-Mugnozza G Comparison of Logistic Regression andRandom Forests techniques for shallow landslide susceptibility assessment in Giampilieri (NE Sicily Italy)Geomorphology 2015 249 119ndash136 [CrossRef]
62 Du G Zhang Y Iqbal J Yang Z Yao X Landslide susceptibility mapping using an integrated model ofinformation value method and logistic regression in the Bailongjiang watershed Gansu Province ChinaJ Mt Sci 2017 14 249ndash268 [CrossRef]
63 Amidon GE Secreast PJ Mudie D Particle Powder and Compact Characterization In Developing SolidOral Dosage Forms Elsevier Amsterdam The Netherlands 2009 pp 163ndash186 ISBN 978-0-444-53242-8
64 Rahmati O Moghaddam DD Moosavi V Kalantari Z Samadi M Lee S Tien Bui D An AutomatedPython Language-Based Tool for Creating Absence Samples in Groundwater Potential Mapping Remote Sens2019 11 1375 [CrossRef]
65 Gallant JC Austin JM Derivation of terrain covariates for digital soil mapping in Australia Soil Res 201553 895 [CrossRef]
66 Conoscenti C Agnesi V Angileri S Cappadonia C Rotigliano E Maumlrker M A GIS-based approach forgully erosion susceptibility modelling A test in Sicily Italy Environ Earth Sci 2013 70 1179ndash1195 [CrossRef]
67 Ahmad R Landslides Processes Prediction and Land Use Water Resources Monograph 18mdashBy Roy CSidle and Hirotaka Ochiai Nat Resour Forum 2007 31 322ndash323 [CrossRef]
68 Chakrabortty R Pal SC Sahana M Mondal A Dou J Pham BT Yunus AP Soil erosionpotential hotspot zone identification using machine learning and statistical approaches in eastern IndiaNat Hazards 2020 [CrossRef]
69 Garousi-Nejad I Tarboton DG Aboutalebi M Torres-Rua AF Terrain Analysis Enhancements tothe Height Above Nearest Drainage Flood Inundation Mapping Method Water Resour Res 2019 557983ndash8009 [CrossRef]
70 Horton RE Drainage-basin characteristics Trans AGU 1932 13 350 [CrossRef]71 Conoscenti C Angileri S Cappadonia C Rotigliano E Agnesi V Maumlrker M Gully erosion susceptibility
assessment by means of GIS-based logistic regression A case of Sicily (Italy) Geomorphology 2014 204399ndash411 [CrossRef]
72 Althuwaynee OF Pradhan B Park H-J Lee JH A novel ensemble bivariate statistical evidential belieffunction with knowledge-based analytical hierarchy process and multivariate statistical logistic regressionfor landslide susceptibility mapping Catena 2014 114 21ndash36 [CrossRef]
Remote Sens 2020 12 2833 30 of 32
73 Davoudi Moghaddam D Rahmati O Haghizadeh A Kalantari Z A Modeling Comparison ofGroundwater Potential Mapping in a Mountain Bedrock Aquifer QUEST GARP and RF ModelsWater 2020 12 679 [CrossRef]
74 Pourghasemi HR Kerle N Random forests and evidential belief function-based landslide susceptibilityassessment in Western Mazandaran Province Iran Environ Earth Sci 2016 75 185 [CrossRef]
75 El Maaoui MA Sfar Felfoul M Boussema MR Snane MH Sediment yield from irregularly shaped gullieslocated on the Fortuna lithologic formation in semi-arid area of Tunisia Catena 2012 93 97ndash104 [CrossRef]
76 Wang G Chen X Chen W Spatial Prediction of Landslide Susceptibility Based on GIS and DiscriminantFunctions IJGI 2020 9 144 [CrossRef]
77 Chen W Sun Z Han J Landslide Susceptibility Modeling Using Integrated Ensemble Weights of Evidencewith Logistic Regression and Random Forest Models Appl Sci 2019 9 171 [CrossRef]
78 Haykin S Neural Networks A Comprehensive Foundation 2nd ed Prentice Hall Englewood Cliffs NJ USA 199979 Cherkassky V Krasnopolsky V Solomatine DP Valdes J Computational intelligence in earth sciences
and environmental applications Issues and challenges Neural Netw 2006 19 113ndash121 [CrossRef]80 Kosko B Neural Networks and Fuzzy Systems A Dynamical Systems Approach to Machine Intelligence
Prentice Hall New York NY USA 199281 Mandal S Mondal S Statistical Approaches for Landslide Susceptibility Assessment and Prediction Springer
Cham Switzerland 2019 ISBN 978-3-319-93897-482 Falaschi F Giacomelli F Federici PR Puccinelli A DrsquoAmato Avanzi G Pochini A Ribolini A
Logistic regression versus artificial neural networks Landslide susceptibility evaluation in a sample area ofthe Serchio River valley Italy Nat Hazards 2009 50 551ndash569 [CrossRef]
83 Gong P Pu R Chen J Elevation and forest-cover data using neural networks Photogramm EngRemote Sens 1996 62 1249ndash1260
84 Hagan MT Demuth HB Beale MH De Jesus O Neural Network Design 2nd ed Amazon FulfillmentPoland Sp z oo Wrocław Poland 1996 ISBN 978-0-9717321-1-7
85 Lucagrave F Conforti M Robustelli G Comparison of GIS-based gullying susceptibility mapping using bivariateand multivariate statistics Northern Calabria South Italy Geomorphology 2011 134 297ndash308 [CrossRef]
86 McCullagh P Nelder J Generalized Linear Models 2nd ed Standard Book on Generalized Linear ModelsChapman and Hall London UK 1989
87 Nelder JA Wedderburn RW Generalized linear models J R Stat Soc Ser A (General) 1972 135370ndash384 [CrossRef]
88 Vorpahl P Elsenbeer H Maumlrker M Schroumlder B How can statistical models help to determine drivingfactors of landslides Ecol Model 2012 239 27ndash39 [CrossRef]
89 Maunder MN Punt AE Standardizing catch and effort data A review of recent approaches Fish Res2004 70 141ndash159 [CrossRef]
90 Naghibi SA Pourghasemi HR A comparative assessment between three machine learning models andtheir performance comparison by bivariate and multivariate statistical methods in groundwater potentialmapping Water Resour Manag 2015 29 5217ndash5236 [CrossRef]
91 Bernknopf RL Campbell RH Brookshire DS Shapiro CD A Probabilistic Approach to LandslideHazard Mapping in Cincinnati Ohio with Applications for Economic Evaluation Environ Eng Geosci1988 xxv 39ndash56 [CrossRef]
92 Woodbury A Render F Ulrych T Practical probabilistic ground-water modeling Ground Water 1995 33532ndash539 [CrossRef]
93 Phillips SJ Anderson RP Schapire RE Maximum entropy modeling of species geographic distributionsEcol Model 2006 190 231ndash259 [CrossRef]
94 Phillips SJ Dudiacutek M Modeling of species distributions with Maxent New extensions and a comprehensiveevaluation Ecography 2008 31 161ndash175 [CrossRef]
95 Reddy S Daacutevalos LM Geographical sampling bias and its implications for conservation priorities in AfricaJ Biogeogr 2003 30 1719ndash1727 [CrossRef]
96 Kornejady A Ownegh M Bahremand A Landslide susceptibility assessment using maximum entropymodel with two different data sampling methods Catena 2017 152 144ndash162 [CrossRef]
Remote Sens 2020 12 2833 31 of 32
97 Phillips SJ Dudiacutek M Elith J Graham CH Lehmann A Leathwick J Ferrier S Sample selection biasand presence-only distribution models Implications for background and pseudo-absence data Ecol Appl2009 19 181ndash197 [CrossRef]
98 Elith J Phillips SJ Hastie T Dudiacutek M Chee YE Yates CJ A statistical explanation of MaxEnt forecologists Divers Distrib 2011 17 43ndash57 [CrossRef]
99 Vapnik V Guyon I Hastie T Support vector machines Mach Learn 1995 20 273ndash297100 Cristianini N Shawe-Taylor J An Introduction to Support Vector Machines and Other Kernel-Based Learning
Methods Cambridge University Press Cambridge UK 2000 ISBN 0-521-78019-5101 Joachims T Text Categorization with Support Vector Machines Learning with Many Relevant Features Springer
Cham Switzerland 1998 pp 137ndash142102 Pradhan B A comparative study on the predictive ability of the decision tree support vector machine
and neuro-fuzzy models in landslide susceptibility mapping using GIS Comput Geosci 2013 51350ndash365 [CrossRef]
103 Lee S Hong S-M Jung H-S A support vector machine for landslide susceptibility mapping in GangwonProvince Korea Sustainability 2017 9 48 [CrossRef]
104 Yao X Tham L Dai F Landslide susceptibility mapping based on support vector machine A case studyon natural slopes of Hong Kong China Geomorphology 2008 101 572ndash582 [CrossRef]
105 Yilmaz I Comparison of landslide susceptibility mapping methodologies for Koyulhisar Turkey Conditionalprobability logistic regression artificial neural networks and support vector machine Environ Earth Sci2010 61 821ndash836 [CrossRef]
106 Xu C Xu X Dai F Saraf AK Comparison of different models for susceptibility mapping of earthquaketriggered landslides related with the 2008 Wenchuan earthquake in China Comput Geosci 2012 46317ndash329 [CrossRef]
107 Hastie T Tibshirani R Friedman J The Elements of Statistical Learning Data Mining Inference and PredictionSpringer Science amp Business Media Cham Switzerland 2009 ISBN 0-387-84858-4
108 Efron B The Jackknife the Bootstrap and Other Resampling Plans Society for Industrial and Applied MathematicsPhiladelphia PA USA 1982 ISBN 978-0-89871-179-0
109 Bandos AI Guo B Gur D Jackknife variance of the partial area under the empirical receiver operatingcharacteristic curve Stat Methods Med Res 2017 26 528ndash541 [CrossRef]
110 Convertino M Troccoli A Catani F Detecting fingerprints of landslide drivers A MaxEnt modelFingerprints of landslide drivers J Geophys Res Earth Surf 2013 118 1367ndash1386 [CrossRef]
111 Park N-W Using maximum entropy modeling for landslide susceptibility mapping with multiplegeoenvironmental data sets Environ Earth Sci 2015 73 937ndash949 [CrossRef]
112 Arabameri A Cerda A Rodrigo-Comino J Pradhan B Sohrabi M Blaschke T Tien Bui D Proposing aNovel Predictive Technique for Gully Erosion Susceptibility Mapping in Arid and Semi-arid Regions (Iran)Remote Sens 2019 11 2577 [CrossRef]
113 Roy J Saha S Arabameri A Blaschke T Bui DT A Novel Ensemble Approach for Landslide SusceptibilityMapping (LSM) in Darjeeling and Kalimpong Districts West Bengal India Remote Sens 2019 11 2866 [CrossRef]
114 Frattini P Crosta G Carrara A Techniques for evaluating the performance of landslide susceptibilitymodels Eng Geol 2010 111 62ndash72 [CrossRef]
115 Pham BT Prakash I Evaluation and comparison of LogitBoost Ensemble Fisherrsquos Linear DiscriminantAnalysis logistic regression and support vector machines methods for landslide susceptibility mappingGeocarto Int 2019 34 316ndash333 [CrossRef]
116 Fressard M Thiery Y Maquaire O Which data for quantitative landslide susceptibility mapping atoperational scale Case study of the Pays drsquoAuge plateau hillslopes (Normandy France) Nat Hazards EarthSyst Sci 2014 14 569ndash588 [CrossRef]
117 Pourghasemi HR Sadhasivam N Kariminejad N Collins AL Gully erosion spatial modelling Role of machinelearning algorithms in selection of the best controlling factors and modelling process Geosci Front 2020 [CrossRef]
118 Arabameri A Cerda A Pradhan B Tiefenbacher JP Lombardo L Bui DT A methodologicalcomparison of head-cut based gully erosion susceptibility models Combined use of statistical and artificialintelligence Geomorphology 2020 359 107136 [CrossRef]
119 Conway SJ Decaulne A Balme MR Murray JB Towner MC A new approach to estimating hazardposed by debris flows in the Westfjords of Iceland Geomorphology 2010 114 556ndash572 [CrossRef]
Remote Sens 2020 12 2833 32 of 32
120 Razavi-Termeh SV Sadeghi-Niaraki A Choi S-M Gully erosion susceptibility mapping using artificialintelligence and statistical models Geomat Nat Hazards Risk 2020 11 821ndash845 [CrossRef]
121 Arabameri A Pradhan B Lombardo L Comparative assessment using boosted regression treesbinary logistic regression frequency ratio and numerical risk factor for gully erosion susceptibility modellingCatena 2019 183 104223 [CrossRef]
122 Avand M Janizadeh S Naghibi SA Pourghasemi HR Khosrobeigi Bozchaloei S Blaschke TA Comparative Assessment of Random Forest and k-Nearest Neighbor Classifiers for Gully ErosionSusceptibility Mapping Water 2019 11 2076 [CrossRef]
123 Chauchard F Cogdill R Roussel S Roger JM Bellon-Maurel V Application of LS-SVM to non-linearphenomena in NIR spectroscopy Development of a robust and portable sensor for acidity prediction ingrapes Chemom Intell Lab Syst 2004 71 141ndash150 [CrossRef]
124 Raj Kiran N Ravi V Software reliability prediction by soft computing techniques J Syst Softw 2008 81576ndash583 [CrossRef]
125 Yuan H Yang G Li C Wang Y Liu J Yu H Feng H Xu B Zhao X Yang X Retrieving Soybean LeafArea Index from Unmanned Aerial Vehicle Hyperspectral Remote Sensing Analysis of RF ANN and SVMRegression Models Remote Sens 2017 9 309 [CrossRef]
126 Fogno Fotso HR Aloyem Kazeacute CV Kenmoe GD Optimal Input Variables Disposition of Artificial NeuralNetworks Models for Enhancing Time Series Forecasting Accuracy Appl Artif Intell 2020 1ndash24 [CrossRef]
127 Enke D Thawornwong S The use of data mining and neural networks for forecasting stock market returnsExpert Syst Appl 2005 29 927ndash940 [CrossRef]
128 Jha MK Sahoo S Efficacy of neural network and genetic algorithm techniques in simulating spatio-temporalfluctuations of groundwater Neural network and genetic algorithm for groundwater level simulationHydrol Process 2015 29 671ndash691 [CrossRef]
129 van Lint JWC Hoogendoorn SP van Zuylen HJ Accurate freeway travel time prediction with state-spaceneural networks under missing data Transp Res Part C Emerg Technol 2005 13 347ndash369 [CrossRef]
130 Chakrabortty R Pal SC Chowdhuri I Malik S Das B Assessing the Importance of Static andDynamic Causative Factors on Erosion Potentiality Using SWAT EBF with Uncertainty and PlausibilityLogistic Regression and Novel Ensemble Model in a Sub-tropical Environment J Indian Soc Remote Sens2020 48 765ndash789 [CrossRef]
copy 2020 by the authors Licensee MDPI Basel Switzerland This article is an open accessarticle distributed under the terms and conditions of the Creative Commons Attribution(CC BY) license (httpcreativecommonsorglicensesby40)
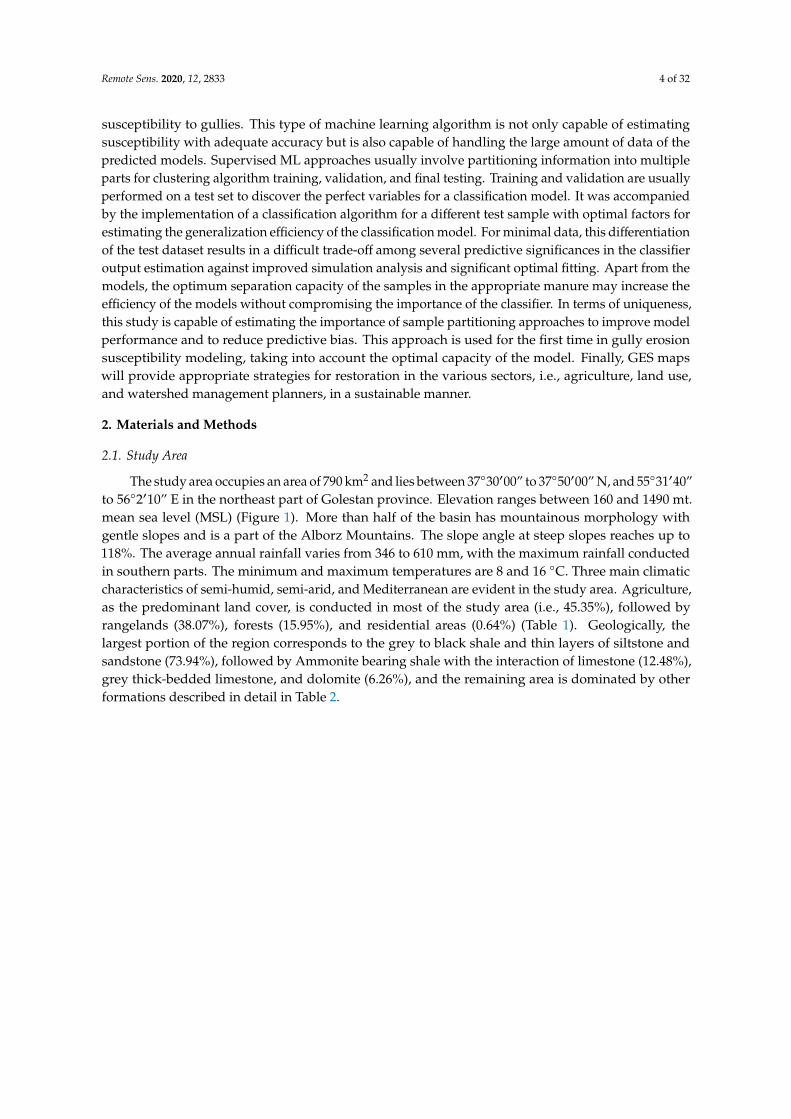
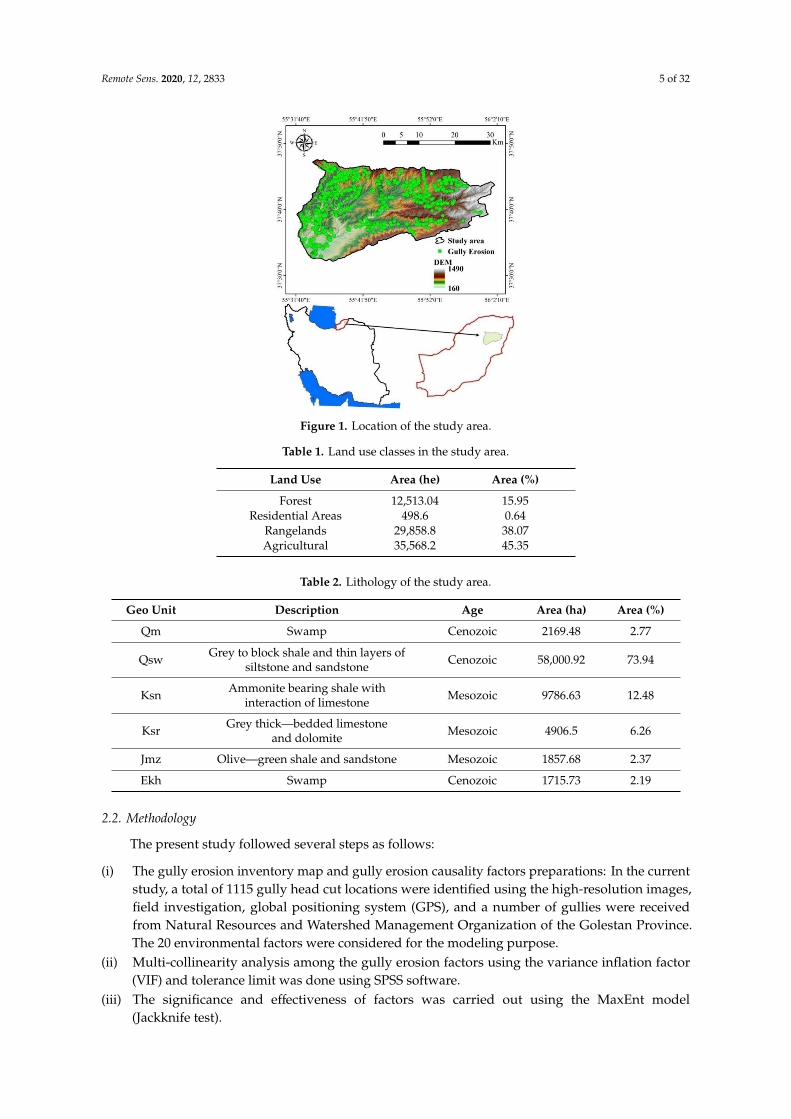
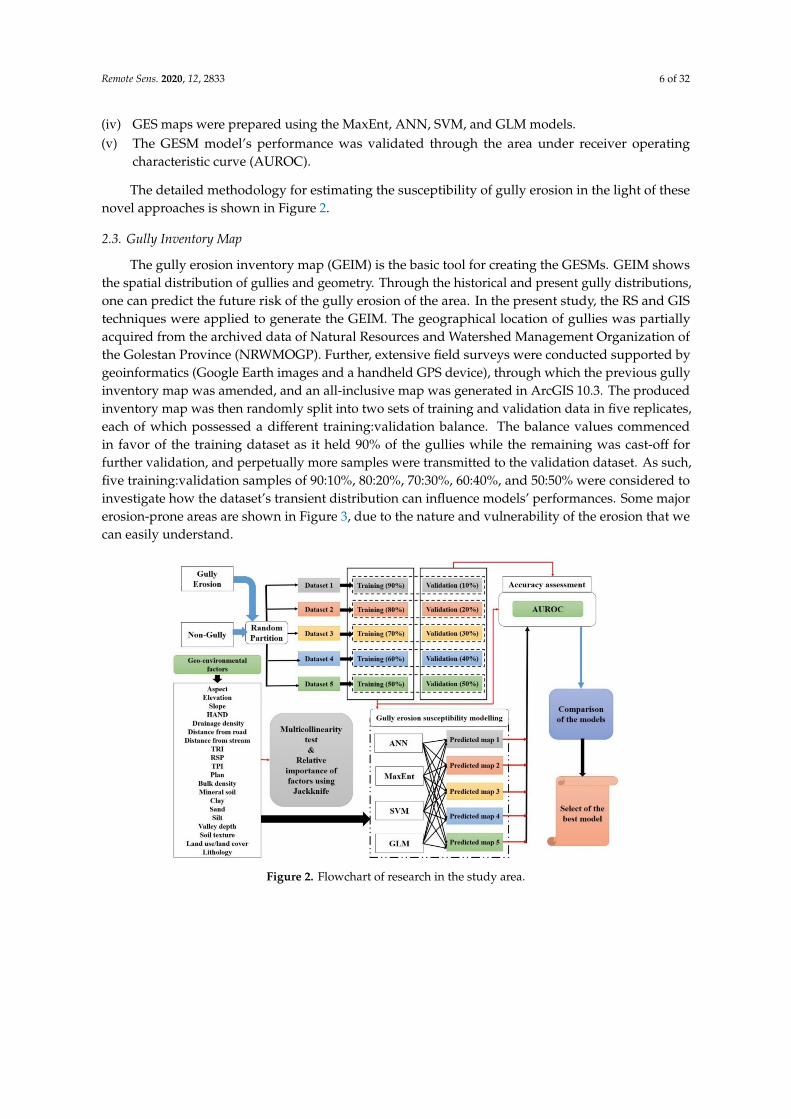
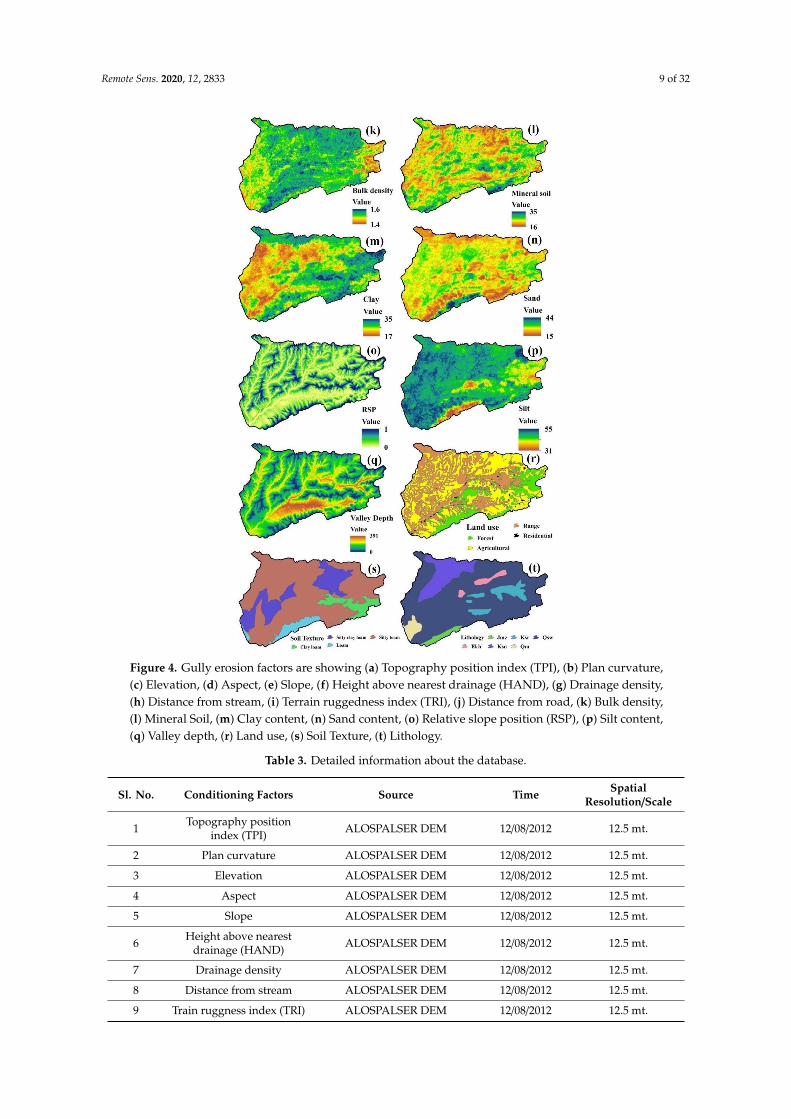
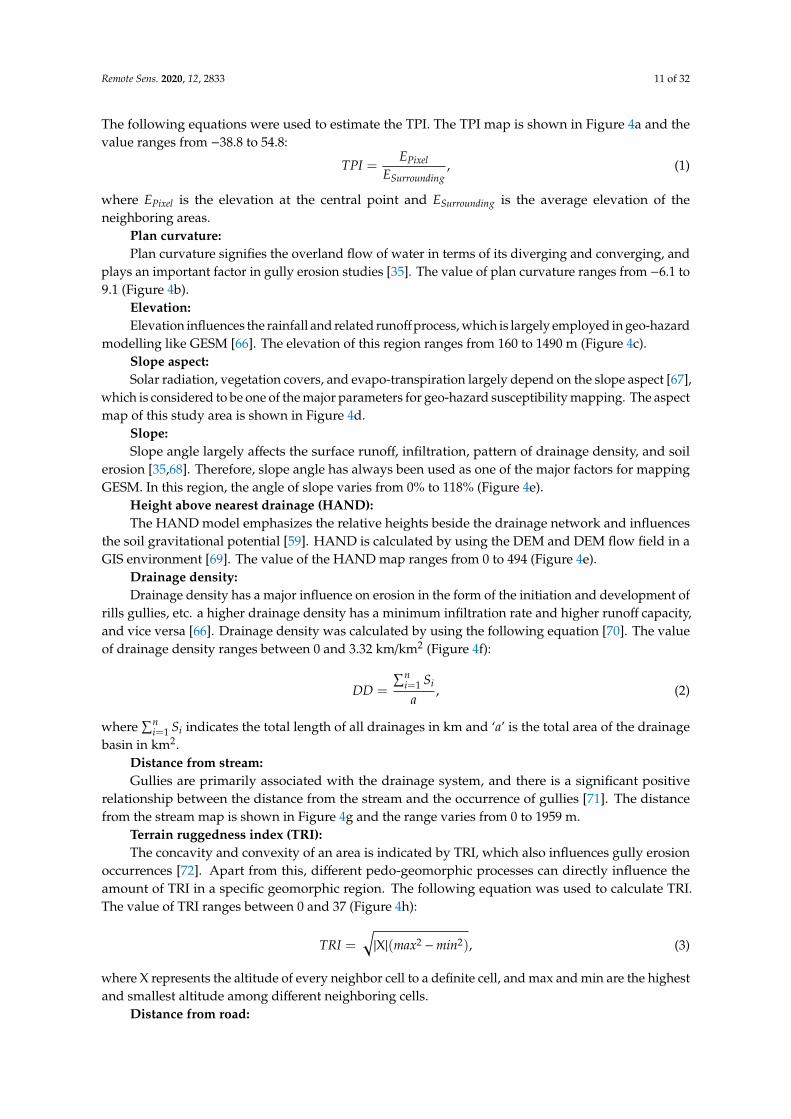
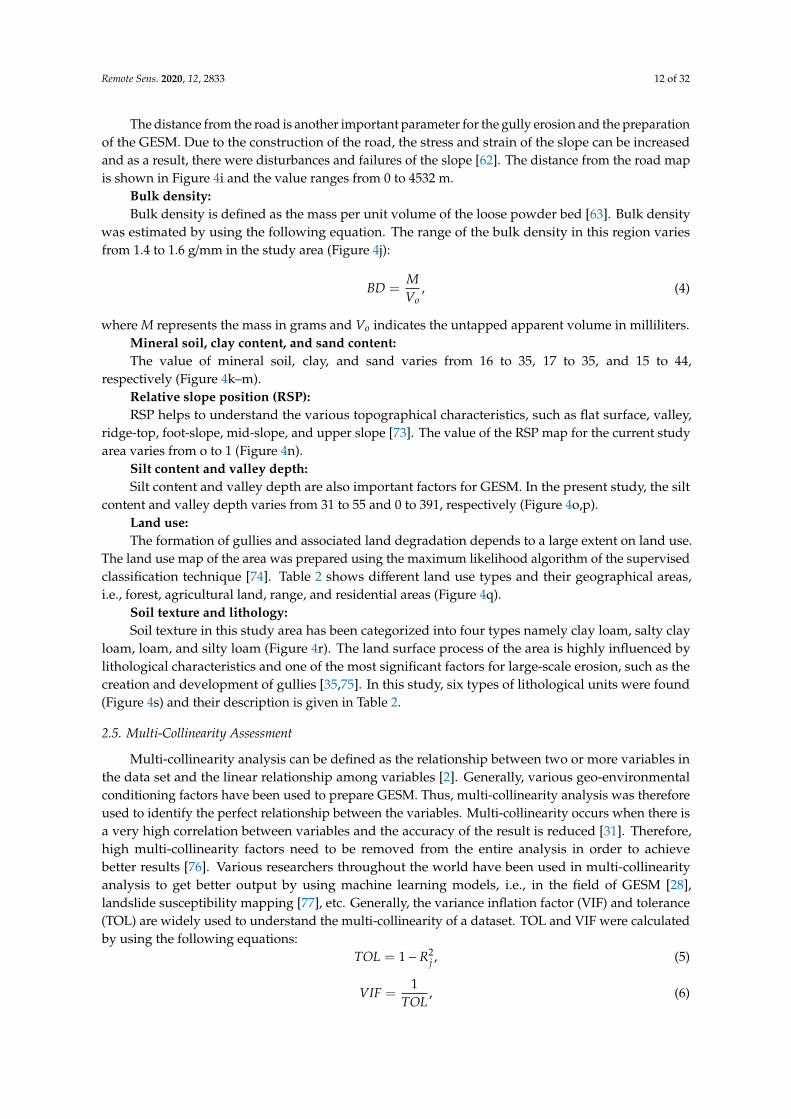
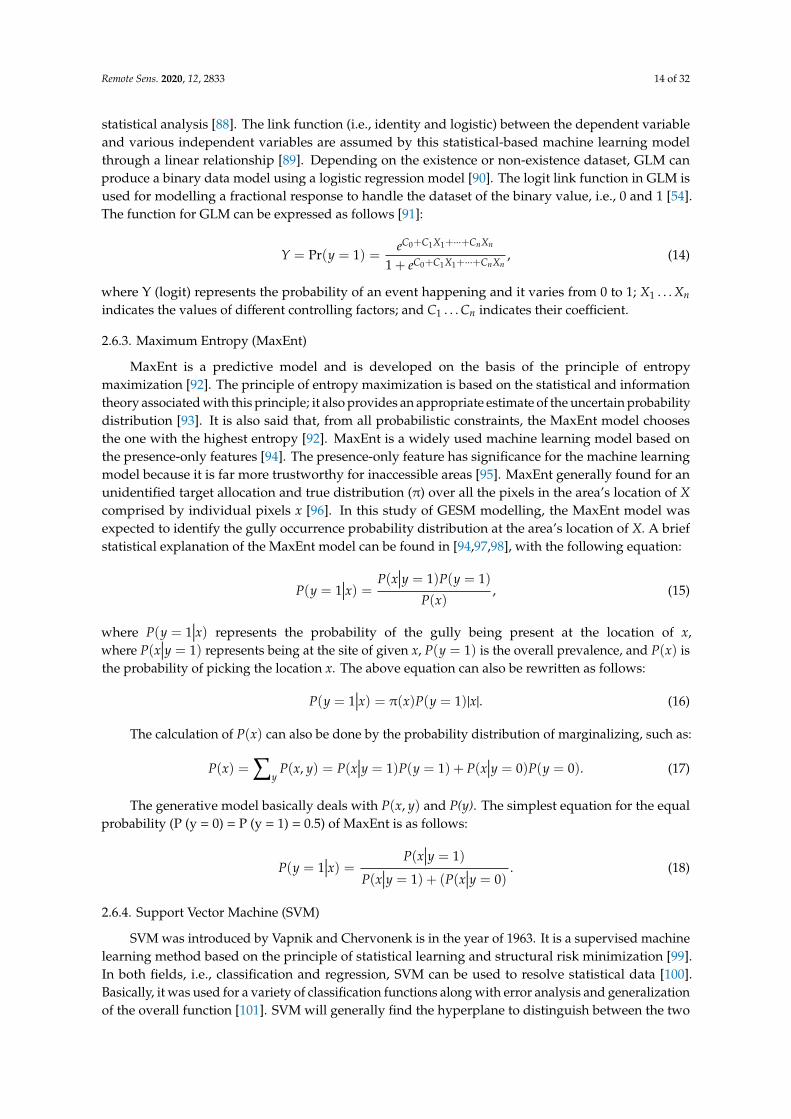
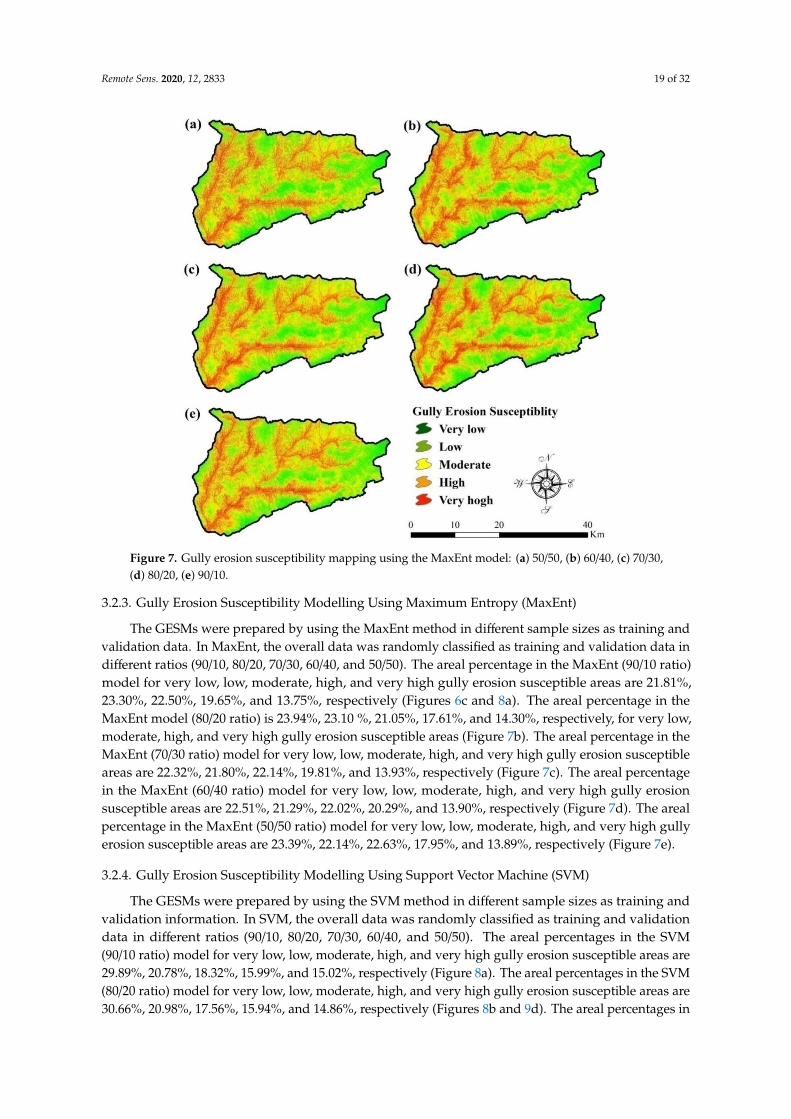
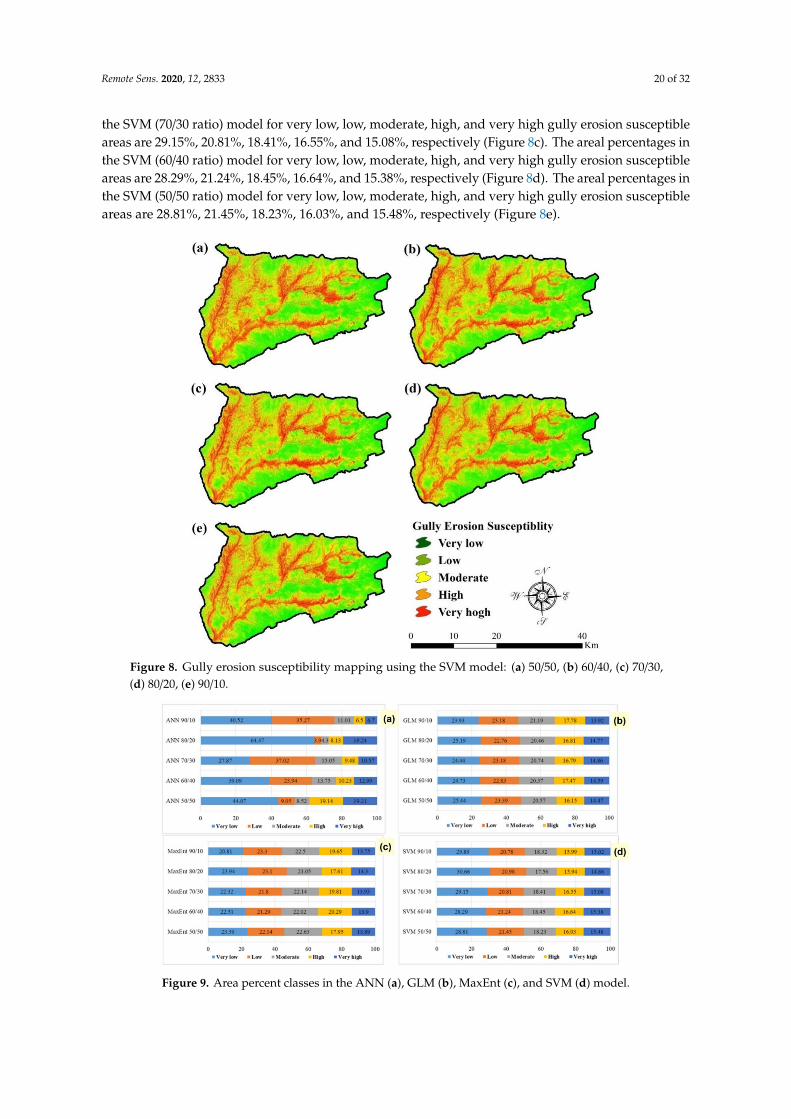
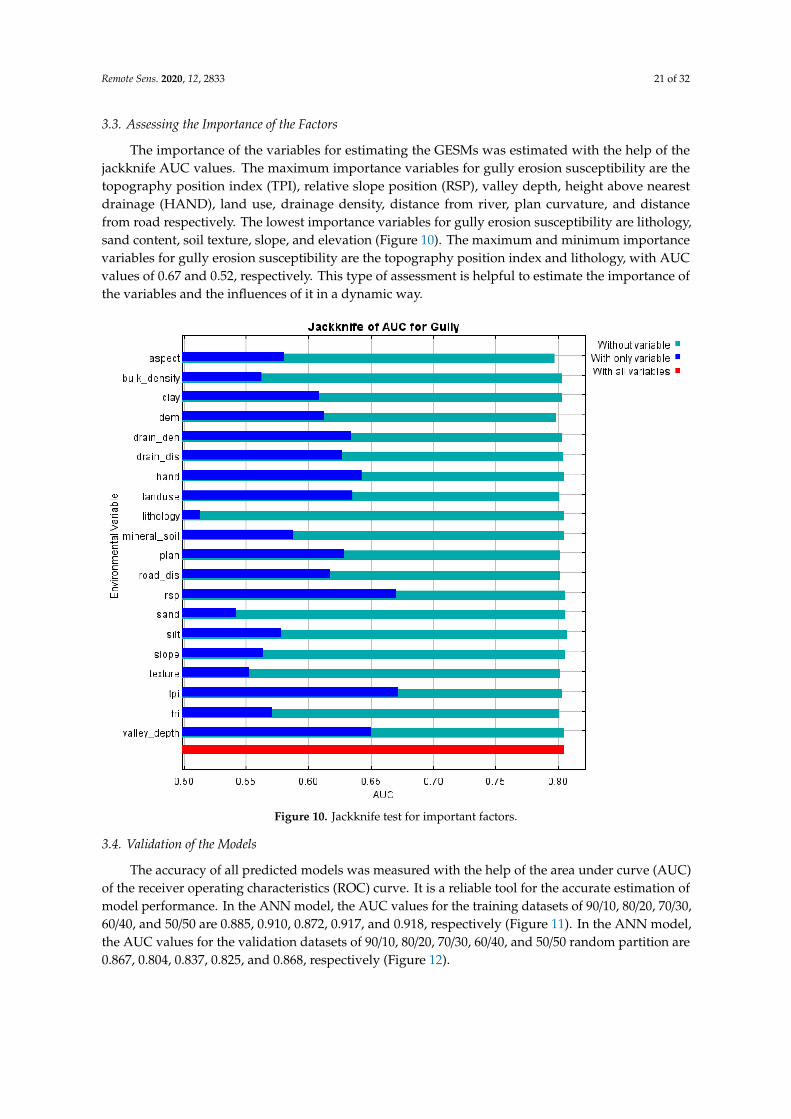
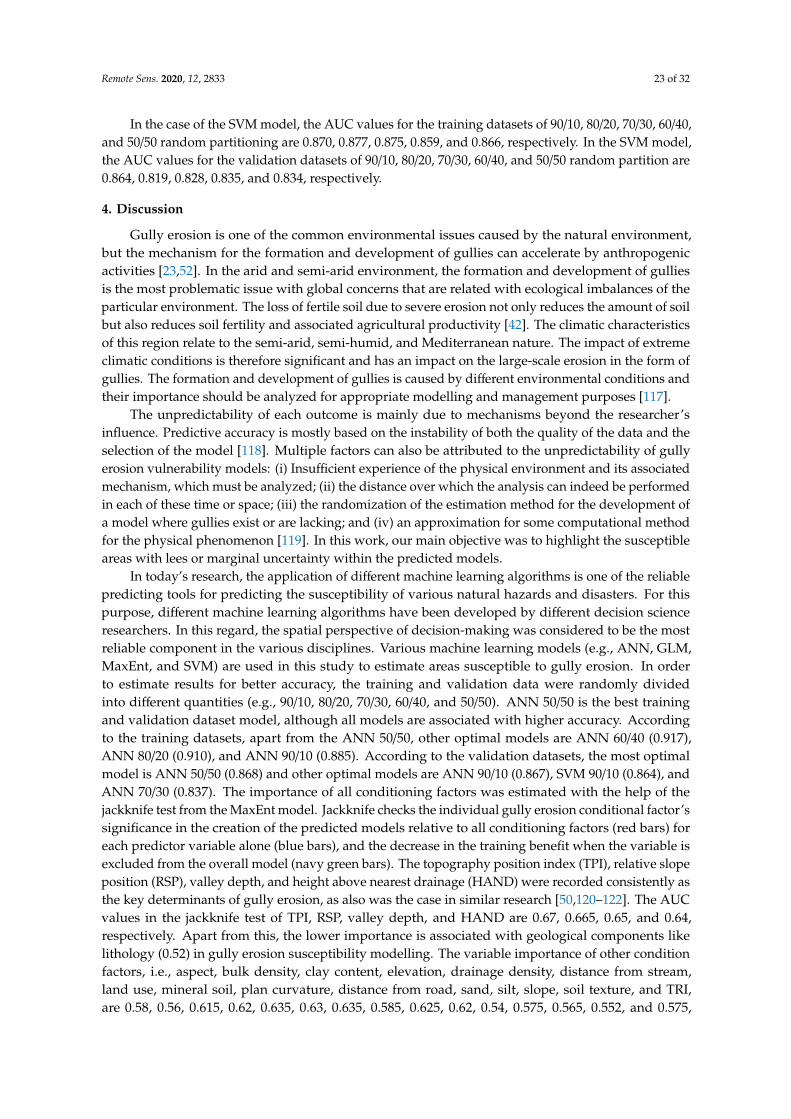