Embed Size (px)
Citation preview
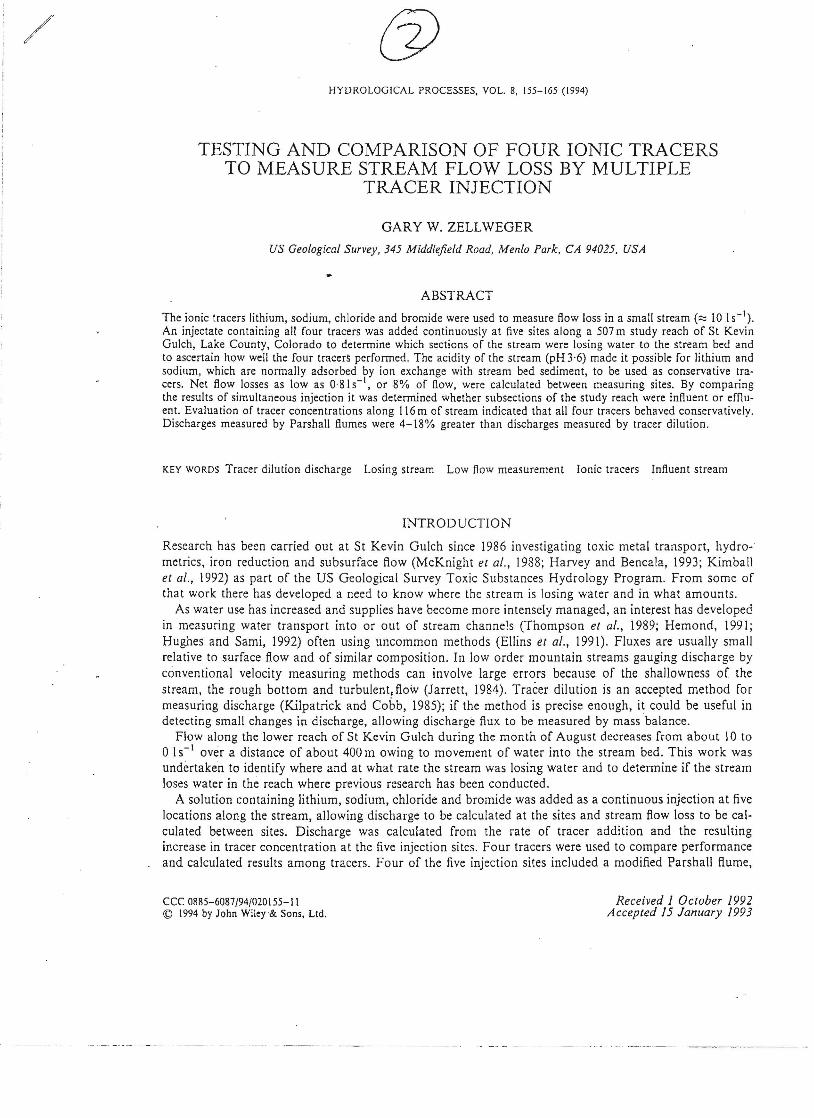
(j) HYDROLOGICAL PROCESSES, VOL. 8, 155-165 (1994)
TESTING AND COMPARISON OF FOUR IONIC TRACERS TO MEASURE STREAM FLOW LOSS BY MULTIPLE
TRACER INJECTION
GARY W. ZELLWEGER
US Geological Survey, 345 Middlefield Road, Menlo Park, CA 94025, USA
ABSTRACT
The ionic tracers lithium, sodium, chloride and bromide were used to measure flow loss in a small stream (::::: 10 IS-I). An injectate containing all four tracers was added continuously at five sites along a 507 m study reach of St Kevin Gulch, Lake County, Colorado to determine which sections of the stream were losing water to the stream bed and to ascertain how well the four tracerS performed. The acidity of the stream (pH 3·6) made it possible for lithium and sodium, which are normally adsorbed by ion exchange with stream bed sediment, to be used as conservative tracers. Net flow losses as low as 0·81 s-l, or 8% of flow, were calculated between measuring sites. By comparing the results of simultaneous injection it was determined whether subsections of the study reach were influent or emuent. Evaluation of tracer concentrations along 116 m of stream indicated that all tour tracers behaved conservatively. Discharges measured by Parshall flumes were 4-18 % greater than discharges measured by tracer dilution.
KEY WORDS Tracer dilution discharge Losing stream Low flow measurement Ionic tracers Influent stream
INTRODUCTION
Research has been carried out at St Kevin Gulch since 1986 investigating toxic metal transport, hydrometries, iron reduction and subsurface flow (McKnight el al., 1988; Harvey and Bencala, 1993; Kimball et al., 1992) as part of the US Geological Survey Toxic Substances Hydrology Program. From some of that work there has developed a need to know where the stream is losing water and in what amounts.
As water use has increased and supplies have become more intensely managed, an interest has developed in measuring water transport into or out of stream channels (Thompson et al., 1989; Hemond, 1991; Hughes and Sami, 1992) often using uncommon methods (Ellins et al., 1991). Fluxes are usually small relative to surface flow and of similar composition. In low order mountain streams gauging discharge by conventional velocity measuring methods can involve large errors because of the shallowness of the stream, the rough bottom and turbulent,flow (Jarrett, 1984). Tracer dilution is an accepted method for measuring discharge (Kilpatrick and Cobb, 1985); if the method is precise enough, it could be useful in detecting small changes in discharge, allowing discharge flux to be measured by mass balance.
Flow along the lower reach of St Kevin Gulch during the month of August decreases from about 10 to o15- 1 over a distance of about 400 m owing to movement of water into the stream bed. This work was undertaken to identify where and at what rate the stream was losing water and to determine if the stream loses water in the reach where previous research has been conducted.
A solution containing lithium, sodium, chloride and bromide was added as a continuous injection at five locations along the stream, allowing discharge to be calculated at the sites and stream flow loss to be calculated between sites. Discharge was calculated from the rate of tracer addition and the resulting increase in tracer concentration at the five injection sites. Four tracers were used to compare perfonnance and calculated results among tracers. Four of the five injection sites included a modified Parshall flume,
CCC 0885-6087/94/020155-11 Received 1 October 1992 © 1994 by John Wiley & Sons, Ltd. Accepted 15 January 1993
- ---- - - ---- - - - -- --------
156 G. W. ZELLWEGER
with a 7·6 em (3 in) throat, with which additional discharge data were collected and compared with discharge calculations from the tracer data.
This paper describes a method of simultaneous mUltiple tracer dilution and compares discharge calculations for the four tracers used. The amount of loss for each subreach was calculated and the zone of transition from a gaining to a losing stream was located. The degree to which the four tracers were conservative was demonstrated by comparing concentration measurements in the influent section of the study reach. The treatment and propagation of errors are discussed to define limitations of the method. Discharge measurements from the Parshall flumes are compared with those from tracer dilution.
SITE DESCRIPTION
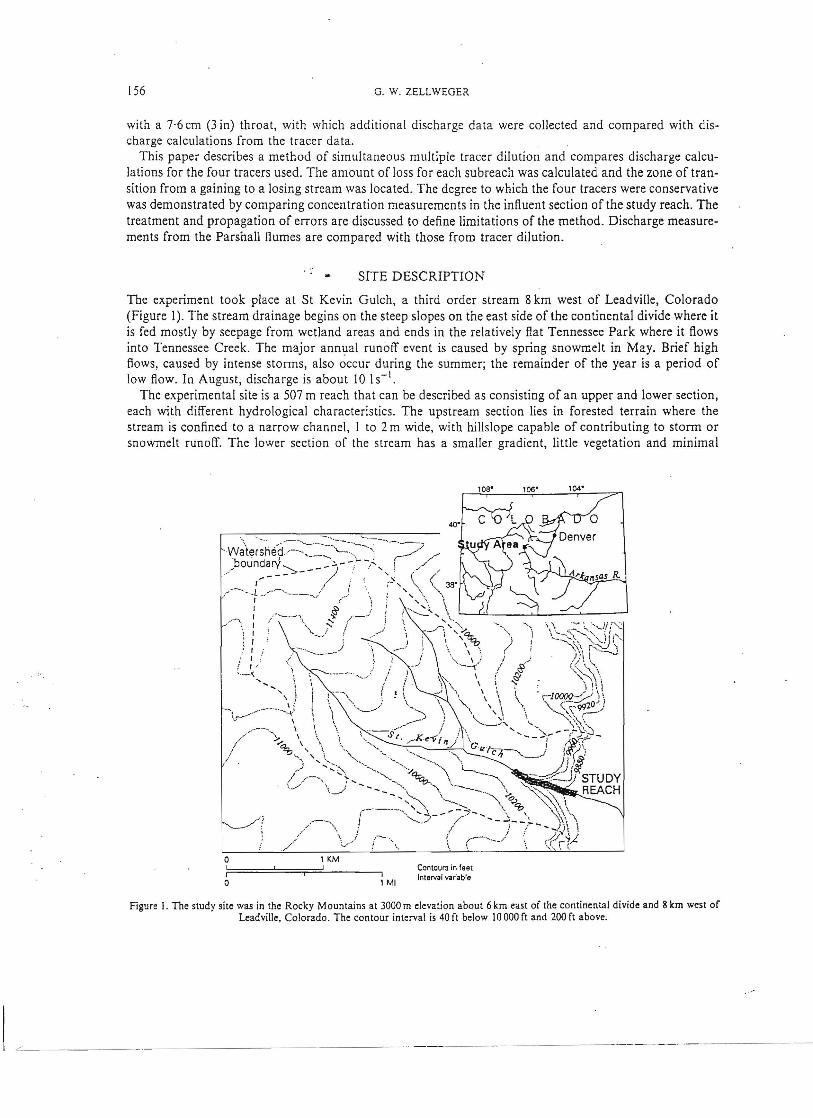
The experiment took place at St Kevin Gulch, a third order stream 8 km west of Leadville, Colorado (Figure 1). The stream drainage begins on the steep slopes on the east side of the continental divide where it is fed mostly by seepage from wetland areas and ends in the relatively flat Tennessee Park where it flows into Tennessee Creek. The major ann~al runoff event is caused by spring snowmelt in May. Brief high flows, caused by intense storms, also occur during the summer; the remainder of the year is a period of low flow. In August, discharge is about 10 I S-I.
The experimental site is a 507 m reach that can be .described as consisting of an upper and lower section, each with different hydrological characteristics. The upstream section lies in forested terrain where the stream is confined to a narrow channel, I to 2 m wide, with hillslope capable of contributing to storm or snowmelt runoff. The lower section of the stream has a smaller gradient, little vegetation and minimal
lKMo I I Contours in f99t I o
I lMI
Interv.1 variable
Figure 1. The study site was in the Rocky Mountains at 3000 m elevation about 6 km east of the continental divide and 8 km west of Leadville, Colorado . The contour interval is 40 ft below \0 000 fl and 200 fl above.
/
157 STREAM FLOW LOSS
hillslope capable of contributing to runoff. Here the stream floodplain opens to a width of as much as 90 m and the stream channel is near the north side of the plain and remains from 1 to 5 m wide and a few centrimetres deep.
Upstream of the study reach, seepage from the mine tailings and tunnel openings acidifies the stream to a pH of about 3·6 during August. The seepages also increase the sUlphate concentration to more than 90 mg I-I and iron concentrations to 1·5 mg I-I. The iron forms an orange brown precipitate which covers the bottom of the stream. In most streams lithium and sodium are adsorbed onto stream sediment by ion exchange, rendering them of little use as conservative tracers over long distances. Under the low pH conditions of St Kevin Gulch cation exchange is reduced or eliminated, allowing lithium and sodium to be used as conservative tracers. Belo)Y the study reach the stream discharge decreased to zero over a distance of about 300 to 400 m, varying with the time of day and the volume of water coming from upstream.
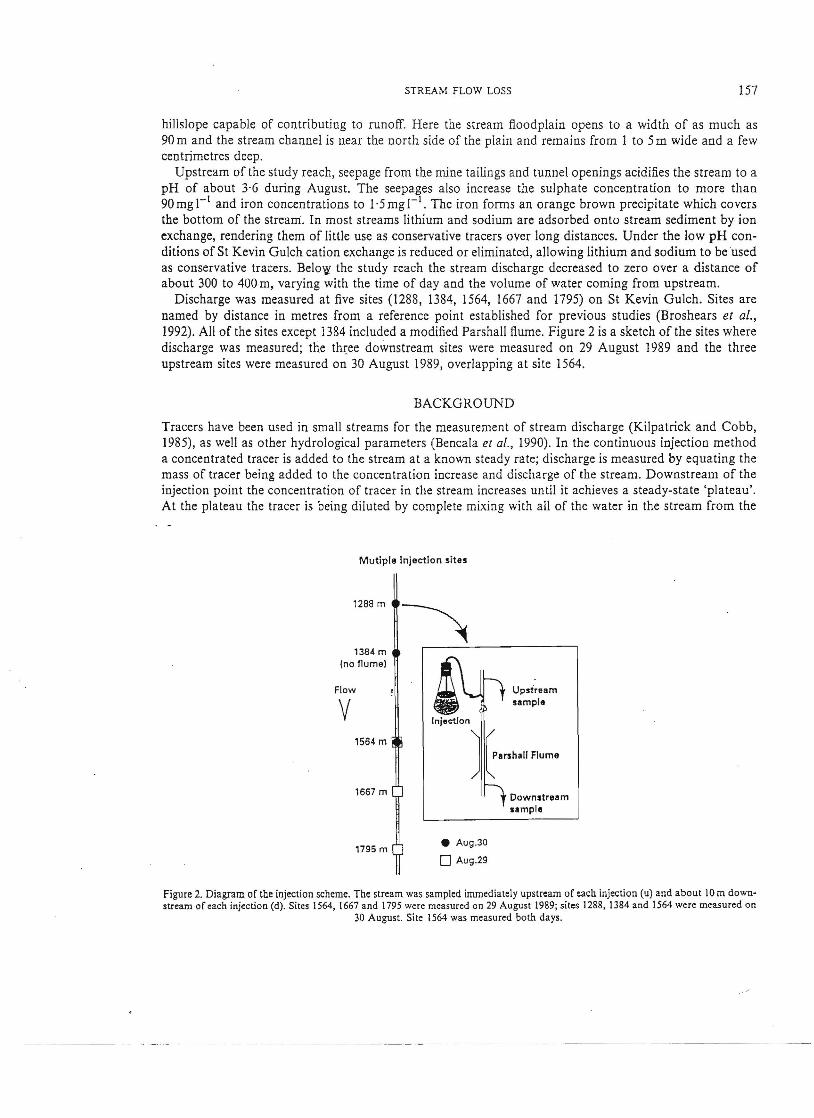
Discharge was measured at five sites (1288, 1384, 1564, 1667 and 1795) on St Kevin Gulch. Sites are named by distance in metres from a reference point established for previous studies (Broshears et at., 1992). All of the sites except 1384 included a modified Parshall flume. Figure 2 is a sketch of the sites where discharge was measured; the thJ:ee downstream sites were measured on 29 August 1989 and the three upstream sites were measured on 30 August 1989, overlapping at site 1564.
BACKGROUND
Tracers have been used in small streams for the measurement of stream discharge (Kilpatrick and Cobb, 1985), as well as other hydrological parameters (Bencala et al., 1990). In the continuous injection method a concentrated tracer is added to the stream at a known steady rate; discharge is measured by equating the mass of tracer being added to the concentration increase and discharge of the stream. Downstream of the injection point the concentration of tracer in the stream increases until it achieves a steady-state 'plateau'. At the plateau the tracer is being diluted by complete mixing with all of the water in the stream from the
Mutiple injection sites
Injection
1288 m
1384 m (no flume)
Flow
v Upstream sample
1564 m Jt·nh," "om.
1667 m Downstream sample
• Aug.301795 m o Aug.29
Figure 2. Diagram of the injection scheme. The stream was sampled immediately upstream of each injection (u) and about 10 m downstream oreach injection Cd). Sites 1564, 1667 and 1795 were measured on 29 August 1989; sites 1288, 1384 and 1564 were measured on
30 August. Site 1564 was measured both days .
._--- - ._ .---
158 G. W. ZELLWEGER
injection point to the downstream sample point. Discharge (I s-') is calculated by dividing the rate of the addition of tracer mass (mg s-') by the increase in tracer concentration in the stream (mg 1-') as shown in Equation (1) (Kilpatrick and Cobb, 1985)
_ Q. (Ci - Cu )Q (1)d- I(Cd-C )u
where Ci is the concentration of tracer in the injectate, Cu and Cd are tracer concentrations upstream and downstream of the injection, respectively, and Qi and Qd are the injection rate and the discharge downstream of the injection, respectively.
Because Ci is much larger than Cu-; the equation can be simplified to
_ QjCiQd- (2)Cd - Cu
For streams that do not lose water, a single injection site can be used to measure discharge at many downstream locations. As water from seeps or tributaries is added to the stream, the tracer is diluted proportionately, so that Equation (2) still applies if it is assumed that the tracer concentration of the added water is the same as that of stream background water. This assumption can be met by choosing tracers such as chloride or bromide which have low background concentrations in most inland streams (Hem, 1985). Time and concentration restrict how far downstream discharge can be measured . Because of longitudinal dispersion, the time for the downstream concentration to reach a 'plateau' can be several times the travel time (the average time for a packet of water to travel the distance). Eventually, as inflows increase discharge, continued dilution reduces the tracer concentration to values so low that measurements and calculations become unreliable.
In an influent stream, in which water is lost by discharge into the stream bed, tracer is lost proportionally with the lost water and the concentration of tracer in the remaining stream water is not affected. Therefore loss cannot be detected from a change in tracer concentration . Discharge can be measured only near the point of injection at each injection site. To make discharge measurements at several locations in a losing stream it is necessary to use several injections.
FIELD METHODS
The injection solution was made by dissolving lithium chloride and sodium bromide in stream water. The solution was poured into containers for injection at each site, except for site 1288 where the injectate was diluted so the pump rate, Qi, could be kept large enough to measure easily. The injection was controlled by using regi.ilated metering pumps operating on 12 V batteries. Table I shows the pump rate and the mass injection rate at each site for each tracer.. .
The injection sites were located at places where the stream became narrow so that mixing was optimized and instaIlation of the flumes simplified. The points where tracers were injected were located immediately upstream of the flumes where the constriction of flumes aided mixing. During the period of injection, background samples of stream water were collected immediately upstream of each injection point; downstream samples were collected at a narrow point far enough (about 10m) from the injection so that complete mixing had occurred. All samples were grab samples collected in pitchers and filtered through 0·45 J.1.m membrane filters to remove suspended sediment.
Samples were analysed for lithium and sodium by atomic absorption spectrometry; chloride and bromide concentrations were measured by ion chromatography. The precision of each method was about 1% of the measured values based on historical instrument performance. Upstream and downstream samples were collected nearly, but not exactly, at the same time. In calculating discharge upstream background concentrations were interpolated to match the times of the downstream samples, though this may not have been necessary as it had a negligible effect on discharge values. Rates for the injection pumps were measured volumetrically at each site. The same injection tracer concentration (Cu ) was used for all sites except site 1288, where the injectate had been diluted.
159
17-42
STREAM FLOW LOSS
Table 1. Pump volume and mass rates for each injection site and the corresponding mass injection rates for each tracer
Date Site Pump rate (mis-I)
Mass injection rate (mg S-I )
Li Na Cl Br
29 August 1989 1564 0·162 2·38 5·02 12·47 29 August 1989 1667 0·326 4-78 10·11 25·08 37'05 29 August 1989 1795 0'734 10·75 22·72 56·37 83·32
30 August 1989 1288 0'334* 2'77 6·01 14·44 21·13 30 August 1989 1384 0·322 4·74 10·32 24·88 36·59 30 August 1989 1564 .. 0·689 10·14 22·07 53·22 78·26
• The injection solution at this site was diluted so that the pump rate could be high enough to easily measure.
As the sites were of the order of 100 m apart, water from upstream sites reached downstream sites during the injection period, causing an increase in tracer concentrations (Cu) at the downstream sites. It was necessary to add greater amounts of tracer at the downstream sites so that the tracer signal (Cd) was significantly greater than the background levels. This problem restricted the experiment to operating three injection sites at a time. As the water arrived at the downstream sample point (d in Figure 2) only I to 2 minutes after the upstream (background) sample points (u in Figure 2), there was only minimal disruption of the discharge measuring method.
The net loss of stream water within the four subreaches was calculated by subtracting the discharge between sequential injection sites. An adjustment of 20 minutes (30 minutes between 1384 and 1564) was made to allow for the approximate travel time. There may be both discharge into the stream and recharge from the stream to groundwater occurring in the same reach, but the subtraction of discharge at sequential stream locations determines only the net loss or gain.
In this experiment, modified Parshall flumes with 7·6 em throat widths were installed at sites 1288, 1564, 1667 and 1795. Discharge is obtained from a Parshall flume by measuring the flume head, i.e. the depth of water in the flume upstream of the flume throat. Discharge values are taken from a rating table developed for flumes made to the same specifications as those used in this work (Kilpatrick and Schneider, 1983). Flume depths were measured approximately hourly on both 29 August and 30 August. There are important criteria for the correct operation of Parshall flumes. These include ensuring that the flume is level, there is a pool of relatively still water upstream of the flume throat, stream water is not flowing under or around the flume and ponding at the downstream end of the flume does not cause the downstream head to exceed 0·6 of the upstream head. The four installed flumes met these criteria.
RESULTS
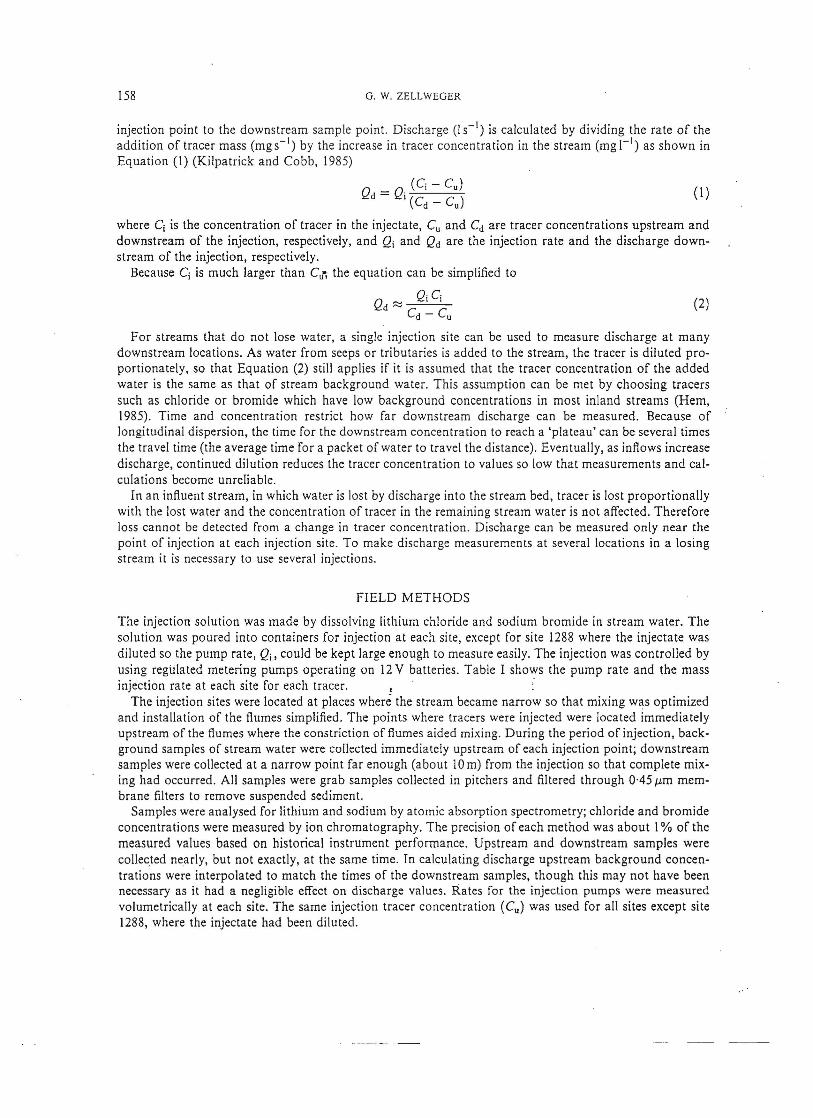
Concentration measurements for the lithium tracer at site 1795, upstream and downstream of the injection, are shown in Figure 3 as an example of typical concentration results for this experiment. Tracers arriving from the two sites further upstream are responsible for the step-like increases in the tracer concentration at 1000 and 1130 hours.
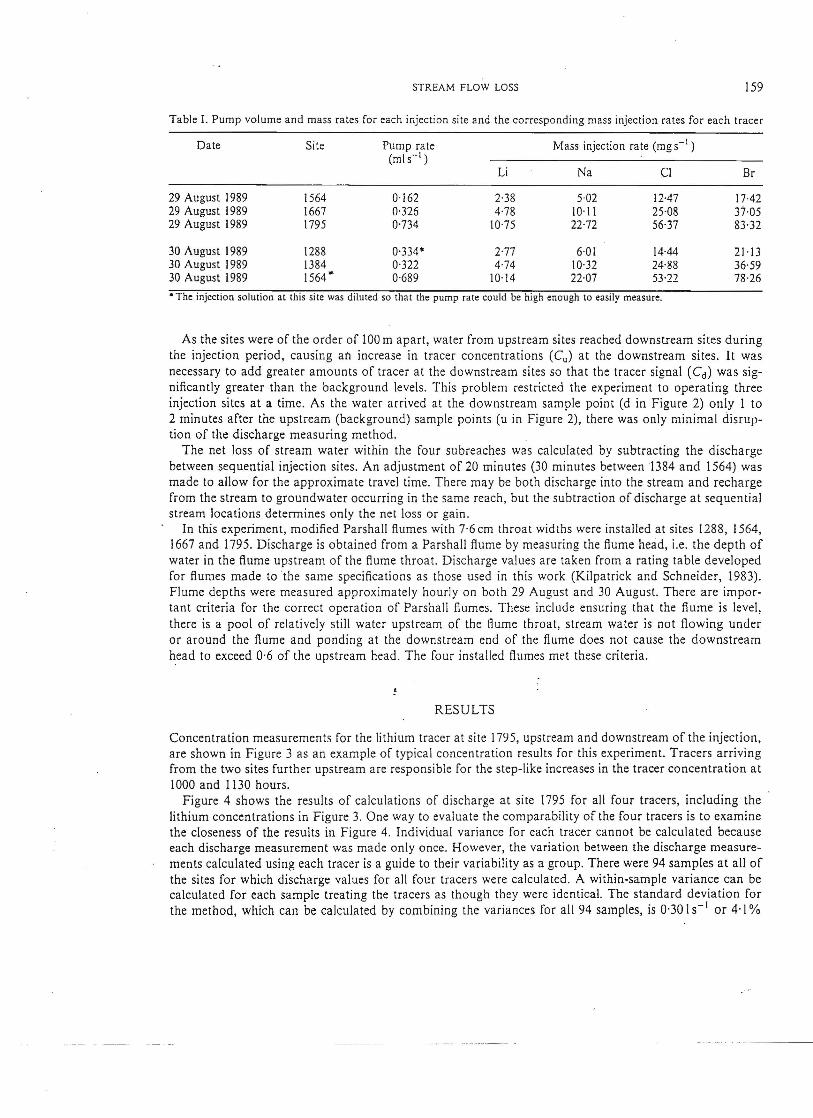
Figure 4 shows the results of calculations of discharge at site 1795 for all four tracers, including the lithium concentrations in Figure 3. One way to evaluate the comparability of the four tracers is to examine the closeness of the results in Figure 4. Individual variance for each tracer cannot be calculated because each discharge measurement was made only once. However, the variation between the discharge measurements calculated using each tracer is a guide to their variability as a group. There were 94 samples at all of the sites for which discharge values for all four tracers were calculated. A within-sample variance can be calculated for each sample treating the tracers as though they were identical. The standard deviation for the method, which can be calculated by combining the variances for all 94 samples, is 0·30 I S-I or 4'1 %
160 G. W. ZELLWEGER
- 4 r-----------.------------.------------r-----~--__, I ....J o Upstream, C
u otlJl COO cPO o Downstream. Cd 00 .
3 S
r!fJEOoo ~ 0 c§!ID........., to H...,
2 ~ Q) ()
~ 0 ()
o H Q) ()
to H
E-< o L-____~~~~\~____~____~____~______.ffi L_____~__~
0800 1000 1200 1400 1600
Time of Day, Hour
Figure 3. Lithium concentration measurements upstream and downstream of the injection at site 1795. Concentrations at both: locations increased in steps in response to injections further upstream
of the average measurement. If this preCISIOn is acceptable, then the conclusion can be made that the tracers, which are not identical, are operationally equivalent.
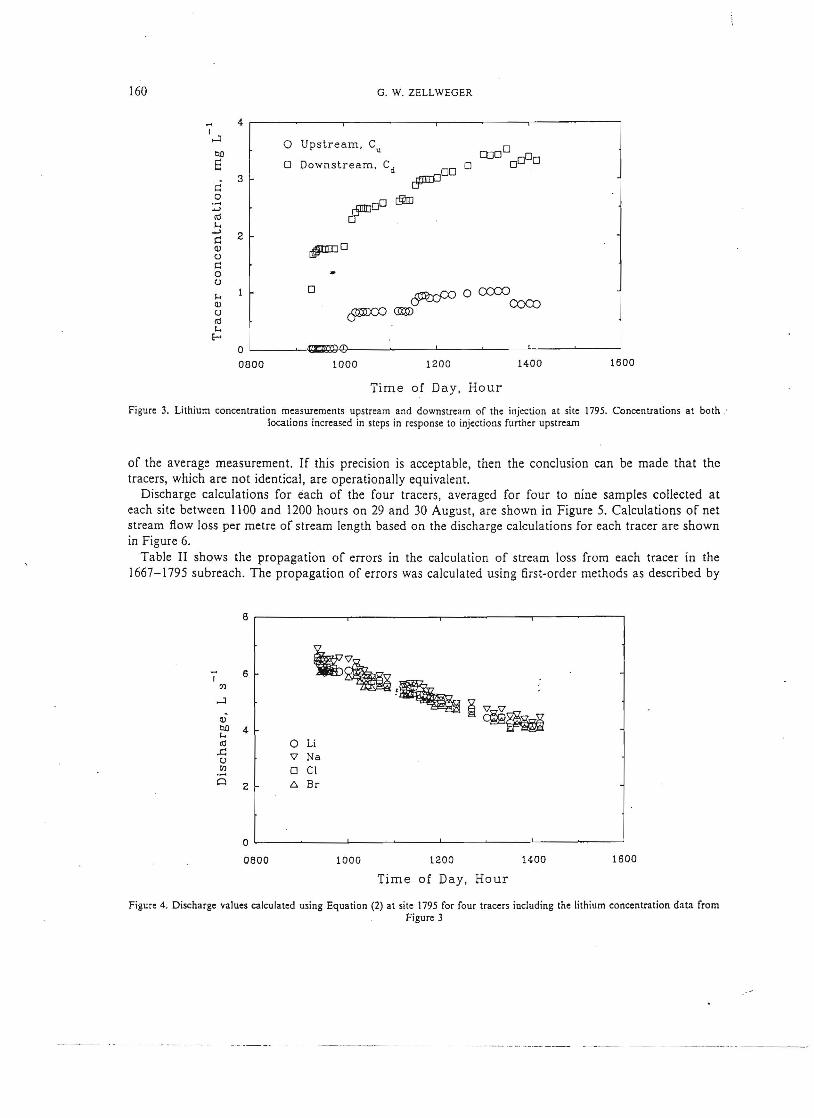
Discharge calculations for each of the four tracers, averaged for four to nine samples collected at each site between 1100 and 1200 hours on 29 and 30 August, are shown in Figure 5. Calculations of net stream flow loss per metre of stream length based on the discharge calculations for each tracer are shown in Figure 6.
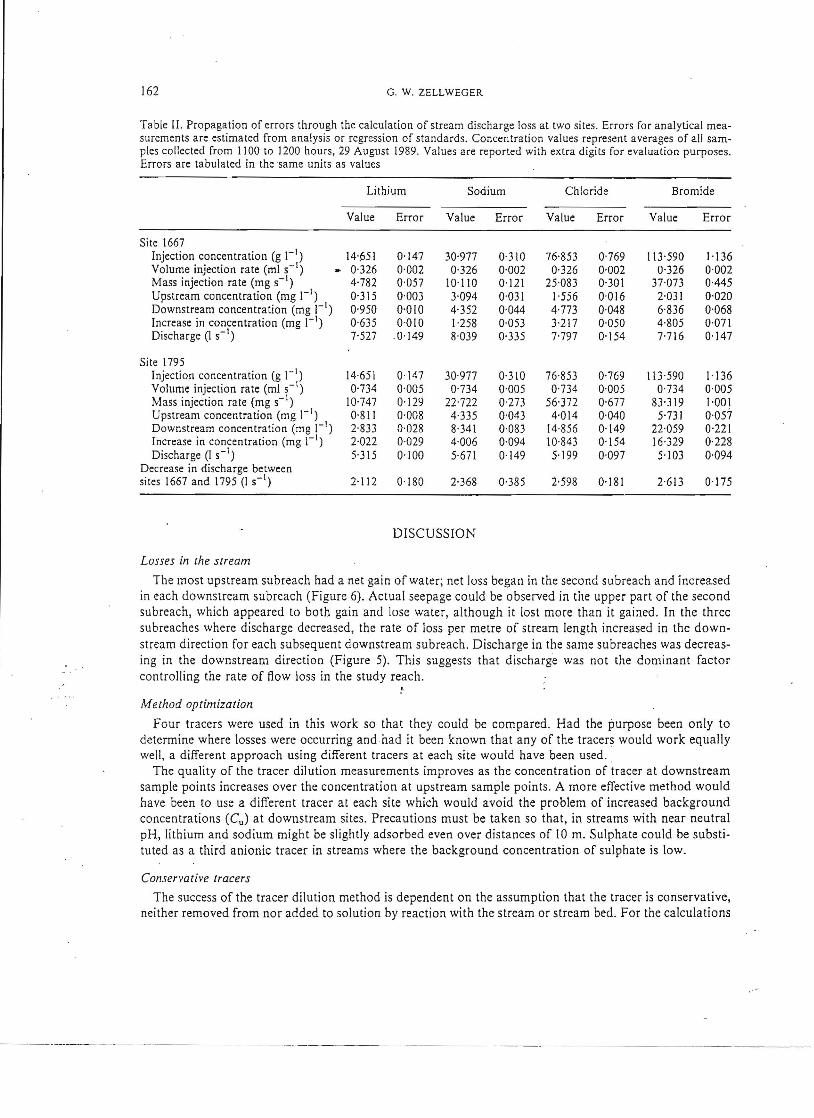
Table II shows the propagation of errors in the calculation of stream loss from each tracer in the 1667-1795 subreach. The propagation of errors was calculated using first-order methods as described by
8
6I k~
[/) ~,....J
v' ~~ tlJl 4H ('j 0 Li.c: () '\7 Na [/) 0 Cl
Q t:. Br2
~ ~~ ~ ~o ~____~____ __ ____-L____~____~______ __
0800 1000 1200 1400 1600
Time of Day, Hour
Figure 4. Discharge values calculated using Equation (2) at site 1795 for four tracers including the lithium concentration data from Figure 3

161 STREAM FLOW LOSS
12 ,-------.-------,-------,-------,-------,-------,
~Li
D Na10
I222l Cl-I (f)
~ BrB
6
4
2
o 1228 1384 1564 1667 1795
Sample Site
Figure 5. Discharge values at each site for each tracer averaged from all samples collected between 1100 and \200 hours on 29 and 30 August
Bevington (1969). The measurements of concentration by one tracer had a precision of about 1%, depending on the tracer and the concentration being measured. Relative errors remain small, about 2%, through all calculations until the final step, in which two nearly equal discharge values are subtracted and the rela
. tive errors range from 6·7 to 16'3%. This increase in the relative error would be found with any method of measuring discharge.
20
10
~CI § Br
-10
1336 1474 1615 1731
Midreach Location, Meters Downstream
Figure 6. Calculated net flow loss per metre of stream length for each tracer in the four subreaches
30 ,------------------------------------------------,
-I ~Li
-6 D Na I
(f)
,...J
6 (f) (f)
o ,...J
E til Il) So..
~
-20 L-______________________________________________~
162 G_ W_ ZELLWEGER
Table II. Propagation of errors through the calculation of stream discharge loss at two sites. Errors for analytical measurements are estimated from analysis or regression of standards. Concentration values represent averages of all samples collected from 1100 to 1200 hours, 29 August 1989. Values are reported with extra digits for evaluation purposes. Errors are tabulated in the same units as values
Lithium Sodium Chloride Bromide
Value Error Value Error Value Error Value Error
Site 1667 Injection concentration (g 1-1) 14-651 0·147 30'977 0·310 76·853 0'769 113'590 1·136 Volume injection rate (m1 S- I) .. 0·326 0·002 0'326 0'002 0·326 0'002 0·326 0·002 Mass injection rate (mg s-l) 4·782 0'057 10·110 0·121 25·083 0·301 37-073 0-445 Upstream concentration (mg 1-1) 0'315 0'003 3-094 0'031 1-556 0'016 2·031 0·020 Downstream concentration (mg I-I) 0·950 0·010 4·352 0·044 4'773 0·048 6·836 0·068 Increase in concentration (mg I-I) 0·635 0-010 1·258 0·053 3·217 0·050 4·805 0'071 Discharge (I S-I) 7·527 0·149 8'039 0·335 7'797 0·154 7'716 0'147
Site 1795 Injection concentration (g I-I) 14·651 0-147 30·977 0·310 76·853 0·769 113·590 1·136 Volume injection rate (ml S-I) 0·734 0'005 0'734 0'005 0·734 0·005 0·734 0·005 Mass injection rate (mg S-I) 10·747 0' 129 22·722 0·273 56'372 0·677 83'319 1'001 Upstream concentration (mg I-I) 0·811 0·008 4·335 0'043 4'014 0'040 5·731 0-057 Downstream concentration (mg I-I) 2-833 0·028 8·341 0·083 14·856 0·149 22·059 0'221 Increase in concentration (mg 1-1) 2·022 0·029 4·006 0·094 10·843 0·154 16'329 0·228 Discharge (I S-I) 5·315 0·100 5·671 0-149 5·199 0·097 5·103 0·094
Decrease in discharge between sites 1667 and 1795 (I s-l) 2·112 0·180 2'368 0'385 2·598 0·181 2·613 0·175
DISCUSSION
Losses in the stream
The most upstream 5ubreach had a net gain of water; net loss began in the second subreach and increased in each downstream subreach (Figure 6). Actual seepage could be observed in the upper part of the second subreach, which appeared to both gain and lose water, a lthough it lost more than it gained. In the three subreaches where discharge decreased, the rate of loss per metre of stream length increased in the downstream direction for each subsequent downstream subreach. Discharge in the same subreaches was decreasing in the downstream direction (Figure 5). This suggests that discharge was not the dominant factor controlling the rate of flow loss in the study reach.
Method optimization
Four tracers were used in this work so that they could be compared. Had the purpose been only to determine where losses were occurring and had it been known that any of the tracers would work equally well, a different approach using different tracers at each site would have been used. _
The quality of the tracer dilution measurements improves as the concentration of tracer at downstream sample points increases over the concentration at upstream sample points . A more effective method would have been to use a different tracer at each site which would avoid the problem of increased background concentrations (Cu) at downstream sites . Precautions must be taken 50 that, in streams with near neutral pH, lithium and sodium might be slightly adsorbed even over distances of 10 m. Sulphate could be substi tuted as a third anionic tracer in streams where the background concentration of sulphate is low.
Conservative tracers
The success of the tracer dilution method is dependent on the assumption that the tracer is conservative, neither removed from nor added to solution by reaction with the stream or stream bed. For the calculations
163 STREAM FLOW LOSS
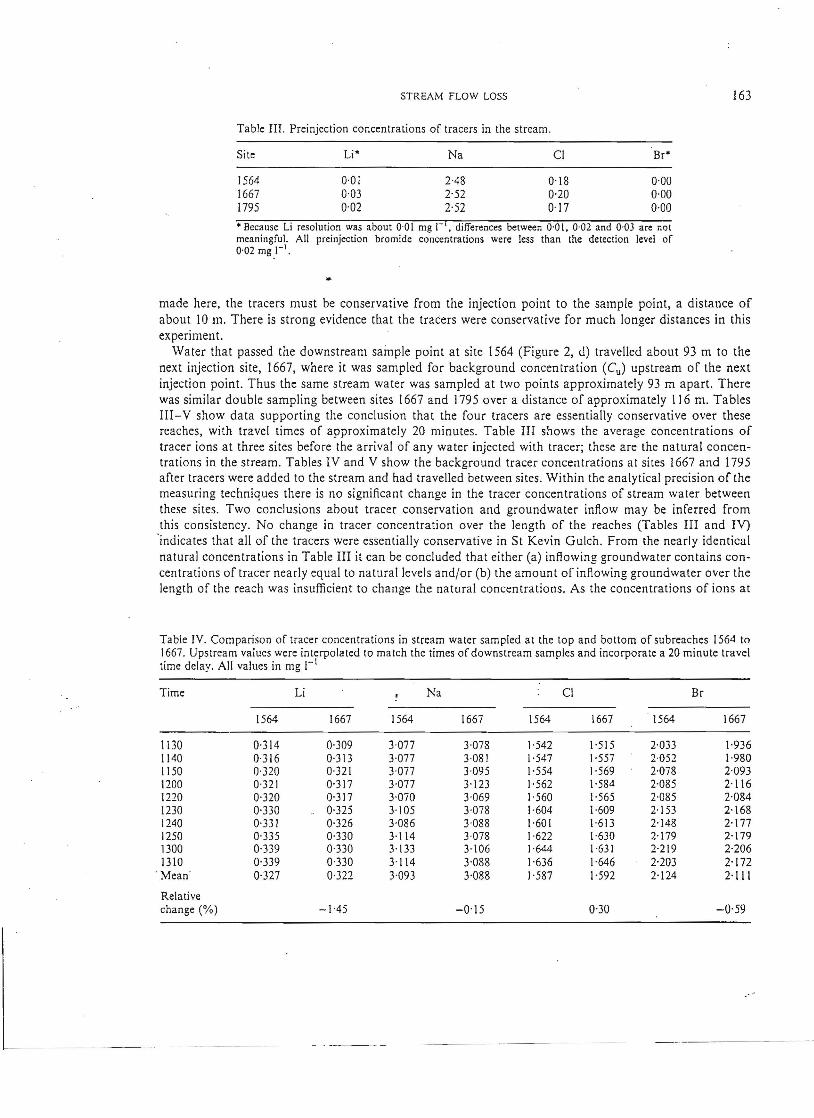
Table III. Preinjection concentrations of tracers in the stream.
Site Li* Na Cl Br"
1564 0·01 2·48 0'18 0'00 1667 0·03 2'52 0'20 0·00 1795 0·02 2·52 0·17 0·00
.. Because Li resolution was about 0·01 mg I I, differences between 0'01, 0·02 and 0·03 are not meaningful. All preinjection bromide concentrations were less than the detection level of 0'02 mg I-I.
made here, the tracers must be conservative from the injection point to the sample point, a distance of about 10 m. There is strong evidence that the tracers were conservative for much longer distances in this experiment.
Water that passed the downstream sample point at site 1564 (Figure 2, d) travelled about 93 m to the next injection site, 1667, where it was sampled for background concentration (eu ) upstream of the next injection point. Thus the same stream water was sampled at two points approximately 93 m apart. There was similar double sampling between sites 1667 and 1795 over a distance of approximately 116 m. Tables III - V show data supporting the conclusion that the four tracers are essentially conservative over these reaches, with travel times of approximately 20 minutes. Table III shows the average concentrations of tracer ions at three sites before the arrival of any water injected with tracer; these are the natural concentrations in the stream. Tables IV and V show the background tracer concentrations at siles 1667 and 1795 after tracers were added to the stream and had travelled between sites. Within the analytical precision of the measuring techniques there is no significant change in the tracer concentrations of stream water between these sites. Two conclusions about tracer conservation and groundwater inflow may be inferred from this consistency. No change in tracer concentration over the length of the reaches (Tables III and IV) indicates that all of the tracers were essentially conservative in St Kevin Gulch. From the nearly identical natural concentrations in Table III it can be concluded that either (a) inflowing groundwater contains concentrations of tracer nearly equal to natural levels and/or (b) the amount of inflowing groundwater over the length of the reach was insufficient to change the natural concentrations. As the concentrations of ions at
Table IV. Comparison of tracer concentrations in stream water sampled at the top and bottom of sub reaches 1564 to 1667. Upstream values were interpolated to match the times of downstream samples and incorporate a 20 minute travel time delay. All values in mg I-I
Time Li Na CI Br
1564 1667 1564 1667 \564 1667 1564 1667
1130 0·314 0·309 3·077 3·078 1·542 1·515 2·033 1·936 1140 0·316 0·313 3·077 3-081 1·547 1·557 2·052 1·980 1150 0·320 0·321 lO77 3·095 1·554 1·569 2·078 2'093 1200 0·321 0'317 3·077 3·123 1'562 1·584 2·085 2·116 1220 0·320 0·317 3-070 3·069 1·560 1·565 2·085 2·084 1230 0·330 0·325 3·105 3-078 1·604 1·609 2·153 2·168 1240 0·331 0·326 3'086 3·088 1·601 1·613 2'148 2·177 1250 0'335 0·330 3·114 3·078 1·622 1-630 2-\79 2·\79 1300 0·339 0·330 3· 133 3· \06 1·644 1·631 2·219 2·206 1310 0·339 0-330 3-114 3-088 1·636 1·646 2·203 2'172
. Mean 0·327 0·322 3·093 3'088 1'587 1'592 2·124 2·111
Relative change (%) -1-45 -0-15 0'30 -0'59

164 G. W. ZELLWEGER
Table V. Comparison of tracer concentrations in stream water sampled at the top and bottom of subreaches 1667 to 1795. Upstream values were interpolated to match the time of downstream samples and incorporate a 20 minute travel time delay. All values in mg I-I
Time Li Na Cl Br
1667 1795 1667 1795 1667 1795 1667 1795
1015 0·671 0·648 3·783 3'704 3·333 3·173 4·669 4'517 1020 0·635 0·650 3·731 3·714 3'175 3-205 4·474 4·500 1025 0·631 0·661 3'718 3'725 3'129 3·240 4·385 4·547 1030 0·632 0·6590 3'707 3'704 3·122 3·264 4·348 4·593 1040 0·641 0·661 3'718 3'735 3'159 3·270 4·413 4·593 1050 0·670 0·669 3·760 3'745 3'314 3'291 4·694 4-694 1110 0·664 0·673 3·774 3·787 3·307 3·345 4·684 4·701 1115 0·667 0·675 3-788 3'776 3·358 3·327 4·803 4'731 1210 0·960 0·957 4·387 4·388 4·835 4·887 6·931 7·010 1220 0'968 0·956 4'382 4·335 4'870 4·861 6·978 6·976 1240 0·999 0'977 4·488 4-410 4·993 4·933 7·152 7-067 1300 1·016 1·010 4·523 4·518 5·115 5·184 7·336 7-443 1310 1·012 1·009 4·513 4·507 5·088 5'182 7-284 7-438 1320 1·018 1·016 4·442 4·616 5·167 5·314 7·404 7-490 1330 1·035 1·018 4-483 4·572 5·194 5·221 7-468 7·459 1350 0·757 0·777 3977 4·079 3·734 3·923 5·271 H05 1401 0'765 0·790 3-945 4·048 3·748 4·013 5'274 5·706 1410 0·763 0·776 3·962 4·016 3·729 3-889 5·260 5-496 Mean 0·806 0'810 4·060 4·077 4·021 4·085 5·713 5·809
Relative change C%) 0'54 0-41 1·58 1·68
elevated levels (Tables IV and V) do not significantly change, it can be concluded that either (c) inflowing groundwater contains concentrations of tracer ions nearly equal to the elevated levels and/or (d) the amount of inflowing groundwater over the length of the reach was insufficient to change the concentrations of tracer ions. Propositions (a) and (c) cannot both be true; therefore (b) or (d) is probably true; there was no significant groundwater input along either stream reach.
Parshall flumes
Table VI shows a comparison between the averages of discharge measured by four tracers and the single values for the Parshall flumes. Precision betw~en the tracer discharge measurements was about O' 30 Is-I. With only one flume at each site there is no precision information for flume discharge measurements. However, the flume head measurements were calculated from measurements made by ruler from the top of the stilling well to the water surface. The precision of the head measurements from hour to hour is about
Table VI. Comparison of discharge values calculated from tracer dilution with those mea· sured by Parshall flume. Tracer discharge measurements were interpolated to match the hourly times of flume discharge measurements
Site Tracer discharge Flume discharge Difference (1 S-I) (1 S-I) C%)
1288 8·26 9'77 18·3 1564 9'06 9·94 9·7 1667 6·86 7-62 11'1 1795 4·30 4'46 3'7
165 STREAM FLOW LOSS
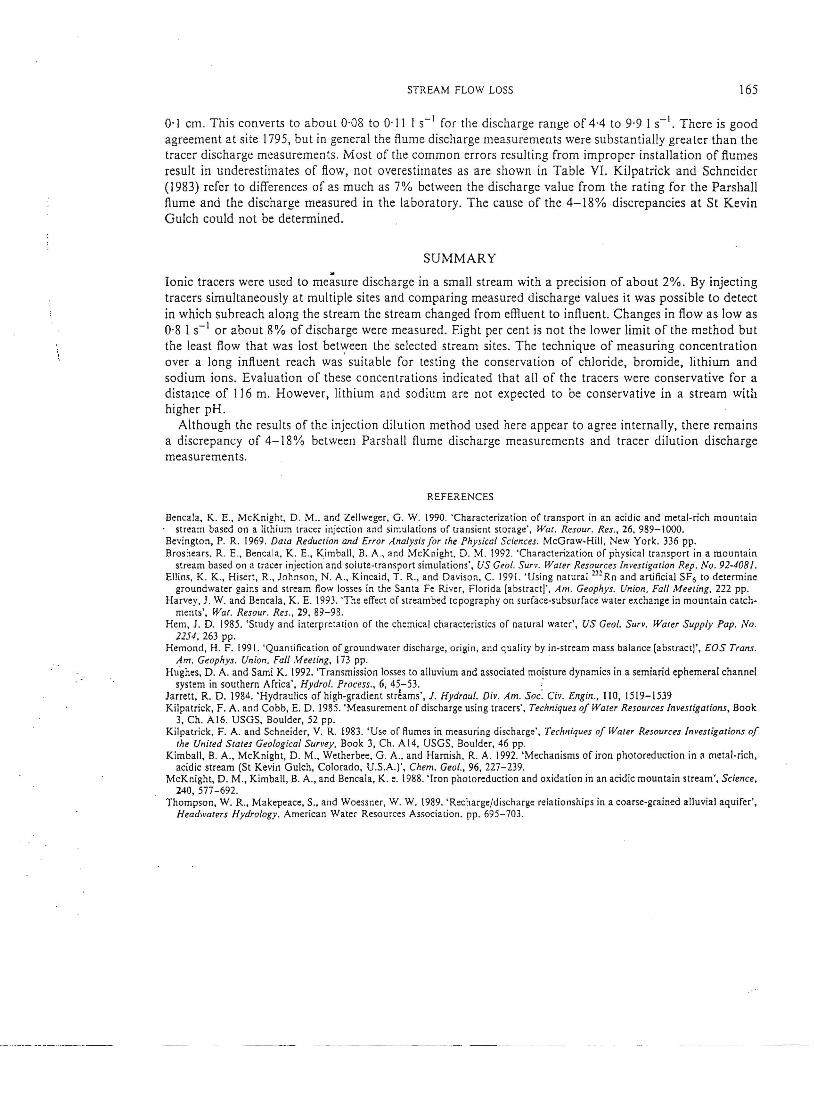
0,1 cm. This converts to about 0·08 to 0·11 I S-I for the discharge range of 4-4 to 9·9 Is-I. There is good agreement at site 1795, but in general the flume discharge measurements were substantially greater than the tracer discharge measurements. Most of the common errors resulting from improper installation of flumes result in underestimates of flow, not overestimates as are shown in Table VI. Kilpatrick and Schneider (1983) refer to differences of as much as 7% between the discharge value from the rating for the Parshall flume and the discharge measured in the laboratory. The cause of the 4-18% discrepancies at St Kevin Gulch could not be determined.
SUMMARY
Ionic tracers were used to meisure discharge in a small stream with a precision of about 2%. By injecting tracers simultaneously at mUltiple sites and comparing measured discharge values it was possible to detect in which sub reach along the stream the stream changed from effluent to influent. Changes in flow as low as 0·8 I S-I or about 8% of discharge were measured. Eight per cent is not the lower limit of the method but the least flow that was lost bet\yeen the selected stream sites. The technique of measuring concentration over a long influent reach was suitable [or testing the conservation of chloride, bromide, lithium and sodium ions. Evaluation of these concentrations indicated that all of the tracers were conservative [or a distance of 116 m. However, lithium and sodium are not expected to be conservative in a stream with higher pH.
Although the results of the injection dilution method used here appear to agree internally, there remains . a discrepancy of 4-18% between Parshall flume discharge measurements and tracer dilution discharge measurements.
REFERENCES
Bencala, K. E., McKnight, D. M., and Zellweger, G . W. 1990. 'Characterization of transport in an acidic and metal-rich mountain . stream based on a lithium tracer injection and simulations of transient storage'. War. Resour. Res., 26, 989-1000. Bevington, P. R. 1969. Dara Reducrion and Error Analysis for the Physical Sciences. McGraw-Hili, New York. 336 pp. Brosbears. R. E., Bencala, K. E., Kimball, B. A., and McKnight, D. M. 1992. 'Characterization of physical transport in a mountain
stream based on a tracer injection and solute·transport simulations', US Ceol. Sur •. Water Resources Investigation Rep. No. 92-4081. Ellins, K. K., Hiser!, R., Johnson , N. A., Kincaid, T. R., and Davison, C. 1991. 'Using natural Z-nRn and artificial SF6 to detennine
groundwater gains and stream flow losses in the Santa Fe River, Florida [abstract\" Am. Geophys. Union, Fall Meeting. 222 pp. Harvey, J. W. and Bencala, K. E. 1993. 'The effect of streambed topography on surface-subsurface water exchange in mountain catch
ments', War. Resour. Res., 29, 89-98. Hem, 1. D. 1985. 'Study and interpretation of the chemical characteristics of natural water', US Ceol. Surv. Warer Supply Pap. No.
2254, 263 pp. Hemond, H. F. 1991. 'Quantification of groundwater discharge, origin, and qual ity by in-stream mass balance [abstract]" EOS Trans .
Am. Ceophys. Union, Fall Meeting, 173 pp. Hughes, D. A. and Sami K. 1992. 'Transmission losses to alluvium and associated moisture dynamics in a semiarid ephemeral channel
system in southern Africa', Hydrol. Process., 6, 45-53. : Jarrett, R. D. 1984. 'Hydraulics of high-gradient strbms', J. Hydraul. Div. Am. Soc: Civ_ Engin., 1I0, 1519-1539 Kilpatrick, F. A. and Cobb, E. D. 1985. 'Measurement of discharge using tracers', Techniques of Waler Resources Investigations, Book
3, Ch. A16. USGS, Boulder, 52 pp. Kilpatrick, F. A. and Schneider, V. R. 1983. 'Use of flumes in measuring discharge', Techniques of Water Resources Investigations of
the United Stares Geological Survey, Book 3, Ch. AI4, USGS, Boulder, 46 pp. Kimball, B. A., McKnight, D. M., Wetherbee, G. A., and Hamish, R. A. 1992. 'Mechanisms of iron photoreduction in a metal-rich,
acidic stream (St Kevin Gulch, Colorado, U.S.A.)', Chern. Geol., 96, 227-239. McKnight, D. M., Kimball, B. A., and Bencala, K. e. 1988. 'Iron photoreduction and oxidation in an acidic mountain stream', Science,
240, 577-692. Thompson, W. R., Makepeace, S., and Woessner, W. W. 1989. 'Recharge/discharge relationships in a coarse-grained alluvial aquifer',
Headwaters Hydrology. American Water Resources Association. pp. 695-703.