Embed Size (px)
Citation preview

1
Testimony of Dale Murden
Chairman Rio Grande Valley Sugar Growers, Inc.
United States House of Representatives
Committee on Agriculture
Field Hearing on the 2012 Farm Bill Lubbock, Texas
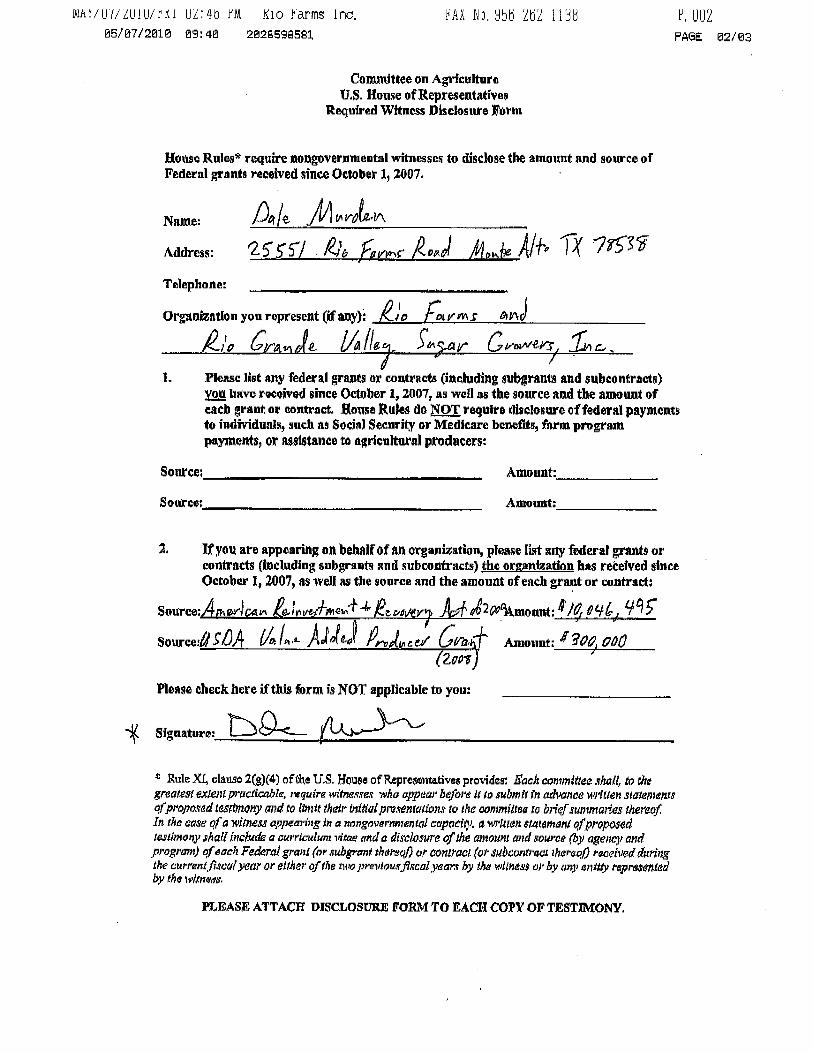
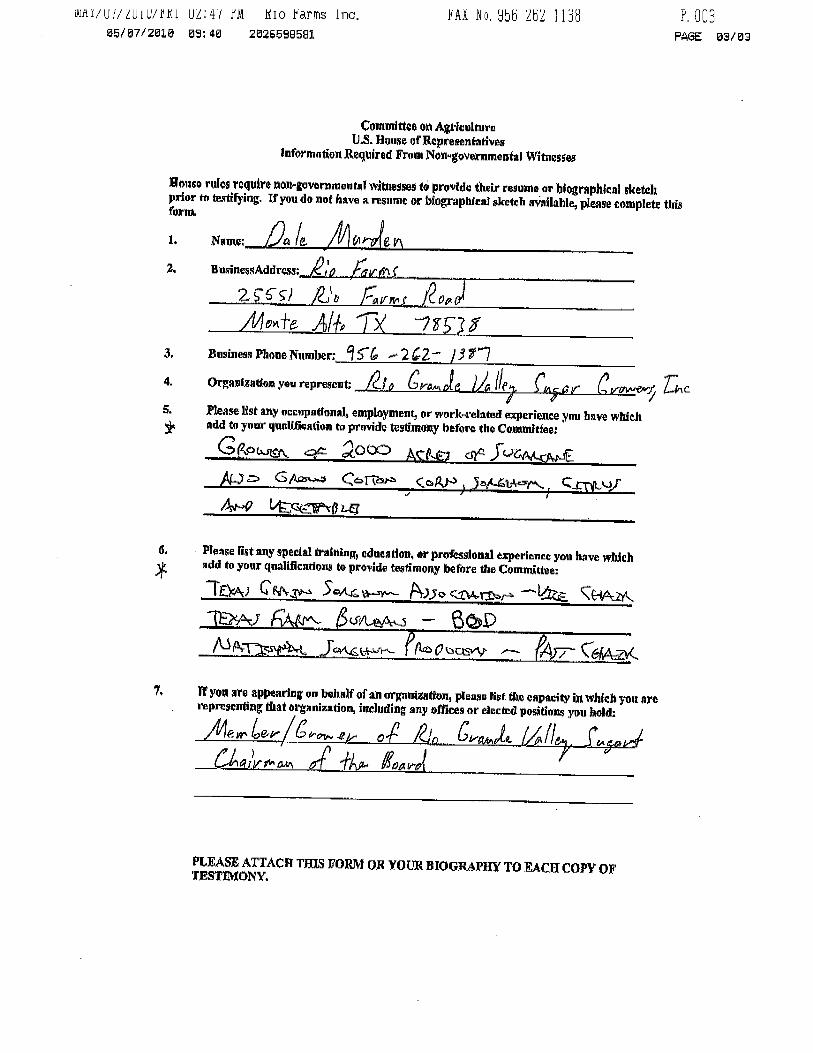
May 17, 2010 Thank you, Mr. Chairman and members of the Committee, for convening this hearing. On behalf of the 126 sugarcane farmers of Rio Grande Valley Sugar Growers (RGVGS), Inc., I want to express my deep appreciation for your leadership and bipartisanship in the successful passage of the 2008 Farm Bill. We look forward to working with you on the 2012 Farm Bill as well. My name is Dale Murden, and I currently grow sugarcane, citrus, grains, vegetables and soybeans near my hometown of Monte Alto, Texas. In addition to being Chairman of the Board for the Rio Grande Valley Sugar Mill, I am also a member of the Hidalgo County Farm Bureau, Delta Lake Irrigation District, Texas Citrus Producers Board and the Hidalgo County AgriLife Program Committee. I was recently chairman of the National Sorghum Producers and a trade advisory team member to the U.S. Grains Council. Rio Grande Valley Sugar Growers, Inc. is a member-owned cooperative comprised of growers in a three-county area. Together, our members produce more than 1.5 million tons of sugarcane each year, yielding nearly 160,000 tons of raw sugar and 60,000 tons of molasses. RGVSG is one of the top 10 producers of raw sugar in the United States. Rio Grande employs up to 500 workers in a normal producing year, which culminates with a harvesting period from October to April. Annual payroll of our cooperative exceeds $12 million, with an annual operating budget of more than $32 million. In Texas, where more than 8,000 jobs rely on a strong U.S. sweetener industry, RGVSG alone accounts for up to 11 percent of the total gross revenues produced by Valley agriculture every year. Member growers utilize over 40,000 acres of rich South Texas farmland in the cultivation of sugarcane crops. The sugar provisions in the 2008 Farm Bill have given our producers confidence in the stability of a domestic sugar industry. Today, I will commend the sugar program’s effectiveness but I also want to point out areas where we have some problems.
In January, a bad freeze in south Texas proved that the federal crop insurance program and the new permanent disaster program don’t adequately cover our style of farming in the Valley. Affordable crop insurance at higher levels of coverage isn’t available for cane and many of the fruits and vegetables grown in south Texas. Also, the SURE program won’t cover losses to one crop if overall on farm revenues from the other crops grown on that farm are unaffected by a natural disaster.
Finally, the Biomass Crop Assistance Program (BCAP), created in the 2008 Farm Bill and whose intention was to help biomass producers offset specific costs, did not make payments on our cane applications yet approved $170 million in funds to other biomass producers.
2
However, I do want to focus on one program that is working and explain why because our future ultimately depends on good farm and trade policy.
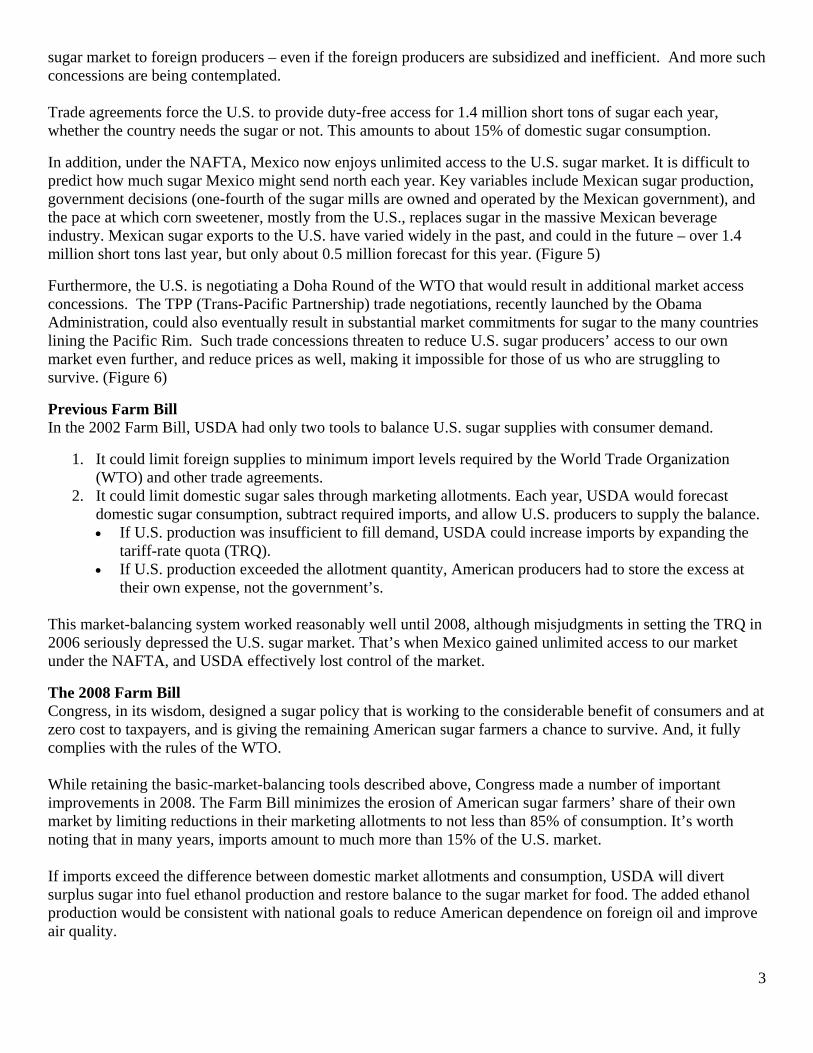
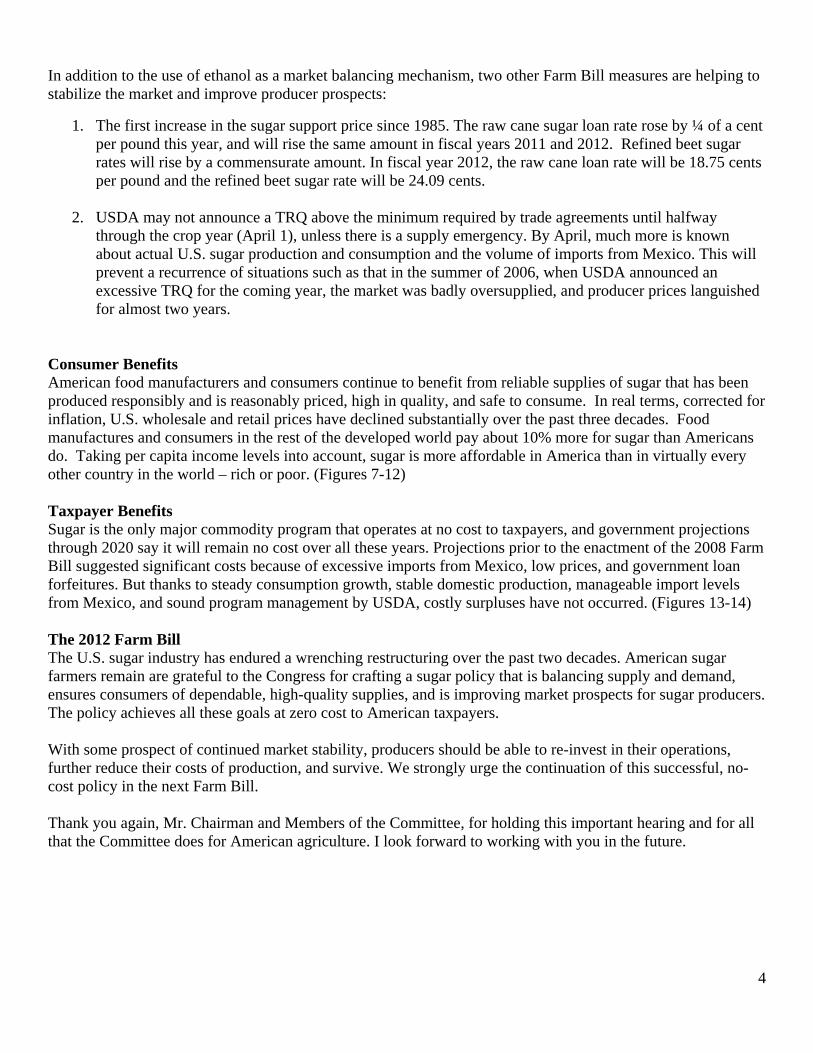
Food Security Sugar is an essential ingredient in our nation’s food supply. As an all-natural sweetener, bulking agent and preservative, it plays an important role in about 70% of processed food products and is called for in a multitude of favorite home recipes. Dependence on unreliable and unstable foreign suppliers is a threat to our food security, which is why a strong, diversified and reliable domestic industry has long been recognized as important to the nation. U.S. sugar producers are globally competitive, but for decades we have been threatened by unfair competition. Roughly 120 countries produce sugar and all their governments intervene in their sugar markets in some way. Many countries subsidize their producers and dump their surpluses on the world market for whatever price it will bring. This depressed, so-called “world price” has averaged below actual global costs of producing sugar for many years. American producers are competitive, but cannot be expected to compete against these foreign treasuries and unfair predatory trade practices. Importance, Size, Efficiency In addition to the critical role it plays in local economies, sugar is a significant job producer and revenue-generator nationally. The U.S. sugar producing industry, with sugarbeets and sugarcane grown or processed in 18 states, generates over 146,000 jobs and more than $10 billion per year in economic activity. These jobs range from the cane fields of Hawaii and the beet fields of Wyoming to the cane sugar refineries in New Orleans, New York City, and other cities. The United States is the world’s fifth-largest sugar producer. We are also the fifth-largest sugar consumer and the world’s second-largest net importer. And, we are good at what we do. Our sugar farmers are among the lowest cost producers in the world. We are doubly proud of this distinction because we have achieved it while being fair to our workers and responsible stewards of the land. Farmers in the developing world, who dominate the world sugar market, generally operate with little or no enforced requirements for worker safety and benefits, or for air, water, and soil protection. Our standards, and compliance costs, are among the highest in the world. Restructuring Despite our efficiency, we are an industry that has been under enormous stress. From 1985 until 2009, we did not receive any increase in our price support level. Over this long period of essentially flat nominal prices, the real price we received for our sugar dropped sharply because of inflation. (Figures 1-2) Only the producers who could match the declining real price with efficiency gains and lower production costs were able to survive. More than half could not. From 1985 to 2009, 54 of America’s 102 cane mills, beet factories, and cane sugar refineries shut down, with terrible consequences for the local families and communities. Just since 1996, 35 mills, factories, and refineries have closed. (Figures 3-4) Trade Challenges The U.S. is one of the most open sugar markets and one of the world’s largest sugar importers. The U.S. provides access to its market to 41 countries, as it is required to do under trade laws. Virtually all are developing countries, and most are highly supportive of U.S. sugar policy because it provides an import price at which many can recover their costs of production.
In addition to coping with the problems of rising costs, pests, disease, and natural disasters, American sugar farmers have had to deal with another threat: trade agreements that have ceded more and more of the American
3
sugar market to foreign producers – even if the foreign producers are subsidized and inefficient. And more such concessions are being contemplated. Trade agreements force the U.S. to provide duty-free access for 1.4 million short tons of sugar each year, whether the country needs the sugar or not. This amounts to about 15% of domestic sugar consumption.
In addition, under the NAFTA, Mexico now enjoys unlimited access to the U.S. sugar market. It is difficult to predict how much sugar Mexico might send north each year. Key variables include Mexican sugar production, government decisions (one-fourth of the sugar mills are owned and operated by the Mexican government), and the pace at which corn sweetener, mostly from the U.S., replaces sugar in the massive Mexican beverage industry. Mexican sugar exports to the U.S. have varied widely in the past, and could in the future – over 1.4 million short tons last year, but only about 0.5 million forecast for this year. (Figure 5)
Furthermore, the U.S. is negotiating a Doha Round of the WTO that would result in additional market access concessions. The TPP (Trans-Pacific Partnership) trade negotiations, recently launched by the Obama Administration, could also eventually result in substantial market commitments for sugar to the many countries lining the Pacific Rim. Such trade concessions threaten to reduce U.S. sugar producers’ access to our own market even further, and reduce prices as well, making it impossible for those of us who are struggling to survive. (Figure 6)
Previous Farm Bill In the 2002 Farm Bill, USDA had only two tools to balance U.S. sugar supplies with consumer demand.
1. It could limit foreign supplies to minimum import levels required by the World Trade Organization (WTO) and other trade agreements.
2. It could limit domestic sugar sales through marketing allotments. Each year, USDA would forecast domestic sugar consumption, subtract required imports, and allow U.S. producers to supply the balance. If U.S. production was insufficient to fill demand, USDA could increase imports by expanding the
tariff-rate quota (TRQ). If U.S. production exceeded the allotment quantity, American producers had to store the excess at
their own expense, not the government’s.
This market-balancing system worked reasonably well until 2008, although misjudgments in setting the TRQ in 2006 seriously depressed the U.S. sugar market. That’s when Mexico gained unlimited access to our market under the NAFTA, and USDA effectively lost control of the market.
The 2008 Farm Bill Congress, in its wisdom, designed a sugar policy that is working to the considerable benefit of consumers and at zero cost to taxpayers, and is giving the remaining American sugar farmers a chance to survive. And, it fully complies with the rules of the WTO. While retaining the basic-market-balancing tools described above, Congress made a number of important improvements in 2008. The Farm Bill minimizes the erosion of American sugar farmers’ share of their own market by limiting reductions in their marketing allotments to not less than 85% of consumption. It’s worth noting that in many years, imports amount to much more than 15% of the U.S. market. If imports exceed the difference between domestic market allotments and consumption, USDA will divert surplus sugar into fuel ethanol production and restore balance to the sugar market for food. The added ethanol production would be consistent with national goals to reduce American dependence on foreign oil and improve air quality.
4
In addition to the use of ethanol as a market balancing mechanism, two other Farm Bill measures are helping to stabilize the market and improve producer prospects:
1. The first increase in the sugar support price since 1985. The raw cane sugar loan rate rose by ¼ of a cent per pound this year, and will rise the same amount in fiscal years 2011 and 2012. Refined beet sugar rates will rise by a commensurate amount. In fiscal year 2012, the raw cane loan rate will be 18.75 cents per pound and the refined beet sugar rate will be 24.09 cents.
2. USDA may not announce a TRQ above the minimum required by trade agreements until halfway through the crop year (April 1), unless there is a supply emergency. By April, much more is known about actual U.S. sugar production and consumption and the volume of imports from Mexico. This will prevent a recurrence of situations such as that in the summer of 2006, when USDA announced an excessive TRQ for the coming year, the market was badly oversupplied, and producer prices languished for almost two years.
Consumer Benefits American food manufacturers and consumers continue to benefit from reliable supplies of sugar that has been produced responsibly and is reasonably priced, high in quality, and safe to consume. In real terms, corrected for inflation, U.S. wholesale and retail prices have declined substantially over the past three decades. Food manufactures and consumers in the rest of the developed world pay about 10% more for sugar than Americans do. Taking per capita income levels into account, sugar is more affordable in America than in virtually every other country in the world – rich or poor. (Figures 7-12) Taxpayer Benefits Sugar is the only major commodity program that operates at no cost to taxpayers, and government projections through 2020 say it will remain no cost over all these years. Projections prior to the enactment of the 2008 Farm Bill suggested significant costs because of excessive imports from Mexico, low prices, and government loan forfeitures. But thanks to steady consumption growth, stable domestic production, manageable import levels from Mexico, and sound program management by USDA, costly surpluses have not occurred. (Figures 13-14) The 2012 Farm Bill The U.S. sugar industry has endured a wrenching restructuring over the past two decades. American sugar farmers remain are grateful to the Congress for crafting a sugar policy that is balancing supply and demand, ensures consumers of dependable, high-quality supplies, and is improving market prospects for sugar producers. The policy achieves all these goals at zero cost to American taxpayers. With some prospect of continued market stability, producers should be able to re-invest in their operations, further reduce their costs of production, and survive. We strongly urge the continuation of this successful, no-cost policy in the next Farm Bill. Thank you again, Mr. Chairman and Members of the Committee, for holding this important hearing and for all that the Committee does for American agriculture. I look forward to working with you in the future.
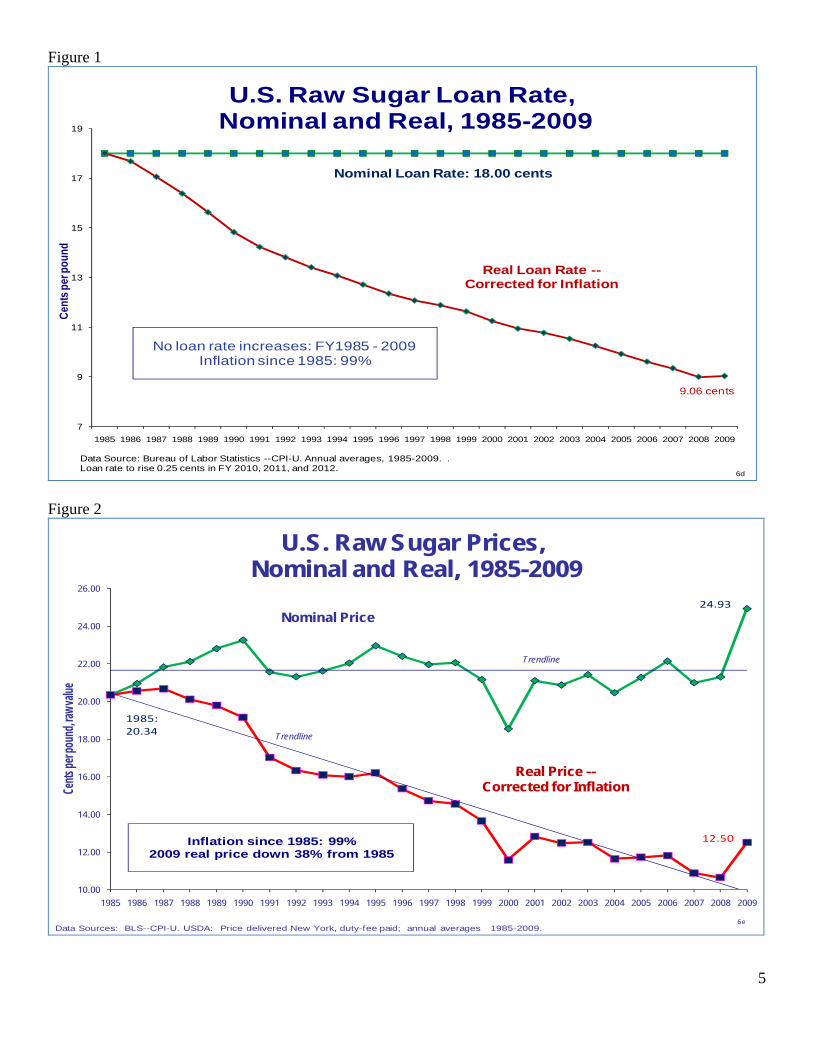
Figure 1
7
9
11
13
15
17
19
1985 1986 1987 1988 1989 1990 1991 1992 1993 1994 1995 1996 1997 1998 1999 2000 2001 2002 2003 2004 2005 2006 2007 2008 2009
U.S. Raw Sugar Loan Rate, Nominal and Real, 1985-2009
Nominal Loan Rate: 18.00 cents
Real Loan Rate --Corrected for Inflation
9.06 cents
Data Source: Bureau of Labor Statistics --CPI-U. Annual averages, 1985-2009. . Loan rate to rise 0.25 cents in FY 2010, 2011, and 2012.
Cen
ts p
er p
ound
6d
No loan rate increases: FY1985 - 2009 Inflation since 1985: 99%
Figure 2
10.00
12.00
14.00
16.00
18.00
20.00
22.00
24.00
26.00
1985 1986 1987 1988 1989 1990 1991 1992 1993 1994 1995 1996 1997 1998 1999 2000 2001 2002 2003 2004 2005 2006 2007 2008 2009
Cent
s per
poun
d, ra
w va
lue
Real Price --Corrected for Inflation
Trendline
Trendline
Data Sources: BLS--CPI-U. USDA: Price delivered New York, duty-fee paid; annual averages 1985-2009.
Nominal Price
U.S. Raw Sugar Prices, Nominal and Real, 1985-2009
6e
Inflation since 1985: 99%2009 real price down 38% from 1985
24.93
1985:20.34
12.50
5
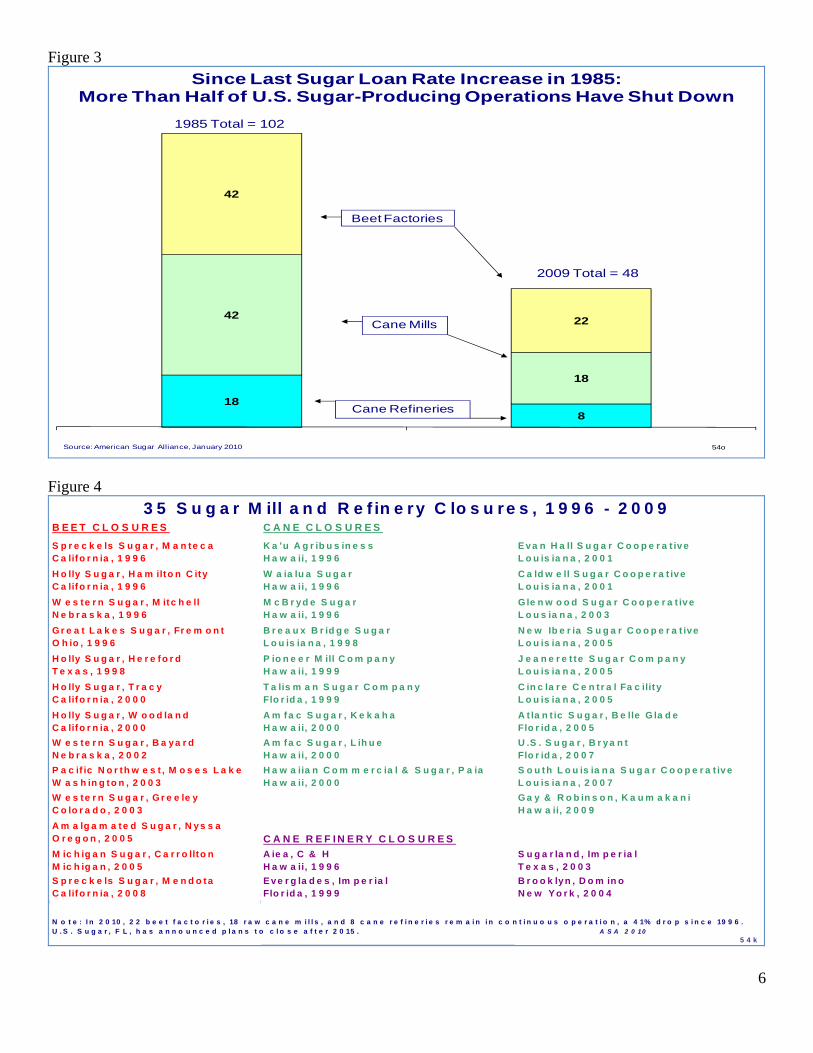
Figure 3
18
8
42
18
42
22
1985 2009
1985 Total = 102
2009 Total = 48
Cane Refineries
Cane Mills
Beet Factories
Since Last Sugar Loan Rate Increase in 1985: More Than Half of U.S. Sugar-Producing Operations Have Shut Down
Source: American Sugar Alliance, January 2010 54o
Figure 4
B E E T C L O S U R E S C A N E C L O S U R E S
S p r e c k e ls S u g a r , M a n te c aC a lifo r n ia , 1 9 9 6
H o lly S u g a r , H a m ilto n C ityC a lifo r n ia , 1 9 9 6
W e s te r n S u g a r , M itc h e llN e b r a s k a , 1 9 9 6
G r e a t L a k e s S u g a r , Fr e m o n tO h io , 1 9 9 6
H o lly S u g a r , H e r e fo r dT e x a s , 1 9 9 8
H o lly S u g a r , T r a c yC a lifo r n ia , 2 0 0 0
H o lly S u g a r , W o o d la n dC a lifo r n ia , 2 0 0 0
K a 'u A g r ib u s in e s s H a w a ii, 1 9 9 6
E va n H a ll S u g a r C o o p e r a t iveL o u is ia n a , 2 0 0 1
W a ia lu a S u g a rH a w a ii, 1 9 9 6
C a ld w e ll S u g a r C o o p e r a t iveL o u is ia n a , 2 0 0 1
M c B r yd e S u g a rH a w a ii, 1 9 9 6
G le n w o o d S u g a r C o o p e r a t ive L o u s ia n a , 2 0 0 3
B r e a u x B r id g e S u g a rL o u is ia n a , 1 9 9 8
N e w Ib e r ia S u g a r C o o p e r a t ive L o u is ia n a , 2 0 0 5
P io n e e r M ill C o m p a n yH a w a ii, 1 9 9 9
J e a n e r e t te S u g a r C o m p a n y L o u is ia n a , 2 0 0 5
T a lis m a n S u g a r C o m p a n yFlo r id a , 1 9 9 9
C in c la r e C e n t r a l Fa c ilit y L o u is ia n a , 2 0 0 5
A m fa c S u g a r , K e k a h aH a w a ii, 2 0 0 0
A t la n t ic S u g a r , B e lle G la d e Flo r id a , 2 0 0 5
A m fa c S u g a r , L ih u eH a w a ii, 2 0 0 0
U .S . S u g a r , B r ya n tFlo r id a , 2 0 0 7
H a w a iia n C o m m e r c ia l & S u g a r , P a ia H a w a ii, 2 0 0 0
S o u th L o u is ia n a S u g a r C o o p e r a t ive L o u is ia n a , 2 0 0 7
G a y & R o b in s o n , K a u m a k a n i H a w a ii, 2 0 0 9
C A N E R E F I N E R Y C L O S U R E S
W e s te r n S u g a r , B a ya r dN e b r a s k a , 2 0 0 2
P a c if ic N o r th w e s t , M o s e s L a k e W a s h in g to n , 2 0 0 3
W e s te r n S u g a r , G r e e le y C o lo r a d o , 2 0 0 3
A m a lg a m a te d S u g a r , N ys s a O r e g o n , 2 0 0 5
M ic h ig a n S u g a r , C a r r o llto n M ic h ig a n , 2 0 0 5
S p r e c k e ls S u g a r , M e n d o ta C a lifo r n ia , 2 0 0 8
A ie a , C & HH a w a ii, 1 9 9 6
S u g a r la n d , Im p e r ia lT e x a s , 2 0 0 3
E ve r g la d e s , Im p e r ia lFlo r id a , 1 9 9 9
B r o o k lyn , D o m in oN e w Y o r k , 2 0 0 4
5 4 k
3 5 S u g a r M ill a n d R e f in e ry C lo s u re s , 1 9 9 6 - 2 0 0 9
N o t e : I n 2 0 10 , 2 2 b e e t f a c t o r i e s , 18 r a w c a n e m i l l s , a n d 8 c a n e r e f i n e r i e s r e m a i n i n c o n t i n u o u s o p e r a t i o n , a 4 1% d r o p s i n c e 19 9 6 . U . S . S u g a r , F L , h a s a n n o u n c e d p l a n s t o c l o s e a f t e r 2 0 15 . A S A 2 0 10
6
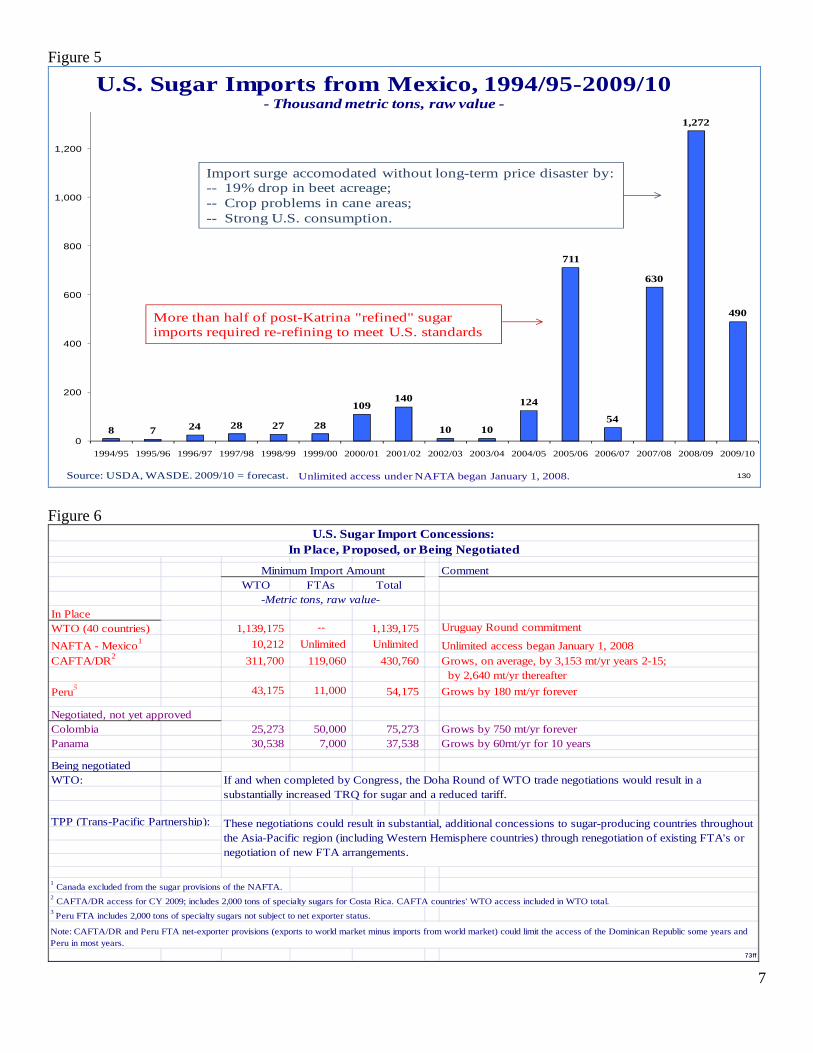
Figure 5
8 7 24 28 27 28
109140
10 10
124
711
54
630
1,272
490
0
200
400
600
800
1,000
1,200
1994/95 1995/96 1996/97 1997/98 1998/99 1999/00 2000/01 2001/02 2002/03 2003/04 2004/05 2005/06 2006/07 2007/08 2008/09 2009/10
U.S. Sugar Imports from Mexico, 1994/95-2009/10- Thousand metric tons, raw value -
Source: USDA, WASDE. 2009/10 = forecast. 130Unlimited access under NAFTA began January 1, 2008.
7
More than half of post-Katrina "refined" sugar imports required re-refining to meet U.S. standards
Import surge accomodated without long-term price disaster by:-- 19% drop in beet acreage;-- Crop problems in cane areas;-- Strong U.S. consumption.
Figure 6
CommentWTO FTAs Total
-Metric tons, raw value-In PlaceWTO (40 countries) 1,139,175 -- 1,139,175 Uruguay Round commitment
NAFTA - Mexico1 10,212 Unlimited Unlimited Unlimited access began January 1, 2008CAFTA/DR2 311,700 119,060 430,760 Grows, on average, by 3,153 mt/yr years 2-15;
by 2,640 mt/yr thereafter
Peru3 43,175 11,000 54,175 Grows by 180 mt/yr forever
Negotiated, not yet approvedColombia 25,273 50,000 75,273 Grows by 750 mt/yr foreverPanama 30,538 7,000 37,538 Grows by 60mt/yr for 10 years
Being negotiatedWTO:
TPP (Trans-Pacific Partnership):
1 Canada excluded from the sugar provisions of the NAFTA.
2 CAFTA/DR access for CY 2009; includes 2,000 tons of specialty sugars for Costa Rica. CAFTA countries' WTO access included in WTO total.
3 Peru FTA includes 2,000 tons of specialty sugars not subject to net exporter status.
73ff
These negotiations could result in substantial, additional concessions to sugar-producing countries throughout the Asia-Pacific region (including Western Hemisphere countries) through renegotiation of existing FTA's or negotiation of new FTA arrangements.
U.S. Sugar Import Concessions:In Place, Proposed, or Being Negotiated
Minimum Import Amount
Note: CAFTA/DR and Peru FTA net-exporter provisions (exports to world market minus imports from world market) could limit the access of the Dominican Republic some years and Peru in most years.
If and when completed by Congress, the Doha Round of WTO trade negotiations would result in a substantially increased TRQ for sugar and a reduced tariff.
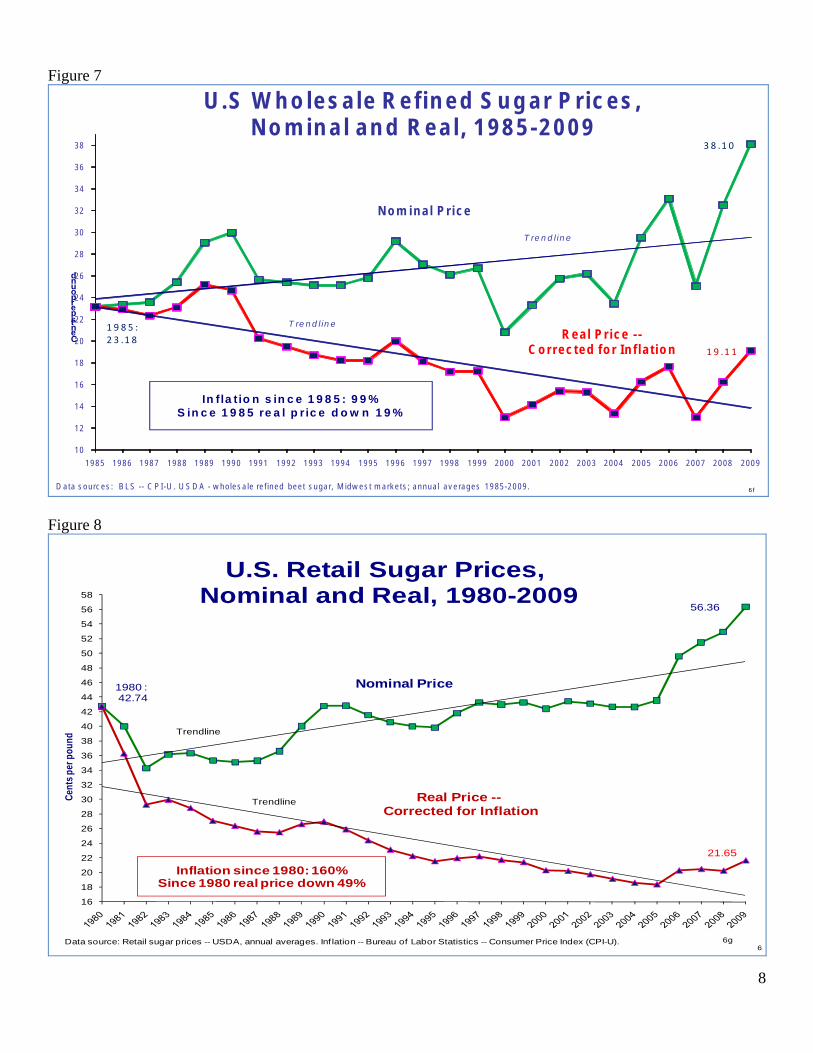
Figure 7
10
12
14
16
18
20
22
24
26
28
30
32
34
36
38
19 8 5 19 86 1 98 7 19 8 8 1 9 89 1 99 0 19 91 1 9 92 1 99 3 19 94 1 99 5 1 99 6 19 97 1 99 8 19 9 9 20 00 2 00 1 20 0 2 20 03 2 00 4 20 05 2 0 06 2 00 7 20 08 2 00 9
U .S W h o le s a le R e f in e d S u g a r P r ic e s ,N o m in a l a n d R e a l, 1 9 8 5 -2 0 0 9
D ata s o u rc es : B L S -- C P I -U . U S D A - w h o le s a le re f in ed b e e t s u ga r, M id w e s t m a rk e ts ; an nu a l a v e rag es 1 9 85 -2 0 09 .
N o m in a l P r ic e
R e a l P r ic e - -C o r r e c te d fo r In f la t io n
T re n d l in e
T re n d l in e
8
In f la t io n s in c e 1 9 8 5 : 9 9 %S in c e 1 9 8 5 re a l p r ic e d o w n 1 9 %
6 f
Cents per pound
3 8 .1 0
1 9 8 5 :2 3 .1 8
1 9 .1 1
Figure 8
16
18
20
22
24
26
28
30
32
34
36
38
40
42
44
46
48
50
52
54
56
58
Cen
ts p
er p
ound
U.S. Retail Sugar Prices, Nominal and Real, 1980-2009
Nominal Price
Real Price --Corrected for Inflation
Inflation since 1980: 160%Since 1980 real price down 49%
Data source: Retail sugar prices -- USDA, annual averages. Inf lation -- Bureau of Labor Statistics -- Consumer Price Index (CPI-U).6
Trendline
Trendline
1980 : 42.74
56.36
6g
21.65
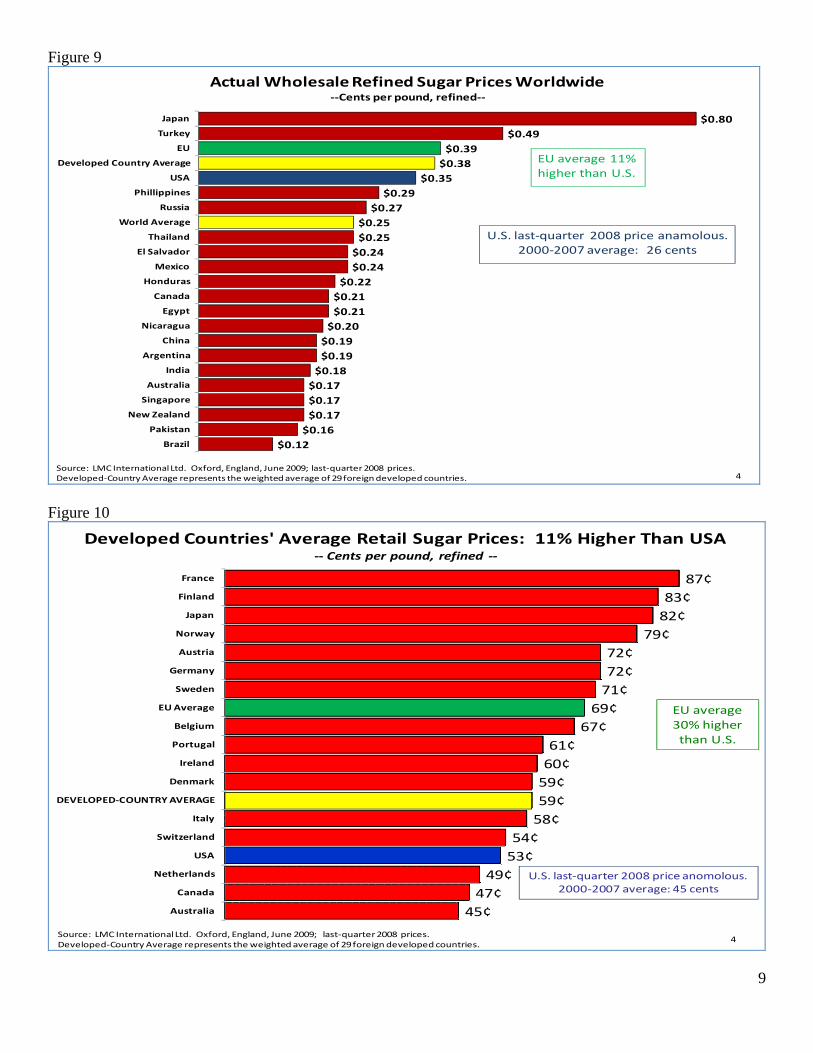
Figure 9
$0.80
$0.49
$0.39
$0.38
$0.35
$0.29
$0.27
$0.25
$0.25
$0.24
$0.24
$0.22
$0.21
$0.21
$0.20
$0.19
$0.19
$0.18
$0.17
$0.17
$0.17
$0.16
$0.12
Japan
Turkey
EU
Developed Country Average
USA
Phillippines
Russia
World Average
Thailand
El Salvador
Mexico
Honduras
Canada
Egypt
Nicaragua
China
Argentina
India
Australia
Singapore
New Zealand
Pakistan
Brazil
Actual Wholesale Refined Sugar Prices Worldwide‐‐Cents per pound, refined‐‐
Source: LMC InternationalLtd. Oxford, England, June 2009; last‐quarter 2008 prices. Developed‐Country Average represents the weighted average of 29 foreign developed countries.
EU average 11% higher than U.S.
U.S. last‐quarter 2008 price anamolous.2000‐2007 average: 26 cents
4 Figure 10
87¢
83¢
82¢
79¢
72¢
72¢
71¢
69¢
67¢
61¢
60¢
59¢
59¢
58¢
54¢
53¢
49¢
47¢
45¢
France
Finland
Japan
Norway
Austria
Germany
Sweden
EU Average
Belgium
Portugal
Ireland
Denmark
DEVELOPED‐COUNTRY AVERAGE
Italy
Switzerland
USA
Netherlands
Canada
Australia
Developed Countries' Average Retail Sugar Prices: 11% Higher Than USA‐‐ Cents per pound, refined ‐‐
Source: LMC InternationalLtd. Oxford, England, June 2009; last‐quarter 2008 prices. Developed‐Country Average represents the weighted average of 29 foreign developed countries.
EU average 30% higherthan U.S.
U.S. last‐quarter 2008 price anomolous.2000‐2007 average: 45 cents
4
9
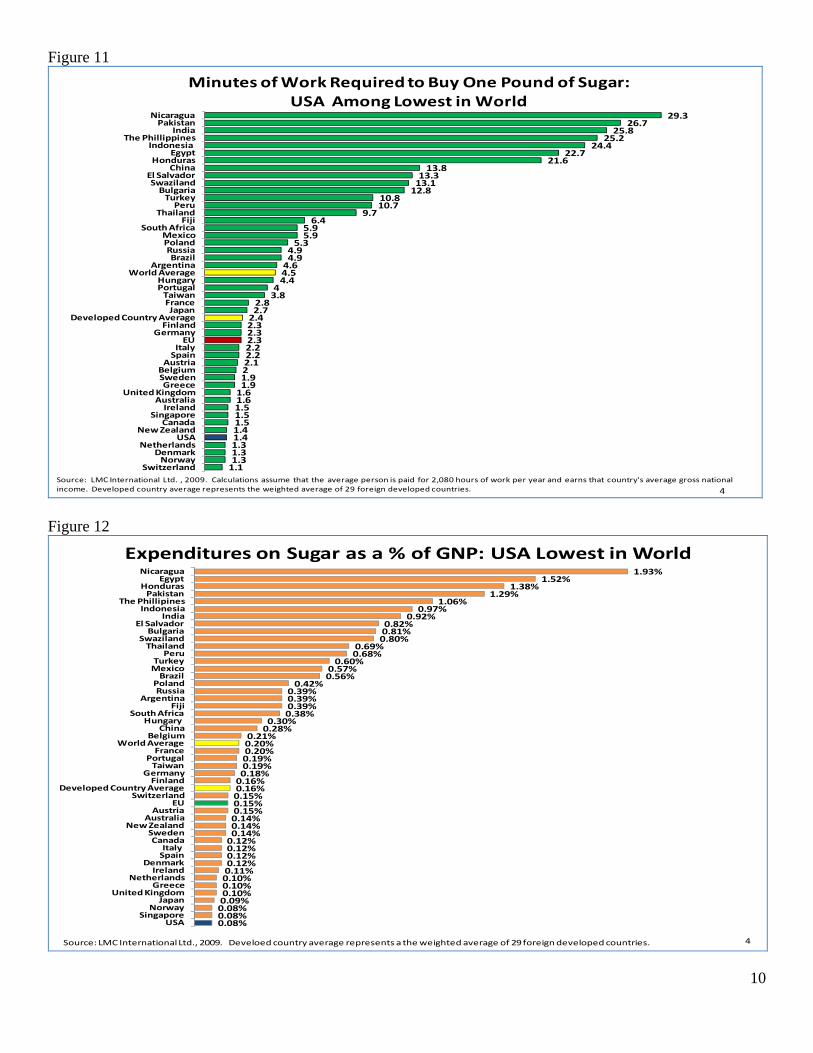
Figure 11
29.326.7
25.825.2
24.422.7
21.613.8
13.313.112.8
10.810.7
9.76.4
5.95.9
5.34.94.94.64.54.4
43.8
2.82.72.42.32.32.32.22.22.121.91.91.61.61.51.51.51.41.41.31.31.31.1
NicaraguaPakistan
IndiaThe Phillippines
Indonesia Egypt
HondurasChina
El SalvadorSwazilandBulgariaTurkeyPeru
ThailandFiji
South AfricaMexicoPolandRussiaBrazil
ArgentinaWorld Average
HungaryPortugalTaiwanFranceJapan
Developed Country AverageFinland
GermanyEU
ItalySpain
AustriaBelgiumSwedenGreece
United KingdomAustraliaIreland
SingaporeCanada
New ZealandUSA
NetherlandsDenmarkNorway
Switzerland
Minutes of Work Required to Buy One Pound of Sugar: USA Among Lowest in World
Source: LMC International Ltd. , 2009. Calculations assume that the average person is paid for 2,080 hours of work per year and earns that country's average gross national income. Developed country average represents the weighted average of 29 foreign developed countries. 4
Figure 12
1.93%1.52%
1.38%1.29%
1.06%0.97%
0.92%0.82%0.81%0.80%
0.69%0.68%
0.60%0.57%0.56%
0.42%0.39%0.39%0.39%0.38%
0.30%0.28%
0.21%0.20%0.20%0.19%0.19%0.18%0.16%0.16%0.15%0.15%0.15%0.14%0.14%0.14%0.12%0.12%0.12%0.12%0.11%0.10%0.10%0.10%0.09%0.08%0.08%0.08%
NicaraguaEgypt
HondurasPakistan
The PhillipinesIndonesia
IndiaEl Salvador
BulgariaSwazilandThailand
PeruTurkeyMexicoBrazil
PolandRussia
ArgentinaFiji
South AfricaHungary
ChinaBelgium
World AverageFrance
PortugalTaiwan
GermanyFinland
Developed Country AverageSwitzerland
EUAustria
AustraliaNew Zealand
SwedenCanadaItaly Spain
DenmarkIreland
NetherlandsGreece
United KingdomJapan
NorwaySingapore
USA
Expenditures on Sugar as a % of GNP: USA Lowest in World
Source: LMC InternationalLtd., 2009. Develoed country average represents a the weighted average of 29 foreign developed countries. 4
10
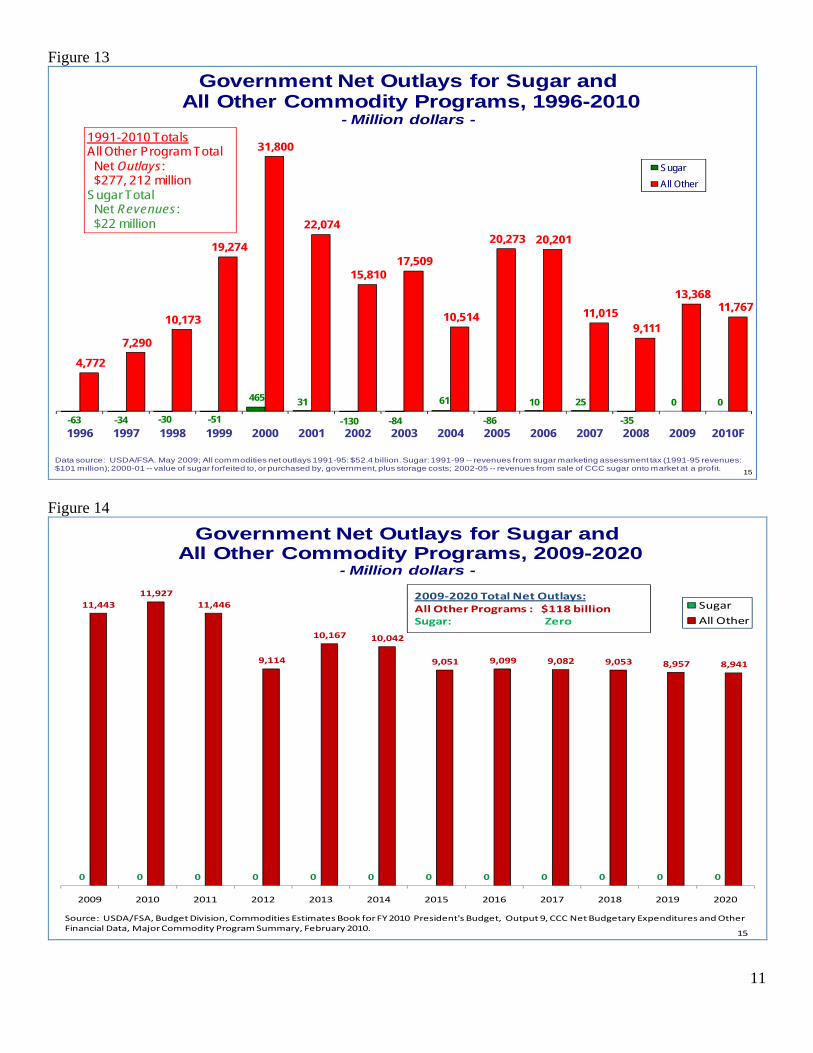
Figure 13
-63 -34 -30 -51
465 31
-130 -84
61
-86
10 25
-35
0 0
4,772
7,290
10,173
19,274
31,800
22,074
15,810 17,509
10,514
20,273 20,201
11,015 9,111
13,368 11,767
11
1996 1997 1998 1999 2000 2001 2002 2003 2004 2005 2006 2007 2008 2009 2010F
Sugar
All Other
Data source: USDA/FSA. May 2009; All commodities net outlays 1991-95: $52.4 billion. Sugar: 1991-99 -- revenues from sugar marketing assessment tax (1991-95 revenues: $101 million); 2000-01 -- value of sugar forfeited to, or purchased by, government, plus storage costs; 2002-05 -- revenues from sale of CCC sugar onto market at a profit.
1991-2010 TotalsAll Other Program Total Net Outlays: $277, 212 million
Sugar Total Net Revenues: $22 million
Government Net Outlays for Sugar and All Other Commodity Programs, 1996-2010
- Million dollars -
15 Figure 14
0 0 0 0 0 0 0 0 0 0 0 0
11,443
11,927
11,446
9,114
10,167 10,042
9,051 9,099 9,082 9,053 8,957 8,941
2009 2010 2011 2012 2013 2014 2015 2016 2017 2018 2019 2020
Sugar
All Other
Government Net Outlays for Sugar and All Other Commodity Programs, 2009-2020
- Million dollars -
Source: USDA/FSA, Budget Division, Commodities Estimates Book for FY 2010 President's Budget, Output 9, CCC Net Budgetary Expenditures and Other Financial Data, Major Commodity Program Summary, February 2010.
2009‐2020 Total Net Outlays:All Other Programs : $118 billionSugar: Zero
15