Embed Size (px)
Citation preview

ORNL/TM-2004/126
Test Report for Cricket Radiation Detection System Used In EPA Port Installations
June 2004 Prepared by Ayman A. Shourbaji Larry D. Phillips Peter J. Chiaro, Jr.

DOCUMENT AVAILABILITY
Reports produced after January 1, 1996, are generally available free via the U.S. Department of Energy (DOE) Information Bridge:
Web site: http://www.osti.gov/bridge Reports produced before January 1, 1996, may be purchased by members of the public from the following source:
National Technical Information Service 5285 Port Royal Road Springfield, VA 22161 Telephone: 703-605-6000 (1-800-553-6847) TDD: 703-487-4639 Fax: 703-605-6900 E-mail: [email protected] Web site: http://www.ntis.gov/support/ordernowabout.htm
Reports are available to DOE employees, DOE contractors, Energy Technology Data Exchange (ETDE) representatives, and International Nuclear Information System (INIS) representatives from the following source:
Office of Scientific and Technical Information P.O. Box 62 Oak Ridge, TN 37831 Telephone: 865-576-8401 Fax: 865-576-5728 E-mail: [email protected] Web site: http://www.osti.gov/contact.html
DISCLAIMER
This report was prepared as an account of work sponsored by an agency of the United States Government. Neither the United States government nor any agency thereof, nor any of their employees, makes any warranty, express or implied, or assumes any legal liability or responsibility for the accuracy, completeness, or usefulness of any information, apparatus, product, or process disclosed, or represents that its use would not infringe privately owned rights. Reference herein to any specific commercial product, process, or service by trade name, trademark, manufacturer, or otherwise, does not necessarily constitute or imply its endorsement, recommendation, or favoring by the United States Government or any agency thereof. The views and opinions of authors expressed herein do not necessarily state or reflect those of the United States Government or any agency thereof.
COPYRIGHT NOTICE
The submitted manuscript has been authored by a contractor of the U.S. Government under contract DE AC05 00OR22725. Accordingly, the U.S. Government retains a paid-up, nonexclusive, irrevocable, worldwide license to publish or reproduce the published form of this contribution, prepare derivative works, distribute copies to the public, and perform publicly and display publicly, or allow others to do so, for U.S. Government purposes.

ORNL/TM-2004/126
TEST REPORT FOR CRICKET RADIATION DETECTION SYSTEM USED
IN EPA PORT INSTALLATIONS
Ayman A. Shourbaji Larry D. Phillips
Peter J. Chiaro, Jr.
June 2004
Prepared by OAK RIDGE NATIONAL LABORATORY
P.O. Box 2008 Oak Ridge, Tennessee 37831-6285
managed by UT-Battelle, LLC
for the U.S. DEPARTMENT OF ENERGY
under contract DE-AC05-00OR22725

iii
CONTENTS Page EXECUTIVE SUMMARY .................................................................................................................. iv 1.0 INTRODUCTION ........................................................................................................................ 1 2.0 FIELD TEST LOCATIONS & CRICKET SYSTEMS................................................................ 1 3.0 TEST RESULTS .......................................................................................................................... 4
3.1 ALARM RESPONSE........................................................................................................... 4 3.2 OBSERVATIONS................................................................................................................ 5 3.3 MEASUREMENT SENSITIVITY ...................................................................................... 6
4.0 RECOMMENDATIONS.............................................................................................................. 7 REFERENCES .................................................................................................................................... 9 APPENDIX A. ALARM FLOW DIAGRAM FOR THE CRICKET SYSTEM ................................. 10 APPENDIX B. TEST RESULTS FOR DARROW AND CHARLESTON........................................ 11
iv
EXECUTIVE SUMMARY Oak Ridge National Laboratory conducted field radiological measurements at two port locations at the request of the Environmental Protection Agency (EPA). The radiological measurements were performed on five radiation detection systems at the port of Darrow, Louisiana and three systems at the port of Charleston, South Carolina. Darrow was visited on January 20-23, 2004 and Charleston on May 25, 2004. All tested systems are designed to detect radioactive material that might be present in scrap metals as the scrap is being unloaded from ships. All eight systems are commercially known as the Cricket and manufactured by RAD/COMM Systems. Each radiation detection system consists of a detector with two channels and a wireless transmitter, both mounted on the grapple, and a controller located in the crane cab. The cranes at both locations are operated by the Cooper T. Smith Company. The purpose of the radiological measurements was to evaluate the performance of the radiation detection systems in terms of their ability to detect elevated radiation levels, and to develop a routine testing method for all EPA Cricket systems.
1
1.0 INTRODUCTION Oak Ridge National Laboratory (ORNL) conducted field radiological measurements at two port locations at the request of the Environmental Protection Agency (EPA). The radiological measurements were performed on five radiation detection systems at the port of Darrow, Louisiana (Darrow) and three systems at the port of Charleston, South Carolina (Charleston). Darrow was visited on January 20-23, 2004 and Charleston on May 25, 2004. All tested systems are designed to detect radioactive material that might be present in scrap metals as the scrap is being unloaded from ships. All eight Cricket systems are commercially available and manufactured by RAD/COMM Systems. Each radiation detection system consists of a two-channel (A & B) detection unit and a wireless transmitter, both mounted on the grapple, and a controller located in the crane cab. The cranes at both locations are operated by Cooper T. Smith Company. Radiological measurements were made to evaluate the performance of the radiation detection systems in terms of their ability to detect elevated radiation levels in scrap steel, and to develop a routine testing method for all the EPA Cricket systems. Two sets of data were collected for each system. One set is used for analyzing the alarm response of the detection system in order to compare it with a description of the alarm algorithm provided by RAD/COMM. The other set is used to analyze the detectors’ sensitivity across its surface area. Flow charts, developed by ORNL based on the RAD/COMM alarm algorithm are shown in Appendix A. The alarm response and sensitivity measurements at Darrow were taken using a sealed 137Cs (1.07 µCi as of August 8, 1984) source provided by the EPA. The alarm response and sensitivity measurements at Charleston were obtained using thoriated welding rod sources fabricated by Cooper T. Smith (~50 µrem/hr on contact). Data collected from both sites are listed in Appendix B. Darrow data are listed in tables B1-B10, and Charleston data are listed in tables B11-B12.
2.0 FIELD TEST LOCATIONS & CRICKET SYSTEMS The following is a list of the Cricket systems tested at each location: • Darrow – Five Cricket systems installed on five grapples, and controlled and monitored by one
control unit (RC/5) mounted in the cabin of crane # 1. Figure 1 is a functional block diagram illustrating the five Cricket radiation detection systems’ arrangement.
o Grapple # B3 (size 8 yards) o Grapple # B5 (size 11 yards) o Grapple # B6 (size 11 yards) o Grapple # B14 (size 17 yards) o Grapple # B51 (size 8 yards)

2
Grapple #B3
Grapple #B5
Grapple # B6
Grapple # B14
Grapple # B51
Transmitter Transmitter Transmitter Transmitter Transmitter
Detector 1 Detector 2 Detector 3 Detector 4 Detector 5
Crane #1
RC/5
Antenna Mounted on Boom to Transmit Data to Remote PC
Bill Hanes Barge
Figure 1. Block Diagram Describing the Cricket Radiation Detection Systems at Darrow
Antenna to communicate with detectors
Antennas to communicate with RC/5
3
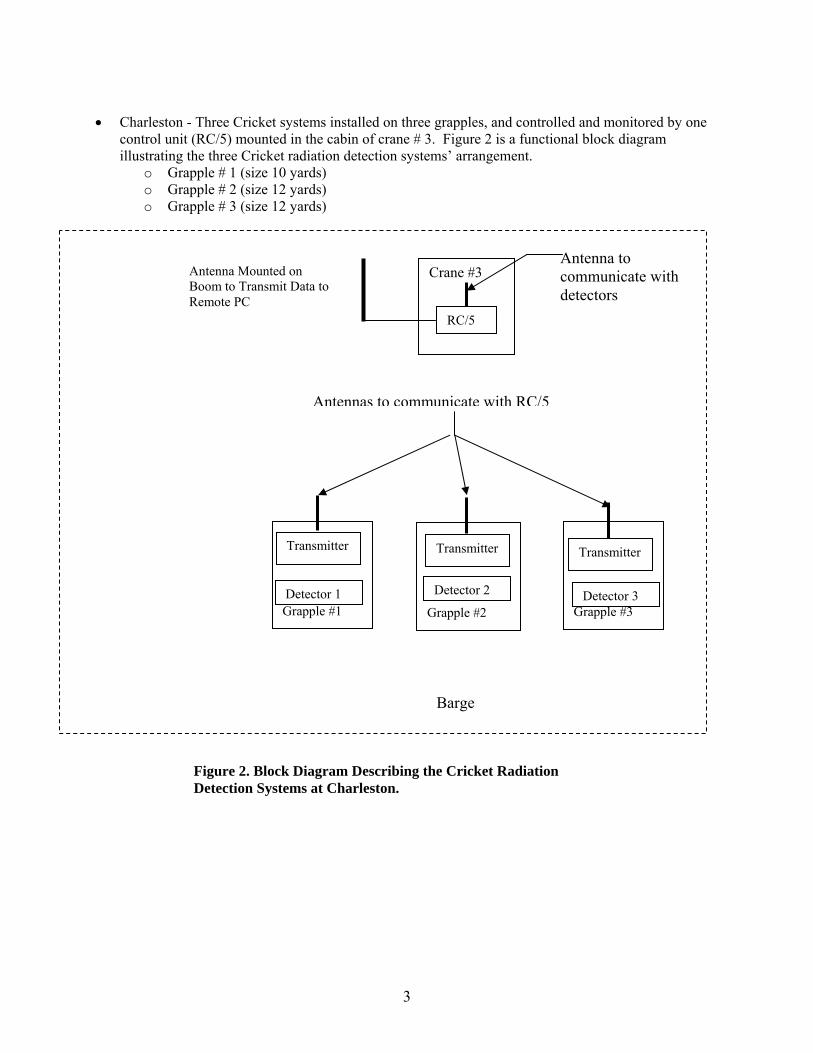
• Charleston - Three Cricket systems installed on three grapples, and controlled and monitored by one
control unit (RC/5) mounted in the cabin of crane # 3. Figure 2 is a functional block diagram illustrating the three Cricket radiation detection systems’ arrangement.
o Grapple # 1 (size 10 yards) o Grapple # 2 (size 12 yards) o Grapple # 3 (size 12 yards)
Grapple #1
Transmitter
Detector 1
Grapple #3
Transmitter
Detector 3
Grapple #2
Transmitter
Detector 2
Antenna to communicate with detectors
Figure 2. Block Diagram Describing the Cricket Radiation Detection Systems at Charleston.
Crane #3
RC/5
Antenna Mounted on Boom to Transmit Data to Remote PC
Barge
Antennas to communicate with RC/5
4
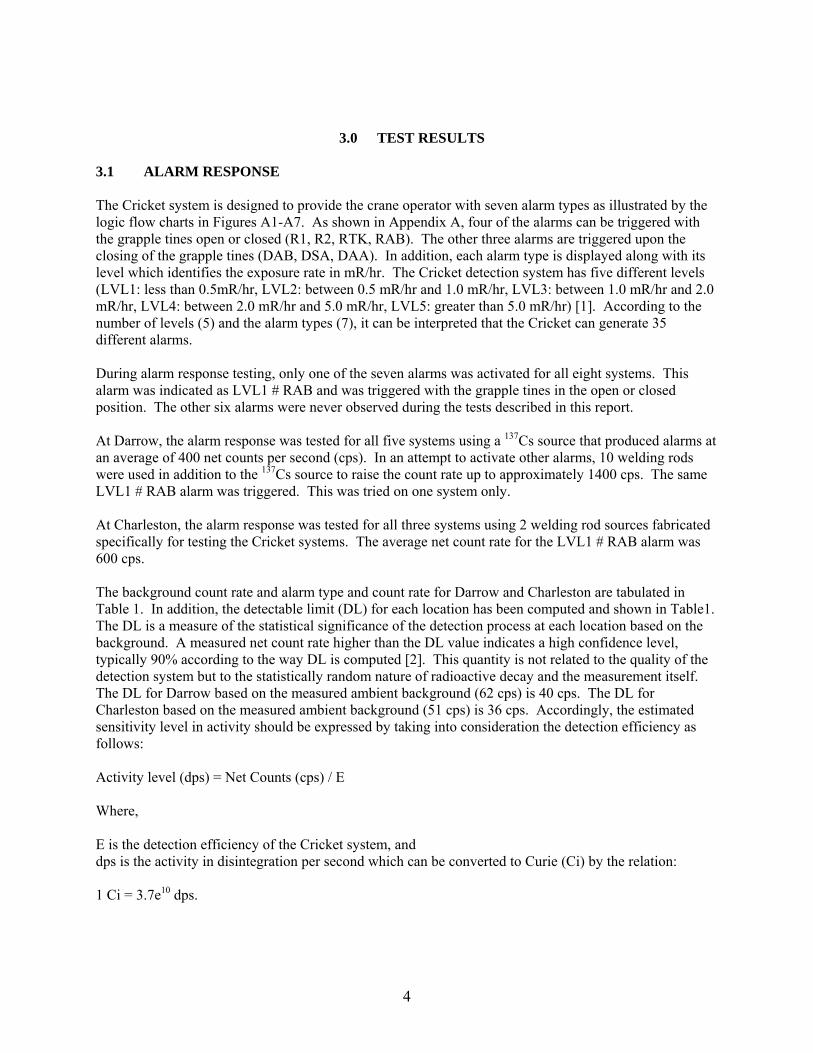
3.0 TEST RESULTS 3.1 ALARM RESPONSE The Cricket system is designed to provide the crane operator with seven alarm types as illustrated by the logic flow charts in Figures A1-A7. As shown in Appendix A, four of the alarms can be triggered with the grapple tines open or closed (R1, R2, RTK, RAB). The other three alarms are triggered upon the closing of the grapple tines (DAB, DSA, DAA). In addition, each alarm type is displayed along with its level which identifies the exposure rate in mR/hr. The Cricket detection system has five different levels (LVL1: less than 0.5mR/hr, LVL2: between 0.5 mR/hr and 1.0 mR/hr, LVL3: between 1.0 mR/hr and 2.0 mR/hr, LVL4: between 2.0 mR/hr and 5.0 mR/hr, LVL5: greater than 5.0 mR/hr) [1]. According to the number of levels (5) and the alarm types (7), it can be interpreted that the Cricket can generate 35 different alarms. During alarm response testing, only one of the seven alarms was activated for all eight systems. This alarm was indicated as LVL1 # RAB and was triggered with the grapple tines in the open or closed position. The other six alarms were never observed during the tests described in this report. At Darrow, the alarm response was tested for all five systems using a 137Cs source that produced alarms at an average of 400 net counts per second (cps). In an attempt to activate other alarms, 10 welding rods were used in addition to the 137Cs source to raise the count rate up to approximately 1400 cps. The same LVL1 # RAB alarm was triggered. This was tried on one system only.
At Charleston, the alarm response was tested for all three systems using 2 welding rod sources fabricated specifically for testing the Cricket systems. The average net count rate for the LVL1 # RAB alarm was 600 cps.
The background count rate and alarm type and count rate for Darrow and Charleston are tabulated in Table 1. In addition, the detectable limit (DL) for each location has been computed and shown in Table1. The DL is a measure of the statistical significance of the detection process at each location based on the background. A measured net count rate higher than the DL value indicates a high confidence level, typically 90% according to the way DL is computed [2]. This quantity is not related to the quality of the detection system but to the statistically random nature of radioactive decay and the measurement itself. The DL for Darrow based on the measured ambient background (62 cps) is 40 cps. The DL for Charleston based on the measured ambient background (51 cps) is 36 cps. Accordingly, the estimated sensitivity level in activity should be expressed by taking into consideration the detection efficiency as follows: Activity level (dps) = Net Counts (cps) / E Where, E is the detection efficiency of the Cricket system, and dps is the activity in disintegration per second which can be converted to Curie (Ci) by the relation: 1 Ci = 3.7e10 dps.

5
3.2 OBSERVATIONS 1. The measured ambient background at Darrow and Charleston, which is in the range of 60 cps,
can be considered as the normal ambient for both locations. Background significantly higher than 60 cps can be considered abnormal and should be investigated.
2. The background for channel B associated with the Cricket system installed on Grapple B3 at
Darrow was high. The background for this channel was 238 cps which is approximately four times higher than channel A of the same system as well as the four other systems.
3. The position of the RC/5 controller inside the crane cabin requires the operator to turn his
attention away from operating the crane during loading/unloading scrap in order to observe the alarm display. There is also the potential of background noise masking the audible alarm which would prevent the operator from hearing the alarm.
4. Analysis of the alarm algorithm for the Cricket system shows a high degree of complexity for
the intended operation as illustrated by the flow diagrams (Figure A1-A7). The flow diagrams were developed by ORNL from a written description of the alarm algorithms provided by RAD/COMM. The system has seven alarm types and five alarm levels associated with each alarm type. It is not clear as to why they are needed and for what purpose. During the entire testing effort only one alarm type was observed (LVL1 #RAB) at both locations. Considering the operators’ interaction with the Cricket system and the need to know, these various alarms are confusing and don’t add any value. The operator only needs to know if the load of scrap has an elevated radiation level. This can be presented to the operator in a simple go/no-go fashion. Interaction with the RC/5 controller requires someone who is more technically oriented.
5. Careful consideration should be given to interpreting the exposure rates indicated by the
alarm levels (LVL1-LVL5). Exposure rates in R/hr are typically measured at a certain distance from the radiation source. Varying the distance between the source and the measurement point will certainly vary the exposure. Such a relationship is governed by the inverse square law:
Exposure at distance d2 = Exposure at d12
21⎟⎠⎞
⎜⎝⎛
dd
3.3 MEASUREMENT SENSITIVITY
The analysis of the sensitivity data collected from both sites (Tables B1-B13) indicates that optimal measurement can be obtained at the center of each detector channel. As shown by Figure 3, placing the radioactive source at location A2 and B2 provides the highest count rate compared to the other locations (A1, A3, B1, B3, and C). Unfortunately, readings from the center will not provide a complete indication of the detector’s status. In order to detect changes in detection quality it is critical to challenge the detector by placing the source at the farthest point from the photomultiplier tube. Cracks or other degradations would be indicated by reduced count rates when tests are performed at that location. These changes may not be as apparent when testing the detector by placing the source at a location that is nearer to the photomultiplier tube (PMT).

6
Therefore, ORNL recommends using location A1 & B1 for routine testing of the Cricket systems. Measurement points A1 & B1 are located along the center line of each channel at 6 inches from the edge of the detector’s housing farthest from the PMT as illustrated by Figure 3.
Table 1. Darrow & Charleston Alarm Data
Measurement (CPS)
Darrow Charleston
Average Background* 62 51 Average Alarm Total Count **
465 650
Average Alarm Net Count*
403 599
Alarm Type LVL1 # RAB LVL1 #RAB Detectable Limit (DL)***
40 36
* Excluding channel B for Grapple B3 ** Average count for all systems per location *** DL = (3 + 4.65 * √BKG)/Count Time) [2]
Cricket Detector Assembly
C
A3
A1
A2
B1
B2
B3
Photomultiplier Tube
Figure 3. Cricket Detector Assembly Illustrating Sensitivity Measurements Locations
6 “

7
4.0 RECOMMENDATIONS
Based on the test results, observations by ORNL during testing, and discussions with Cooper T. Smith operators, ORNL offers the following recommendations: • It is recommended to place the test source at points A1 & B1 shown in Figure 3 to obtain the best
results for routine testing of detectors’ performance. ORNL has developed a routine test tracking web site (http://public.ornl.gov/estd/qc/) that could be used as a simple tracking method for response results. It is recommended that response tests be performed at least weekly. The range should be based on the average reading from each detector with a tolerance of ± 20%.
• Sources should be standardized for testing the Cricket systems installed at both locations (Darrow
and Charleston), as well as any future applications at other EPA sites. It is recommended to use a source similar to that being used at Charleston. This would mitigate the need for special training and certification required for handling radioactive sources, maintaining survey meters, and establishing site specific QA procedures to handle and store sources.
• The high background reading for channel B for the Cricket system installed in Grapple B3 needs
to be investigated to determine the cause. The background reading for channel B was 238 counts. This is four times higher than all other detectors.
• Wiring connectors from the battery box to the detector at Darrow need to be replaced with
connectors similar to those used at Charleston to prevent corrosion. This will help in reducing maintenance efforts and the spare parts inventory.
• Consideration should be given to provide a simple visual indication for the crane operator with
the RC/5 acting as the controller (see Figure 4). The display unit could be as simple as a visual display with two indicators, red and green, located in the vicinity of the crane’s operator console. Red would indicate an increase in radiation levels and green would indicate clean load. The RC/5, on the other hand, can be used by a technical person.
Controller RC/5
Display Panel with Two Indicators (Red, Green)
Main Unit (Existing) Auxiliary Unit
(To Be Added)
Figure 4. ORNL Suggested Operator Interaction Configuration

8
• The alarm algorithm for the Cricket system needs to be simplified. Operationally, the Cricket should provide the crane operator with a simple alarm telling the operator how to process the load of scrap. Any further details concerning the nature of the radiation should be undertaken by someone other than the crane operator.

9
REFERENCES
1. RAD/COMM, ‘Cricket Operations Manual’ 2. University of Toronto, ‘Module6: Radiation Detection and Measurements’, http://www.utoronto.ca/safety/RadTraining/Module6.htm

APPENDIX A ALARM FLOW DIAGRAM FOR THE CRICKET SYSTEM
A–
1
1 Sec. Array
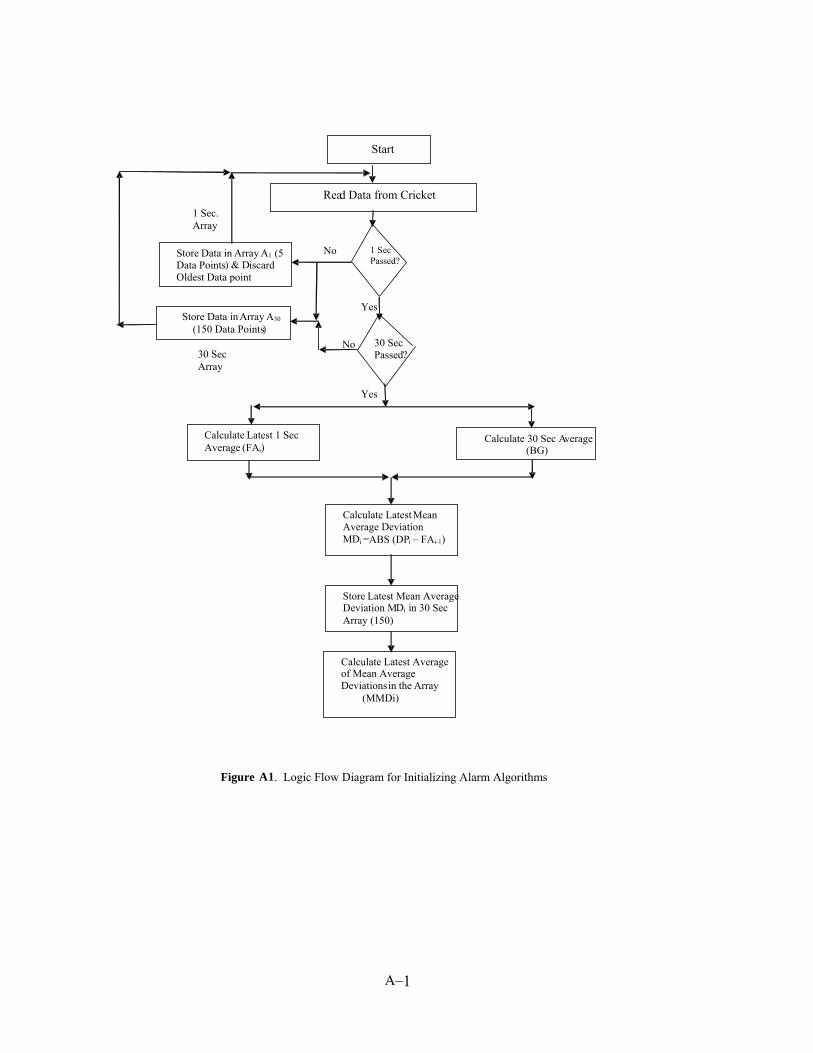
Figure A 1 . Logic Flow Diagram for Initializing Alarm Algorithms
Start
Read Data from Cricket
Store Data in Array A 1 (5 Data Points ) & D iscard Oldest Data point
1 Sec Passed?
No
Yes
30 Sec Passed?
Store Data in Array A 30 (150 Data Points )
No
Yes
Calculate Latest 1 Sec Average ( FA i ) Calculate 30 Sec Average
(BG)
Calculate Latest Mean Average Deviation MDi =ABS (DPi – FAi-1)
Store Latest Mean Average Deviation MDi
in 30 Sec
Array (150)
Calculate Latest Average of Mean Average Deviations
in the Array
(MMDi)
30 Sec Array

A–
2
R1 & R2 Alarm Limits R1 = 4.0 & R2 = 6.0
R1 & R2 Alarm Trigger R1 Alarm: New DP / BG > 4.0 for 20 Consecutive Readings. R2 Alarm: New DP / BG > 6.0 for 10 Consecutive Readings
Real-time Alarm Setpoints R1, R2, RTK Fixed [Triggered w/ Tines Open or Closed]
Read New Data Point
No
Hold for Operator’s Action
RTK Alarm Setpoint Limit: RTK = 400
RTK Alarm Trigger (New DP – BG) > 400.0 for 5 Consecutive Readings.
Alarm Triggered ?
No
Yes Yes
Figure A2. Logic Flow Diagram for Real Time Alarms (R1, R2, RTK)
Alarm Triggered ?

A–
3
Determine: 1. Maximum Reading in Array (DM) 2. Setpoint RAB (Variable) RAB = DMi + 7*MMDi (Last Values)
Read New Data Point
RAB Setpoint (Variable) Routine [Triggered w/Tines Open or Closed]
New DP> RAB
No
Yes
Store Data in Array A20 (100 Data Points)
Array Full ?
Learned Mode Level B Initiated?
No
Yes
No
Yes
Increment Coinciding Counter CC = CC +1
CC = limit?
Invoke RAB Alarm Indication Routine: New DP> RAB for 20 Consecutive readings
Condition Satisfied?
Trigger RAB Alarm
Yes
Set Coinciding Counter to Zero CC = 0
No
No
Figure A3. Logic Flow Diagram for RAB Alarm Routine.

A–
4
No
Dataset Alarms (DAB, DSA, DAA) [Triggered Upon Grapple Tines Initiating Closing Procedure]
Store Back Ground Average as Old Average BG= OLD BG (OBG)
No
Yes
No
Figure A4. Logic Flow Diagram for Invoking Alarms (DAB, DSA, DAA) Initiated Upon Tines Closing.
Tines Closing Initiated?
Read and Store Data Points in Array A10 (50 Data Points)
Yes
10 Second Array
ArrayFull?
Calculate Average (DSA)
Invoke DAB Alarm Routine
Invoke DSA Alarm Routine
Invoke DAA Alarm Routine
A

A–
5
Yes
DAB Alarm Routine (Fixed Setpoint)
Calculate: DSA-OBG = Difference
50 Counts or other value as specified in Parameter File
Trigger DAB Alarm
Is Difference> 50 Counts
No
A
Figure A5. Logic Flow Diagram for Triggering DAB Alarm
See Figure A4

A–
6
Calculate Current Alarm Setpoint: DSAi = DMi + (6*MMDi )
DSA Alarm Routine (Variable Setpoint) Learned Alarm level A
Read New Data Point (DPi)
Is DPi> DSAi
For Any 8 Data Points in Array A10
?
No
Yes
Trigger DSA Alarm
Figure A6. Logic Flow Diagram for Triggering DSA Alarm.

A–
7
DAA Alarm Routine (Variable Setpoint) Learned Alarms Level C
Read New Data Point (DPi)
Calculate Alarm Setpoint: DAAi = DSAi + (8*MMDi)
Is DPi > DAA for more than 50% of Data in A10 ?
Statement on the limit in document not clear. Statement: “ more than 50% of the 0.2 second time slices acquired in the 10 second linear array initiated when the tines started closing
No
Trigger DAA Alarm
Yes
Figure A7. Logic Flow Diagram for Triggering DAA Alarm.

APPENDIX B TEST RESULTS FOR DARROW AND CHARLESTON
B- 1
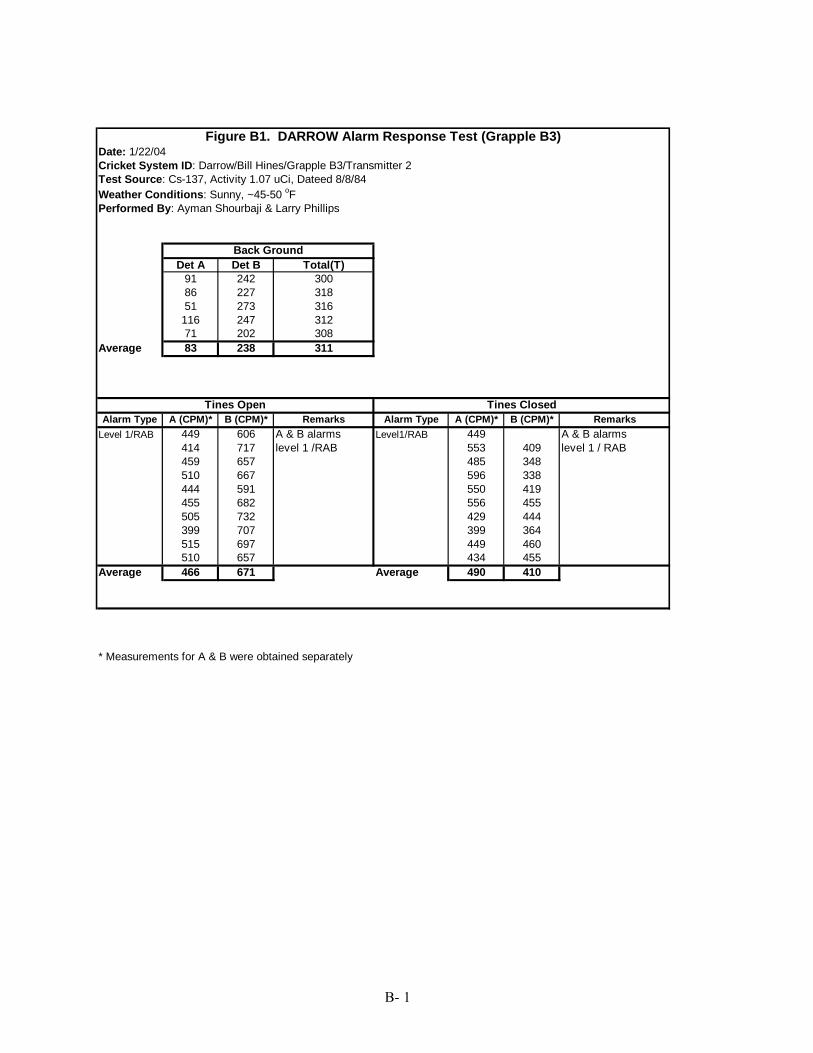
Date: 1/22/04Cricket System ID: Darrow/Bill Hines/Grapple B3/Transmitter 2Test Source: Cs-137, Activity 1.07 uCi, Dateed 8/8/84Weather Conditions: Sunny, ~45-50 oFPerformed By: Ayman Shourbaji & Larry Phillips
Det A Det B Total(T)91 242 30086 227 31851 273 316
116 247 31271 202 308
Average 83 238 311
Alarm Type A (CPM)* B (CPM)* Remarks Alarm Type A (CPM)* B (CPM)* RemarksLevel 1/RAB 449 606 A & B alarms Level1/RAB 449 A & B alarms
414 717 level 1 /RAB 553 409 level 1 / RAB459 657 485 348 510 667 596 338 444 591 550 419455 682 556 455505 732 429 444399 707 399 364515 697 449 460510 657 434 455
Average 466 671 Average 490 410
* Measurements for A & B were obtained separately
Figure B1. DARROW Alarm Response Test (Grapple B3)
Tines Open Tines Closed
Back Ground
B- 2
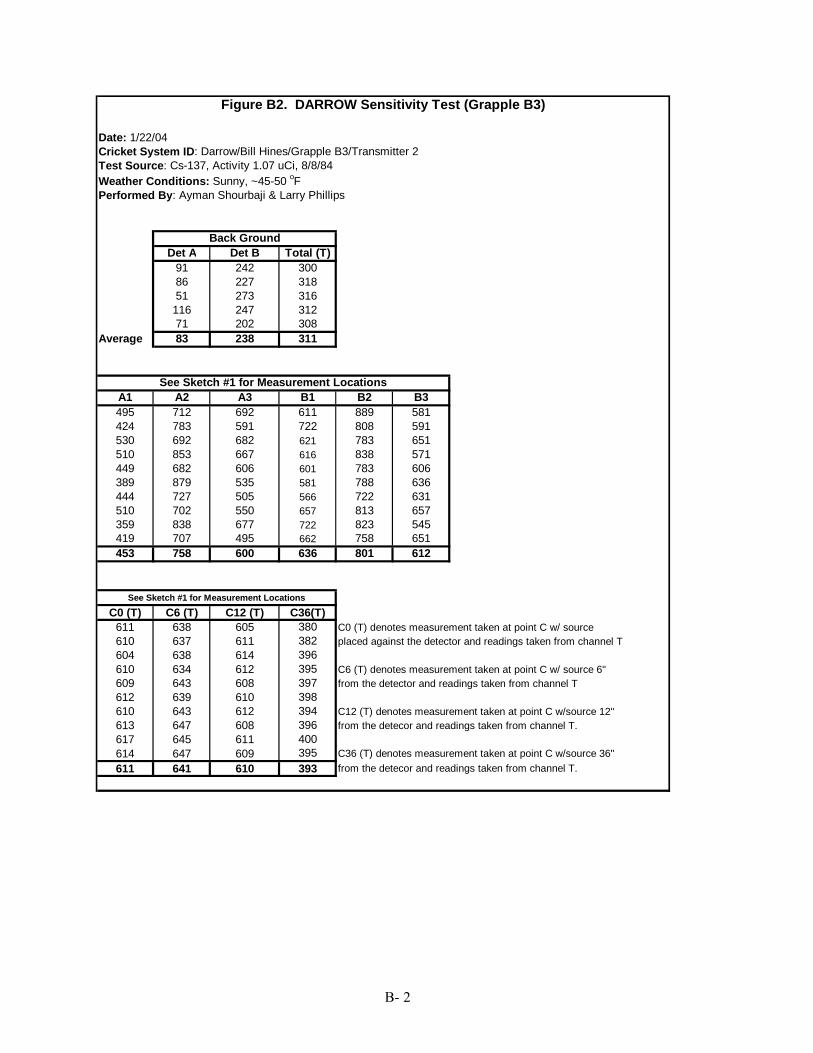
Date: 1/22/04Cricket System ID: Darrow/Bill Hines/Grapple B3/Transmitter 2Test Source: Cs-137, Activity 1.07 uCi, 8/8/84Weather Conditions: Sunny, ~45-50 oFPerformed By: Ayman Shourbaji & Larry Phillips
Det A Det B Total (T)91 242 30086 227 31851 273 316
116 247 31271 202 308
Average 83 238 311
A1 A2 A3 B1 B2 B3495 712 692 611 889 581424 783 591 722 808 591530 692 682 621 783 651510 853 667 616 838 571449 682 606 601 783 606389 879 535 581 788 636444 727 505 566 722 631510 702 550 657 813 657359 838 677 722 823 545419 707 495 662 758 651453 758 600 636 801 612
C0 (T) C6 (T) C12 (T) C36(T)611 638 605 380 C0 (T) denotes measurement taken at point C w/ source 610 637 611 382 placed against the detector and readings taken from channel T604 638 614 396610 634 612 395 C6 (T) denotes measurement taken at point C w/ source 6" 609 643 608 397 from the detector and readings taken from channel T612 639 610 398610 643 612 394 C12 (T) denotes measurement taken at point C w/source 12" 613 647 608 396 from the detecor and readings taken from channel T.617 645 611 400614 647 609 395 C36 (T) denotes measurement taken at point C w/source 36" 611 641 610 393 from the detecor and readings taken from channel T.
Figure B2. DARROW Sensitivity Test (Grapple B3)
Back Ground
See Sketch #1 for Measurement Locations
See Sketch #1 for Measurement Locations
B- 3
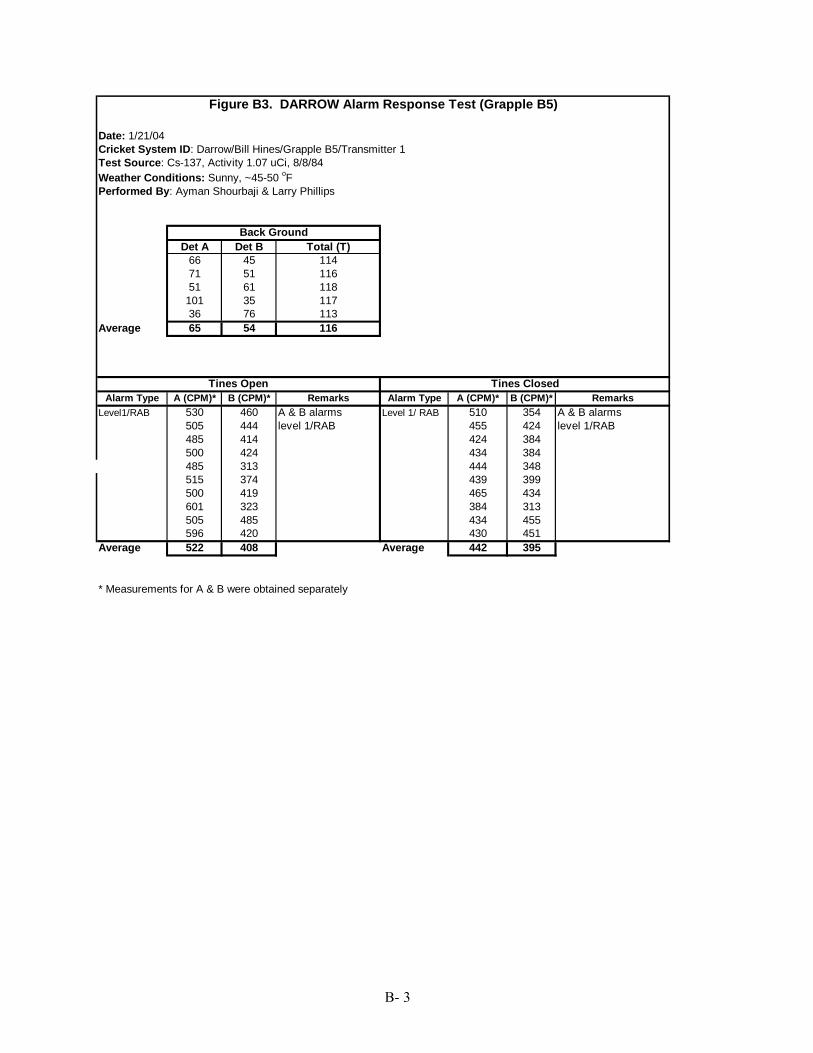
Date: 1/21/04Cricket System ID: Darrow/Bill Hines/Grapple B5/Transmitter 1Test Source: Cs-137, Activity 1.07 uCi, 8/8/84Weather Conditions: Sunny, ~45-50 oFPerformed By: Ayman Shourbaji & Larry Phillips
Det A Det B Total (T)66 45 11471 51 11651 61 118
101 35 11736 76 113
Average 65 54 116
Alarm Type A (CPM)* B (CPM)* Remarks Alarm Type A (CPM)* B (CPM)* RemarksLevel1/RAB 530 460 A & B alarms Level 1/ RAB 510 354 A & B alarms
505 444 level 1/RAB 455 424 level 1/RAB485 414 424 384500 424 434 384485 313 444 348515 374 439 399500 419 465 434601 323 384 313505 485 434 455596 420 430 451
Average 522 408 Average 442 395
* Measurements for A & B were obtained separately
Figure B3. DARROW Alarm Response Test (Grapple B5)
Tines Open Tines Closed
Back Ground

B- 4
Date: 1/21/04Cricket System ID: Darrow/Bill Hines/Grapple B5/Transmitter 1Test Source: Cs-137, Activity 1.07 uCi, 8/8/84Weather Conditions: Sunny, ~45-50 oFPerformed By: Ayman Shourbaji & Larry Phillips
Det A Det B Total (T)66 45 11471 51 11651 61 118101 35 11736 76 113
Average 65 54 116
A1 A2 A3 B1 B2 B3419 828 626 207 500 394409 818 682 263 354 424359 672 681 202 475 364439 758 687 268 510 303424 768 581 152 485 294394 732 758 232 424 333364 631 651 202 470 364404 793 768 217 485 419389 838 763 278 505 308354 756 667 202 419 333396 759 686 222 463 354
See Sketch #1 for Measurement Locations
C0 (T) C6 (T) C12 (T)277 241 331 C0 (T) denotes measurement taken at point C w/ source 270 268 319 placed against the detector and readings taken from channel T273 291 323284 299 324 C6 (T) denotes measurement taken at point C w/ source 6" 295 334 336 from the detector and readings taken from channel T304 345 361318 367 386 C12 (T) denotes measurement taken at point C w/source 12" 325 391 412 from the detecor and readings taken from channel T.315 446 440318 438 456298 342 369
Figure B4. DARROW Sensitivity Test (Grapple B5)
Back Ground
See Sketch #1 for Measurement Locations
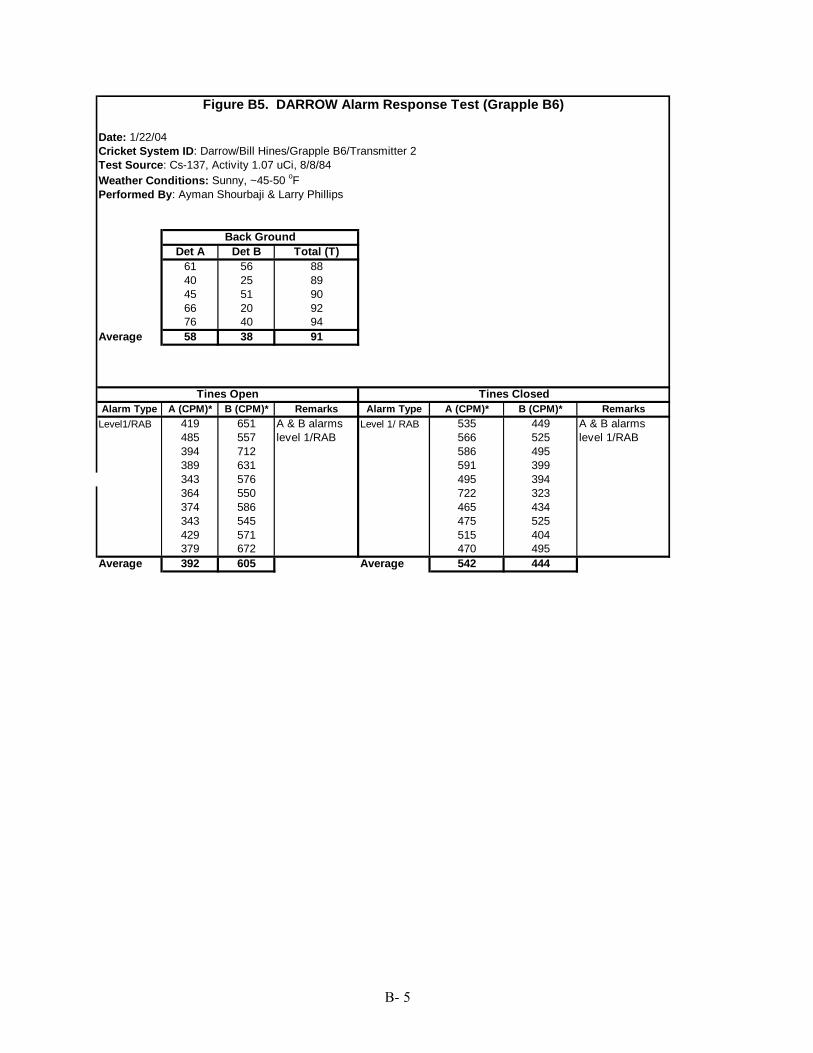
B- 5
Date: 1/22/04Cricket System ID: Darrow/Bill Hines/Grapple B6/Transmitter 2Test Source: Cs-137, Activity 1.07 uCi, 8/8/84Weather Conditions: Sunny, ~45-50 oFPerformed By: Ayman Shourbaji & Larry Phillips
Det A Det B Total (T)61 56 8840 25 8945 51 9066 20 9276 40 94
Average 58 38 91
Alarm Type A (CPM)* B (CPM)* Remarks Alarm Type A (CPM)* B (CPM)* RemarksLevel1/RAB 419 651 A & B alarms Level 1/ RAB 535 449 A & B alarms
485 557 level 1/RAB 566 525 level 1/RAB394 712 586 495389 631 591 399343 576 495 394364 550 722 323374 586 465 434343 545 475 525429 571 515 404379 672 470 495
Average 392 605 Average 542 444
Figure B5. DARROW Alarm Response Test (Grapple B6)
Back Ground
Tines Open Tines Closed

B- 6
Date: 1/22/04Cricket System ID: Darrow/Bill Hines/Grapple B6/Transmitter 2Test Source: Cs-137, Activity 1.07 uCi, 8/8/84Weather Conditions: Sunny, ~45-50 oFPerformed By: Ayman Shourbaji & Larry Phillips
Det A Det B Total (T)61 56 8840 25 8945 51 9066 20 9276 40 94
Average 58 38 91
A1 A2 A3 B1 B2 B3217 581 597 490 687 601152 576 439 626 742 641182 636 500 545 747 778202 646 561 576 778 717217 601 505 439 758 768222 626 465 384 778 732242 727 480 449 747 621207 566 434 434 727 662167 621 475 505 737 677177 651 460 419 621 722199 623 492 487 732 692
C0 (T) C6 (T) C12 (T) C36(T)468 457 450 212 C0 (T) denotes measurement taken at point C w/ source 467 458 451 210 placed against the detector and readings taken from channel T466 465 452 213468 468 448 212 C6 (T) denotes measurement taken at point C w/ source 6" 461 467 449 211 from the detector and readings taken from channel T453 466 451 212441 478 452 213 C12 (T) denotes measurement taken at point C w/source 12" 447 484 434 215 from the detecor and readings taken from channel T.454 481 441 214466 485 438 212 C136 (T) denotes measurement taken at point C w/source 36" 459 471 447 212 from the detecor and readings taken from channel T.
Figure B6. DARROW Sensitivity Test (Grapple B6)
Back Ground
See Sketch #1 for Measurement Locations
See Sketch #1 for Measurement Locations

B- 7
Date: 1/21/04Cricket System ID: Darrow/Bill Hines/Grapple B14/Transmitter 5Test Source: Cs-137, Activity 1.07 uCiWeather Conditions: Sunny, 45-50 oFPerformed By: Ayman Shourbaji & Larry Phillips
Det A Det B 91 7671 6156 7145 6666 111
Average 66 77
Alarm Type A (CPM)* B (CPM)* Remarks Alarm Type A (CPM)* B (CPM)* RemarksLevel 1/RAB 424 449 A & B alarms Level1/RAB 465 394 A & B alarms
338 444 level 1/RAB 444 409 level 1/RAB424 566 389 348 460 434 470 338 444 505 475 419399 465 460 455354 490 384 444389 399 475 364369 465 465 460375 460 462 455
Average 398 468 Average 449 409
* Measurements for A & B were obtained separately
Tines Open Tines Closed
Figure B7. DARROW Alarm Response Test (Grapple B14)
Back Ground
B- 8
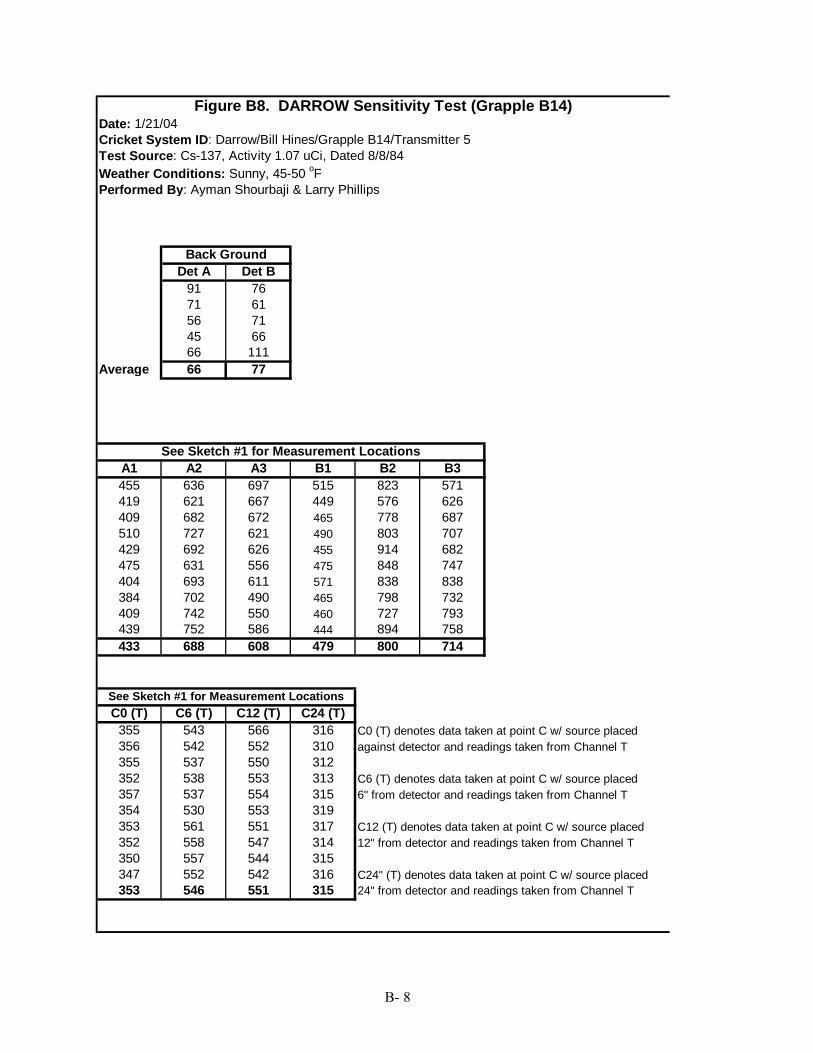
Date: 1/21/04Cricket System ID: Darrow/Bill Hines/Grapple B14/Transmitter 5Test Source: Cs-137, Activity 1.07 uCi, Dated 8/8/84Weather Conditions: Sunny, 45-50 oFPerformed By: Ayman Shourbaji & Larry Phillips
Det A Det B 91 7671 6156 7145 6666 111
Average 66 77
A1 A2 A3 B1 B2 B3455 636 697 515 823 571419 621 667 449 576 626409 682 672 465 778 687510 727 621 490 803 707429 692 626 455 914 682475 631 556 475 848 747404 693 611 571 838 838384 702 490 465 798 732409 742 550 460 727 793439 752 586 444 894 758433 688 608 479 800 714
C0 (T) C6 (T) C12 (T) C24 (T)355 543 566 316 C0 (T) denotes data taken at point C w/ source placed356 542 552 310 against detector and readings taken from Channel T355 537 550 312352 538 553 313 C6 (T) denotes data taken at point C w/ source placed357 537 554 315 6" from detector and readings taken from Channel T354 530 553 319353 561 551 317 C12 (T) denotes data taken at point C w/ source placed352 558 547 314 12" from detector and readings taken from Channel T350 557 544 315347 552 542 316 C24" (T) denotes data taken at point C w/ source placed353 546 551 315 24" from detector and readings taken from Channel T
Figure B8. DARROW Sensitivity Test (Grapple B14)
Back Ground
See Sketch #1 for Measurement Locations
See Sketch #1 for Measurement Locations
B- 9
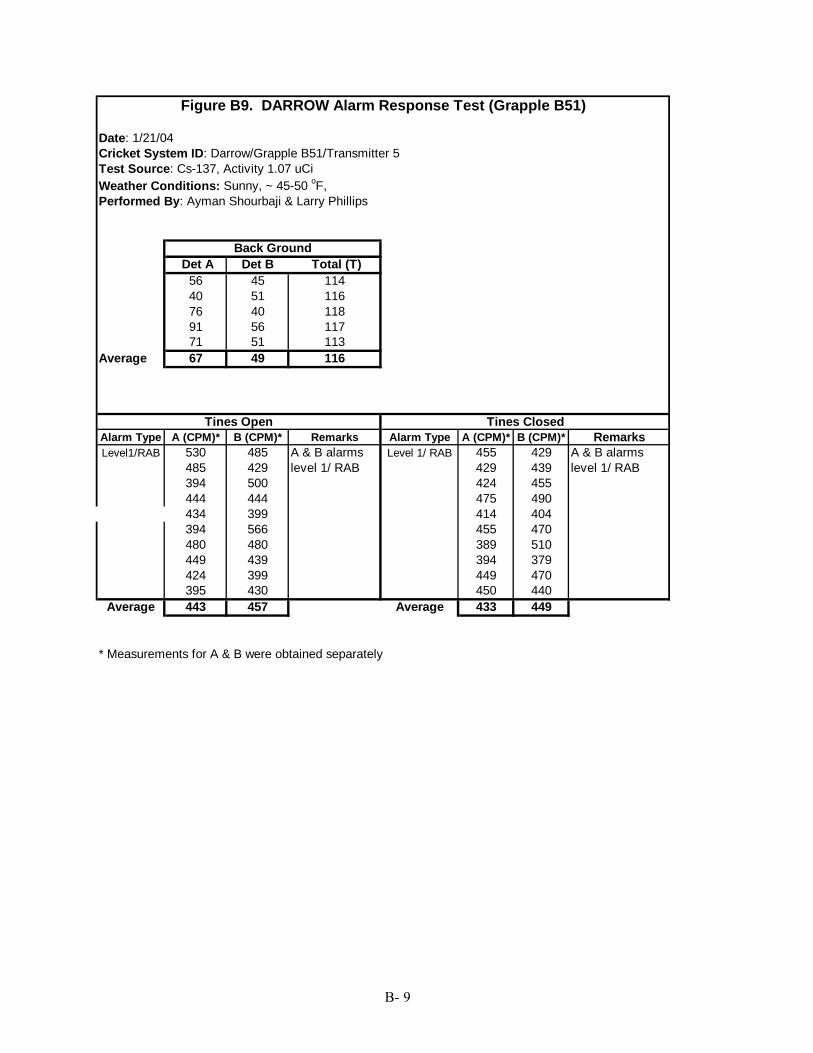
Date: 1/21/04Cricket System ID: Darrow/Grapple B51/Transmitter 5Test Source: Cs-137, Activity 1.07 uCiWeather Conditions: Sunny, ~ 45-50 oF, Performed By: Ayman Shourbaji & Larry Phillips
Det A Det B Total (T)56 45 11440 51 11676 40 11891 56 11771 51 113
Average 67 49 116
Alarm Type A (CPM)* B (CPM)* Remarks Alarm Type A (CPM)* B (CPM)* RemarksLevel1/RAB 530 485 A & B alarms Level 1/ RAB 455 429 A & B alarms
485 429 level 1/ RAB 429 439 level 1/ RAB394 500 424 455444 444 475 490434 399 414 404394 566 455 470480 480 389 510449 439 394 379424 399 449 470395 430 450 440
Average 443 457 Average 433 449
* Measurements for A & B were obtained separately
Figure B9. DARROW Alarm Response Test (Grapple B51)
Tines Open Tines Closed
Back Ground
B- 10
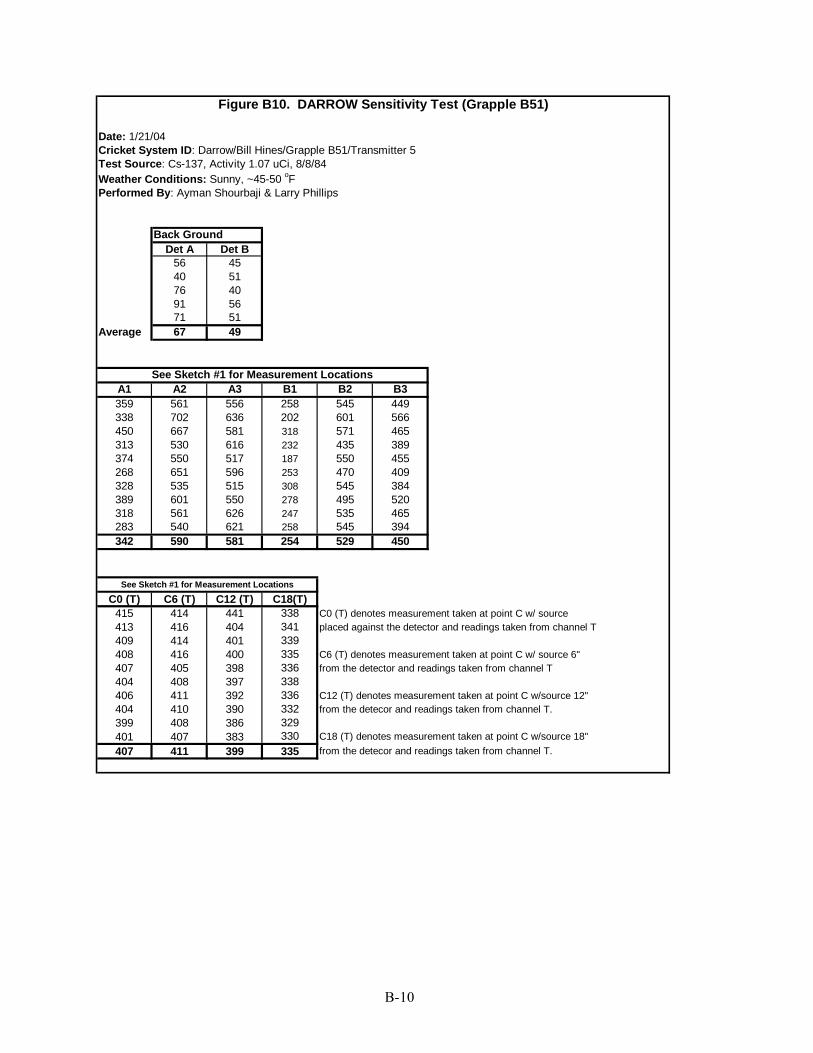
Date: 1/21/04Cricket System ID: Darrow/Bill Hines/Grapple B51/Transmitter 5Test Source: Cs-137, Activity 1.07 uCi, 8/8/84Weather Conditions: Sunny, ~45-50 oFPerformed By: Ayman Shourbaji & Larry Phillips
Back Ground Det A Det B
56 45 40 51 76 40 91 56 71 51
Average 67 49
A1 A2 A3 B1 B2 B3359 561 556 258 545 449338 702 636 202 601 566450 667 581 318 571 465313 530 616 232 435 389374 550 517 187 550 455268 651 596 253 470 409328 535 515 308 545 384389 601 550 278 495 520318 561 626 247 535 465283 540 621 258 545 394342 590 581 254 529 450
C0 (T) C6 (T) C12 (T) C18(T)415 414 441 338 C0 (T) denotes measurement taken at point C w/ source 413 416 404 341 placed against the detector and readings taken from channel T409 414 401 339408 416 400 335 C6 (T) denotes measurement taken at point C w/ source 6" 407 405 398 336 from the detector and readings taken from channel T404 408 397 338406 411 392 336 C12 (T) denotes measurement taken at point C w/source 12" 404 410 390 332 from the detecor and readings taken from channel T.399 408 386 329401 407 383 330 C18 (T) denotes measurement taken at point C w/source 18" 407 411 399 335 from the detecor and readings taken from channel T.
Figure B10. DARROW Sensitivity Test (Grapple B51)
See Sketch #1 for Measurement Locations
See Sketch #1 for Measurement Locations
B- 11
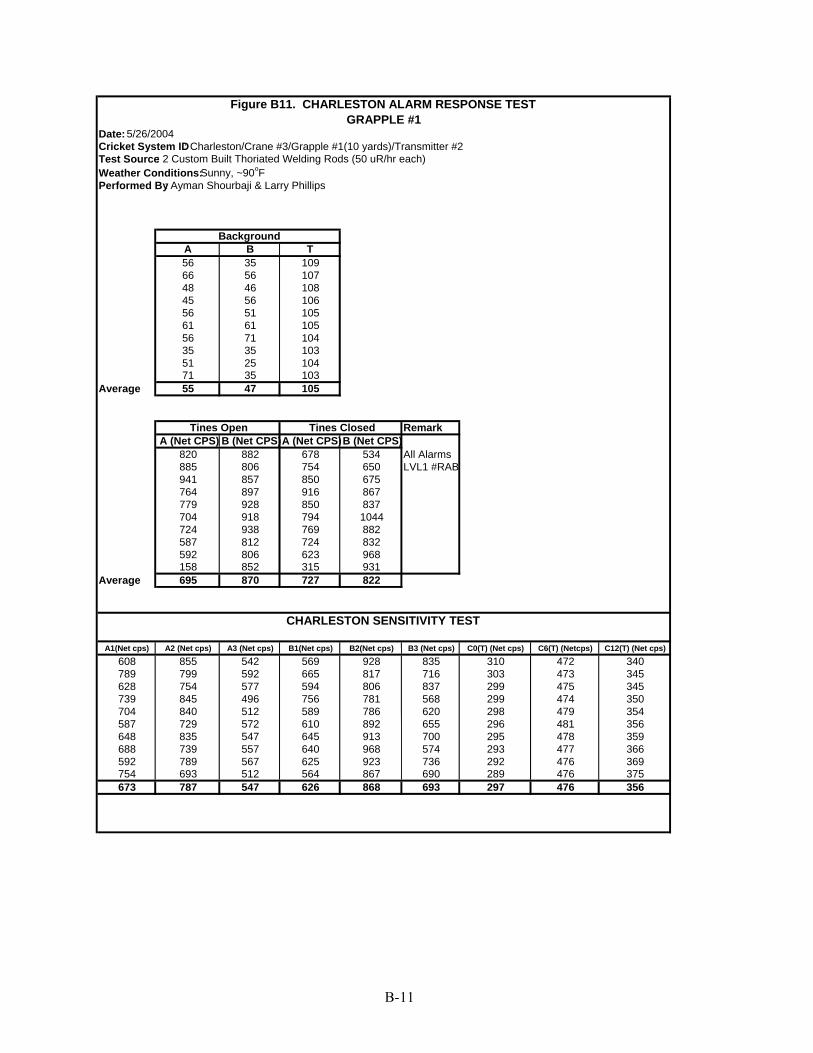
Date: 5/26/2004 Cricket System ID : Charleston/Crane #3/Grapple #1(10 yards)/Transmitter #2Test Source : 2 Custom Built Thoriated Welding Rods (50 uR/hr each)Weather Conditions: Sunny, ~90 o F Performed By : Ayman Shourbaji & Larry Phillips
A B T 56 35 109 66 56 107 48 46 108 45 56 106 56 51 105 61 61 105 56 71 104 35 35 103 51 25 104 71 35 103
Average 55 47 105
RemarkA (Net CPS) B (Net CPS) A (Net CPS)B (Net CPS)
820 882 678 534 All Alarms885 806 754 650 LVL1 #RAB941 857 850 675764 897 916 867779 928 850 837704 918 794 1044724 938 769 882587 812 724 832592 806 623 968158 852 315 931
Average 695 870 727 822
A1(Net cps) A2 (Net cps) A3 (Net cps) B1(Net cps) B2(Net cps) B3 (Net cps) C0(T) (Net cps) C6(T) (Netcps) C12(T) (Net cps)
608 855 542 569 928 835 310 472 340 789 799 592 665 817 716 303 473 345 628 754 577 594 806 837 299 475 345 739 845 496 756 781 568 299 474 350 704 840 512 589 786 620 298 479 354 587 729 572 610 892 655 296 481 356 648 835 547 645 913 700 295 478 359 688 739 557 640 968 574 293 477 366 592 789 567 625 923 736 292 476 369 754 693 512 564 867 690 289 476 375 673 787 547 626 868 693 297 476 356
CHARLESTON SENSITIVITY TEST
Figure B11. CHARLESTON ALARM RESPONSE TEST
Tines Open Tines Closed
Background
GRAPPLE #1
B- 12
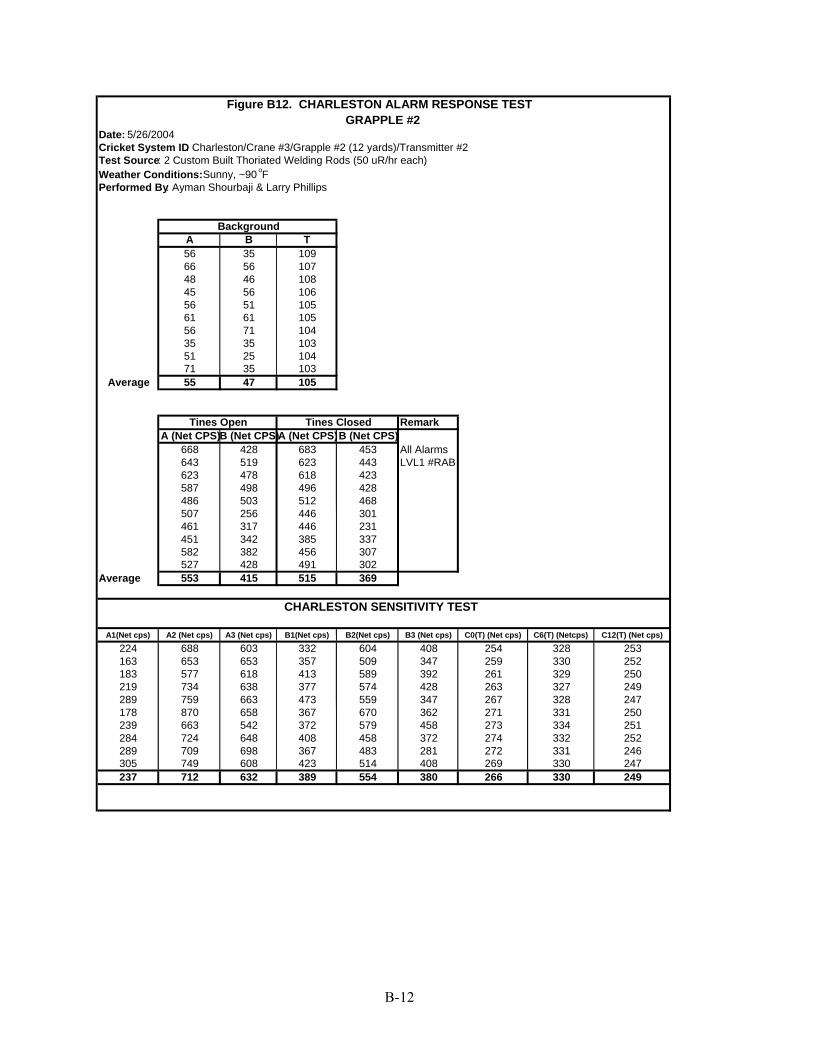
Date: 5/26/2004 Cricket System ID : Charleston/Crane #3/Grapple #2 (12 yards)/Transmitter #2Test Source : 2 Custom Built Thoriated Welding Rods (50 uR/hr each)Weather Conditions: Sunny, ~90 o F Performed By : Ayman Shourbaji & Larry Phillips
A B T 56 35 109 66 56 107 48 46 108 45 56 106 56 51 105 61 61 105 56 71 104 35 35 103 51 25 104 71 35 103
Average 55 47 105
RemarkA (Net CPS) B (Net CPS) A (Net CPS)B (Net CPS)
668 428 683 453 All Alarms643 519 623 443 LVL1 #RAB623 478 618 423587 498 496 428486 503 512 468507 256 446 301461 317 446 231451 342 385 337582 382 456 307527 428 491 302
Average 553 415 515 369
A1(Net cps) A2 (Net cps) A3 (Net cps) B1(Net cps) B2(Net cps) B3 (Net cps) C0(T) (Net cps) C6(T) (Netcps) C12(T) (Net cps)
224 688 603 332 604 408 254 328 253 163 653 653 357 509 347 259 330 252 183 577 618 413 589 392 261 329 250 219 734 638 377 574 428 263 327 249 289 759 663 473 559 347 267 328 247 178 870 658 367 670 362 271 331 250 239 663 542 372 579 458 273 334 251 284 724 648 408 458 372 274 332 252 289 709 698 367 483 281 272 331 246 305 749 608 423 514 408 269 330 247 237 712 632 389 554 380 266 330 249
CHARLESTON SENSITIVITY TEST
Figure B12. CHARLESTON ALARM RESPONSE TEST
Tines Open Tines Closed
Background
GRAPPLE #2

B- 13
GRAPPLE #3Date: 5/26/2004 Cricket System ID : Charleston/Crane #3/Grapple #3 (12 yards)/Transmitter #2Test Source : 2 Custom Built Thoriated Welding Rods (50 uR/hr each)Weather Conditions: Sunny, 90 o F Performed By : Ayman Shourbaji & Larry Phillips
A B T 56 35 109 66 56 107 48 46 108 45 56 106 56 51 105 61 61 105 56 71 104 35 35 103 51 25 104 71 35 103
Average 55 47 105
RemarkA (Net CPS) B (Net CPS) A (Net CPS)B (Net CPS)
522 564 522 756 All Alarms512 675 481 539 LVL1 #RAB547 700 557 630618 615 587 771456 625 623 635476 685 597 655376 594 643 584355 579 587 620300 640 416 549274 519 365 514
Average 443 620 537 625
A1 (Net cps) A2(Net cps) A3(Net cps) B1(Net cps) B2(Net cps) B3(Net cps) C0(T)(Net cps) C6(T)(Net cps) C12(T)(Net cps)
279 613 474 423 579 610 218 404 221 264 683 562 367 569 579 216 401 288 274 673 436 332 559 579 213 400 284 285 572 476 347 660 675 214 389 283 365 719 562 327 655 498 209 387 284 310 648 633 246 680 578 208 386 287 234 613 502 236 569 630 209 358 285 269 643 512 317 640 610 207 385 284 239 638 582 357 604 604 209 386 285 305 678 491 438 625 660 213 390 287 282 648 523 339 614 602 211 388 278
CHARLESTON SENSITIVITY TEST
Figure B13. CHARLESTON ALARM RESPONSE TEST
Tines Open Tines Closed
Background
ORNL/TM-2004/126
INTERNAL DISTRIBUTION
1. P. J. Chiaro, Jr. 2. E. C. Fox 3. J. E. Hardy 4. L. D. Phillips
5. A. A. Shourbaji 6. ORNL Laboratory Records – RC 7. ORNL Laboratory Records – OSTI
EXTERNAL DISTRIBUTION
8. Schatzi Fitz-James, Environmental Protection Agency, Washington, DC 9. Sally Hamlin, Environmental Protection Agency, Washington, DC