Embed Size (px)
Citation preview
Margaret Kelleher, John McCarthy and Ross [email protected]
11th February 2018
Cow’s Own Worth
Test day model and 305 day predictions
2
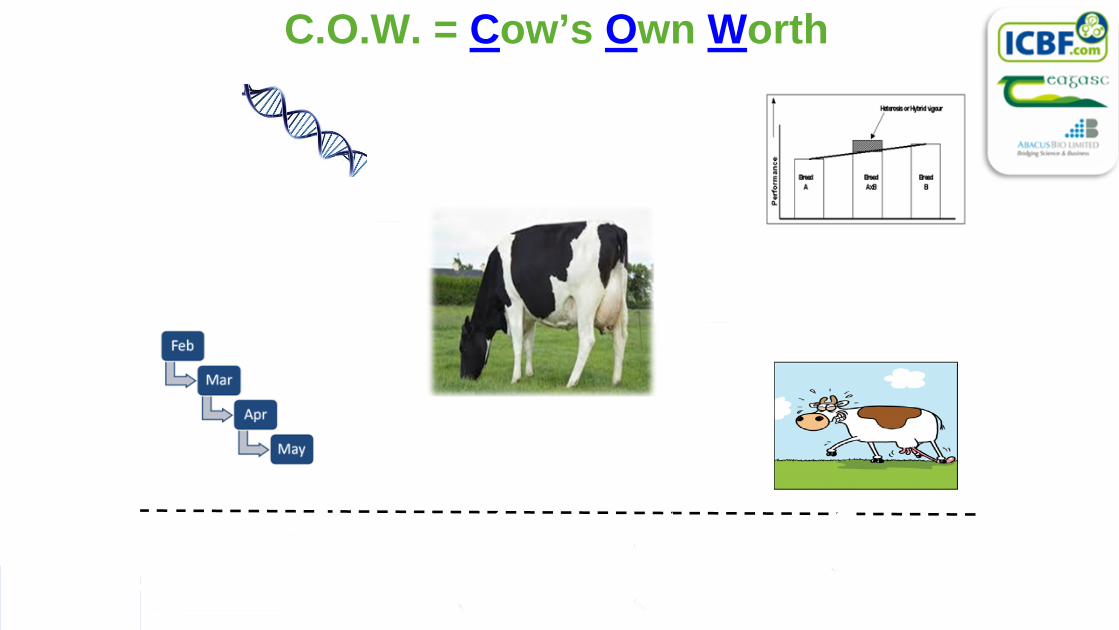
C.O.W. = Cow’s Own Worth

3
Expected profit from:
•Production
•Health (SCC)
•Management
•Maintenance
•Fertility (calving date)
•Production•Health•Beef•Calving
•Management•Maintenance•Fertility•Descendants•Cull cow value
•Replacement cost+ predictions on fertility,
survival and SCC performance
=

4
For more details on C.O.W.Poster session
Theory to ApplicationTomorrow 9.30 –
10.00 am

5
IntroductionCow’s Own Worth (C.O.W.)•Researched and published 2015 (Kelleher et al., 2015 JDS)•Trialled on commercial herds 2016 & 2017•Implemented October 2017•Currently uses 305D model solutions for production traits
Test Day Model (TDM)•TDM genetic evaluation submitted to Interbull test run September
2017•TDM implemented in domestic evaluation December 2017•Moved from the 305D model for production traits
QuestionWhat effect do
TDM evaluation solutions have on the accuracy of the
C.O.W. rankings of dairy females????

6
Materials and methodsData
Alternative cow ranking indices
Validation dataset
Genetic model ranking
305D model ranking
Test day model ranking
Validationphenotype
2013 2014• Milk yield • Fat• Protein
• 305D and TDM evaluations• Phenotypic performance• Spring calving herds
n = 108,827

7
Materials and methodsGenetic model
ranking
305D model ranking
Test day model ranking
Validationphenotype

8
Results: Milk yieldDifference between top 25% and bottom 25%
Model kgGenetic model 547 305D model 633Test day model 801

9
Results: Fat yield Difference between top 25% and bottom 25%
Model kgGenetic model 30 305D model 34Test day model 37

10
Results: Protein yieldDifference between top 25% and bottom 25%
Model kgGenetic model 26 305D model 29Test day model 33

11
GroupPrice
(€)Genetic model
305D model
Test Day Model
Milk -0.040 -22.53 -26.07 -32.98Fat 4.066 123.77 137.24 150.66
Protein 6.653 171.83 189.88 217.63Total (€) 273.07 301.05 335.31
Results: Monetary value
• The difference between top 25% and bottom 25% using TDM is €335 per cow per lactation
• Worth €8375 in a 100 cow herd
• €34 per cow per lactation improvement between the 305D model and Test Day Model
Difference between top 25% and bottom 25% and milk price for each model
12
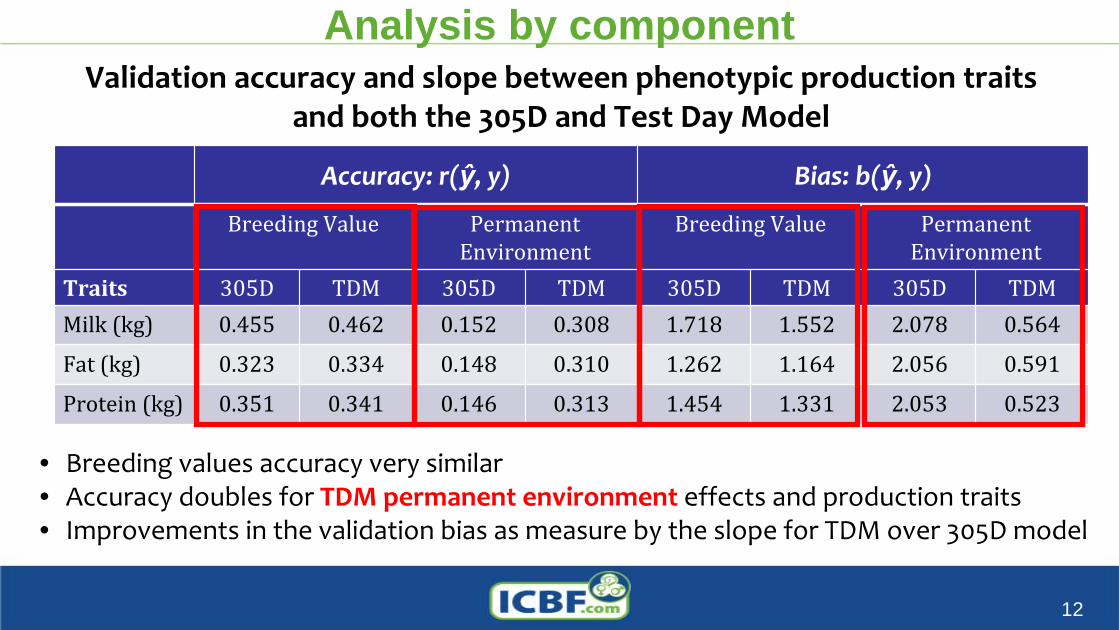
Analysis by componentValidation accuracy and slope between phenotypic production traits
and both the 305D and Test Day Model
• Breeding values accuracy very similar • Accuracy doubles for TDM permanent environment effects and production traits• Improvements in the validation bias as measure by the slope for TDM over 305D model
Accuracy: r(ŷ, y) Bias: b(ŷ, y)Breeding Value Permanent Environment Breeding Value Permanent EnvironmentTraits 305D TDM 305D TDM 305D TDM 305D TDMMilk (kg) 0.455 0.462 0.152 0.308 1.718 1.552 2.078 0.564Fat (kg) 0.323 0.334 0.148 0.310 1.262 1.164 2.056 0.591Protein (kg) 0.351 0.341 0.146 0.313 1.454 1.331 2.053 0.523
Conclusions• C.O.W. currently uses 305D model evaluation solutions
• Using TDM production solutions in C.O.W. have shown favourable outcomes
due to more accurate prediction of future phenotypic performance of production traits
•
The permanent environment effects from TDM account for the majority of the improvements
•
However the method of handling these needs more refinement