Embed Size (px)
Citation preview
University of Massachusetts Amherst University of Massachusetts Amherst
ScholarWorks@UMass Amherst ScholarWorks@UMass Amherst
Doctoral Dissertations 1896 - February 2014
1-1-2000
Test anxiety and beliefs about testing in college students with and Test anxiety and beliefs about testing in college students with and
without learning disabilities. without learning disabilities.
Seth A. Stevens University of Massachusetts Amherst
Follow this and additional works at: https://scholarworks.umass.edu/dissertations_1
Recommended Citation Recommended Citation Stevens, Seth A., "Test anxiety and beliefs about testing in college students with and without learning disabilities." (2000). Doctoral Dissertations 1896 - February 2014. 1277. https://doi.org/10.7275/61f5-y146 https://scholarworks.umass.edu/dissertations_1/1277
This Open Access Dissertation is brought to you for free and open access by ScholarWorks@UMass Amherst. It has been accepted for inclusion in Doctoral Dissertations 1896 - February 2014 by an authorized administrator of ScholarWorks@UMass Amherst. For more information, please contact [email protected].

TEST ANXIETY AND BELIEFS ABOUT TESTING IN COLLEGE STUDENTS WITH
WITHOUT LEARNING DISABILITIES
A Dissertation Presented
by
SETH A. STEVENS
Submitted to the Graduate School of the
University of Massachusetts Amherst in partial fulfillment
of the requirements of the degree of
DOCTOR OF PHILOSOPHY
May 2000
Counseling Psychology

© Copyright by Seth A. Stevens 2000
All Rights Reserved

TEST ANXIETY AND BELIEFS ABOUT TESTING IN COLLEGE STUDENTS
WITHOUT LEARNING DISABILITIES
A Dissertation presented
by
SETH A. STEVENS
Approved as to style and content by:
Patricia Silver, Member
Carole R. Beal, Menjbe;^
y Jackson, Dean
tion

To
My Parents
Digitized by the Internet Archive
in 2014
https://archive.org/details/testanxietybelieOOstev

ACKNOWLEDGEMENTS
I would like to thank the following individuals and groups who made this research possible, and
who helped me through the process of completing it:
The students, staff, and my fellow case managers at Learning Disabilities Support services; the
student volunteers who took the time to participate in the study; my dissertation committee members, for
all of their support and advice; my mother for her encouragement and many dinners; and Ron, for "doing
everything."
V
ABSTRACT
TEST ANXIETY AND BELIEFS ABOUT TESTING IN COLLEGE STUDENTS WITH AND
WITHOUT LEARNING DISABILITIES
MAY 2000
SETH A. STEVENS, B.A., WESLEYAN UNIVERSITY
M.A, SACRED HEART UNIVERSITY
Ph.D., UNIVERSITY OF MASSACHUSETTS AMHERST
Directed by : Professor William J. Matthews
Differences in beliefs about, reactions to, and perceived control over testing between learning disabled and
non learning disabled students at the postsecondary level were investigated. Additionally, the effect of
the use of support services by students with LD on their beliefs about and reactions to testing was also
investigated. Students with and without LD were given published measures of test anxiety and academic
locus of control, as well as survey questionnaires/scales created for the study. Additional information on
students' with LD diagnoses and use of support services was gathered from archival data. Results
indicated that students with LD reported significantly higher levels of test anxiety, particularly test
irrelevant thinking, than their non-LD peers. Students with and without LD also differed significantly in
their anxiety ratings of particular evaluation conditions, academic subject areas, and modifications to the
testing environment. An external academic locus of control was found to be related significantly to higher
test anxiety for all students. For students with LD, use of support services was not related to lest anxiety.
High levels of test anxiety were found to be related to reported avoidance of testing intensive courses and
subject areas for all students. Females consistently scored significantly higher than males on all
generalized measures of anxiety. Findings suggest that test anxiety is a phenomenon that varies both
quantitatively and qualitatively as a function of individual differences in academic history, areas of
academic strength and need, and as a function of specific aspects of the test situation (e.g., subject area
testing is being conducted in, presence of distractions); in addition to its well documented negative effects
on test performance, test anxiety may also have long term effects on academic and career choices.
Support services appear to be perceived as useful by anxious students, however, utilization of such services
vi

does not appear to mitigate generalized test anxiety, though use of such services is related to higher CPA.
Based on study findings, a variety of possible modifications to the testing environment and to classroom
grading procedures at the postsecondary level are suggested.
vii
TABLE OF CONTENTS
Page
ACKNOWLEDGEMENTS^
ABSTRACTVI
LIST OF TABLES
LIST OF FIGURES^^i^
Chapter
INTRODUCTION1
1. LITERATURE REVIEW 3
The Concept of Test Anxiety 3
Definition and Brief History of the Construct 3
Components of Test Anxiety 3
Effects of Test Anxiety on Memory and Cognition 5
Effects of Anxiety on Academic Tests and Performance 6
Effects of Test Anxiety on Test-Taking Behaviors and Related Cognitions 7
Theoretical Models of how Test Anxiety Operates 8
Conclusion - General Concept of Test Anxiety 1
1
Group and Individual Differences in Test Anxiety 11
Gender 1
1
Cultural/Ethnic Differences 12
Ability 14
At-Risk Students 14
Age/Grade Level 15
Students with Learning Disabilities 15
Differences in Classroom Personality Measures 18
Self-Concept Variables, Success/Failure Attributions, and Learned Helplessness 18
Conclusion - Group and Individual Differences 20
Environmental Variables Contributing to Test Anxiety 20
Curriculum 21
Test Construction Factors 22
Types of Questions 22
Computer and Self Adaptive Testing and Perceived Control 23
Presence of Defects on Tests 25
Constructing Tests for Students with Disabilities 25
General Testing Parameters and Conditions 26
Take Home and Open Book Conditions 26
Untimed Testing 27
viii
Scheduled and Unscheduled (Surprise) Testing 27Frequency of Testing 28Presence of Distractions 29Penalties for Guessing 29Classroom Structure 29Effects of Support Systems of Test Anxiety Levels 30
Conclusion - Environmental Factors 30
Overview of Reviewed Research, and Statement of the Current Research Problem,
Questions, and Hypotheses 31
Statement of the Problem 34Specific Research Questions and Corresponding Hypotheses 35
2. METHODS 37
Design 37
Independent and Dependent Variables 37
Participants 38
Instruments 44
Test Anxiety 44
Perceived Control 44
Rating of Test Situations 46
Rating of Testing Modifications/Accommodations 47
Course and Subject Area Avoidance 47
Subject Area Ratings 49
Demographs 49
Students with Learning Disabilities Support Data 50
Procedure 53
3. RESULTS 57
General Academic Success 57
Hypothesis One 59
Hypothesis Two 65
Hypothesis Three
Hypothesis Four
Hypothesis Five
Hypothesis Six
Hypothesis Seven '^-^
Hypothesis Eight
Hypothesis Nine
Hypothesis Ten ^
4. DISCUSSION
1 70Research Question One '"^^
Research Question Two '"^
Research Question Three
Research Question Four
ix
Research Question Five127
Research Question Six139
General Discussion
Conclusion140
APPENDICES
A. DATA COLLECTION INTRUMENTS
Revised Test Anxiety Scale (RTA)Academic Locus of Control Scale (ALOCS)
"* J43Perceived Control Over Testing Scale (PCOT)
J45Test Situations Rating Scale (TSRS)
' "'
Test Modifications Rating Scale (TMRS) j49Demographic Data, non LD
j^jDemographic Data, LD
J52LDSS Data Sheet
^^^^^^^^^^ I53
B. INFORMED CONSENT FORMSI54
Informed Consent, non LD 154Informed Consent, LD
J55
C. ACADEMIC MAJOR CATEGORIES 156
REFERENCES158
X
LIST OF TABLES
TablePage
L Sample demographic data - categorical - as a function of LD status 40
2. Sample demographic data - categorical - as a function of sex 41
3. Sample demographic data - means - as a function of LD status 41
4. Sample demographic information - means - as a ftinction of sex 42
5. Additional demographic data for students with learning disabilities for the total LDsample, and as a function of sex 42
6. Continuous demographic information - comparison of means as a function of LDstatus 5g
7. ANCOVA results for GPA 58
8. Continuous demographic information - comparison of means as a function of sex 59
9. Means and standard deviations for study measures as a function of LD status 61
10. Means and standard deviations for study measures as a function of sex 62
1 1 . ANOVA results for hypothesis one 63
12. Results of Kruskal-Wallis one way ANOVA's for LD status and sex 63
13. Hypothesis one, multiple regression 65
14. MANOVA results for four RTA factor scores as a function of LD status, sex, and LDstatus X sex 66
15. Univariate F tests for RTA factor scores as a function of LD status 67
16. Univariate F tests for RTA factor scores as a function of sex 67
17. Results of Kruskal-Wallis one way ANOVA's for LD status and sex 68
18. Results of Kruskal-Wallis one way ANOVA's for LD status and sex 69
19. Results of Kruskal-Wallis one way ANOVA's for LD status and sex 70
20. Results of Kruskal-Wallis one way ANOVA's for LD status and sex 71
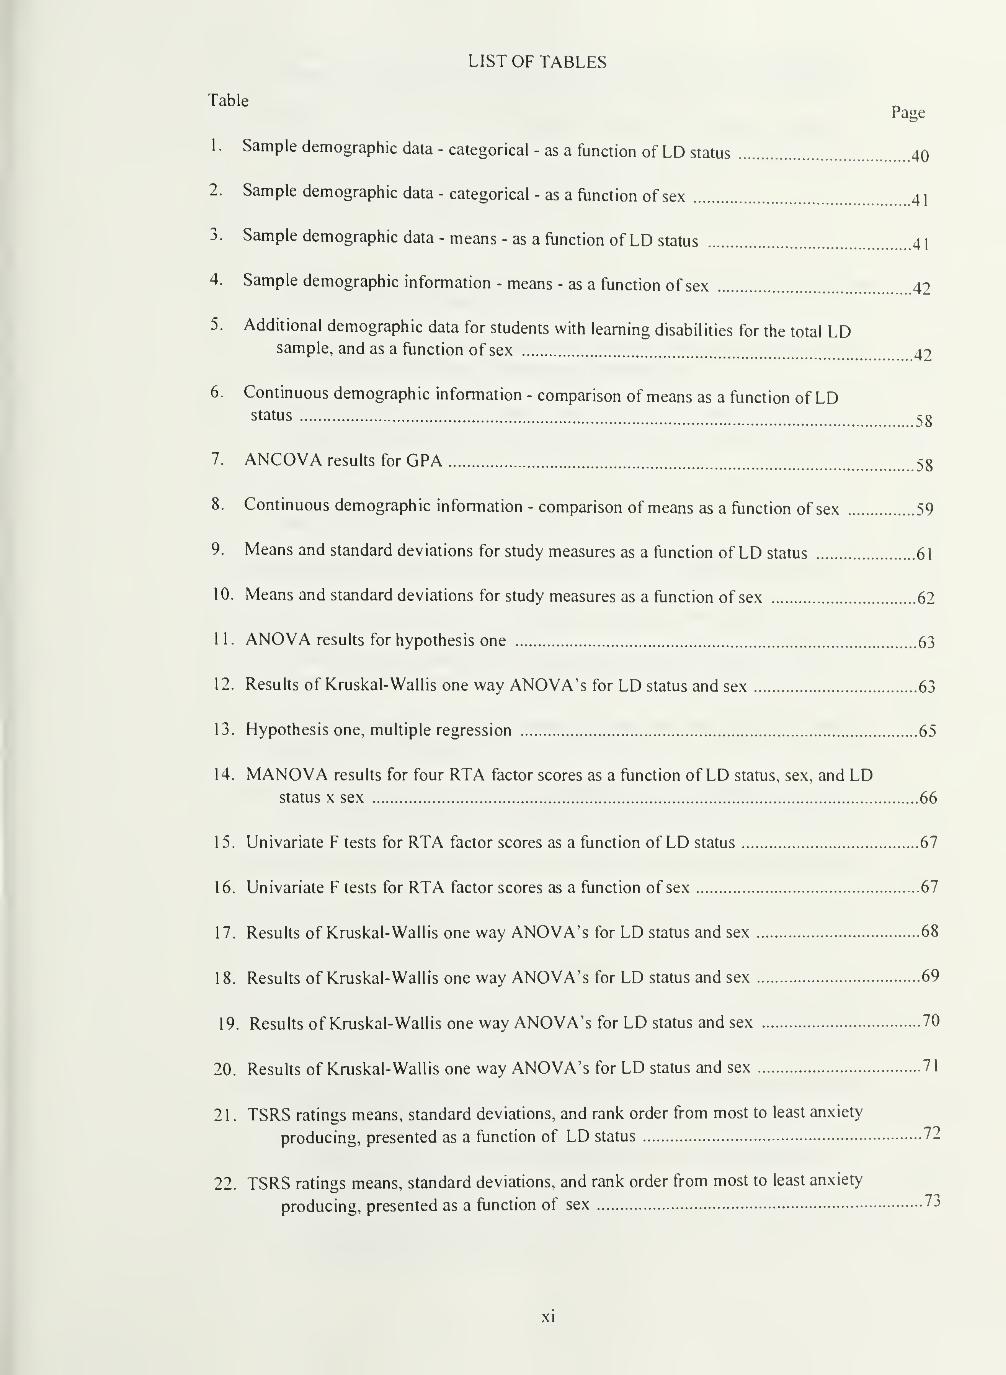
21 . TSRS ratings means, standard deviations, and rank order from most to least anxiety
producing, presented as a function of LD status 72
22. TSRS ratings means, standard deviations, and rank order from most to least anxiety
producing, presented as a function of sex 73
xi

23. TSRS ratings means, standard deviations, and rank order from most to least anxietyproducing (situations are also listed in this rank order) for the total sample 74
24. MANOVA results for the 20 TSRS ratings as a function of LD status, sex, and LDstatus X sex
25. Univariate F tests for TSRS ratings as a ftinction of LD status 77
26. Univariate F tests for TSRS ratings as a function of sex 79
27. Subject area test anxiety ratings: means standard deviations, and rank order from mostto least anxiety producing, presented as a ftinction of LD status 80
28. Subject area test anxiety ratings: means standard deviations, and rank order from mostto least anxiety producing, presented as a function of sex 80
29. Subject area test anxiety ratings: means, standard deviations, and rank order from mostto least anxiety producing (subject areas are also listed in this rank order) for the
total sample 81
30. MANOVA resuhs for the six subject area test anxiety ratings as a function of LDstatus, sex, and LD status x sex 82
3 1. Univariate F tests for subject area test anxiety ratings as a function of LD status 83
32. Univariate F tests for subject area test anxiety ratings as a function of sex 84
33. TMRS ratings: means, standard deviations, and rank order from most to least anxiety
relieving, as a function of LD status 85
34. TMRS ratings: means, standard deviations, and rank order from most to least anxiety
relieving, as a function of sex 86
35. TMRS ratings: means, standard deviations, and rank order from most to least anxiety
relieving (modifications are also listed in this rank order) for the total sample 87
36. MANOVA results for TMRS ratings as a function of LD status, sex, and LD status x
sex 88
37. Univariate F tests for TMRS ratings as a function of LD status 90
38. Univariate F tests for TMRS ratings as a function of sex 91
39. Univariate F tests for TMRS ratings as a function of the interaction between LD status
and sex 94
40. Means and standard deviations for fine arts test anxiety as a function of nature of LD
(sample is students with LD only) 96
41. ANOVA results for fine arts test anxiety as a function of nature of LD (sample is
students with LD only) 96
42. Means and standard deviations for humanities test anxiety as a ftinction of nature of LD
(sample is students with LD only) 96
xii
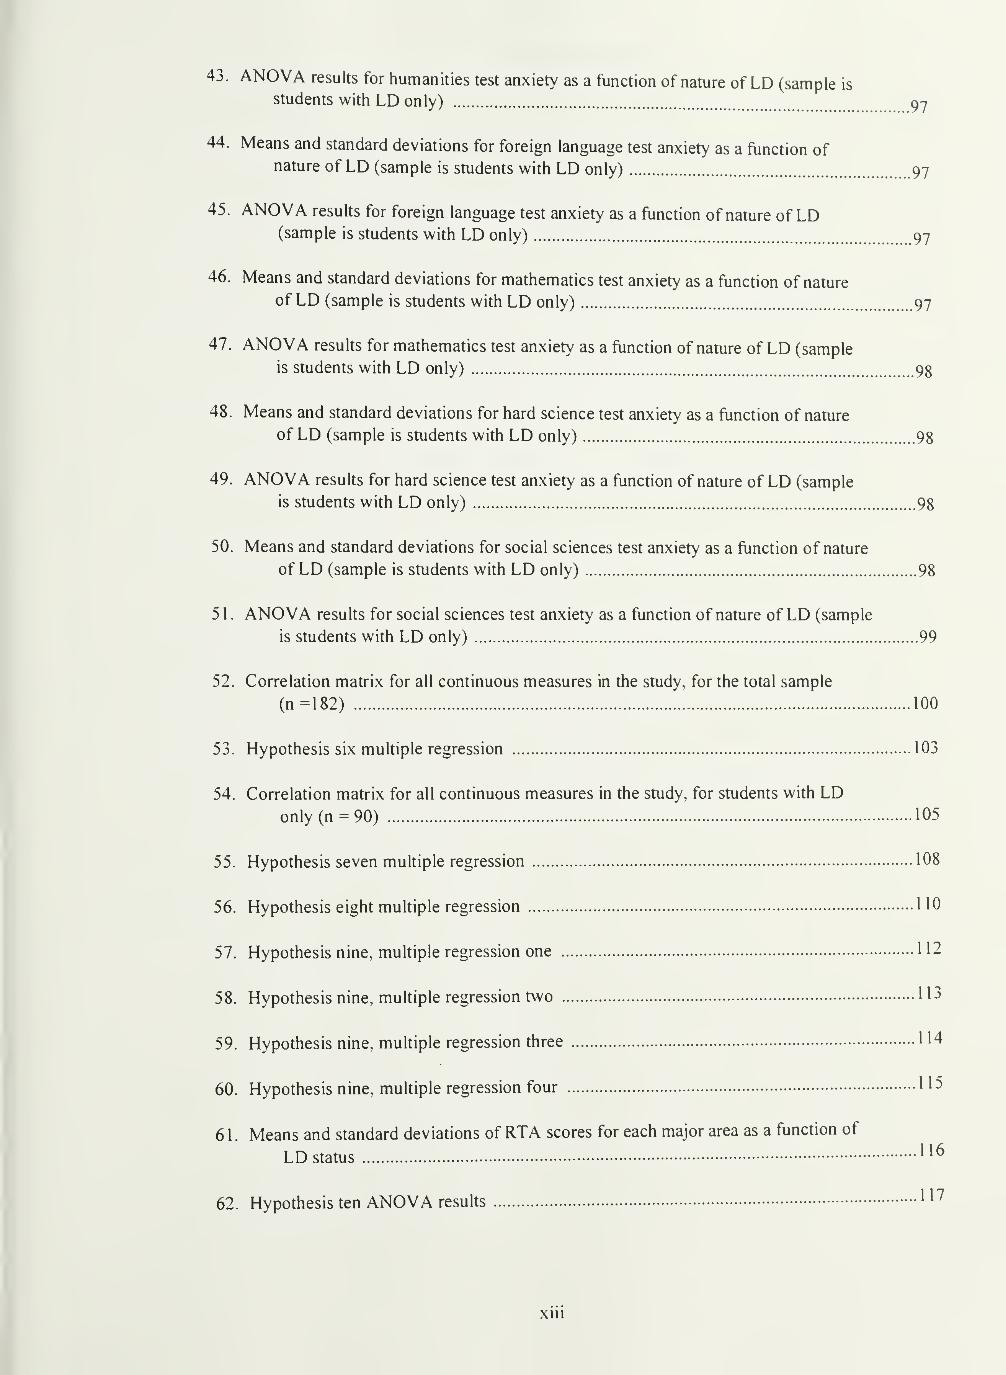
43. ANOVA results for humanities test anxiety as a ftinction of nature of LD (sample is
students with LD only) 97
44. Means and standard deviations for foreign language test anxiety as a ftmction ofnature of LD (sample is students with LD only) 97
45. ANOVA results for foreign language test anxiety as a ftmction of nature of LD(sample is students with LD only) 97
46. Means and standard deviations for mathematics test anxiety as a function of nature
of LD (sample is students with LD only) 97
47. ANOVA results for mathematics test anxiety as a ftinction of nature of LD (sample
is students with LD only) 98
48. Means and standard deviations for hard science test anxiety as a function of nature
of LD (sample is students with LD only) 98
49. ANOVA results for hard science test anxiety as a function of nature of LD (sample
is students with LD only) 98
50. Means and standard deviations for social sciences test anxiety as a function of nature
of LD (sample is students with LD only) 98
5 1 . ANOVA results for social sciences test anxiety as a function of nature of LD (sample
is students with LD only) 99
52. Correlation matrix for all continuous measures in the study, for the total sample
(n=182) 100
53. Hypothesis six multiple regression 103
54. Correlation matrix for all continuous measures in the study, for students with LDonly (n = 90) 105
55. Hypothesis seven multiple regression 108
56. Hypothesis eight multiple regression 1 10
57. Hypothesis nine, multiple regression one 1 12
58. Hypothesis nine, multiple regression two 113
59. Hypothesis nine, multiple regression three 1 14
60. Hypothesis nine, multiple regression four 115
61 . Means and standard deviations of RTA scores for each major area as a ftinction of
LD status
62. Hypothesis ten ANOVA results •'"^
xiii

LIST OF FIGURES
Figurep^g^
1. Interaction between sex and LD status - TMRS 17: Outline of test
in advance 99
2. Interaction between sex and LD status - TMRS 10: Partial credit for
showing work 93
3 . Interaction of LD status and major choice 1 1 g
xiv
INTRODUCTION
Today's students are under high pressure to achieve academically, as it is recognized in our society
that high levels of academic achievement correlate significantly with desirable employment opportunities
and higher incomes. Tests, particularly course final examinations and college and graduate school entrance
examinations (e.g., SAT, GRE), play a critical role in determining students' academic futures. Anything
that might affect an individual's performance on such important evaluations is of great general interest.
The phenomenon of test anxiety is one such factor.
Test anxiety is quite prevalent. It is estimated that from 10% to 25% of the school age population
suffer from test anxiety (King, QUendick, & Gullone, 1990), and surveys have shown that testing is one of
the biggest fears of adults returning to school (Diaz-Lefebvre, 1989). The nature and causes of test anxiety,
as well as the development of assessment procedures and interventions that might mitigate the effects of
this phenomenon, are thus valid and important research concerns.
Test anxiety does not uniformly affect all individuals. Research suggests that test anxiety levels
vary to some degree with other characteristics of individuals, such as gender, IQ, and academic history, and
that students who are in marginalized positions academically and/or socially likely to be more affected.
Research also suggests that characteristics of the testing situation such as the subject area being tested, time
pressure, distractions, and test construction factors (e.g., item order, item clarity) also affect individuals'
test anxiety levels during a given test administration. These environmental factors are of particular interest
because they can be manipulated, and as such might lead to viable interventions for the test anxious
student.
The purpose of this study was to investigate differences in reactions to and beliefs about testing in
college students with and without learning disabilities. Students with learning disabilities were chosen as a
subject group because it was believed that the history of difficult academic experiences in most cases
necessary to acquire such a diagnosis exemplified that suggested by research as contributing to higher
levels of test anxiety. Thus, it was hoped that the effects of such a history could be definitively proven and
analyzed in some detail. Beyond this, students with learning disabilities are already at a disadvantage in a
university environment; investigating the anxiety levels of such students and the ways in which such
1
anxiety might be mitigated was envisioned as having potential benefits in terms of more appropriately
accommodating such students. Finally, students with learning disabilities at the University of
Massachusetts, Amherst are eligible to receive certain accommodations around testing (e.g., untimed tests),
some of which begin to address the situational factors found to affect anxiety (e.g., time pressure). It was
hoped that an investigation of the effect of these accommodations on test anxiety might shed some light on
the effectiveness of environmental modifications in mitigating test anxiety.
In addition to the above concerns, the testing beliefs of non learning disabled students were also
investigated, to develop an overall profile of what students in general find most anxiety producing about
testing procedures. It was hoped that this profile might suggest recommendations for useful, viable
modifications to testing procedures to make testing more reasonable and pleasurable for all students.
2
CHAPTER 1
LITERATURE REVEIW
The Concept of Test Anxiety
Definition and Brief History of the Construct
What is test anxiety? Sieber (1980) defined test anxiety in the most general sense as "a special
case of general anxiety. It refers to those phenomenological, physiological, and behavioral responses that
accompany concern about possible failure" (p. 17).
Although early test anxiety research was conducted in Europe in the early 1900's, and by C. H.
Brown in the United States in the 1930's (Spielberger and Vagg, 1995), the concept of test anxiety itself
was really bom in 1952 when Mandler and Sarason developed the first widely used test anxiety
questionnaire and found that low anxious students performed better than high anxious ones on intelligence
tests (Hembree, 1988). Studies of the relationship between anxiety and school achievement were also done
during this time, with similar results: anxiety was found to have a negative effect on school achievement
(Sarason, Davidson, Lighthall, Waite, & Ruebush, 1960). During the 1960's, research on test anxiety was
focused primarily on the emotional reactivity aspect of test anxiety (physiological arousal), and on
demonstrating that test anxiety did in fact have debilitating effects; during the 1970's, research focused
primarily on cognitive interpretations of the nature of test anxiety, and on developing viable interventions
for this problem (Wine, 1980). Even a brief review of current research makes it clear that cognitive
interpretations have in fact continued to dominate the study of test anxiety into the 1990's, and that a focus
on interventions has been growing.
Components of Test Anxiety
As test anxiety research has progressed, the original unitary concept has been broken down into
several different subcategories. In 1960 Alpert and Haber proposed a two dimensional theory of test
anxiety, consisting of facilitating anxiety, involving task directed behaviors (e.g.: the anxiety that
motivates one to work on academics) and debilitating anxiety, involving task irrelevant behaviors (e.g.;
thinking about failure during a test) (Alpert & Haber, 1960). An extensive review of the research on these
dimensions has shown them to be virtually exact opposites, with the presence of one implying the absence
of the other (Hembree, 1988).
In 1967, Liebert and Morris theorized that debilitating test anxiety itself was composed of two
separate components: worry (cognitions involving concern about one's performance) and emotionality
(autonomic reactions, such as accelerated heartbeat, or sweating) (Liebert & Morris, 1967). There has been
research, however, that suggests that worry and emotionality operate together during test anxiety and are
not separable, as treatments specifically designed to reduce one factor invariably also reduced the other
(Sapp, 1993; Hembree, 1988). Thus, while worry and emotionality describe two theoretically separate
aspects of the test anxiety experience (cognitive and physiological), they appear to be closely connected.
In 1972, Spielberger proposed that there were two separate types of anxiety, differing in etiology
and duration and roughly corresponding to Liebert and Morris' worry and emotionality components: A-
State (a transitory primarily physiological reaction to the situation one is in) and A-Trait (chronic anxiety
and worry as a stable personality trait) (Spielberger, 1972). Research has found A-State anxiety to be
closely related to A-Trait anxiety, with high A-Trait anxious individuals showing higher A-State Anxiety
than non A-Trait anxious peers (Head and Knight, 1988). Studies comparing A-State, A-Trait, and test
anxiety levels have also suggested that test anxiety is more closely related to A-Trait anxiety than to A-
State anxiety (Tobias & Hedl, 1972; Mackenzie, 1994). However, as Devito and Kubis (1983) note,
individuals with high test anxiety tend to have higher state anxiety than low anxious persons during
stressful tests, suggesting that test anxiety may "be conceptualized validly as both state and trait" (p. 970).
Phillips and Endler (1982) suggest that trait anxiety is itself a multidimensional construct and that
"anxiety as experienced may be a function of individual differences in response tendencies toward different
kinds of anxiety arousing situations" (Phillips and Endler, 1982, p. 304). In other words, individuals may
be chronically anxious about some types of situations, and have very little anxiety about others. In Phillips
and Endlers' (1982) study, only trait anxiety related to social evaluation and interpersonal interactions (as
opposed to anxiety about things such as physical danger) was directly related to the development of test
anxiety in stressful testing situations.
4
Zohar (1998) takes the relationship between state and trait anxiety into more detail, proposing an
additive model of test anxiety where "anxiety during testing is considered an additive or incremental
function of dispositional and situational factors" (p. 4). Zohar investigates the use of self efficacy as a
variable to account for situational factors, suggesting that students' self efficacy for a particular test
situation will vary based on a number of factors (how proficient they believe themselves to be at that
particular subject, how much they have studied for that particular test, etc.). In a study investigating the
role of self efficacy as an additive variable to trait anxiety for students taking an Israeli college entrance
exam preparation course, Zohar's model was validated. The level of anxiety for particular tests was shown
to be "an incremental function of test anxiety (trait) and of anticipated success on a particular exam, as
operationalized by self efficacy for grade attainment on that exam. Zohar also notes that Spielberger and
Vagg's (1995) recently developed transactional model of test anxiety, where positive and negative
experiences with particular questions during the test itself contribute to changes in anxiety levels as the
situation progresses, can also be easily incorporated into his additive model.
In a more detailed look at the components that make up test anxiety Sarason (1984), developed the
Reactions to Tests (RTT) scale which he factor analyzed into four component subscales: worry, test
irrelevant thinking, tension, and bodily symptoms. Benson and Bandalos (1992) and Benson and EI-
Zahhar (1994) have confirmed these components and refined their measurement and suggest that they are
unique, though interrelated components of test anxiety. The Revised Test Anxiety Scale (Benson et al.,
1992) is currently viewed as the ^'state of the art'' (Anderson & Sauser, 1995, p. 22) in test anxiety research.
Effects of Test Anxiety on Memory and Cognition
The general effects of anxiety on memory and cognitive processing are confirmed by Darke
(1988). Darke's experiments indicated that anxiety impinges both on short term memory processes
dependent on subvocal rehearsal, such as those used in digit span tasks, as well as on more complex
cognitive processes, such as comprehension, and that this effect increases with task difficulty.
Watts and Dalgleish (1991)confirm the detrimental effects of anxiety on cognitive processes and
suggest the importance of situational factors in exacerbating this effect. In their study, spider phobic
subjects showed significantly worse memory for spider related words than control subjects did, and this
5
effect increased markedly when subjects were in the presence of a live spider. This finding is particularly
relevant to the case of test anxiety, the effects of which are ultimately played out in just this "live" type of
situation.
One important, more specific concern not addressed by Darke (1988) or Watts and Dalgliesh
(1991) is that of exactly how, or at what point in the acquisition, comprehension, and retrieval of
information anxiety causes problems, Mueller, Elser, and Rollack (1993) investigated at what point in the
process of memory anxiety comes into play by assessing the differences between explicit and implicit
memory in high and low anxious subjects. They found that while high anxious subjects did significantly
worse than their low anxious counterparts on a (presumably) anxiety producing explicit memory test, there
was no significant difference between the two groups on an implicit memory task perceived as non-
evaluative. These results of course suggest that anxiety interferes significantly with memory primarily at
the retrieval stage.
In terms of the acquisition stage, Wendell and Tobias (1983) investigated differences in memory
between high and low (trait) anxious college students for information presented in videos immediately after
viewing (initial learning, or acquisition), and one week later (long term retrieval). Wendell and Tobias
found significant correlations between measures of trait anxiety and initial learning test scores, suggesting
that anxiety interferes with the acquisition as well as the retrieval of information. Darke's (1988) work of
course suggests that anxiety affects processing (comprehension) also.
In summary, the overall import of the studies so far reviewed is threefold. First, it is clear that
anxiety has a significant effect on rote memory as well as on more complex cognitive processing tasks.
Second, state anxiety seems to exacerbate the decrements in memory caused by general trait anxiety.
Third, anxiety appears to affect memory/cognitive processes at acquisition, comprehension and retrieval
phases.
Effects of Anxiety on Academic Tests and Performance
While test anxiety has clearly been shown to negatively affect memory and cognition on relatively
artificial tests in fairly controlled settings, the more important questions involve the effects of test anxiety
on students' performance in naturalistic settings. A number of studies completed on this topic show that
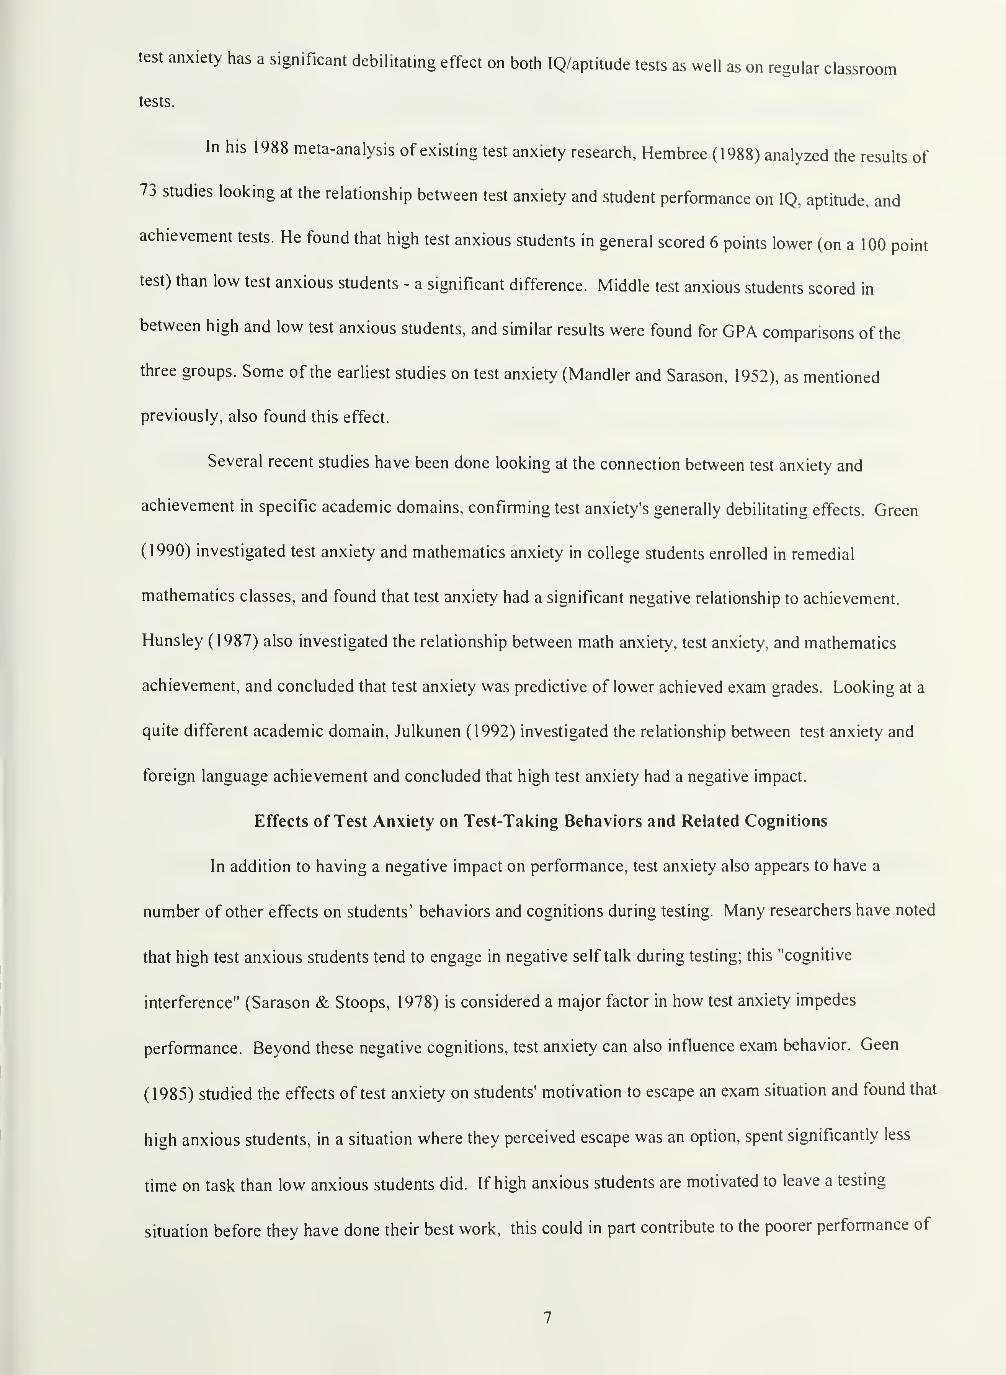
test anxiety has a significant debilitating effect on both IQ/aptitude tests as well as on regular classroom
tests.
In his 1988 meta-analysis of existing test anxiety research, Hembree (1988) analyzed the results of
73 studies looking at the relationship between test anxiety and student performance on IQ, aptitude, and
achievement tests. He found that high test anxious students in general scored 6 points lower (on a 100 point
test) than low test anxious students - a significant difference. Middle test anxious students scored in
between high and low test anxious students, and similar results were found for CPA comparisons of the
three groups. Some of the earliest studies on test anxiety (Mandler and Sarason, 1952), as mentioned
previously, also found this effect.
Several recent studies have been done looking at the connection between test anxiety and
achievement in specific academic domains, confirming test anxiety's generally debilitating effects. Green
(1990) investigated test anxiety and mathematics anxiety in college students enrolled in remedial
mathematics classes, and found that test anxiety had a significant negative relationship to achievement.
Hunsley (1987) also investigated the relationship between math anxiety, test anxiety, and mathematics
achievement, and concluded that test anxiety was predictive of lower achieved exam grades. Looking at a
quite different academic domain, Julkunen (1992) investigated the relationship between test anxiety and
foreign language achievement and concluded that high test anxiety had a negative impact.
Effects of Test Anxiety on Test-Taking Behaviors and Related Cognitions
In addition to having a negative impact on performance, test anxiety also appears to have a
number of other effects on students' behaviors and cognitions during testing. Many researchers have noted
that high test anxious students tend to engage in negative self talk during testing; this "cognitive
interference" (Sarason & Stoops, 1978) is considered a major factor in how test anxiety impedes
performance. Beyond these negative cognitions, test anxiety can also influence exam behavior. Geen
(1985) studied the effects of test anxiety on students' motivation to escape an exam situation and found that
high anxious students, in a situation where they perceived escape was an option, spent significantly less
time on task than low anxious students did. If high anxious students are motivated to leave a testing
situation before they have done their best work, this could in part contribute to the poorer performance of
7
inthese students. Nottleman (1975) studied the relationship between test anxiety and off-task behavior
children performing an anagram task, and found that high anxious children not only exhibited worse
performance than low anxious children, they were also observed to engage in significantly more off-task
behavior, such as glancing away.
Test anxiety also appears to have an unpleasant emotional component, which may also prove
debilitating in its own right. Rappaport (1984) found that high and low test anxious persons differed in
their causal attributions after failing or succeeding in a testing situation. High anxious subjects generally
attributed their failures to a general lack of ability, and believed that most tasks were difficult for them.
They also tended to minimize their successes, attributing them to something they had no control over (e.g.,
luck). Couch (1976) studied the relationship between test anxiety and self perception, and came to the
conclusion that high levels of test anxiety were related to increases in subjects' negative and disparaging
thoughts about themselves.
In summary, test anxiety appears related to a variety of behaviors and cognitions which may occur
during testing and negatively affect the performance and affect of the student.
Theoretical Models of how Test Anxiety Operates
There have been a number of cognitive interpretations advanced regarding the phenomenon of
school test anxiety specifically, which Tobias (1985) summarizes and condenses into two competing
models. The skills deficit model suggests that high anxious students are simply lacking in either study or
test taking skills, and this lack of skill results in anxiety at test time because these students realize they are
inadequately prepared. Anxiety in this model is a result, rather than a cause of poor academic performance.
The interference model, relying on the well supported finding that anxiety impairs recall memory and
cognitive processing generally, suggests that students become anxious due to the stressftil nature of the test
situation, and become preoccupied by worry, which interferes with their successful completion of the test.
Tobias (1985) suggests that these factors are co-contributors to decreased student test
performance. Interference comes into play in that the "cognitive representation of test anxiety must absorb
some of the student's processing capacity, leaving a reduced portion for task solution" (p. 138); in addition,
the attentions of the anxious student are diverted to irrelevant concerns, such as preoccupation with his/her
8
performance, and/or negative thoughts, ftirther limiting processing capacity. Skills come into play in that
high anxious students with good skills can to some extent compensate for their limited processing capacity
by organizing information efficiently, and are thus less affected by their anxiety. High anxious students
with low skills, however, are much more seriously affected by their anxiety.
Paulman and Kennelly (1984) investigated the effects of test anxiety and skills deficits on
information processing deficits. They found that when required to do two processing tasks concurrently,
high anxious, high skilled students showed performance deficits which were not apparent when they were
required to do the tasks sequentially. Low anxious, high skilled students did not show such a difference
between concurrent and sequential conditions, indicating that anxiety does indeed "interfere" and limit
cognitive capacity; it is not just a skills problem. Paulman and Kennelly also assessed cognitive
interference, and found that both high anxiety and low skill level were associated with a significantly
higher number of task irrelevant thoughts. This questionnaire, along with verbal reports by subjects at the
time of debriefing, indicated that the nature of these intrusive, irrelevant thoughts included: "concerns
about poor performance, ability level, embarrassment in front of experimenter, and potential receipt of
failure feedback upon termination [of the experiment]" (p. 285). These findings again indicate that anxiety
decreases student task performance specifically by impinging on cognitive capacity through negative, self
deprecatory thoughts and support the notion that there are two types of test anxious students: 1 ) those with
good learning skills for whom test anxiety causes problems primarily through interfering with the retrieval
of information and, 2) those with poor learning skills who become anxious because they are aware of their
deficits and then are further affected by this anxiety through the interference process.
Based on this idea, Naveh-Benjamin (1991) reasoned that high anxious students with good skills
would experience the most anxiety reduction through an intervention specifically designed to reduce test
anxiety (e.g.: systematic desensitization) as opposed to study skills training, and that students with poor
study skills would experience the most anxiety reduction through the use of study skills training as opposed
to an anxiety reduction strategy. This is exactly the result that was found, thus confirming that test anxious
students differ significantly depending on skill level, and that both interference and skills deficits can be
involved in test anxiety. In a similar study, Covington and Omelich (1987) arrived at the same conclusion.
9

Brown and Nelson (1983) looked at college students' cognitions, skill levels, and test anxiety
levels in an attempt to determine if there were any specific types of cognitions that might lead students to
be more anxious in a testing situation. It was found that in high performing, high anxious students a major
source of their anxiety came from the fact that they believed that they had to know everything that could
possibly be on the test before they sat down to take it (an impossible task), and thus, since this could not be
accomplished, remained extremely anxious no matter how much they studied. These results again suggest
that different types of students (e.g., high and low skills) may become anxious for quite different reasons.
A much more recent study by Lee (1995) also supports the cognitive capacity theory of test
anxiety. Lee suggests that test anxiety triggers an associative network of worry which remains active
during the entire testing period, bringing up test irrelevant information which competes with the test
relevant information necessary to successfully complete the task at hand. As suggested by Paulman and
Kennelly (1984) and Darke (1988), Lee found that the effects of anxiety become especially relevant (and
measurable) as task demands increase.
Several studies done in naturalistic settings confirm subjects' experiences of distracting cognitions
interfering with information retrieval. Couch (1979) found that students with high debilitative anxiety
showed poor attention to the task at hand because they were focused on previous mistakes, self criticism,
and doubts about their academic ability. Zatz and Chassin (1985) investigated the cognitions of elementary
school children with different levels of test anxiety and also found that high anxious children tended to go
off task during testing because they were involved in negative self evaluations. These studies confirm the
results found by Sarason and Stoops (1978), Paulman and Kennelly (1984) and Lee (1995), suggesting that
cognitive interference in terms of negative, off task thoughts is a major component of test anxiety.
Hembree (1988) did a meta-analysis of 137 studies of the treatment of test anxiety including
behavioral, cognitive, cognitive-behavioral, study skills training, testwiseness training, and placebo
therapy, and reached the conclusion that cognitive and behavioral treatments were effective, supporting an
interference model of test anxiety. Study skills treatments alone were not found to be effective, thus
calling the deficit model, at least taken as a unique cause of test anxiety, somewhat into question.
10

In summary, there is a great deal of support for the interference model of test anxiety, where
anxious individuals experience distracting cognitions (often in the form of negative self evaluations) that
impinge upon their limited cognitive capacity and block the retrieval of information. Study skills deficits
also appear to be contributors to test anxiety for some, but not all, individuals, and the evidence suggests
that such deficits are not uniquely responsible for the experience of test anxiety or the performance
decrements that accompany it.
Conclusion - General Concept of Test Anxiety
Test anxiety is a multi-component construct, the negative effects of which have been amply
demonstrated. The questions of who is most affected by test anxiety and why, and of what environmental
factors exacerbate or mitigate test anxiety, are the subjects of the following sections of this review.
Group and Individual Differences in Test Anxiety
Significant differences in test anxiety levels have been found between students from different
races, cultures, backgrounds, and special needs groups. Gender differences in test anxiety have also been
found. In addition, individual differences in ability, motivation, and in test related behaviors and
cognitions have been found to be related to differential levels of test anxiety in students. The nature of
such differences, and theories about the possible causes of such differences, is the subject of this section of
the literature review.
Gender
There has been a great deal of research done on gender differences in test anxiety. In his 1988
meta-analysis of 562 test anxiety studies, Hembree concluded that "females consistently showed higher
levels of test anxiety than males" (p.60). A variety of other studies confirm Hembree's (1988) findings.
For example, Dodds (1975) looked at IQ, sex, SES, and school achievement as correlates to test anxiety in
seventh grade students, and found that the strongest correlate of anxiety was the sex of the student.
Gender differences in test anxiety have also been documented cross-culturally. Sharma and Sud
(1990) investigated test anxiety in four Asian countries (India, Jordan, China, and Korea) and five Euro-
American countries (Hungary, Turkey, Italy, Germany, and America) and found that females had higher
test anxiety than males in all cases. Sharma, Pamian, and Spielberger (1983) investigated test anxiety in
11

Indian and Iranian seventh graders and undergraduates, El-Zahar & Hocevar (1991) investigated levels of
test anxiety in males and females in Egypt, Brazil, and the United States; both studies found that females
had higher test anxiety than males in all countries on all measures.
Bander and Betz (1981) investigated the effects of sex and sex role on situationally specific
anxiety types. Their hypothesis was that differences in anxiety would be greater between males and
females in situations that were sex role stereotyped. To investigate this topic, Bander and Betz compared
levels of math anxiety (masculine stereotypic domain), general test anxiety (sex neutral domain), and two
measures of trait anxiety in males and females. The results of their study confirmed that the variable most
associated with sex differences was math anxiety. These results suggest that sex role socialization may play
a role in determining the anxiety level of individuals, particularly in regard to sex stereotyped domains,
such as mathematics. These findings also indicate the degree to which social roles/expectations might
influence test anxiety generally, which could affect a number of different groups.
In summary, there appears to be a consistent correlation between gender, test anxiety, and related
^forms of anxiety, with females exhibiting higher levels of anxiety than males. These findings are important
for future research, as gender could be a significant confound.
Cultural/Ethnic Differences
Test anxiety appears to be a universal phenomenon (El-Zahar & Hocevar, 1991), but this does not
mean that it exists at equivalent levels in all cultures or in all ethnic backgrounds within American culture.
El-Zahar and Hocevar (1991) compared test anxiety levels of high school students in Egypt and Brazil
with those of similar students in the United States. Their hypothesis was that test anxiety levels would be
higher both in Egypt and in Brazil than in the United States, because in both Egypt and Brazil students are
given a high school exit examination that determines whether or not they will be able to continue on to a
university. The results of the study generally confirmed that the Egyptian and Brazilian students were
more anxious. Guida and Ludlow (1989) investigated levels of test anxiety in Chile and in the United
States, and found that Chilean students also generally had higher levels of test anxiety than American
students. To explain this finding, Guida and Ludlow suggest that in countries such as Chile, "where
educational opportunities and advancement are restricted, the importance of any single test as a selection
12
instrument may be exacerbated. It is likely that students faced with such situations recognize the great
importance placed on the result of each test and consequently experience greater levels of anxiety" (p.
188).
In an attempt to investigate how an individual's status within a particular culture might effect test
anxiety levels, Bronzaft, Murgatroyd, & McNeiUy (1974) looked at levels of test anxiety in Black students
attending Lehman College in New York, and in Black students attending the University of the West
Indies, in Trinidad. The authors note in the United States, Blacks have a minority status and many of the
Black students in the Lehman College sample had had negative educational experiences in the past
"associated with punishment and criticism" (p. 192). In contrast: "in Trinidad Blacks are not a minority
group and should have had more positive experiences in the educational setting" (p. 192), As these authors
expected. The Black students attending Lehman College had significantly higher test anxiety scores than
the Black students from Trinidad.
The effects of minority status and the social problems that come with it are also suggested by
Phillips (1978), who found that Mexican American children who were a minority group in a particular
school had higher levels of test anxiety than non minority children, but in another school where Mexican
American children were the majority, these children did not exhibit higher levels of test anxiety, instead,
white children (the minority in this second school) had the higher levels of test anxiety. As Phillips
Pitcher, Worsham, and Miller (1980) note: "minority status, regardless of racial-ethnic status may be an
important factor in some children's stress and test anxiety" (p. 341). This idea is corroborated by Entwistle
and Greenberger (1970) in their study of test anxiety in Maryland ninth graders. Entwistle and
Greenberger conclude that test anxiety does not show differences by racial groups or social class per se, but
more by students' relative standing in the ability distribution of their school, with students who feel
comparatively less able exhibiting the highest level of test anxiety. Again it seems clear that the problems
associated with minority status, particularly negative educational experiences, as opposed to anything
unique about any one particular cultural group are in large part responsible for the higher levels of test
anxiety minority students may experience.
13
Ability
As was noted in the earlier section on the effects of test anxiety, lower IQ's are often associated
with higher levels of test anxiety (Hembree, 1988). A number of other studies have confirmed this finding.
Gjesme (1981) found that ability was one of the factors that correlated most highly with scores on the Test
Anxiety Scale for Children. Schmitt and Crocker (1984) also found significant interactions between ability
and test anxiety levels. One study that sheds a bit more light on the connection between ability and test
anxiety is again Entwistle and Greenberger's (1970) investigation of the relationship between test anxiety
and IQ, school type (rural vs. urban), race, and social class. Entwistle and Greenberger found that "test
anxiety level appears to depend much less on a student^s absolute performance level than on his relative
standing in his own subcultural group or school" (p. 14). As suggested by Phillips and Endler (1982)
social evaluation may be a major component of test anxiety.
In a related study, DuCette and Wolk (1971) looked at test anxiety levels in high and low ability
tracked ninth and twelfth graders at an all-girls Catholic high school. They found that students in the lower
ability track had higher test anxiety scores at both grade levels, and a higher need to avoid failure. In a
similar study done in Germany, Littig and Knapp (1978) arrived at similar results: in schools with ability
grouping, students in the lower tracks experienced higher levels of test anxiety than higher ability students.
In summary, it appears that individual differences in ability are related to differences in test
anxiety level, but this process appears to be mediated by social variables in terms of how the student
perceives his/her ability level relative to a salient comparison group.
At-Risk Students
Sapp (1993) defines at-risk students as "students of normal intelligence whose academic
background or prior performance may cause them to be perceived as candidates for future academic
failure" (p. 202), and has found these students to exhibit significantly high levels of test anxiety. Hembree
(1988) in a combined analysis of three studies also found that at-risk students displayed significantly higher
levels of test anxiety than students who were passing. These findings seem understandable given the
research of Entwistle and Greenberger (1970) and DuCette and Wolk (1971) suggesting that it is a student's
14

awareness of his/her marginal standing relative to other students in the school that may lead to increased
levels of test anxiety.
Age/Grade Level
Children of different age groups/grade levels appear to experience different levels of test anxiety.
Hembree (1988) analyzed 78 studies that overall looked at test anxiety differences between adjacent grades
from 2 through 12. He found that "after increasing in the early grades, TA appeared to stabilize near grade
5, remain essentially constant through high school, and show a small decline in college'* (p. 60). He did
note, however that the decline in test anxiety scores in college may "reflect attrition more than
developmental trends" (p. 60). This seems very possible because, as discussed, test anxiety is correlated
with a number of factors such as minority status, SES, and ability, any and all of which may marginalize a
student's chances of ever attending college in the first place.
A number of other studies have confirmed Hembree's findings Grierl and Bisanz (1995)
investigated levels of test and math anxiety in grades 3 and 6 and found that mathematics test anxiety
increased with age/grade. Dunn and Shanks (1967) in their study of elementary and middle school
children also found that as children grow older they dislike school and testing more and more. Sud (1991)
investigated differences in test anxiety between undergraduates and high school students in both India and
in the United States, and found that in the United States both male and female high school students showed
higher levels of test anxiety than male and female college students; in India, while there were no
differences in anxiety between male high school and college students, Indian female high school students
showed higher levels of anxiety than Indian female college students.
In summary, test anxiety appears to increase with age/grade level until the middle school years,
where it remains constant throughout high school. Test anxiety appears to be lower in college students
than in high school students, possibly as a result of attrition.
Students with Learning Disabilities
Some direct and quite a bit of indirect evidence indicates that students who are diagnosed as
having learning disabilities will tend to exhibit significant levels of test anxiety. First, the theories about
15
the nature of test anxiety suggest this. The skills deficit model summarized by Tobias (1985) suggests that
for low skills students, and awareness of their lack of skills may contribute to anxiety at test time. Any
student who has received a diagnosis of a learning disability was almost certainly placed in this position as
a result of academic problems (e.g., low skills). If one's awareness of past and current academic problems
causes anxiety, clearly this is a position in which many students with learning disabilities might find
themselves. A recent study by Geisthardt and Munsch (1996) on school stress in adolescents with and
without learning disabilities confirms this possibility. These researchers found that learning disabled
students were significantly more likely to have failed a class than their non learning disabled peers by an
almost two to one margin. The above mentioned research indicating that at-risk students exhibit high levels
of te3t anxiety (Sapp,1993; Hembree, 1988) also supports the idea that students with learning disabilities
might be more test anxious. Sapp notes that "at-risk" has also been defined by criteria including a
student's being "one or more years behind his/her age or grade level group in mathematics or reading skill
levels" (p. 202). Clearly these descriptions might have applied to many students with learning disabilities
at some point in their academic career. The evidence thus suggests that in many cases negative academic
experiences may predispose many students with learning disabilities to react anxiously to evaluation. That
testing in particular is a major issue for students with learning disabilities is also indicated by the fact that
the most commonly provided accommodation for college students with learning disabilities is untimed tests
(Hill, 1996; Silver, 1995).
The work by Entwistle and Greenberger (1970) suggesting that a student's perception of his/her
ability as inferior relative to a salient reference group contributes to test anxiety also has implications for
the student with learning disabilities. Many students with learning disabilities are consistently singled out
for special services, and so may compare themselves unfavorably with the majority of their classmates.
Many studies confirm this notion. Cosden and McNamara (1997) examined the self perceptions of college
students with and without learning disabilities and found that students with disabilities had lower grades,
test scores, and perceptions of their scholastic and intellectual competence than did their non leammg
disabled peers. Renick and Harter (1989) investigated third through eight grade students with learning
disabilities in terms of their self perceptions of scholastic and athletic competence, social acceptance, and
16

feelings of global self worth, and found that when these students compared themselves with normally
achieving students in their regular classes, their perceptions of academic competence were lower than when
they simply assessed themselves, and that these comparative perceptions became more negative as the
students' grade level increased. This finding suggests that the longer students have been singled out as
academically problematic in some way, the more likely they are to have negative self perceptions regarding
their academic ability. This finding may have some fairly serious implications for the population of
college students with learning disabilities, many of whom may have suffered from the effects of negative
social comparison for many years. Swanson and Howell (1996) found a significant negative correlation
between academic self concept and test anxiety in students with learning disabilities. If perception of
oneself as less able relative to a salient reference group is really as critical a factor in promoting test anxiety
as research has shown it to be, it would seem that students with learning disabilities are very likely to be at
greater risk for such anxiety than their normally achieving peers.
Research on students diagnosed as learning disabled also suggests that a connection may exist
between learning disabilities and anxiety generally (Lyon, 1996). Bruck (1986) has concluded that
children with learning disabilities are more likely to show increased levels of anxiety as compared to their
non learning disabled peers, and suggests that many of the emotional problems these children face may
reflect adjustment difficulties due to academic failure.
In dealing with the more specific phenomenon of test anxiety in students with learning disabilities,
Bryan, Sonnefeld, and Grabowski (1983), assessed levels of test anxiety in 3rd through 8th grade students
both with and without learning disabilities and found anxiety levels to be significantly higher in the
learning disabled students. Unfortunately, little work has been done on test anxiety with older, particularly
postsecondary, students with learning disabilities, so it is uncertain whether this situation continues in the
higher grades.
Wood, Miederhoff, and Ulschmid (1989) have investigated the effects of testing on children with
a variety of mild handicaps (behavioral, physical, sensory), including learning disabilities, who are
mainstreamed into the regular classroom. They note that "many mildly handicapped children see tests as
nightmares that elicit memories of previous failures" (p. 46), an idea that is consistent with much of the
17
previous research. They give the example of a student with fine motor problems who may have trouble
writing out essay answers on tests and thus finds herself unable to complete them; being reluctant to ask for
special assistance, she often fails and regards herself as a failure. Students with a variety of mild physical
and sensory handicaps, as well as with learning disabilities may find themselves in similar situations in the
mainstream classroom and hence develop high levels of test anxiety, ftirther compounding the difficulties
they are already facing.
In summary, there is both direct and indirect evidence to suggest that students with learning and
other di'sabilities may exhibit higher levels of test anxiety than their non disabled peers, and that this effect
may in fact increase the longer students are aware of their difficulties relative to a salient reference group
of nondisabled students.
Differences in Classroom Personality Measures
Strom, Hocevar, & Zimmer (1987) have introduced two new personality constructs specifically
related to educational phenomena. These constructs are: 1) preference for course difficulty, which involves
a student's attitude toward the amount of effort that a particular class requires, and 2) preference for course
structure, which involves a student's attitude toward the amount of control imposed by an instructor or
method of instruction. Strom et al. investigated the relationship of these two classroom personality
constructs to test anxiety, and found that preference for course difficulty showed a significant negative
correlation with test anxiety levels, with students who enjoy difficult courses showing lower levels of test
anxiety. This suggests that high levels of test anxiety may cause students to avoid courses they fear will be
difficult.
Self-Concept Variables, Success/Failure Attributions, and Learned Helplessness
Self-concept variables include self-esteem, self-efficacy, and the nature of the causal attributions
one makes about one's performance following failure or success. Dykeman (1994) investigated the effects
of self-efficacy, motivational orientation, and feedback on test anxiety in graduate students and found that
task-oriented, high self-efficacy students showed the least amount of test anxiety. Comunain (1989)
examined the relationship between depression, anxiety, and self-efficacy in Italian high school students and
found that anxiety correlated negatively with self-efficacy and positively with depression. Bandalos,
18

Yates, and Thomdike Christ (1995) also investigated the relationship between self-efficacy and test
anxiety, and also found that self-efficacy correlated negatively with test anxiety. After analyzing 58 studies
relating test anxiety to various measures of self-concept, Hembree (1988) concluded that: " a strong inverse
relationship appeared between self-esteem and test anxiety. High test anxiety students were inclined to an
external locus of control and were prone to feel unprotected" (p, 56). Zohar's (1998) additive model of test
anxiety also found self-efficacy (for performance in particular subject areas) to be related to test anxiety.
These findings continue to suggest, as noted earlier, that students with learning disabilities, who have been
found to consistently score lower on measures of self- esteem than non learning disabled students (Cosden
& McNamara, 1997; Bear, Clever, & Proctor, 1991), will tend to be more test anxious than their non
learning disabled peers.
As has been discussed, it has been found that the task irrelevant thoughts of high test anxious
students in a testing situation often include negative self statements involving their ability (Paulman and
Kennelly, 1984), strengthening the theory that they may be attributing failure experiences to lack of ability
(Bandalos, Yates, & Thomdike-Christ, 1995). Bandalos et al. note that several researchers have found
that high test anxious students tend to attribute failure to stable, internal causes such as lack of ability, and
in their own study on statistics test anxiety they arrived at exactly the same result. The ultimate effect of
such stable internal attributions regarding failure may be related to the idea of learned helplessness, which
is defined as " the perception of independence between one's responses and the occurrence or termination
of an aversive stimulus (in this case, failure)" (Phillips et al. 1980, p. 338). This relates to Hembree's
(1988) conclusion that high test anxious individuals are inclined to an external locus of control. Given the
previous research describing the situation many students with learning disabilities are in, many might
ultimately find themselves in just this position. These individuals may have both the anxiety component
and in many cases the repeated experiences of failure that could lead them to a sense of resignation and
helplessness regarding their academic performance. Given this possibility, ftirther investigation into the
levels of test anxiety and its related (and damaging) correlates for such students seems particularly
important.
19
In summary, self-concept variables such as self-efficacy/self-esteem are negatively correlated with
test anxiety. The attributions an individual makes regarding their success or failure at tasks are also related
to test anxiety, with high test anxious persons tending to attribute poor performance on tests to stable
internal causes, such as low ability, over which they have no control. Through this process, some test
anxious individuals may become resigned to poor performance and decrease their academic efforts.
Conclusion - Group and Individual Differences
In conclusion, it appears that a large variety of individual and group difference factors may be
related to test anxiety. Doubtless many of these factors are intercorrelated, so making definitive statements
about the effects of any one unique contributor to a student's test anxiety is difficult. Overall, however,
several common threads emerge.
First, it seems clear that students with a difficult academic history, for whatever reason - at-risk
students, students with learning disabilities, minority students, low ability students - exhibit higher levels of
test anxiety. This "difficult academic history" will in most cases be related to low self-efficacy, low skills
levels, and tracking in low ability groups - all of which correlate with higher test anxiety levels.
Beyond this, it appears that social comparison and evaluation play a major role in exacerbating
the test anxiety of marginalized students. It seems that academic difficulties or marginal status socially
and/or academically alone do not cause test anxiety per se, as much as the student's perception of this status
relative to a salient reference group. As Phillips and Endler (1982) discovered, the social evaluation
component of testing appears to be what leads to the most anxiety for students.
Gender differences in test anxiety are also a consistent finding, perhaps for similar reasons.
Women are well aware of the fact that they have traditionally had a marginalized role in academics, and
still do today, to some extent, although this is slowly changing.
Environmental Variables Contributing to Test Anxiety
Anxiety generally does not develop in a vacuum. In any given situation there will be factors that
contribute to the anxiety of particular individuals, as well as factors that mitigate this anxiety. The testing
situation is no exception. From the nature of the test itself - the type of questions used, the way instructions
are given, etc. - to the way the examiner interacts with students, to the testing conditions - open versus
20
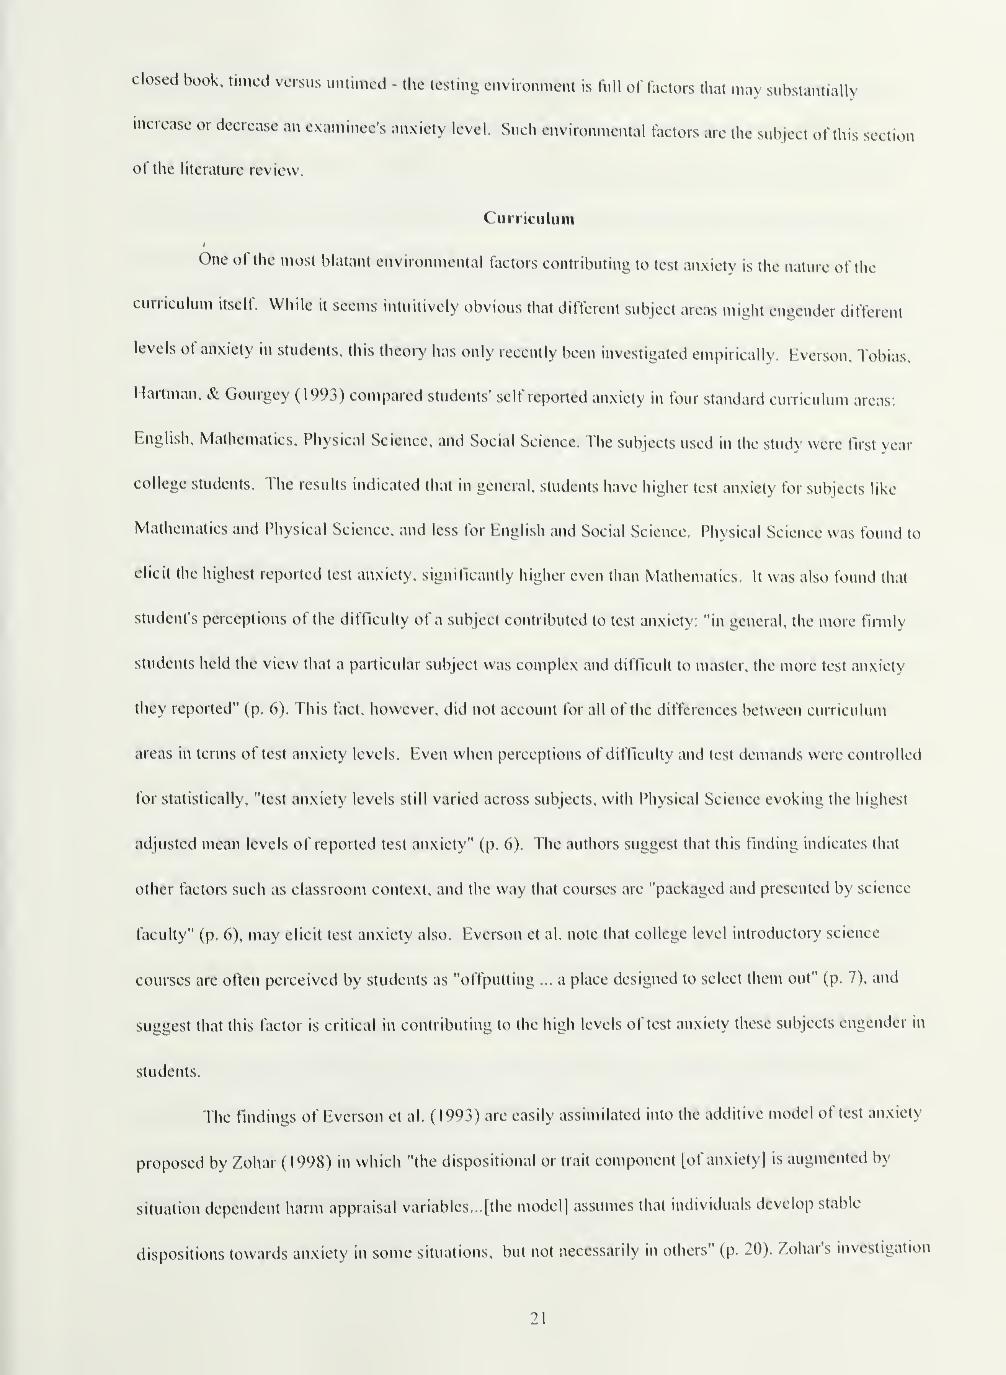
closed book, timed versus untimed - the testing environment is full of factors that may substantially
increase or decrease an examinee's anxiety level. Such environmental factors are the subject of this section
of the literature review.
Curriculum
One of the most blatant environmental factors contributing to lest anxiety is the nature of the
curriculum itself. While it seems intuitively obvious that ditTerent subject areas might engender different
levels of anxiety in students, this theory has only recently been investigated empirically. Everson, Tobias,
Hartman. & Gourgey (1993) compared students' self reported anxiety in four standard curriculum areas:
English, Mathematics, Physical Science, and Social Science. The subjects used in the study were first year
college students. The results indicated that in general, sUidents have higher test anxiety for subjects like
Mathematics and Physical Science, and less for English and Social Science. Physical Science was found to
elicit the highest reported test anxiety, significantly higher even than Mathematics. It was also found that
student's perceptions of the difficulty of a subject contributed to test anxiety: "in general, the more firmly
students held the view that a particular subject was complex and difficult to master, the more test anxiety
they reported" (p. 6). This fact, however, did not account for all of the differences between curriculum
areas in terms of test anxiety levels. Even when perceptions of difficulty and test demands were controlled
for statistically, "test anxiety levels still varied across subjects, with Physical Science evoking the highest
adjusted mean levels of reported test anxiety" (p. 6). The authors suggest that this finding indicates that
other factors such as classroom context, and the way that courses are "packaged and presented by science
faculty" (p. 6), may elicit test anxiety also. Everson et al. note that college level introductory science
courses are often perceived by students as "offputting ... a place designed to select them out" (p. 7), and
suggest that this factor is critical in contributing to the high levels of test anxiety these subjects engender in
students.
The findings of Everson et al. (1993) are easily assimilated into the additive model of test anxiety
proposed by Zohar (1998) in which "the dispositional or trah component [of anxiety] is augmented by
situation dependent harm appraisal variables.. .[the model) assumes that individuals develop stable
dispositions towards anxiety in some situations, but not necessarily in others" (p. 20). Zohar's investigation
21
focused on the variable of perceived self efficacy for a particular exam, a concept which can be seen to
clearly align with Everson et al.'s findings involving students' particular trepidation about the physical
sciences. If students perceive a particular class as generally threatening and aimed at "weeding out" less
able students, this would be likely to decrease their perceptions of self-efficacy for grade attainment on any
given exam in that class, and contribute to increased test anxiety through the model Zohar presents. Zohar
himself indicates that his model accounts for curriculum based differences in test anxiety: "In test anxiety,
the assumption would be of stable differential dispositions to experiencing anxiety in some tests but not in
others (e.g. mathematics and physics, but not humanities)" (p. 20).
In summary, different subject areas do appear to engender different levels of test anxiety in
students.
Test Construction Factors
Types of Questions
Several researchers have investigated the effects of test type (multiple choice, matching, true false,
essay, etc.) and test focus (specific factual details, general concepts, application of knowledge) on students'
test anxiety levels. Weare (1984) surveyed 134 adult students on their testing preferences in terms of
question type. She found that the test type most preferred was multiple choice, followed by (in descending
order) true-false, matching, fill-in-the-blank, and essay. In general, confusing questions led to the most
anxiety. Examples of these include: essay questions which were vaguely worded, leading to uncertainty
about an appropriate response; True-false items that were considered to be "tricky" - one small detail
causing the difference between true and false; and multiple choice questions which were perceived to
contain a trick (e.g. pick the "best" answer). Interestingly, Weare notes that the same types of questions
that may prove anxiety provoking for one, or even a majority of students may not prove anxiety producing
for others with different skills or likes/dislikes. In general, the results of Weare's qualitative analysis
suggest that the tendency for a particular type of test to provoke anxiety in a student is somewhat
dependent on that student's own self perceived strengths and weaknesses. This is again consistent with
Zohar's (1998) additive model of test anxiety.
22
Computer and Self Adaptive Testing and Perceived Control
With the advent of Item Response Theory (IRT) it is possible to compare the test performance of
examinees on the same scale of measurement even if they are administered different sets of test items
(Wise, Plake, Johnson, & Roos, 1992). Two applications of this feature of IRT are computerized adaptive
testmg (CAT) "in which a computer algorithm is used to match the difficulty levels of the items
administered to the ability level of each examinee" (Wise et al., 1992, p. 329), and self adapted testing
(SAT) in which the examinee may choose the difficulty level of each test item to be administered from one
of several available levels. Rocklin and O'Donnell explain the difference between CAT and SAT : "instead
of being tailored to the examinee's estimated ability level, a self adapted test is tailored to the examinee's
self-perceived ability as well as to his or her current motivational and affective characteristics" (Rocklin
and O'Donnell as cited in Wise et al., 1992, p.330).
Rocklin (1989) investigated individual differences in item selection on SATs and found that most
subjects adopted a flexible strategy, choosing harder items following success, and easier items following
failure. He also found that subjects of differing levels of test anxiety used different item selection
strategies, validating that SAT's are valuable in accommodating individual differences in examinees
beyond simply the ability differences accommodated by CAT's.
Wise et al. (1992) investigated differences in test anxiety and performance in undergraduate and
graduate introductory statistics students taking a basic algebra skills test in either a computerized adaptive
test condition or a self adapted test condition. In both the CAT and SAT conditions, feedback was given
after each item was administered, allowing the student in the SAT condition to choose the difficulty level
of his next item based on some indication of how he was doing; feedback was given in the CAT condition
to eliminate the possibility that feedback might become a variable that would confound the results of the
study. Wise et al. found that the mean ability score for students taking the SAT was significantly higher
than for those taking the CAT, and that those taking the SAT had significantly lower levels of test anxiety
than those taking the CAT. Wise et al. note that this finding that students taking the SAT had higher scores
than those taking the CAT suggests that the IRT model may not fit when SAT is used. Items appeared to
be easier for students in the SAT condition, which violates an assumption of IRT. Wise et al. suggest the
23
problem is that the IRT model is based solely on ability, and that it is likely that "an examinee's success in
passing an item is not simply a flinction of ability but that his or her success is also influenced by
psychological factors, such as anxiety or motivation. The greater the influence of psychological factors on
exammee test performance, the less complete are models based solely on ability (e.g., IRT)" (p.337).
In a related study, Wise, Roos, Plake, & Nebelsick-GuUett (1993) investigated the effect of not
only SAT and CAT on test anxiety levels, they also looked at the effect of giving students a choice
between these two types of tests. Wise et al. (1993) theorized that students given a choice between types of
test would perceive that they had more control over the testing situation and hence have lower levels of
anxiety. Wise et al. (1993) again looked at undergraduate and graduate students in an introductory
statistics class, and again used a basic algebra skills test. Three test-taking conditions were arranged: CAT,
SAT, and a "choice" condition where students were allowed to choose between CAT and SAT conditions.
Subjects were also divided into three anxiety levels (low, moderate, and high) based on a pretest anxiety
measure. The results of the study indicated that high anxiety students in the "choice" condition showed
significantly better performance than high anxiety students in either of the other two conditions. It was
also found in the choice condition that while low anxiety students tended to choose the CAT, the majority
of high anxiety students chose the SAT. In terms of anxiety levels, as found in earlier studies, students in
the SAT condition exhibited significantly lower levels of post-test anxiety than students in the CAT
condition. These results indicate that high anxious subjects tend to reap the greatest benefit from having
control over their testing situation as compared to subjects of low or moderate anxiety. The results also
confirm the finding that SAT reduces test anxiety as compared to CAT. Wise et al. (1993) note that if a
SAT reduces the influence of test anxiety on examinee performance, the resulting scores should be more
valid measures of examinee proficiency than scores obtained using a CAT.
Although it seems clear that a SAT is less anxiety producing than a CAT, both types of test still
require computer administration. Vogel (1994) found that computer experience was negatively correlated
with test anxiety in computerized testing situation. However, ahhough it appears that subjects with limited
computer experience are more anxious in a computer testing situation, their test performance is not
affected.
24
In summary, it appears that self adapted testing (SAT) is less anxiety producing than
computerized adaptive testing (CAT), probably because the examinee perceives that he/she has more
control over the testing situation. Computerized testing in general may cause higher levels of test anxiety
in some students. It seems likely that the effect of computer testing on anxiety level is again a ftinction of
individual differences, in this case involving computer comfort and experience.
Presence of Defects on Tests
One of the most important aspects of test construction is accuracy: that the tests produced are free
of defects. At least two studies cite the presence of defects in the test as particularly anxiety producing for
students. Weare (1984) in her survey of adult learners returning to school, notes that "poor test
construction ... coupled with poor scoring and grading practices, causes anxiety" (p. 2). Weare defines
several factors which indicate poor test construction including vaguely worded essay questions and "items
not used to measure understanding ... the emphasis is placed on small details which are trivia" (p.2).
Madsen and Murray (1984) in a qualitative study of test anxiety in ESL students listed a number of exam
defects which these students had cited as being anxiety producing for them. These included: unclear essay
instructions, inadequate space to write responses, numbering errors on the test, and poor sound quality on
audio tapes used on listening sections of language tests.
In summary, exam defects, particularly those that contribute to the conftision of the students are a
source of anxiety in testing situations.
Constructing Tests for Students with Disabilities
Wood, Miederhoff, and Ulschmid (1989) suggest a variety of guidelines for adapting test
construction to facilitate performance and minimize test anxiety in students with handicaps and learning
disabilities. Test directions which may be difficult for disabled students should be modified. For example,
the use of oral directions exclusively should be avoided, unfamiliar words should be defined, and
examples of appropriate responses should be given. These recommendations echo the concerns of Madsen
and Murray's (1984) non-disabled ESL students regarding badly constructed tests. When a student finds
test directions difficult to understand for whatever reason, it is anxiety producing. The choice and
construction of test items should be undertaken with a view to the unique problems of the disabled student
who will be taking the test. Examples of problematic item construction techniques include: giving a very
large number of answer choices, arranging items or answer choices in a visually conftising manner, using
complex, wordy statements, stating questions in the negative, and having students select a letter coded
response from a group of possible responses as opposed to circling correct answers. Any of these
situations may confiise a student depending upon his/her particular disability, and this will tend to increase
test anxiety to the detriment of the student's concentration and performance. Again, students with
disabilities may be viewed as a group of individuals who are particularly illustrative of the effects of a
specific test anxiety correlate, in this case, poorly constructed test items.
General Testing Parameters and Conditions
Take Home and Open Book Conditions
Several other aspects of test administration which affect students' anxiety levels have been
uncovered by Zoller and Ben-Chaim (1988). These researchers investigated the effects of exam type on
student anxiety and performance in undergraduate science education majors using a questionnaire to assess
types of preferred examinations, such as oral versus written, group vs. individual, and open vs. closed
book. Zoller and Ben-Chaim found that students most preferred exams where 1) time was not limited and
2) the use of supporting material (notes, books, etc.) was permitted. Thus, time pressure and memorization
pressure were seen by these students as the largest contributors to test anxiety. Another finding was that
the idea of group examinations, where one is examined in the presence of an audience, was very unpleasant
to these students, corroborating the findings of Phillips and Endler (1982) that social evaluation anxiety is
an important component of test anxiety. Zoller and Ben-Chaim also found that finals were more anxiety
producing than midterms, presumably because they were perceived to be of greater importance in the
students' final grade.
Weber, McBee, & Krebs (1983) studied anxiety, performance, and tendency to cheat in take-
home, open book (in class), and closed book (in class) examinations in college undergraduates. They
found that 3/4 of the students worried more before taking a closed book exam and stated that, overall,
students spent "considerably (four to seven times as much) more time worrying, preparing, and
memorizing for closed book tests than for the other two types" (p. 48 1 ). Students also were certain that the
26
content of the closed book exam was more difficult than that of the open book exam, when in fact all three
of the different exam types were matched to be of identical difficulty; again indicating that closed book
exams were more anxiety producing. Weber et al. were understandably concerned about the possibility of
cheating on the take-home exam, and investigated this (albeit indirectly) by statistically investigating the
probability of similar response items for pairs of students. Using this method, they found very little
evidence of cheating, and concluded that this was not a major problem in take-home testing.
In summary the results of Zoller & Ben-Chaim (1988) and Weber et al. (1983) support the use of
take-home testing as a way to reduce test anxiety and facilitate performance.
Untimed Testing
Time urgency, another factor found by Zoller and Ben-Chaim (1988) to contribute to test anxiety,
has also been investigated by several other researchers. Friend (1982) investigated the effects of time
urgency, subjective workload, and state anxiety on test performance in adults taking a management-
training seminar. Friend found that the most significant correlation between all of his variables was a
positive one between time urgency and level of test anxiety. Madsen & Murray (1984), in their qualitative
investigation of test anxiety in adolescent and adult ESL students, found that the stressor most frequently
mentioned by high anxiety students was awareness of time constraints; this was the case for both the
graduate and pre-college students.
In summary, time constraints appear to be an important aspect of examination conditions that
contribute to students' test anxiety levels.
Scheduled and Unscheduled (Surprise) Testing
Another aspect of testing conditions which may contribute to test anxiety in students is surprise or
unscheduled testing. It seems intuitively obvious that a class designed with "pop" quizzes as part of the
assessment structure would be more anxiety producing than a class where all assessments are announced in
advance, and there is empirical evidence to support this. Saigh (1985) compared the effects of unscheduled
vs. scheduled assessment on test anxiety in two undergraduate human development courses. Saigh found
that at the end of a five week period, students in the class with unscheduled assessments scored
significantly higher on measures of situation specific anxiety, but not on measures of trait anxiety,
27
indicating that the unscheduled assessments were more anxiety producing for that situation, but did not
increase the overall traif anxiety of the students. It was also found that the content of students' course
evaluations was significantly more negative in every instance in the class with unscheduled testing
conditions.
In summary, it appears that unscheduled or "pop" quizzes/exams significantly increase the anxiety
of students and contribute to an overall negative impression of a class.
Frequency of Testing
An issue related to the scheduling of exams is that of how often testing is conducted. Marso
(1970) investigated the effects of more frequent testing and immediate feedback (giving out answer sheets
after the test) on the performance of high and low anxiety undergraduates in four educational psychology
classes. Although Marso found that all students performed better in the more frequent testing condition and
in the feedback condition, he did not find the expected differences in performance between high and low
test anxious students. Unfortunately the focus of Marso's study was primarily performance, so it is difficuh
to be sure of the effects of the differential testing procedures on anxiety itself Based on a questionnaire
given to the participants at the culmination of the study, however, Marso did find that high anxiety students
favored the more frequent testing procedures significantly more strongly than did low anxiety students,
suggesting that this procedure did mitigate anxiety for high anxiety these subjects.
Hembree (1988) in a meta-analysis of three studies dealing with the effects of more frequent
testing on performance in high and low anxiety students found that "high test anxiety students appeared to
be better served by more frequent testing, but the mean effect (0.36) was not significant. Adjusting the
frequency of tests did not effect the low test anxious subjects" (p. 65). The implication that more frequent
testing may lower levels of test anxiety is also strengthened by Zoller & Ben-Chaim's (1989) finding that
state anxiety levels were higher for finals than they were for midterms in undergraduate science students.
Students perceive finals to be of higher weight in determining the final course grade, and hence the
consequences for success or failure are greater. Relating this to exam frequency, it seems likely that the
fewer exams a course has, the greater the consequences of each exam on the final grade are, hence the
more anxiety producing each exam is likely to be, but this has yet to be investigated specifically.
28
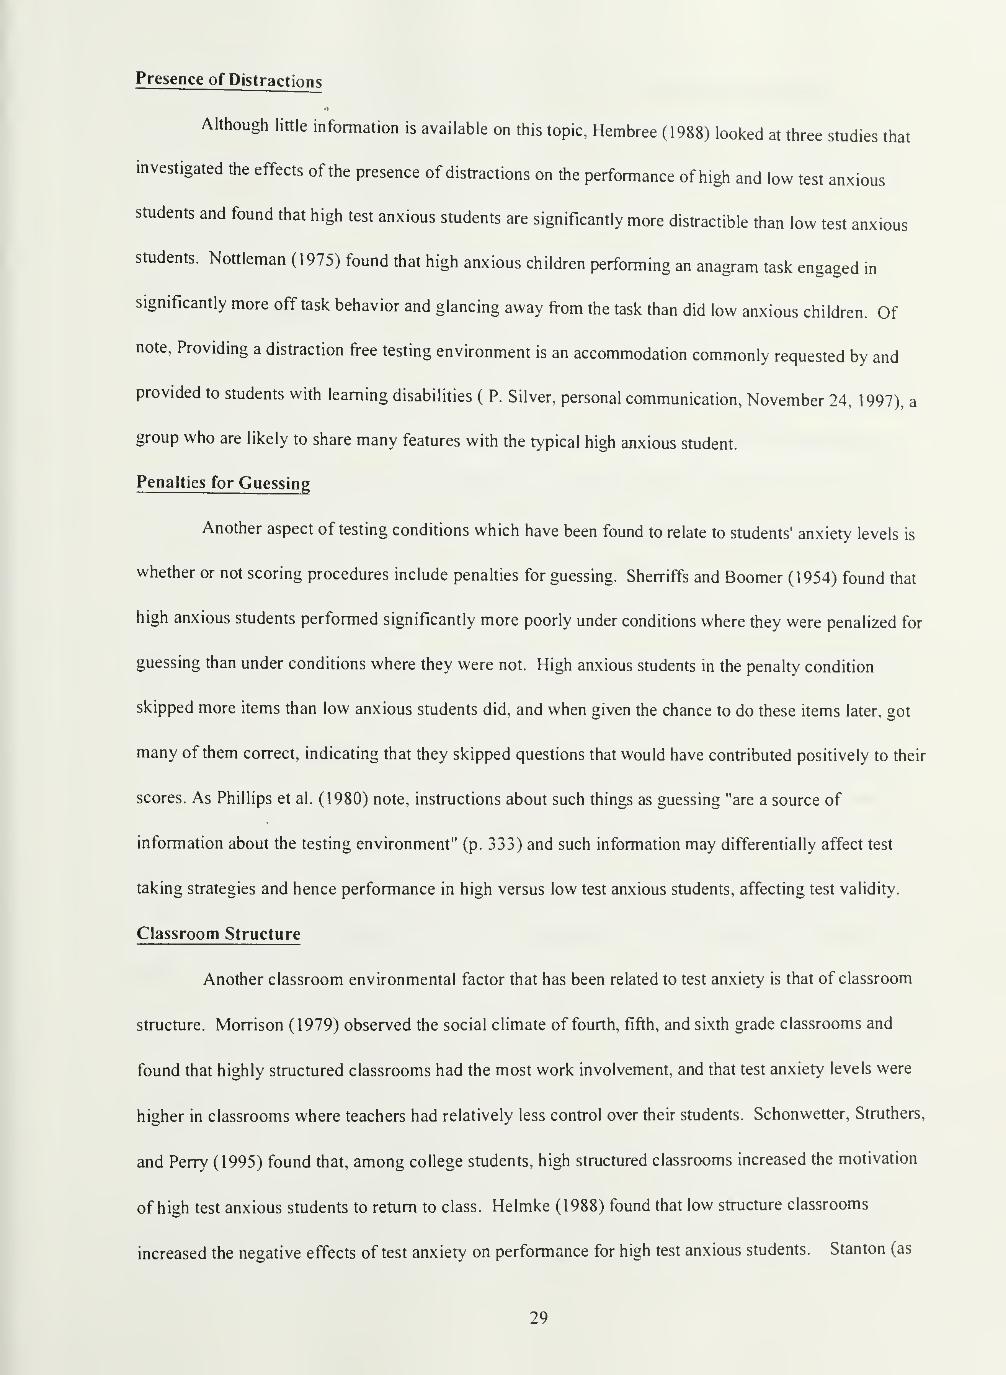
Presence of Distractions
Although little information is available on this topic, Hembree (1988) looked at three studies that
investigated the effects of the presence of distractions on the performance of high and low test anxious
students and found that high test anxious students are significantly more distractible than low test anxious
students. Nonleman (1975) found that high anxious children performing an anagram task engaged in
significantly more off task behavior and glancing away from the task than did low anxious children. Of
note, Providing a distraction free testing environment is an accommodation commonly requested by and
provided to students with learning disabilities ( P. Silver, personal communication, November 24, 1997), a
group who are likely to share many features with the typical high anxious student.
Penalties for Guessing
Another aspect of testing conditions which have been found to relate to students' anxiety levels is
whether or not scoring procedures include penalties for guessing. Shenriffs and Boomer (1954) found that
high anxious students performed significantly more poorly under conditions where they were penalized for
guessing than under conditions where they were not. High anxious students in the penalty condition
skipped more items than low anxious students did, and when given the chance to do these items later, got
many of them correct, indicating that they skipped questions that would have contributed positively to their
scores. As Phillips et al. (1980) note, instructions about such things as guessing "are a source of
information about the testing environment" (p. 333) and such information may differentially affect test
taking strategies and hence performance in high versus low test anxious students, affecting test validity.
Classroom Structure
Another classroom environmental factor that has been related to test anxiety is that of classroom
structure. Morrison (1979) observed the social climate of fourth, fifth, and sixth grade classrooms and
found that highly structured classrooms had the most work involvement, and that test anxiety levels were
higher in classrooms where teachers had relatively less control over their students. Schonwetter, Struthers,
and Perry (1995) found that, among college students, high structured classrooms increased the motivation
of high test anxious students to return to class. Helmke (1988) found that low structure classrooms
increased the negative effects of test anxiety on performance for high test anxious students. Stanton (as
29
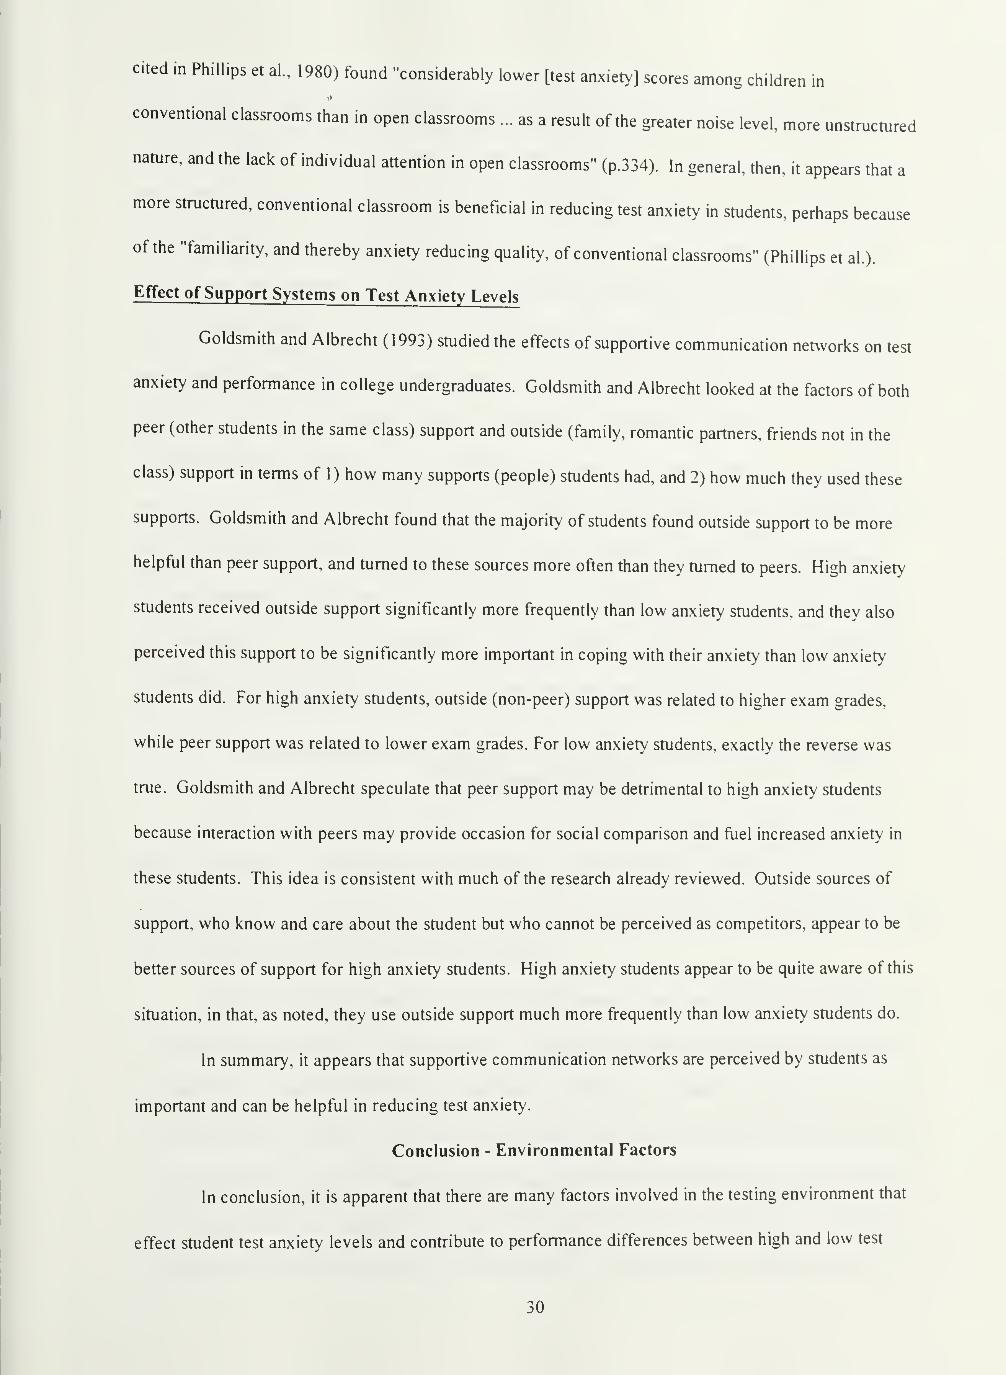
cited in Phillips et al., 1980) found "considerably lower [test anxiety] scores among children in
conventional classrooms than in open classrooms ... as a result of the greater noise level, more unstructured
nature, and the lack of individual attention in open classrooms" (p.334). In general, then, it appears that a
more structured, conventional classroom is beneficial in reducing test anxiety in students, perhaps because
of the "familiarity, and thereby anxiety reducing quality, of conventional classrooms" (Phillips et al.).
Effect of Support Systems on Test Anxiety Levels
Goldsmith and Albrecht (1993) studied the effects of supportive communication networks on test
anxiety and performance in college undergraduates. Goldsmith and Albrecht looked at the factors of both
peer (other students in the same class) support and outside (family, romantic partners, friends not in the
class) support in terms of 1) how many supports (people) students had, and 2) how much they used these
supports. Goldsmith and Albrecht found that the majority of students found outside support to be more
helpful than peer support, and turned to these sources more often than they turned to peers. High anxiety
students received outside support significantly more frequently than low anxiety students, and they also
perceived this support to be significantly more important in coping with their anxiety than low anxiety
students did. For high anxiety students, outside (non-peer) support was related to higher exam grades,
while peer support was related to lower exam grades. For low anxiety students, exactly the reverse was
true. Goldsmith and Albrecht speculate that peer support may be detrimental to high anxiety students
because interaction with peers may provide occasion for social comparison and fuel increased anxiety in
these students. This idea is consistent with much of the research already reviewed. Outside sources of
support, who know and care about the student but who cannot be perceived as competitors, appear to be
better sources of support for high anxiety students. High anxiety students appear to be quite aware of this
situation, in that, as noted, they use outside support much more frequently than low anxiety students do.
In summary, it appears that supportive communication networks are perceived by students as
important and can be helpful in reducing test anxiety.
Conclusion - Environmental Factors
In conclusion, it is apparent that there are many factors involved in the testing environment that
effect student test anxiety levels and contribute to performance differences between high and low test
30
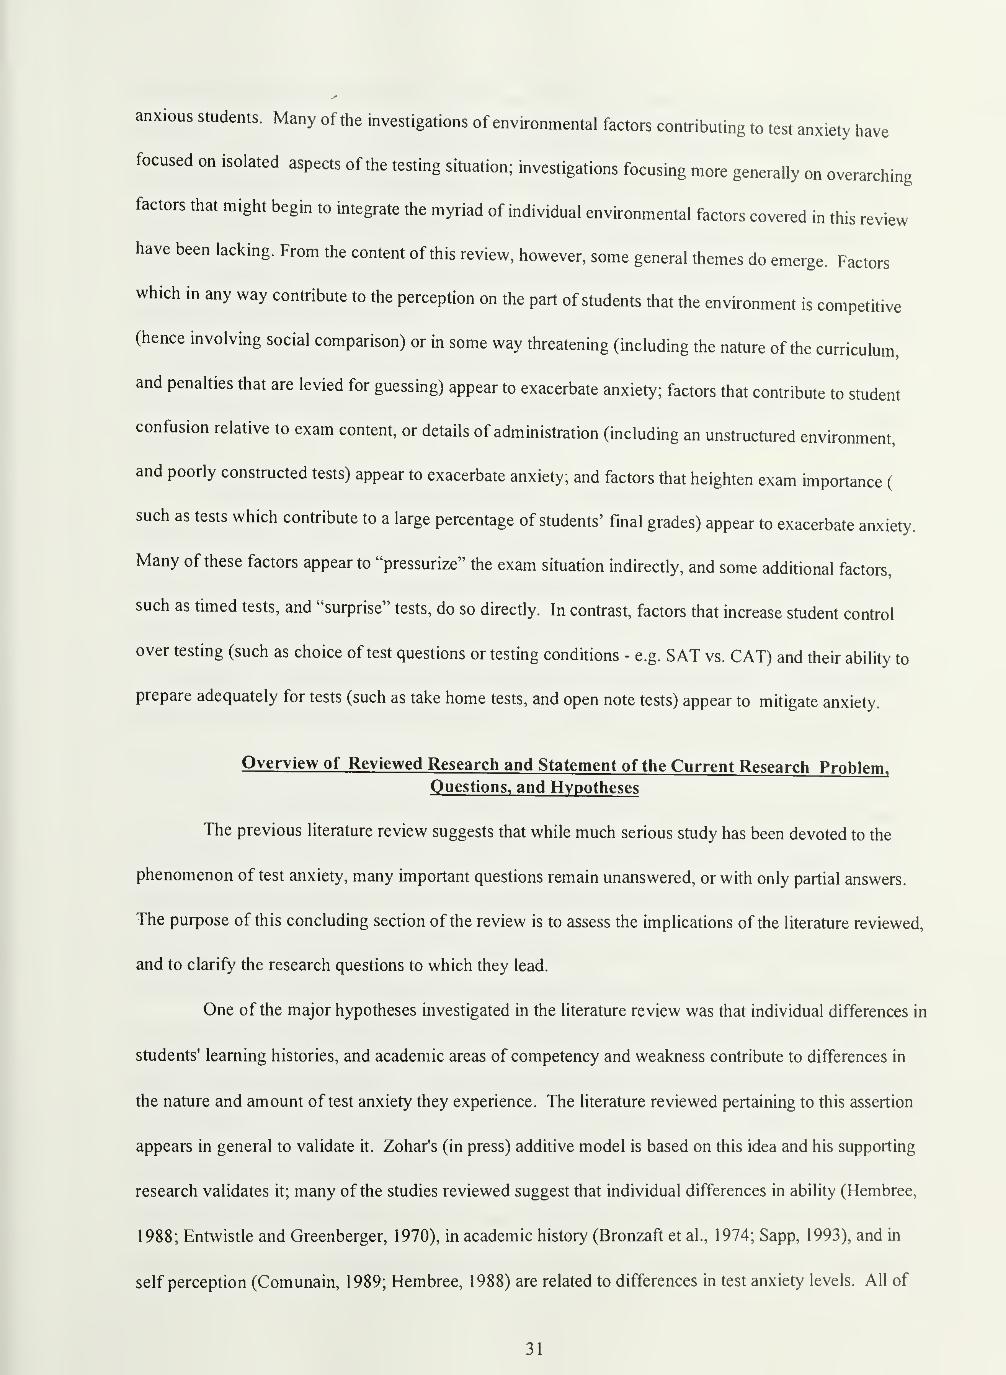
anxious students. Many of the investigations of environmental factors contributing to test anxiety have
focused on isolated aspects of the testing situation; investigations focusing more generally on overarching
factors that might begin to integrate the myriad of individual enviromnental factors covered in this review
have been lacking. From the content of this review, however, some general themes do emerge. Factors
which in any way contribute to the perception on the part of students that the environment is competitive
(hence involving social comparison) or in some way threatening (including the nature of the curriculum,
and penalties that are levied for guessing) appear to exacerbate anxiety; factors that contribute to student
confusion relative to exam content, or details of administration (including an unstructured environment,
and poorly constructed tests) appear to exacerbate anxiety; and factors that heighten exam importance (
such as tests which contribute to a large percentage of students' final grades) appear to exacerbate anxiety.
Many of these factors appear to "pressurize" the exam situation indirectly, and some additional factors,
such as timed tests, and "surprise" tests, do so directly. In contrast, factors that increase student control
over testing (such as choice of test questions or testing conditions - e.g. SAT vs. CAT) and their ability to
prepare adequately for tests (such as take home tests, and open note tests) appear to mitigate anxiety.
Overview of Reviewed Research and Statement of the Current Research Problem.Questions, and Hypotheses
The previous literature review suggests that while much serious study has been devoted to the
phenomenon of test anxiety, many important questions remain unanswered, or with only partial answers.
The purpose of this concludmg section of the review is to assess the implications of the literature reviewed,
and to clarify the research questions to which they lead.
One of the major hypotheses investigated in the literature review was that individual differences in
students' learning histories, and academic areas of competency and weakness contribute to differences in
the nature and amount of test anxiety they experience. The literature reviewed pertaining to this assertion
appears in general to validate it. Zohar's (in press) additive model is based on this idea and his supporting
research validates it; many of the studies reviewed suggest that individual differences in ability (Hembree,
1988; Entwistle and Greenberger, 1970), in academic history (Bronzaft et al., 1974; Sapp, 1993), and in
self perception (Comunain, 1989; Hembree, 1988) are related to differences in test anxiety levels. All of
31
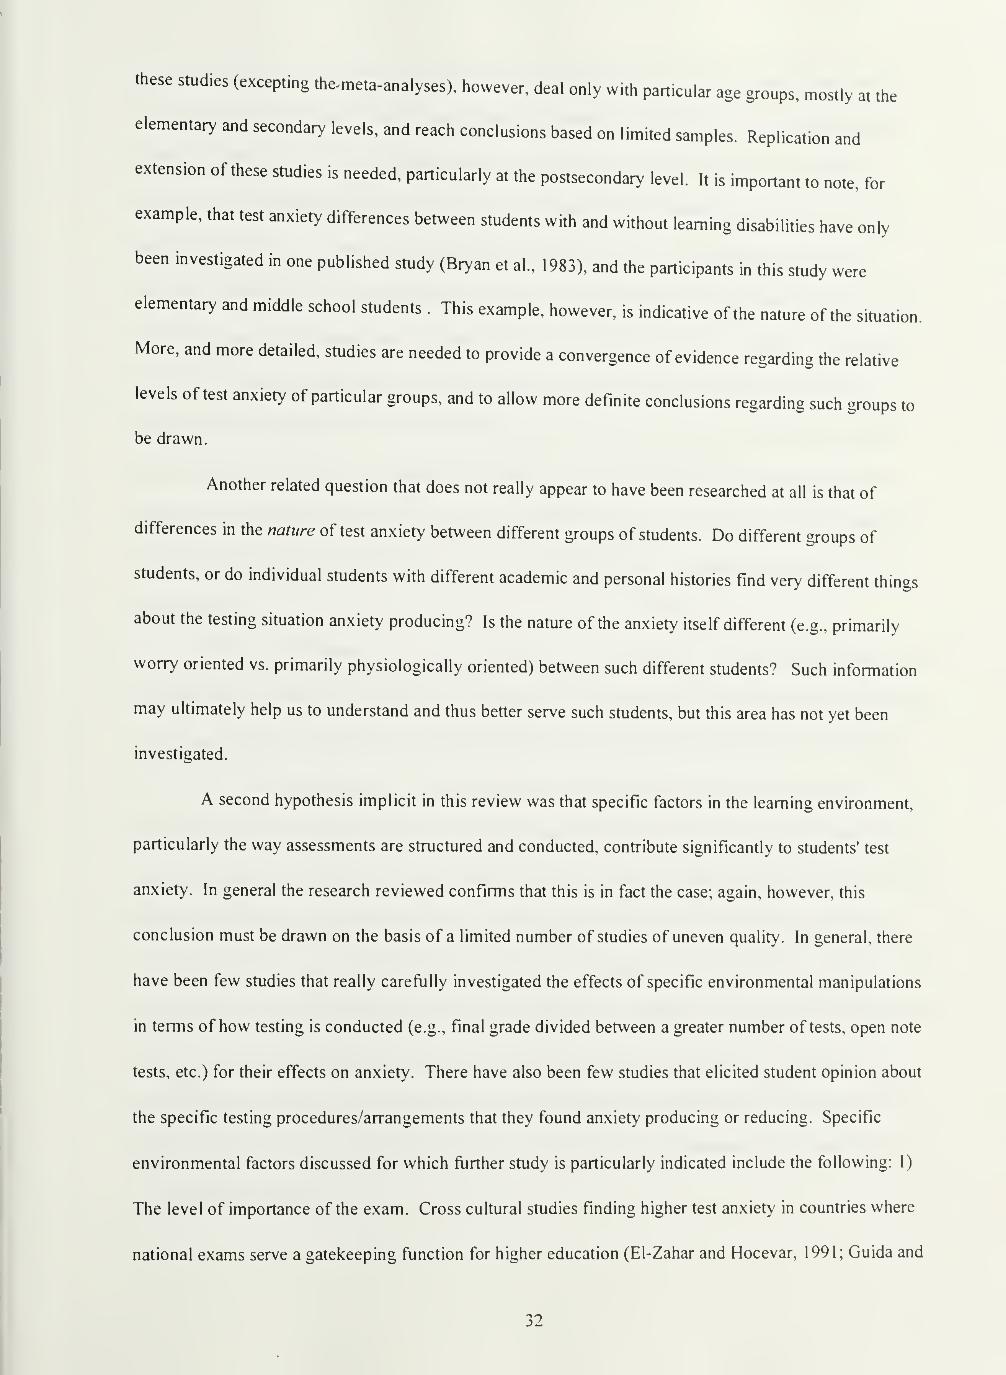
these studies (excepting the-meta-analyses), however, deal only with particular age groups, mostly at the
elementary and secondary levels, and reach conclusions based on limited samples. Replication and
extension of these studies is needed, particularly at the postsecondary level. It is important to note, for
example, that test anxiety differences between students with and without learning disabilities have only
been investigated in one published study (Bryan et a!., 1983), and the participants in this study were
elementary and middle school students. This example, however, is indicative of the nature of the situation.
More, and more detailed, studies are needed to provide a convergence of evidence regarding the relative
levels of test anxiety of particular groups, and to allow more definite conclusions regarding such groups to
be drawn.
Another related question that does not really appear to have been researched at all is that of
differences in the nature of test anxiety between different groups of students. Do different groups of
students, or do individual students with different academic and personal histories find very different things
about the testing situation anxiety producing? Is the nature of the anxiety itself different (e.g., primarily
worry oriented vs. primarily physiologically oriented) between such different students? Such information
may ultimately help us to understand and thus better serve such students, but this area has not yet been
investigated.
A second hypothesis implicit in this review was that specific factors in the learning environment,
particularly the way assessments are structured and conducted, contribute significantly to students' test
anxiety. In general the research reviewed confirms that this is in fact the case; again, however, this
conclusion must be drawn on the basis of a limited number of studies of uneven quality. In general, there
have been few studies that really carefully investigated the effects of specific environmental manipulations
in terms of how testing is conducted (e.g., final grade divided between a greater number of tests, open note
tests, etc.) for their effects on anxiety. There have also been few studies that elicited student opinion about
the specific testing procedures/arrangements that they found anxiety producing or reducing. Specific
environmental factors discussed for which further study is particularly indicated include the following: 1)
The level of importance of the exam. Cross cultural studies finding higher test anxiety in countries where
national exams serve a gatekeeping function for higher education (El-Zahar and Hocevar, 1991; Guida and
32
Ludlow, 1989) point to this as an important factor effecting test anxiety, as do the findings that finals are
viewed as more anxiety producing than any other type of exam (Zoller and Ben-Chaim, 1988), but little
research directed specifically at this phenomenon has been done. 2) The effects of increasing student
control over the testing environment. The work on computer and self adapted testing (Wise et al., 1993)
suggests that this is an important way to decrease test anxiety. Further investigation of the effects of
increased student control over testing, and how it can best be implemented, is indicated. 3) The effects of
untimed testing on test anxiety levels. Students report time pressure as a major contributor to test anxiety
(Friend, 1982; Madsen and Murray, 1984), but little research has been done on untimed testing as an
intervention for the test anxious. 4) The effects of providing a support system for students to help them
deal with their anxiety issues. Goldsmith and Albrecht's 1993 study suggests that support systems are
helpful to the test anxious student, however this was informal support. The effects of formal support as a
part of the students' environment (as opposed to as a prescribed intervention) have not yet been
investigated.
Finally, it is important to note that one of the main contentions of this author is that test anxiety is
problematic for students both in terms of how it effects performance as well as in terms of its function as an
unpleasant affective experience that may have important consequences for later academic decisions and
behavior. Given this belief, one of the major and generalized problems with much of the research
concerning test anxiety is that it tends to focus exclusively on the performance aspect of test anxiety and to
ignore its emotional effects. The affective experience of test anxiety is important in its own right, and may
have other important long-term effects. For example, it is possible that some individuals may find the
experience of test anxiety so unpleasant that they may avoid situations where they will have to deal with it
(e.g., test oriented subjects like the sciences and mathematics). This effect is suggested by the findings of
Strom et al. (1987) that high levels of test anxiety correlate negatively with measures of preference for
course difficulty. Hence, even though anxiety may not affect performance directly in some cases, it may
affect academic choices, and may affect progress in other ways as yet undiscovered. This possibility has
yet to be investigated.
33
Statement of the Problem
The primary intent of this study was to investigate differences in beUefs about, reactions to, and
perceived control over testing at the postsecondary level between students with and without learning
disabilities. Additionally, the effect of testing accommodations and support services provided speciiically
to students with learning disabilities on their beliefs about, reactions to, and perceived control over testing
was also investigated. This study was designed to address some of the most salient questions posed by the
above review of the literature. Its goals were the following: 1) To more definitively resolve the question
of whether students with learning disabilities experience higher levels of test anxiety than their non
learning disabled peers. 2) To investigate the effects of a history of academic diftlculties on the test
anxiety levels of students at the postsecondary level, using students with learning disabilities as an
exemplar of a group generally united by such a common history. 3) To investigate the question of whether
or not groups of students with different academic histories find different aspects of the testing environment
anxiety producing, and if such different groups experience different manifestations of anxiety. As
previously noted, it was hoped that this information would ultimately prove useful in working with
different types of students around anxiety issues. 4) To revisit the concept of perceived control, and look at
whether or not students who believe they have more control over their test situation in fact experience
lower levels of test anxiety than students who do not, as well as the degree to which control over testing is
perceived as desirable and helpful by highly anxious students. 5) Related to issues of control over the test
situation, this study was designed to assess the usefulness of testing accommodations for alleviating test
anxiety in learning disabled students, and thus provide the important beginnings of an answer to the
question of whether or not environmental manipulations related to the test situation may be useful as a way
of intervening in the problem of test anxiety. 6) A final goal was to investigate the possible long term
consequences of the affective effects of test anxiety, such as avoidance of particular areas of study, and to
investigate whether or not there were differences in such consequences between students with and without
learning disabilities.
34
Specific Research Questions and Corresponding Hypotheses
Given the above areas of interest, the following specific research questions were indicated. Each
question is followed by the specific directional hypothesis(es) developed to investigate the question in the
context of the current study.
1.
Are there differences in the level and nature of test anxiety between students with and without leamin"
disabilities at the postsecondary level, and if so, are these differences effected by the use of testing
accommodations by students with learning disabilities?
Hypothesis 1; Postsecondary students with learning disabilities will show significantly higher
levels of test anxiety than their non learning disabled peers, and the differences in anxiety levels between
the two groups will increase significantly in this direction when the effects of the use of testing
accommodations by the students with learning disabilities is considered.
Hypothesis 2: Postsecondary students with and without learning disabilities will differ
significantly on the dimensions of test anxiety (e.g., worry, tension, bodily symptoms, test irrelevant
thoughts) that are most salient for them.
2. Are there differences between postsecondary students with and without learning disabilities in terms of
the specific aspects of the testing situation that are found to be anxiety producing?
Hypothesis 3: Postsecondary students with and without learning disabilities will differ
significantly in their rating of how anxiety producing they find particular testing conditions or aspects of
the testing situation to be; for example, students with learning disabilities may find confusing and
disorganized exam administrations more anxiety producing than do their non learning disabled peers.
3. Do postsecondary students with and without learning disabilities differ in the types of modifications to
the testing situation that they would find most helpful in reducing anxiety?
Hypothesis 4: Postsecondary students with and without learning disabilities will differ
significantly in their ratings of how desirable they would find particular modifications to the testing
environment to be; for example, learning disabled students may find choice of test format a more desirable
accommodation than their non learning disabled peers.
35
4. Is the nature of a student',s learning disability (e.g., language, auditory processing, visual processing,
mathematics) related to the curriculum areas where they find testing to be the most anxiety producing
at the postsecondary level?
Hypothesis 5: Differences in postsecondary students with learning disabilities' anxiety levels for
testing in different subject areas will be related to the specific nature of their learning disability; for
example, students with language disabilities will be more anxious about testing in foreign language classes.
5. What is the relationship between testing accommodations, perceived control, and test anxiety?
Hypothesis 6: Higher levels of perceived control over testing and grading will correlate negatively
with test anxiety at the postsecondary level.
Hypothesis 7: The degree to which postsecondary students with learning disabilities utilize test
accommodations/support services will correlate positively with the level of control they perceive they have
over testing,
Hypothesis 8: The degree to which postsecondary students with leaning disabilities utilize testing
accommodations/support services will correlate negatively with test anxiety.
6. Are high levels of test anxiety differentially associated with the avoidance of particular classes or
fields of study known to be testing intensive between postsecondary students with and without learning
disabilities?
Hypothesis 9: High levels of test anxiety will be correlated significantly with reported avoidance
of testing intensive classes or major areas at the postsecondary level. This relationship will be significantly
more powerful for students with learning disabilities than for their non learning disabled peers.
Hypothesis 10: There will be a significant relationship between test anxiety level and academic
major choice at the postsecondary level, with higher levels of test anxiety associated with non testing
intensive majors (e.g., humanities) and lower levels of test anxiety associated with testing intensive majors
(e.g., mathematics and physical/biological sciences). This relationship will be significantly more powerful
for students with learning disabilities than for their non learning disabled peers.
All analyses also considered the effects of salient demographs (e.g., gender).
36
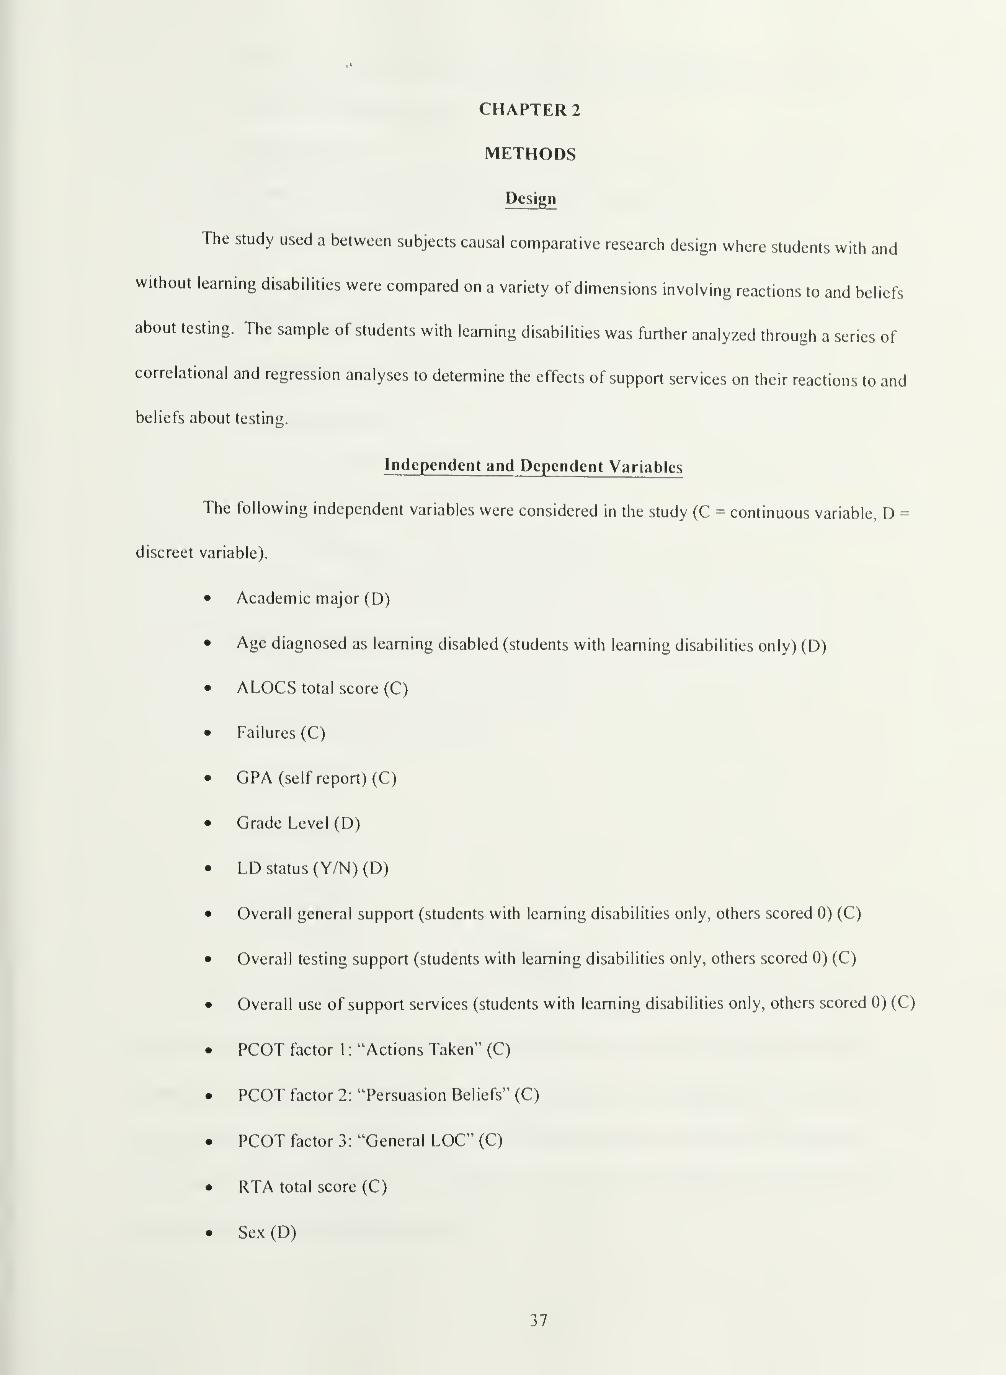
CHAPTER 2
METHODS
Design
The study used a between subjects causal comparative research design where students with and
without learning disabilities were compared on a variety of dimensions involving reactions to and beliefs
about testing. The sample of students with learning disabilities was further analyzed through a series of
correlational and regression analyses to determine the effects of support services on their reactions to and
beliefs about testing.
Independent and Dependent Variables
The following independent variables were considered in the study (C = continuous variable, D =
discreet variable).
• Academic major (D)
• Age diagnosed as learning disabled (students with learning disabilities only) (D)
• ALOCS total score (C)
• Failures (C)
• CPA (self report) (C)
• Grade Level (D)
• LD status (Y/N) (D)
• Overall general support (students with learning disabilities only, others scored 0) (C)
• Overall testing support (students with learning disabilities only, others scored 0) (C)
• Overall use of support services (students with learning disabilities only, others scored 0) (C)
• PCOT factor I : "Actions Taken" (C)
• PCOT factor 2: "Persuasion Beliefs" (C)
• PCOT factor 3 : "General LOC" (C)
• RTA total score (C)
• Sex (D)
37
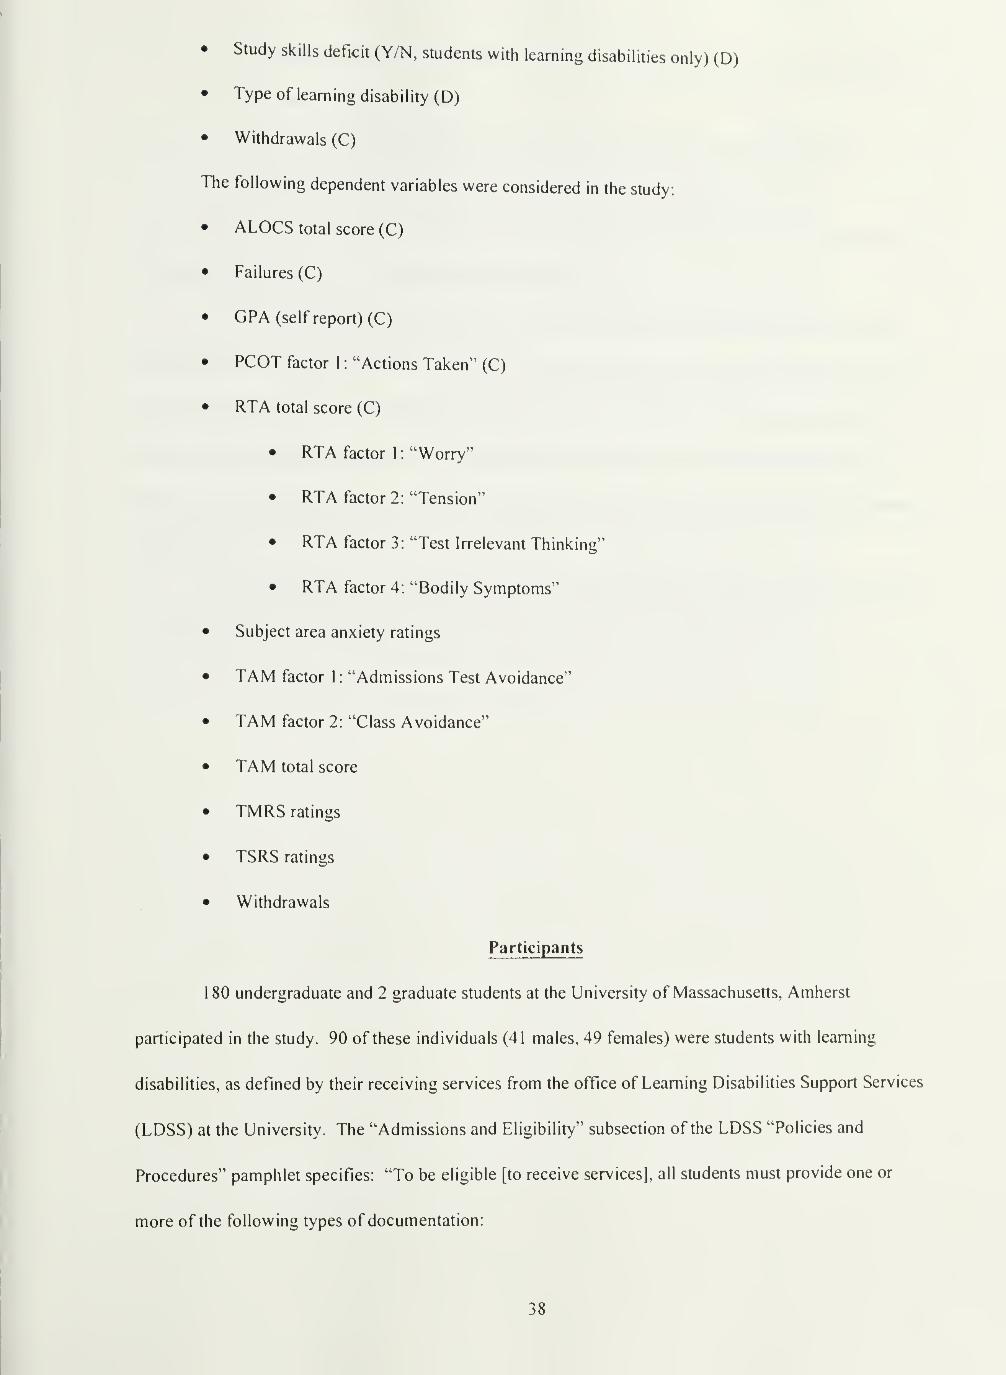
• Study skills deficit (Y/N, students with learning disabilities only) (D)
• Type of learning disability (D)
• Withdrawals (C)
The following dependent variables were considered in the study:
• ALOCS total score (C)
• Failures (C)
• CPA (self report) (C)
• PCOT factor 1 : "Actions Taken^' (C)
• RTA total score (C)
• RTA factor 1: "Worry"
• RTA factor 2: "Tension"
• RTA factor 3: "Test Irrelevant Thinking"
• RTA factor 4: "Bodily Symptoms"
• Subject area anxiety ratings
• TAM factor 1 : "Admissions Test Avoidance"
• TAM factor 2: "Class Avoidance"
• TAM total score
• TMRS ratings
• TSRS ratings
• Withdrawals
Participants
180 undergraduate and 2 graduate students at the University of Massachusetts, Amherst
participated in the study. 90 of these individuals (41 males, 49 females) were students with learning
disabilities, as defined by their receiving services from the office of Learning Disabilities Support Services
(LOSS) at the University. The "Admissions and Eligibility" subsection of the LOSS "Policies and
Procedures" pamphlet specifies: "To be eligible [to receive services], all students must provide one or
more of the following types of documentation:
38
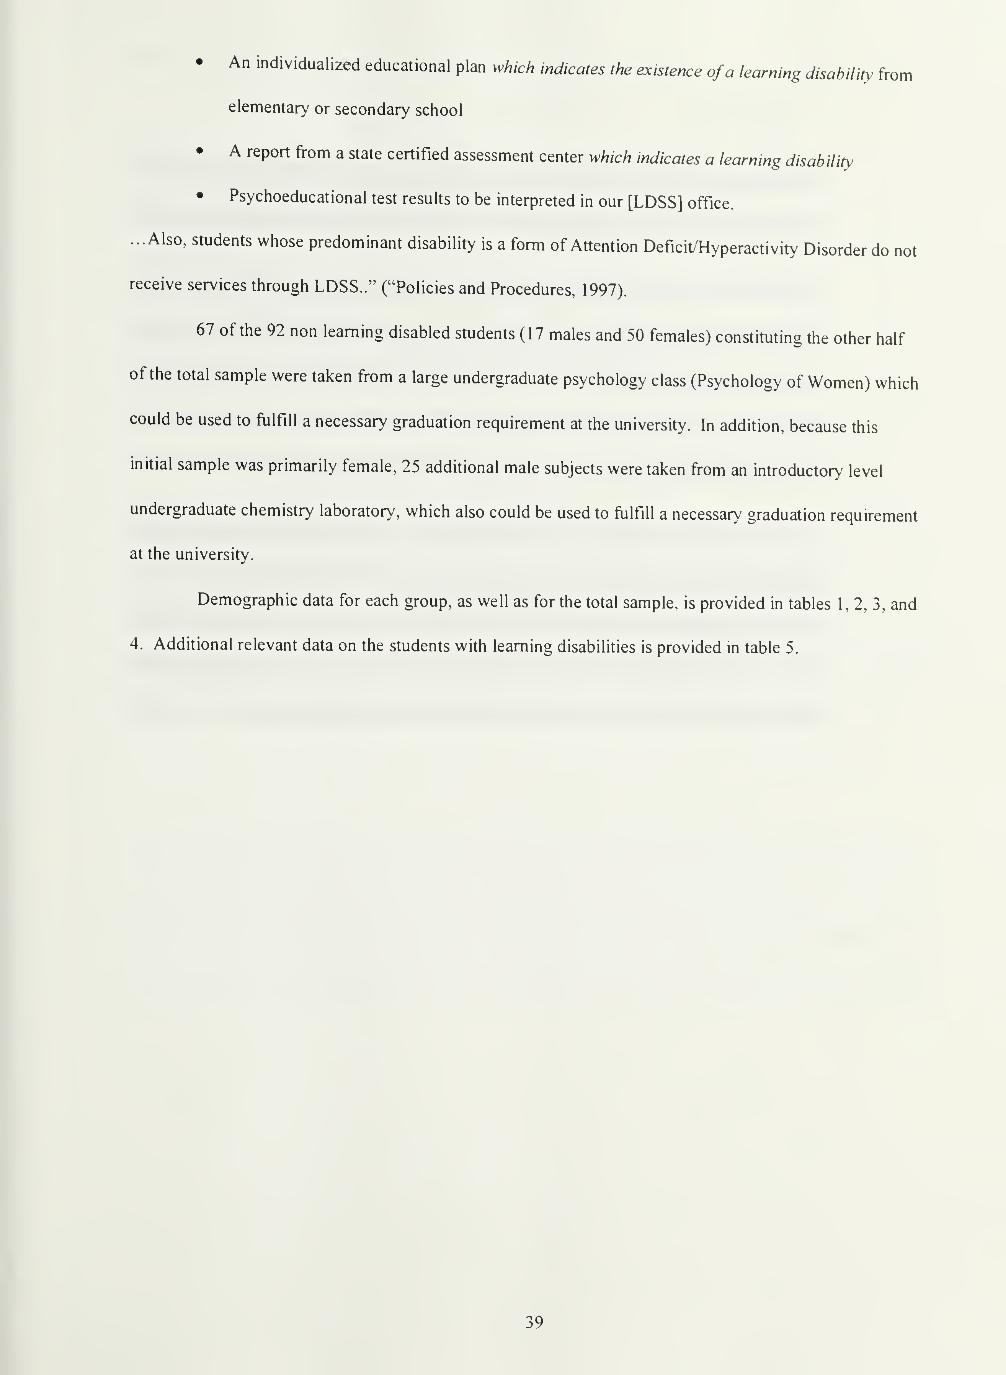
• An individualized educational plan which indicates the existence ofa learning disability from
elementary or secondary school
• A report from a state certified assessment center which indicates a learning disability
• Psychoeducational test results to be interpreted in our [LOSS] office.
...Also, students whose predominant disability is a form of Attention Deficitmyperactivity Disorder do not
receive services through LOSS.." ("Policies and Procedures, 1997).
67 of the 92 non learning disabled students (17 males and 50 females) constituting the other half
of the total sample were taken from a large undergraduate psychology class (Psychology of Women) which
could be used to fulfill a necessary graduation requirement at the university. In addition, because this
initial sample was primarily female, 25 additional male subjects were taken from an introductory level
undergraduate chemistry laboratory, which also could be used to ftilfiU a necessary graduation requirement
at the university.
Demographic data for each group, as well as for the total sample, is provided in tables 1, 2, 3, and
4. Additional relevant data on the students with learning disabilities is provided in table 5.
39
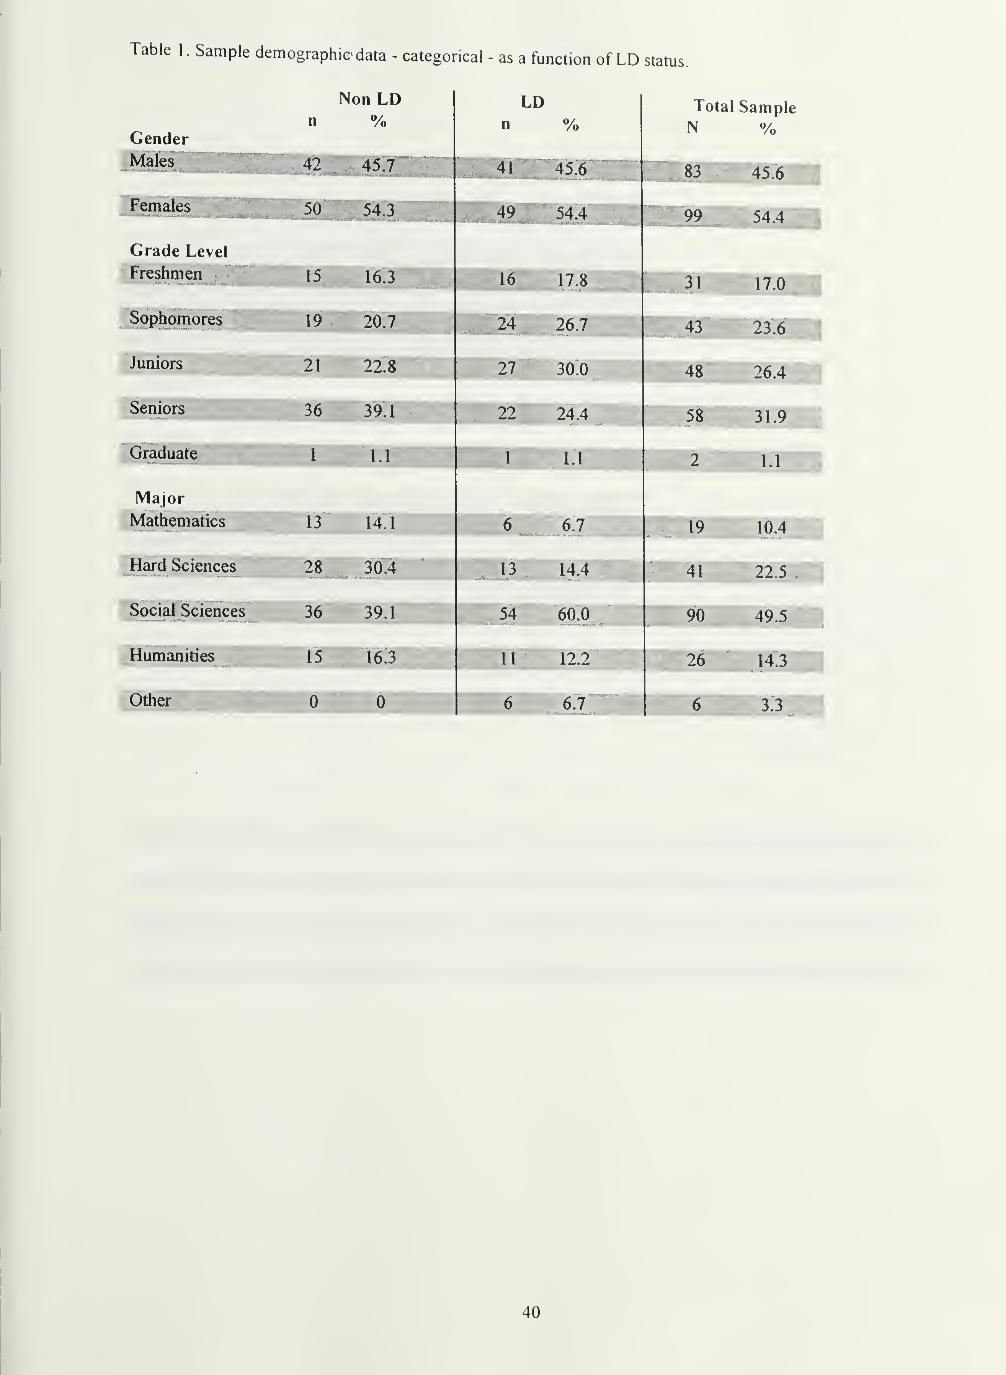
.Sample demographic data - categorical - as a function of LD status.
Non LDn %
Gender
Males 42 45,7
FeZitialosA^SBBIHfilBIII^ 50 54 3
Grade Level
LDn %
41 45.6
49 54.4
Total SampleN o/o
83 45.6
99 54.4
Freshmen 15 16.3 31 17.0
Sophomores""^' ""19 20.7
^"24 26.7 43 23.6
Juniors 21 22.8 27 30:0 '
26.4
Seniors 36 39.1 22 24.4 58 31.9
Graduate I l.i 1 1.1 2 1.1
Major
Mathematics 13 14.1 6 6.7 19 10.4
Hard Sciences 28 30.4 13 14.4 41 22.5
Social Sciences " ^ 36 39.1 54 60.0 90 49.5
Humanities 15 16.3 11 12.2 26 14.3
Other 0 0 6 6.7 6 3.3
40
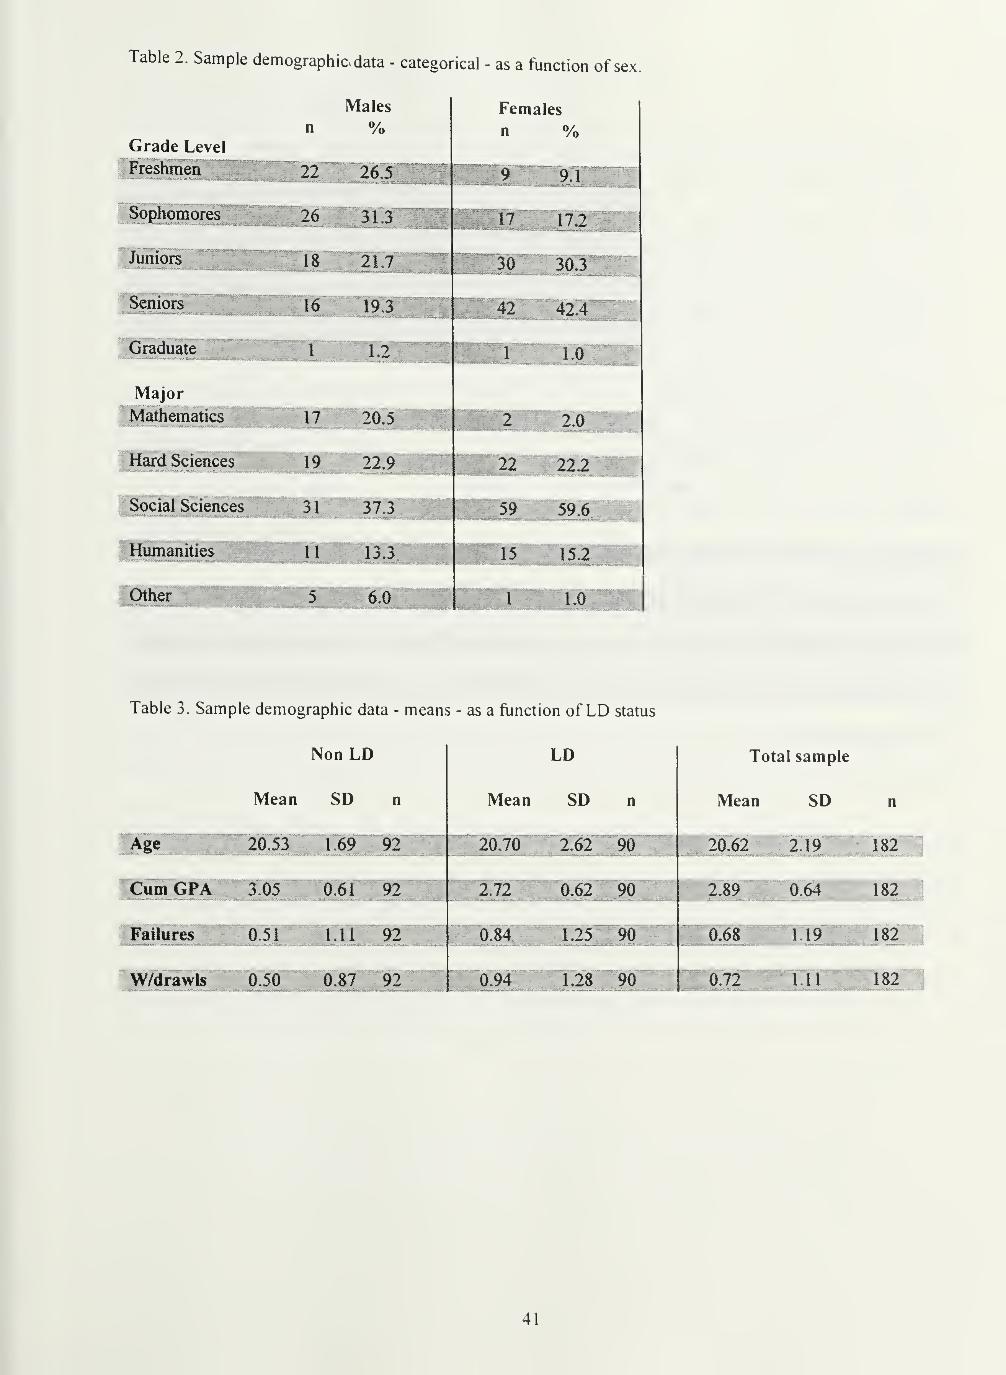
2. Sample demographic, data - categorical - as a function of sex.
Males
n %Grade Level
J Freshmen 22 26,5
Females
n %
7.1
Sophomores 26 3 1 .3 17 17
^ Jum'ors 18 2L7 30 30 3
Seniors 16 19.3 42 42,4
Graduate V [ 1 12 _1 1.0
Major
Mathematics 17 IXi^'"'^'^^"''^'' 2 2.0
Hard Sciences 19 22.9 22 22.2^
Social Sciences 31 373 59 59.6
Humanities 11 13.3
Other 5 6.0 1 1.0
Table 3. Sample demographic data - means - as a function of LD status
Non LD
Mean SD n
LD
Mean SD n
Total sample
Mean SD n
IH 20.53 1.69 92 20.70 2.62 90 20.62 2.19 182
Cum GPA 3.05 0.61 92 2.72 0.62 90 2.89 0.64 182
Failures 0.51 1.11 92 0.84 1.25 90 0.68 1.19 182
W/drawls 0.50 0.87 92 0.94 1.28 90 0.72 1.11 182
41
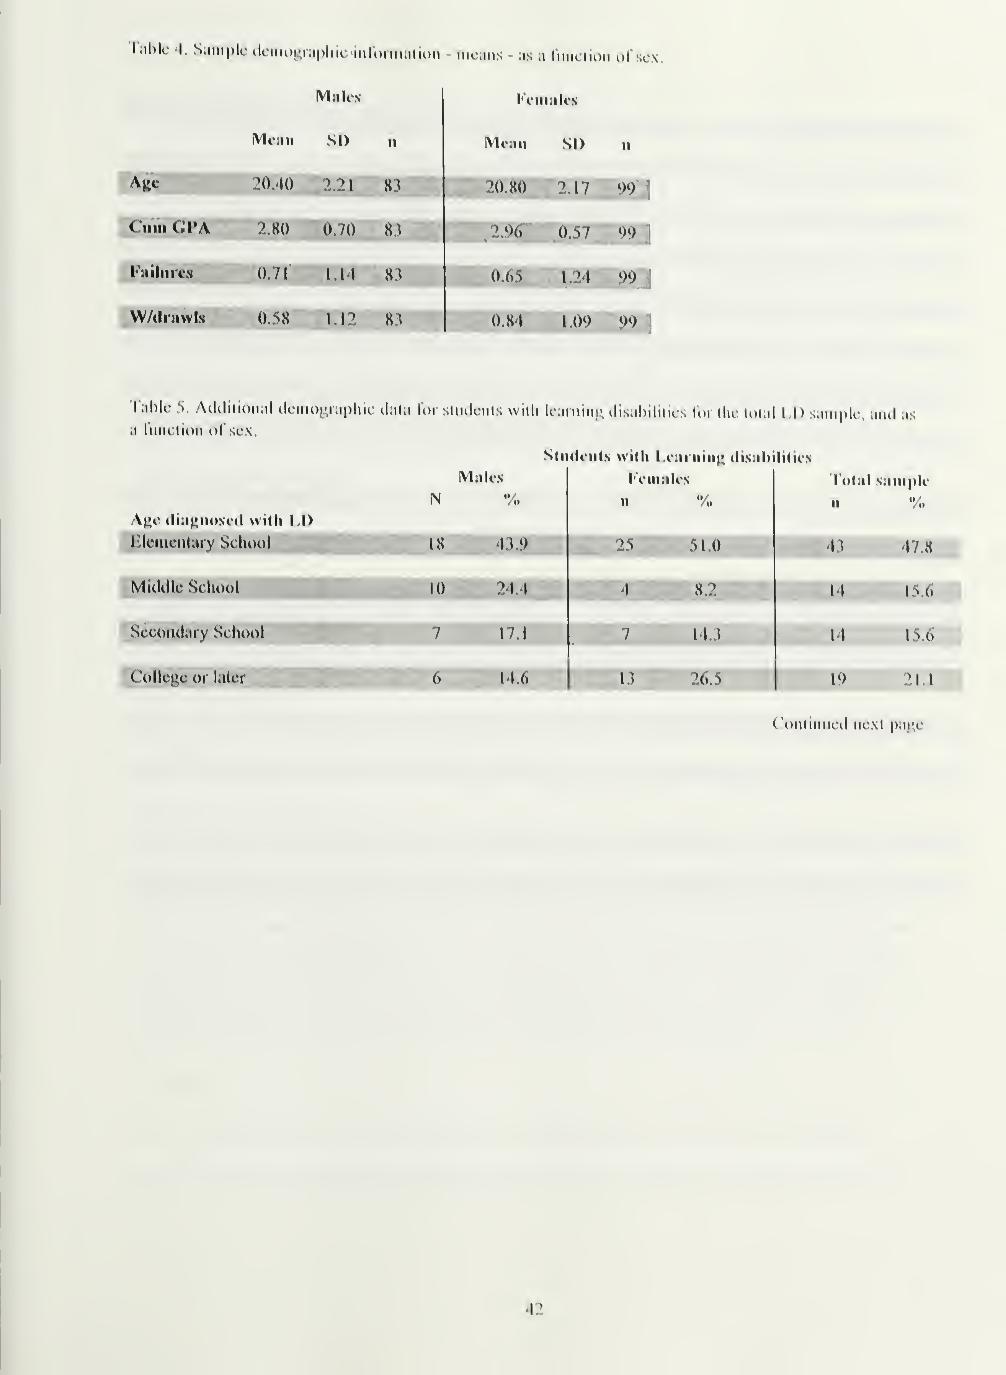
S;unplc iltMiuHuapluc-infoimatioii means - as a (unction ol'sex.
Miilcs
IVIiiiii Sl> II
I'VllllllfN
Mfiiii SI) II
L^jjc 20.40 2.21 83 20 80 2.17 «)*)
Cum CPA 2.K() 0.70 2.% 0.57 ')«)
failures 0.71 1.14 8\ 0.6S 1.24 w;
WAIniwh 0.58 1.1? 8^ 0.84 1.00 00 '
Table S, AiKliliuiial dcniDr.iaplm ilala lor slmU-nls wilh leaminir ilisahililies for (lu- h>lal I D san^ple. aiul as
a lunclion of sex.
Shuleiils willi I ,earning disnbilities
IVIiiUn
N %A{>i* (liii^iiosi-d witli 1,1)
li'iiialt's
II "/..
I'odil siiiiiplc
11 "/»
,lilemciilaiy School 18 _ 43.9 25 , 51.0 43 47.8
1
Mulilic School " ^ 10 24.4
i?;Secondary School 7 17.1 7 '"'14.3
14 15,6
College or laler 6 14 6 1.3 26.5 10 21.1 1
( 'onlinuetl ne\l pat»c
42
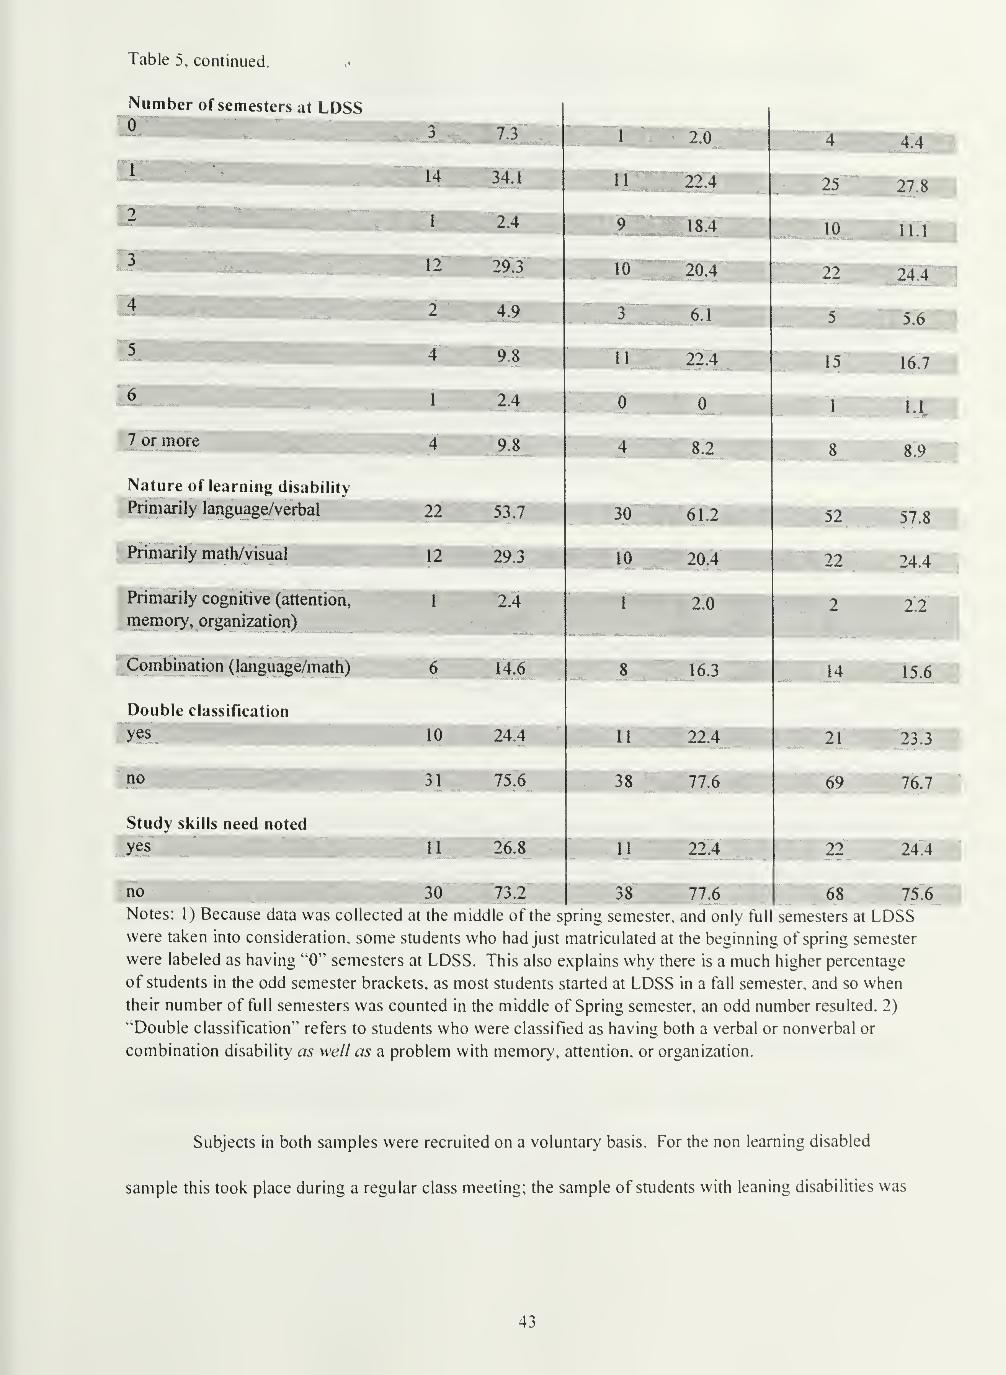
Table 5, continued.
Number of semesters at LDSS^ 3 .7,3
^ 14 34.1
^ '"'Maui——BMaiwt^aw^—>-
2 4.9
5 4 9.8
1 2.0
nm^2.4_
9 '18.4
4 4.4I
25 27.8]
10 11.1 i
- - . v„ .,--3
10 20.4
3 6 1
11 4
22" "
24.4' ^
y 5,6
Ij 16.7
^ \ 2A 0 0 1 1 I ^
7 or more 4 9 3 4 8 2 R Oo o.V
Nature of learning disability
Primarily language/verbal 22 53.7 30 61.2 52 57.8
Primarily math/visual ..^i^.^^.^^ . 12 29.3 10 20.4
Primarily cognitive (attention, '^ilHHmemory^ organization) VI^^^^HI^
1 2.0 2 2.2
Combination (language/math) 6 14.6 8 16.3 14 IS
Double classification
yes 10 24.4 1 1 22.4 21 '^3 3
no 31 75.6 38 77.6 69 76 7
Study skills need noted
yes 11 26.8 1 1 22.4 22 24.4
no 30 73.2 38 77.6 68 75.6
Notes: 1) Because data was collected at the middle of the spring semester, and only full semesters at LDSSwere taken into consideration, some students who had just matriculated at the beginning of spring semester
were labeled as having "0'' semesters at LDSS. This also explains why there is a much higher percentage
of students in the odd semester brackets, as most students started at LDSS in a fall semester, and so when
their number of full semesters was counted in the middle of Spring semester, an odd number resulted. 2)
''Double classification'' refers to students who were classified as having both a verbal or nonverbal or
combination disability as well as a problem with memory, attention, or organization.
Subjects in both samples were recruited on a voluntary basis. For the non learning disabled
sample this took place during a regular class meeting; the sample of students with leaning disabilities was
43
taken at the LOSS office, witb students' case managers eliciting their voluntary participation during
scheduled appointment times.
Instruments
Test Anxiety
The test anxiety construct was measured using the Revised Test Anxiety Scale (RTA, Benson et
a!., 1994), a self report measure of test anxiety as a four component construct. The RTA is a 20 item, four
point Likert rating scale (1 = almost never to 4 = almost always). It yields four factorially derived subtest
scores: Worry, Tension, Test Irrelevant Thinking, and Bodily Symptoms.
Benson et al. (1994) Report an overall scale reliability of .89 for the RTA. The subscale
reliabilities are: Woiry, .71; Tension, .84; Test Irrelevant Thinking, .74; and Bodily Symptoms, .78. Three
cross validation studies were done on the RTA by Benson et al. on American, Egyptian, and randomly
mixed samples. The results of these multinational factor analyses and cross validation procedures
indicated that the RTA is a stable and precise measure of both the general construct of test anxiety as well
as of the four component dimensions. The complete RTA is reproduced in Appendix Al (p.l31).
Perceived Control
Two instruments were used to measure students^ perceived control over testing. The first of these
was the Academic Locus of Control Scale (Trice, 1985), a 28 item, true false format self report measure of
beliefs in personal control over academic outcomes, with higher scores indicating a more external locus of
control. Trice reported test-retest reliability coefficients ofALOCS scores for undergraduate Psychology
students of .92, and KR-20 internal consistency of .70. The ALOCS correlated significantly with the
Rotter (1966) I-E scale (.50) and with the Smith (1973) Achievement Motivation Checklist (-.31).
Significant correlations were also demonstrated between ALOCS scores and amount of extra credit
students in the validation sample earned (-.38), final exam grades (-.32), and attendance (-.30) (negative
correlations suggest that high levels of personal control result in better attendance and more work done).
These findings suggest the scale has acceptable construct and some limited predictive validity. The
complete ALOCS is reproduced in Appendix A2 (p. 133).
44
The second measure of perceived control over testing was a scale developed by the author to
measure more specifically students' perceptions of control over testing and grading. Perceived Control
Over Testing (PCOT) is a 17 item, five point Likert scale (1 = never to 5 = always). In developing this
scale, 30 items were written by the author, consistent with the locus of control concept, which covered a
variety of aspects of the testing/grading situation. The scale items were reviewed for construct validity and
revised by four graduate students in school psychology, two faculty members (Psychology and Education),
and four undergraduate students. Items were deleted and rewritten on the basis of this input, resulting in
the final scale of 17 items. The coefficient alpha reliability for the total scale was .81 for the total sample
(LD and non LD). For the total sample, PCOT total score showed significant correlations with the ALOCS
(-.30), and with sttidents use of testing support (.41) and general support services (.35). These correlations
indicate that while the consttoict measured by PCOT total score is, as expected, related to academic locus of
control, it is also unique, and more closely allied with specific beliefs and behaviors surrounding
testing/grading, as it was intended to be.
Factor analysis of the PCOT revealed a 3 factor structure. Factor 1 accounted for 26.9% of the
variance in student scores and consisted of items 1, 2, 12, 15, and 16. These items all relate to actions
students actually take to get needs met in testing/grading sittjations (e.g., "I ask for extra time to complete
assignments when I need it"), and hence PCOT factor 1 was labeled "Actions Taken." PCOT factor 1 had
a coefficient alpha reliability of .8 1 for the total sample (LD and non LD). For the total sample, PCOT
factor 1 showed significant correlations with the ALOCS total score (-.16), the RTA total score (.25), and
with students use of testing support (.48) and general support services (.42). These correlations indicate
that while the construct measured by PCOT factor 1 is, as expected, slightly related to academic locus of
control, it is also unique, and more closely allied with specific beliefs and behaviors surrounding
testing/grading, as it was intended to be. It does appear to reflect the amount which students use support
services (i.e., "take action").
PCOT factor 2 accounted for 1 1 .4% of the variance in sttjdent scores and consisted of items 4, 5,
6, and 10. These items all relate to beliefs students have regarding their ability to convince professors to
change something about testing/grading procedures (e.g., "fm sure 1 can convince a professor to change a
45
test grade if I discuss it with Mm/her"), and hence PCOT factor 2 was labeled "Persuasion Beliefs." PCOT
factor 2 had a coefficient alpha reliability of .62 for the total sample (LD and non LD). For the total
sample PCOT factor 2 showed significant correlations with the ALOCS (-.19), and with students' use of
testing support (.27) and general support services (.23). These correlations indicate that while the construct
measured by PCOT factor 2 is, as expected, slightly related to academic locus of control, it is also unique,
and more closely allied with specific beliefs and behaviors surrounding testing/grading, as it was intended
to be. PCOT factor 2 does appear to have some limited construct validity, as it does reflect students' use of
support services where self advocacy and interacting with ("persuading") professors are recommended;
however, this factor appears to be of limited value due to its low reliability and fairly low correlations with
published measures.
PCOT factor 3 accounted for 8.1% of the variance in student scores and consisted of items 7, 8, 9,
13, and 17. These items are all reflective of more general academic locus of control issues (e.o. "How
well I do on tests depends on things I can't control"), and hence PCOT factor 3 was labeled ^^General
LOC:' PCOT factor 3 had a coefficient alpha reliability of .61 for the total sample (LD and non LD). For
the total sample, PCOT factor 3 showed significant correlations with the ALOCS (-.34) and with course
withdrawals (-.15). These correlations indicate that PCOT factor 3 has some construct validity as a
measure of generalized academic locus of control, though again this factor appears to be of limited value
due to its low reliability and fairly low correlations with published measures.
Items 3, 1 1, and 14 were not included in any of the 3 major factors. The complete PCOT is
reproduced in Appendix A3 (p. 135).
Rating of Test Situations
The Test Situations Rating Survey (TSRS) was created by the author and consists of a list of 20
possible features of test situations (e.g., oral presentation, a crowded exam room) which respondents are to
rate on a five point Likert scale (1 = not at all, to 5 = very much) as to how much these specific situations
increase anxiety about testing/grading. As with the PCOT, a pool of possible items constructed by the
author was reviewed, by the same group of faculty, graduate, and undergraduate students, for clarity and
completeness in terms of potential situations covered. Items were added, deleted, and rewritten on the
46
basis of this input, resulting ir> the final survey of 20 items. The coefficient alpha reliability for the total
scale score for the total sample (LD and non LD) for the TSRS was .91. Factor analysis revealed a
unidimensional factor structure. The total scale score for the TSRS correlated significantly with both the
ALOCS total score (.20) and with the RTA total score (.71), indicating a relatively high level of construct
validity as a measure of anxiety for testing situations. The complete TSRS is reproduced in Appendix A4
(p. 137).
Rating of Testing Modincations/Accommodations
The Test Modifications Rating Survey (TMRS) was created by the author and consists of a list of
18 possible modifications that may be made to a "typical" test situation to (theoretically) lessen student
anxiety about testing. Each modification presented is to be rated on a five point Likert scale in terms of its
anxiety reduction potential (1 = not at all, to 5 = very much). As with the TSRS, a pool of possible items
constructed by the author was reviewed, by the same group of faculty, graduate, and undergraduate
students, for clarity and completeness in terms of potential modifications/accommodations covered. Items
were added, deleted, and rewritten on the basis of this input, resulting in the final survey of 18 items. The
coefficient alpha reliability for the total scale score for the total sample (LD and non LD) for the TMRS
was .90. Factor analysis of the TMRS revealed a unidimensional factor structure. The total scale score for
the TMRS correlated significantly with both the ALOCS total score (.16) and with the RTA total score
(.54), indicating that the TMRS had acceptable construct validity as a measure of testing modifications in
terms of their anxiety reduction value. The complete TMRS is reproduced in Appendix A5 (p. 139).
Course and Subject Area Avoidance
Participants' tendencies to avoid particular courses or subject areas due to testing requirements
was assessed using the Testing Avoidance Measure (TAM) a four item, five point Likert scale (1 = never,
to 5 = always, for questions one and two, which deal with avoidance of particular courses or subject areas;
1 = strongly disagree, to 5 = strongly agree, for questions three and four, which deal with the degree to
which subjects will avoid graduate school entrance examinations or not) created by the author. The four
questions comprising the TAM were appended to the PCOT as items numbered 18-21. As with the PCOT,
the TAM items were reviewed for construct validity and revised by the same group of faculty, graduate.
47
and undergraduate students. Items were deleted and rewritten on the basis of this input, resuking in the
final scale of four items. The coefficient alpha reliability for the total scale score for the total sample (LD
and non LD) for the TAM was .74. For the total sample, TAM total score showed significant correlations
with the ALOCS total score (.28), the RTA total score (.50), and number of courses failed (.17). While
these correlations indicate that the TAM total score is related to academic locus of control, test anxiety, and
course failures in the manner which would be expected to establish construct validity, their fairly moderate
nature indicates that this scale appears to be measuring a unique construct, as intended.
Factor analysis of the TAM revealed a 2 factor structure. Factor 1 accounted for 56.6% of the
variance in student scores, and consisted of items 3 and 4 (numbered 20 and 21 as appended to the PCOT).
These items both relate to avoidance of graduate school admissions tests (e.g., ^^Having to take the GRE
will stop me from applying to graduate school"), and hence TAM factor 1 was labeled ^^Admissions Test
Avoidance." TAM factor 1 had a coefficient alpha reliability of .82 for the total sample (LD and non LD).
TAM factor 1 correlated significantly with the ALOCS total score (.22), the RTA total score (.38), and
with students' use of testing support (.21) and general support services (.23). While these correlations
indicate that TAM factor 1 is related to academic locus of control test anxiety, and use of support services
in the manner which would be expected to establish construct validity, their fairly moderate nature
indicates that this factor appears to be measuring a unique construct, as intended.
TAM factor 2 accounted for 25.3% of the variance in student scores and consisted of items 1 and
2 (numbered 18 and 19 as appended to the PCOT). These items both relate to avoidance of testing
intensive classes or subject areas (e.g., "I avoid classes when I know that the course grade is based only on
rigorous testing"), and hence TAM factor 2 was labeled "Class Avoidance." Tarn factor 2 had a coefficient
alpha reliability of .72 for the total sample (LD and non LD). TAM factor 2 correlated significantly with
the ALOCS total score (.23), the RTA total score (.45), and with course failures (.17). While these
correlations indicate that TAM factor 2 is related to academic locus of control, test anxiety, and course
failures in the manner which would be expected to establish construct validity, their fairly moderate nature
indicates that this factor appears to be measuring a unique construct, as intended.
48
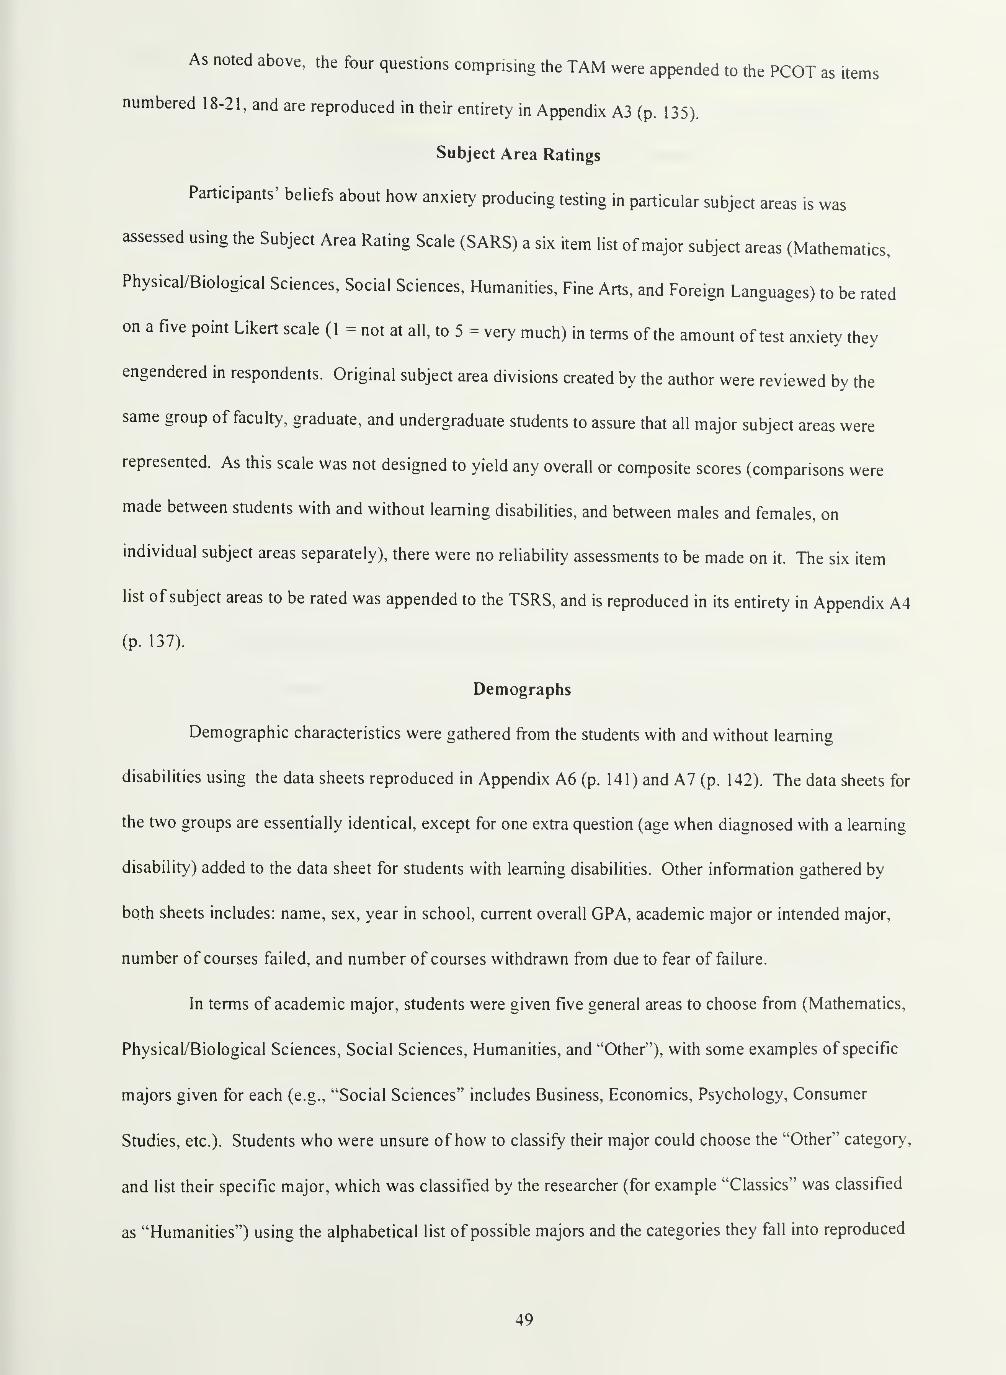
As noted above, the four questions comprising the TAM were appended to the PCOT as items
numbered 18-21, and are reproduced in their entirety in Appendix A3 (p. 135).
Subject Area Ratings
Participants' beliefs about how anxiety producing testing in particular subject areas is was
assessed using the Subject Area Rating Scale (SARS) a six item list of major subject areas (Mathematics,
Physical/Biological Sciences, Social Sciences. Humanities, Fine Arts, and Foreign Languages) to be rated
on a five point Likert scale (1 = not at all, to 5 = very much) in terms of the amount of test anxiety they
engendered in respondents. Original subject area divisions created by the author were reviewed by the
same group of faculty, graduate, and undergraduate students to assure that all major subject areas were
represented. As this scale was not designed to yield any overall or composite scores (comparisons were
made between students with and without learning disabilities, and between males and females, on
individual subject areas separately), there were no reliability assessments to be made on it. The six item
list of subject areas to be rated was appended to the TSRS, and is reproduced in its entirety in Appendix A4
(p. 137).
Demographs
Demographic characteristics were gathered from the students with and without learning
disabiUties using the data sheets reproduced in Appendix A6 (p. 141) and A7 (p. 142). The data sheets for
the two groups are essentially identical, except for one extra question (age when diagnosed with a learning
disability) added to the data sheet for students with learning disabilities. Other information gathered by
both sheets includes: name, sex, year in school, current overall GPA, academic major or intended major,
number of courses failed, and number of courses withdrawn from due to fear of failure.
In terms of academic major, students were given five general areas to choose from (Mathematics,
Physical/Biological Sciences, Social Sciences, Humanities, and ''Other"), with some examples of specific
majors given for each (e.g., "Social Sciences" includes Business, Economics, Psychology, Consumer
Studies, etc.). Students who were unsure of how to classify their major could choose the "Other" category,
and list their specific major, which was classified by the researcher (for example "Classics" was classified
as "Humanities") using the alphabetical list of possible majors and the categories they fall into reproduced
49

in Appendix C (p. 146). If a major did not clearly fit any of the more specific categories (e.g., "Landscape
contracting" and related majors in the School of Agriculture) it was placed in the "Other" category.
Students with Learning Disabilities Support Data
Data on students with learning disabilities^ diagnoses, use of support services, and use of
testing/grading accommodations was gathered from students^ case folders at LDSS using the data
worksheet reproduced in Appendix A8 (p. 143). This worksheet was designed to yield 3 scores: 1) use of
general support services (e.g., case management, counseling, tutoring); 2) use of testing accommodations
(e.g., proctored tests, untimed tests); and 3) total use of services (this is simply a combined score for
measures 1 and 2).
To derive the above scores, the following pieces of data were collected for each LDSS student
participating in the survey, from their LDSS file:
1.
Number of semesters at LDSS. Student survey data was collected for the study during the
first 6 weeks of the Spring semester, 1998. LDSS data from this semester was not included in
the study, as the semester was only half completed when the LDSS data was collected. Only
full semesters of attendance at LDSS were included in the study. Thus, in a few cases (i.e.
students who had just matriculated in January 1998), no scores for any of the LDSS data
categories are registered, though they are students with learning disabilities.
2. Average number of office contacts per semester. Each time a case manager at LDSS has an
appointment with or talks on the phone with a student, or talks on the phone with a professor,
staff member, parent, etc. about a student, a "contact sheet" is filled out and placed in the
student's file. The total count of contact sheets in each student's file was divided by the
number of semesters the student had been receiving services at LDSS.
3. Average number of tutor visits per semester. A record is kept (i.e., an "end of semester tutor
report" is placed in the student's LDSS file at the close of each semester during which a
student received tutoring) of the number of semesters a student receives tutoring. For the
purposes of this study, it was determined, through discussion with the tutor office, that the
average student receiving tutoring attends approximately 10 tutoring sessions per semester.
50
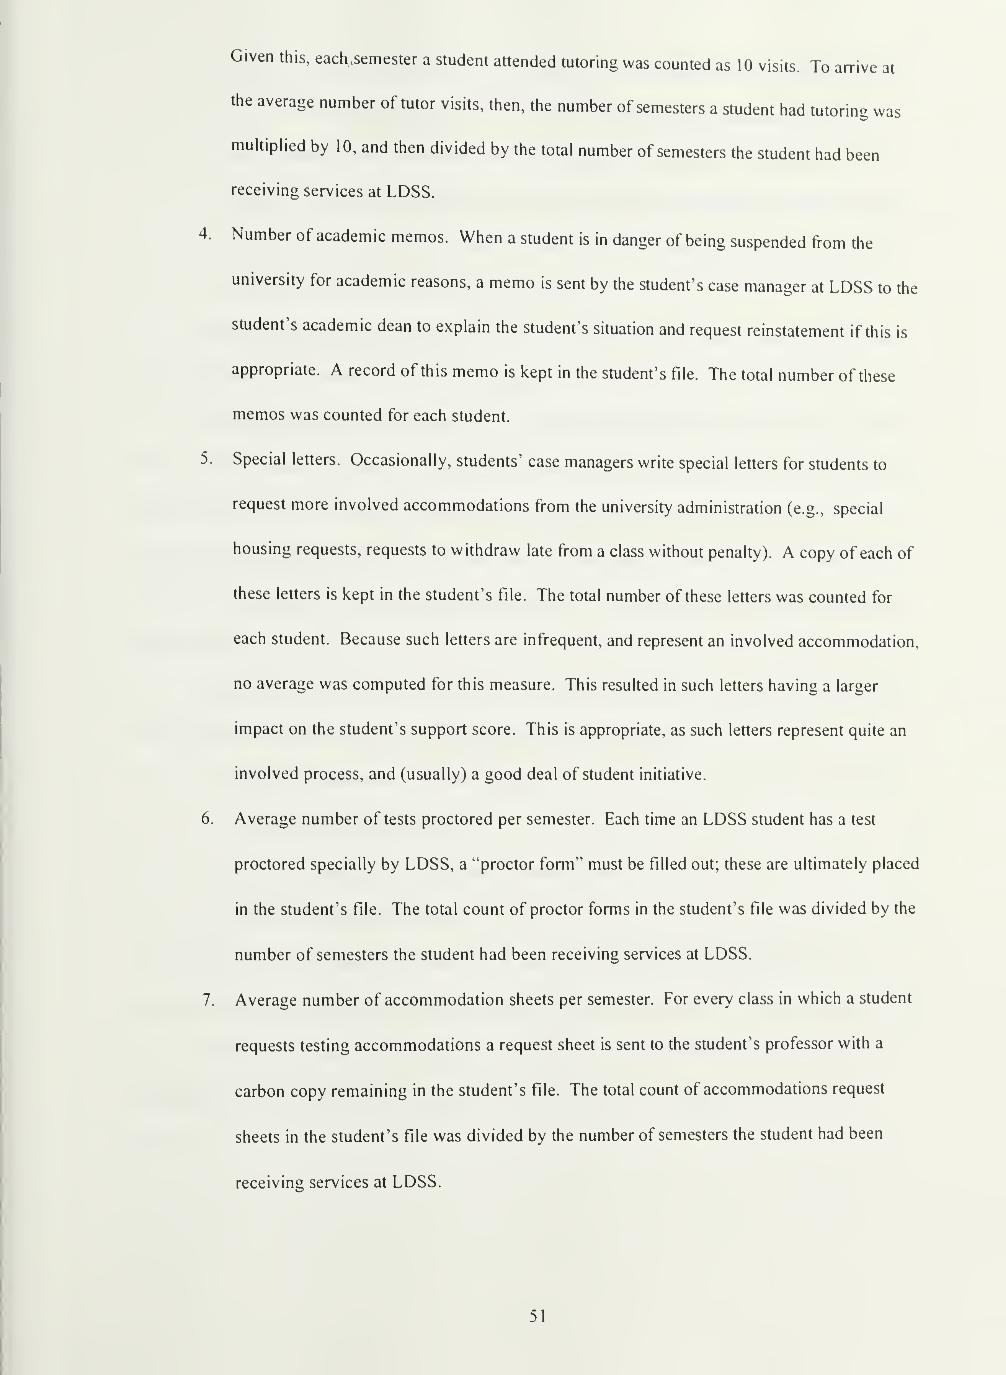
Given this, each.semester a student attended tutoring was counted as 10 visits. To arrive at
the average number of tutor visits, then, the number of semesters a student had tutoring was
muhiplied by 10, and then divided by the total number of semesters the student had been
receiving services at LDSS.
4. Number of academic memos. When a student is in danger of being suspended from the
university for academic reasons, a memo is sent by the student's case manager at LDSS to the
student's academic dean to explain the student's situation and request reinstatement if this is
appropriate. A record of this memo is kept in the student's file. The total number of these
memos was counted for each student.
5. Special letters. Occasionally, students' case managers write special letters for students to
request more involved accommodations from the university administration (e.g., special
housing requests, requests to withdraw late from a class without penalty). A copy of each of
these letters is kept in the student's file. The total number of these letters was counted for
each student. Because such letters are infrequent, and represent an involved accommodation,
no average was computed for this measure. This resulted in such letters having a larger
impact on the student's support score. This is appropriate, as such letters represent quite an
involved process, and (usually) a good deal of student initiative.
6. Average number of tests proctored per semester. Each time an LDSS student has a test
proctored specially by LDSS, a ''proctor form" must be filled out; these are ultimately placed
in the student's file. The total count of proctor forms in the student's file was divided by the
number of semesters the student had been receiving services at LDSS.
7. Average number of accommodation sheets per semester. For every class in which a student
requests testing accommodations a request sheet is sent to the student's professor with a
carbon copy remaining in the student's file. The total count of accommodations request
sheets in the student's file was divided by the number of semesters the student had been
receiving services at LDSS.
51
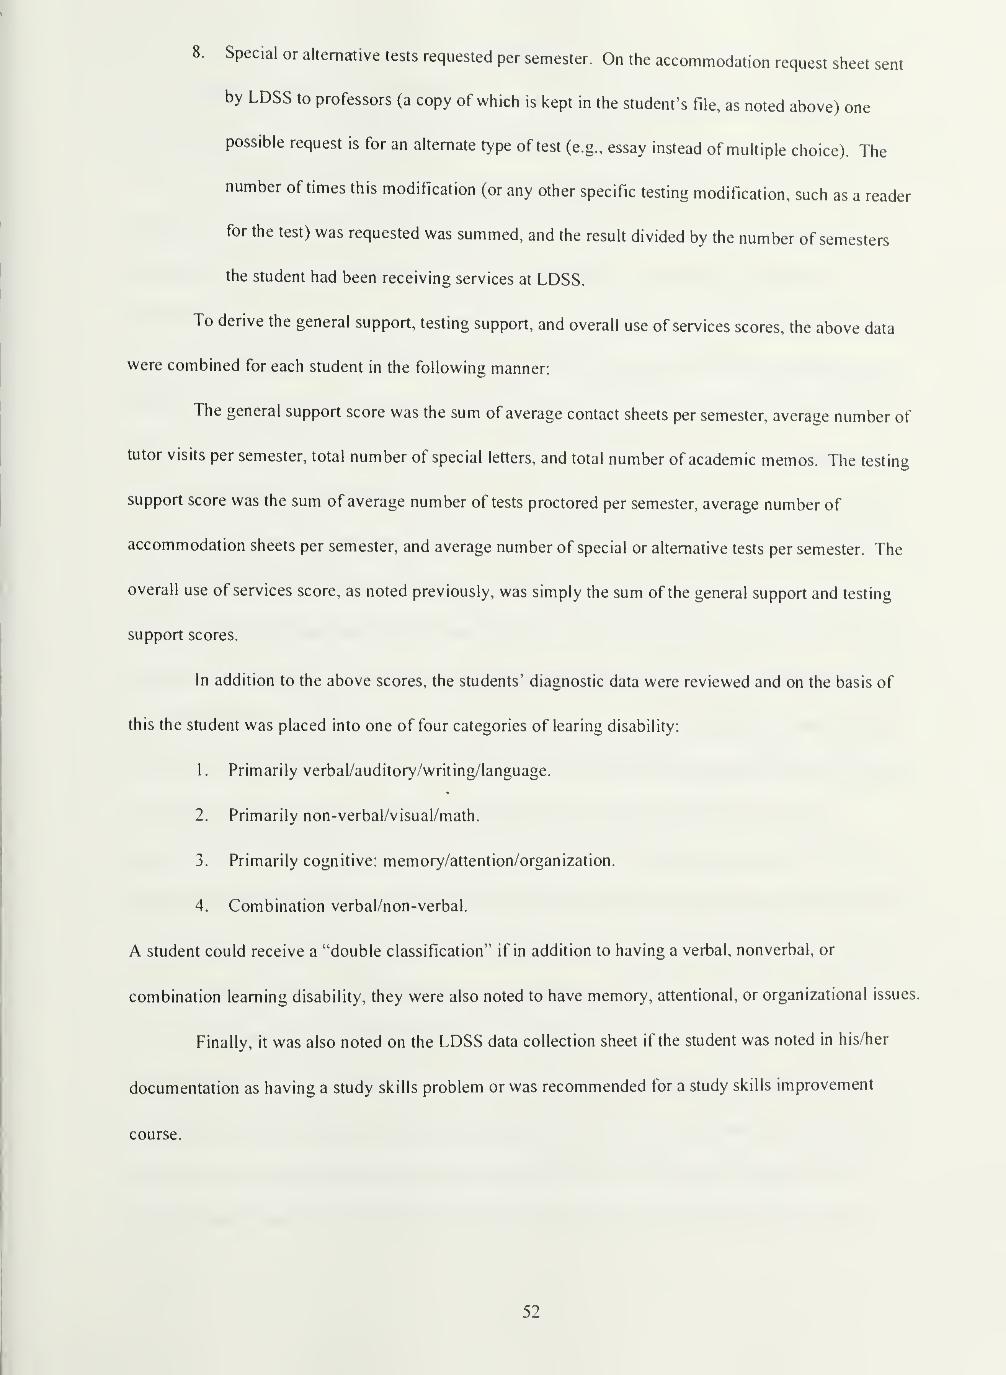
8. Special or altemartive tests requested per semester. On the accommodation request sheet sent
by LOSS to professors (a copy of which is kept in the student's file, as noted above) one
possible request is for an alternate type of test (e.g., essay instead of multiple choice). The
number of times this modification (or any other specific testing modification, such as a reader
for the test) was requested was summed, and the result divided by the number of semesters
the student had been receiving services at LDSS.
To derive the general support, testing support, and overall use of services scores, the above data
were combined for each student in the following manner:
The general support score was the sum of average contact sheets per semester, average number of
tutor visits per semester, total number of special letters, and total number of academic memos. The testing
support score was the sum of average number of tests proctored per semester, average number of
accommodation sheets per semester, and average number of special or alternative tests per semester. The
overall use of services score, as noted previously, was simply the sum of the general support and testing
support scores.
In addition to the above scores, the students' diagnostic data were reviewed and on the basis of
this the student was placed into one of four categories of learing disability:
1 . Primarily verbal/auditory/writing/language.
2. Primarily non-verbal/visual/math.
3. Primarily cognitive: memory/attention/organization.
4. Combination verbal/non-verbal.
A student could receive a "double classification" if in addition to having a verbal, nonverbal, or
combination learning disability, they were also noted to have memory, attentional, or organizational issues.
Finally, it was also noted on the LDSS data collection sheet if the student was noted in his/her
documentation as having a study skills problem or was recommended for a study skills improvement
course.
52
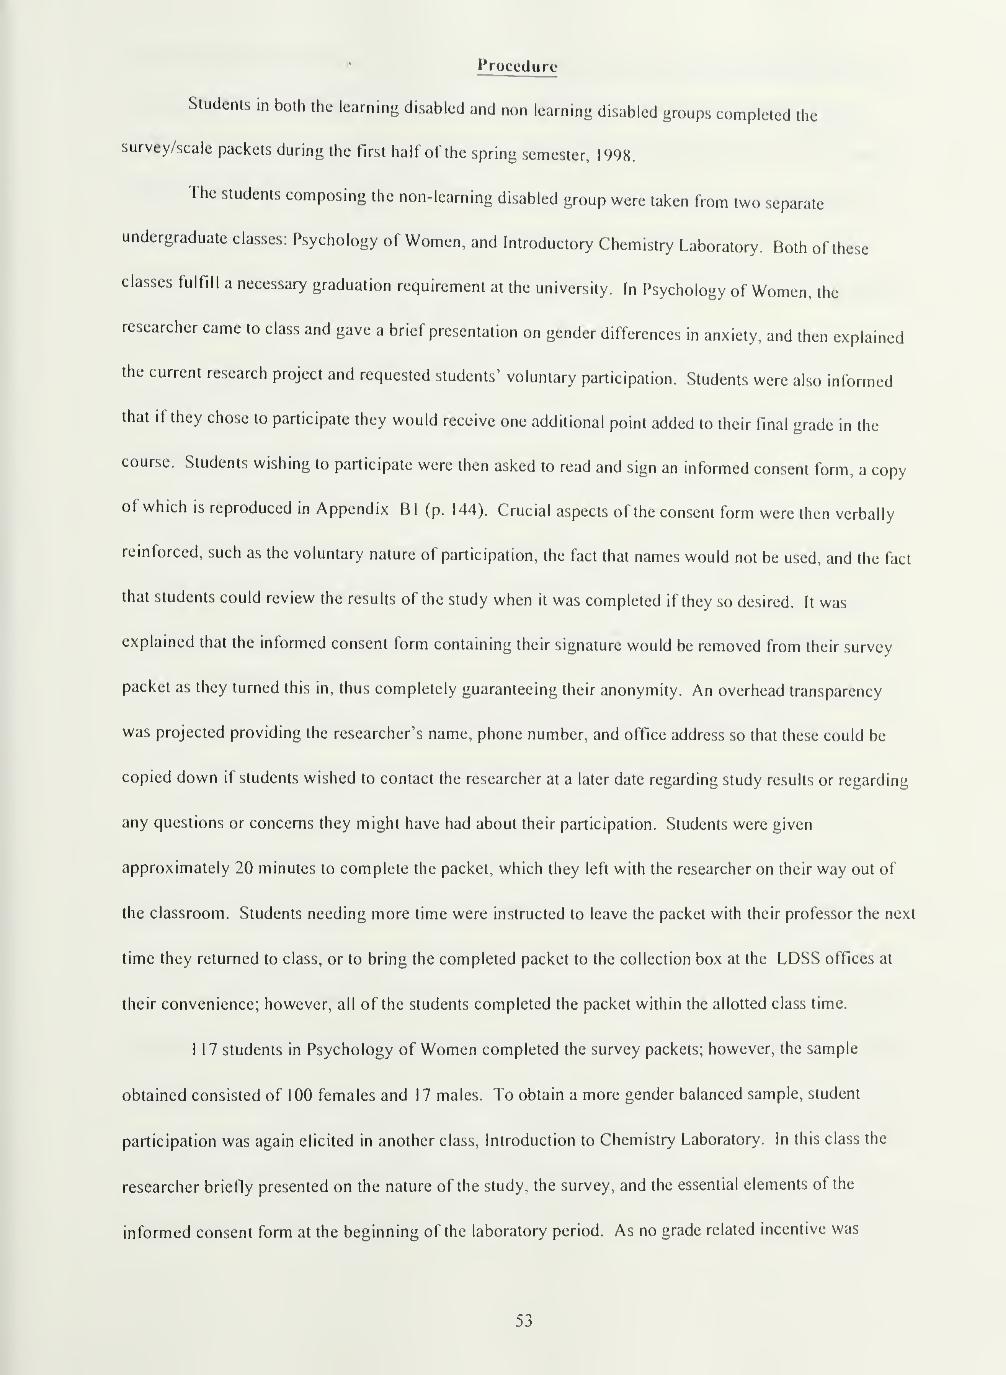
Procedure
Students in both the learning disabled and non learning disabled groups completed the
survey/scale packets during the first half of the spring semester, 1998.
The students composing the non-learning disabled group were taken from two separate
undergraduate classes: Psychology of Women, and Introductory Chemistry Laboratory. Both of these
classes fulfill a necessary graduation requirement at the university. In F>sychology of Women, the
researcher came to class and gave a brief presentation on gender differences in anxiety, and then explained
the current research project and requested students^ voluntary participation. Students were also informed
that if they chose to participate they would receive one additional point added to their final grade in the
course. Students wishing to participate were then asked to read and sign an informed consent form, a copy
of which is reproduced in Appendix Bl (p. 144). Crucial aspects of the consent form were then verbally
reinforced, such as the voluntary nature of participation, the fact that names would not be used, and the fact
that students could review the results of the study when it was completed if they so desired. It was
explained that the informed consent form containing their signature would be removed from their survey
packet as they turned this in, thus completely guaranteeing their anonymity. An overhead transparency
was projected providing the researcher's name, phone number, and office address so that these could be
copied down if students wished to contact the researcher at a later date regarding study results or regarding
any questions or concerns they might have had about their participation. Students were given
approximately 20 minutes to complete the packet, which they left with the researcher on their way out of
the classroom. Students needing more time were instructed to leave the packet with their professor the next
time they returned to class, or to bring the completed packet to the collection box at the LDSS offices at
their convenience; however, all of the students completed the packet within the allotted class time.
1 17 students in Psychology of Women completed the survey packets; however, the sample
obtained consisted of 100 females and 17 males. To obtain a more gender balanced sample, student
participation was again elicited in another class. Introduction to Chemistry Laboratory. In this class the
researcher briefiy presented on the nature of the study, the survey, and the essential elements of the
informed consent form at the beginning of the laboratory period. As no grade related incentive was
53
possible in this class, students were told they would be given one dollar for their effort when they turned in
the completed survey. Only the males in the class were specifically asked to participate in the survey;
however, females were told that they could also participate if they chose, and so earn the 1 dollar incentive.
Students completed the survey packets after finishing their class assignment, and turned them in to their
class teaching assistant, who gave each participating student a dollar, and later returned the completed
surveys to the researcher. 25 males and 1 female from Introduction to Chemistry Laboratory participated
in the survey.
To develop a fairly gender balanced non learning disabled sample from the 143 collected surveys,
all 42 male responses were used, and of the 100 available female responses, 50 were chosen randomly to
make up the remainder of the actual sample used in the study. This resulted in a non-learning disabled
sample of 92 (42 males, 50 females).
The students with learning disabilities participating in the study were given the survey/scale
packets on an individual basis when they came in to LOSS for a scheduled visit with their case manager.
Individual case managers elicited students' voluntary participation in the study using the following script:
One of the case managers here is doing a study on student beliefs about and reactions to testing in
students with and without learning disabilities here at UMASS. Participation is completely
voluntary, and filling out the surveys in the packet should take about 15 to 20 minutes of your
time. Would you be interested in participating?
If the student was willing to participate, the case manager reviewed the informed consent form, again
highlighting the voluntary nature of participation, the fact that names would not be used, and the fact that
students could review the results of the study when it was completed if they so desired. It was explained
that they were being requested to put their names on the packet for tracking purposes, so that their surveys
could be matched with the information in their LDSS file, so that in the event that they decided withdraw
from participation in the study at a later date it would be possible to identify their survey, or so that in the
unlikely event that clarification of one of their responses was needed, this could be obtained. The case
manager then obtained the student's signature and telephone number. A copy of the informed consent
form for students with learning disabilities is reproduced in Appendix B2 (p. 145). Students were given
54

the option or completing the packet at LDSS in their case manager's office or in the waiting area, or of
completing the packet at home and bringing it back to LDSS at the time of their next appointment. If
students chose to take the packet home with them, the consent form was removed and given to the
researcher so that he could contact students who had not returned surveys later, if this became necessary, to
mcrease response rate. A box was provided in the reception area at the LDSS ofHce to collect the
completed packets from the students.
Alter the first two weeks of data collection it became apparent that many of the LDSS students
were taking the surveys home to till out and not returning them, to increase response rate, a rafOe was
instituted, where all LDSS students who handed in a completed survey had their name entered in a
drawing, to take place at the end of the semester, for a 25.00 gift certificate to a local restaurant and 2
movie passes. This increased response rate appreciably, and the Tmal sample of students with learning
disabilities consisted of 90 students (41 males and 49 females).
Once the surveys were collected and the process of scoring them and compiling the results began,
the researcher found that occasionally, though they had been specifically instructed not to do so, students
had skipped questions, put N/A as an answer, or answered a question ambiguously (e.g., put n/V'' as their
answer for a true-false question). As a single missing or ambiguous response in general meant that a whole
scale score was lost, and as such missing or ambiguous responses were a fairly infrequent occurrence,
consistent rules were developed to fill in missing responses, deal with ambiguous responses, and so
complete any missing data. These rules were as follows:
1. Lor N/A responses or skipped questions the middle score of the scale was used on a scale
of 1-5; "2" on a scale of 0-4; and "2^^ on the R fA, which goes from 1-4).
2. For true-false questions, the response "T/F'' was scored as "true."
It is important to make clear that these rules were used to deal only with cases of an occasional missing or
ambiguous response. If students left whole sections of the survey blank, these were not scored; if students
did not answer or ambiguously answered more than l/IO of the questions on any given scale, this scale was
not scored for this student.
55

Missing demographic information was left blank unless a student could be contacted atkr the fact
(only students with learning disabilities were in this position); however, missing demographic data was
very rare, so this was not really an issue.
When entering the data into the statistical database, all of the variables that applied to students
with learning disabilities only (e.g., number of LOSS contact sheets, total use of support services score,
etc.) were coded as O's (as opposed to missing values) for the non learning disabled students, so full sample
analyses could still be run taking these variables into account if desired.
56
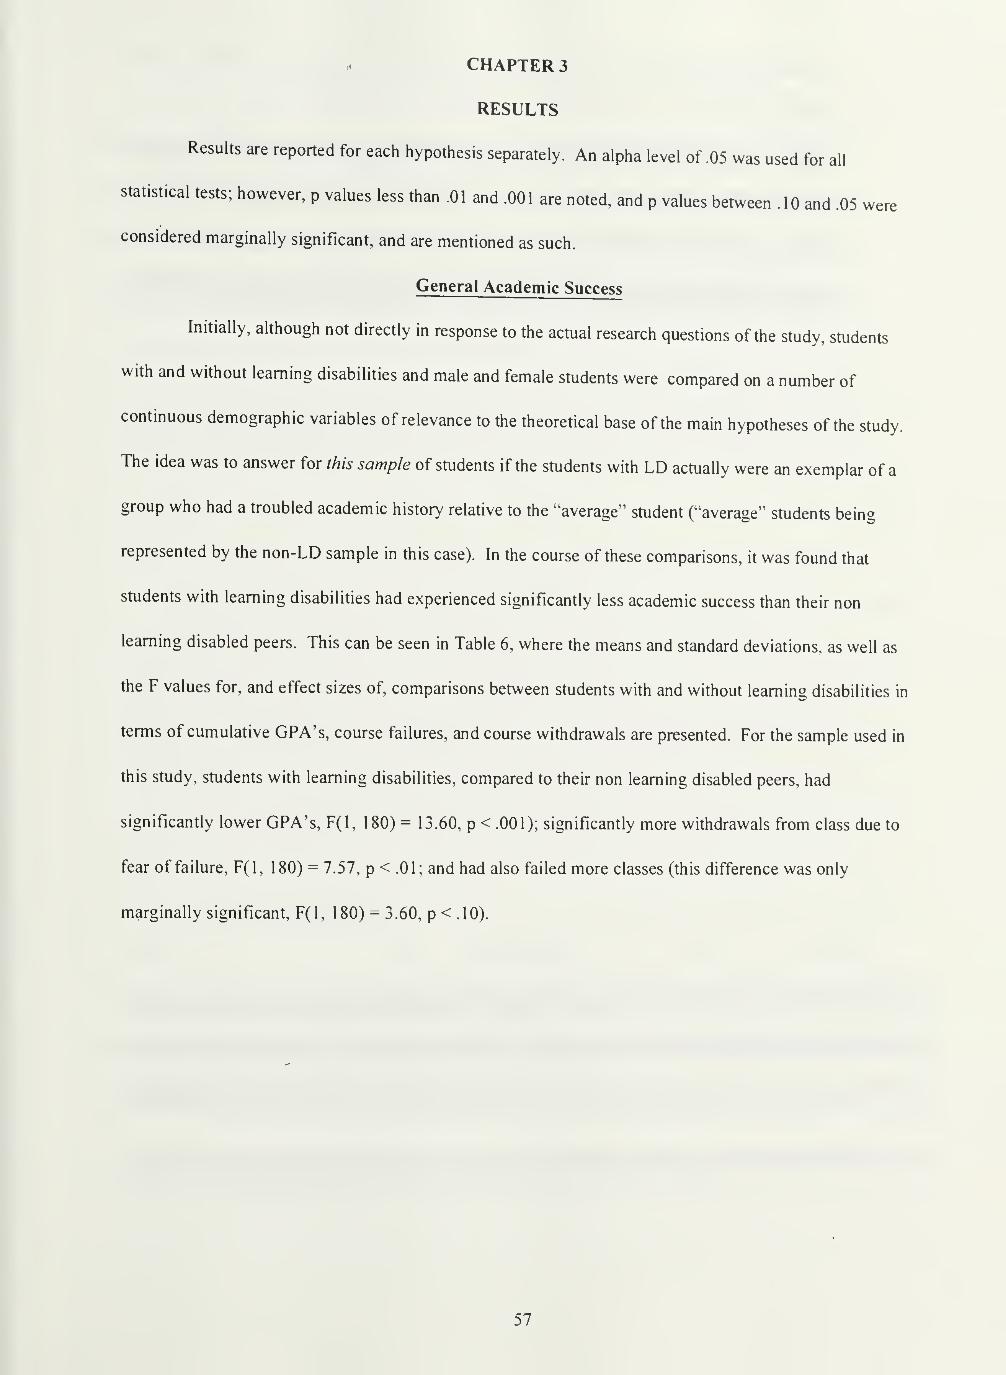
. CHAPTER 3
RESULTS
Results are reported for each hypothesis separately. An alpha level of .05 was used for all
statistical tests; however, p values less than .01 and .001 are noted, and p values between .10 and .05 were
considered marginally significant, and are mentioned as such.
General Academic Success
Initially, although not directly in response to the actual research questions of the study, students
with and without learning disabilities and male and female students were compared on a number of
continuous demographic variables of relevance to the theoretical base of the main hypotheses of the study.
The idea was to answer for this sample of students if the students with LD actually were an exemplar of a
group who had a troubled academic history relative to the "average" student ("average" students being
represented by the non-LD sample in this case). In the course of these comparisons, it was found that
students with learning disabilities had experienced significantly less academic success than their non
learning disabled peers. This can be seen in Table 6, where the means and standard deviations, as well as
the F values for, and effect sizes of, comparisons between students with and without learning disabilities in
terms of cumulative CPA's, course failures, and course withdrawals are presented. For the sample used in
this study, students with learning disabilities, compared to their non learning disabled peers, had
significantly lower CPA's, F(l, 180) = 13.60, p < .001); significantly more withdrawals from class due to
fear of failure, F(l, 180) = 7.57, p < .01; and had also failed more classes (this difference was only
marginally significant, F(l, 180) = 3.60, p < .10).
57
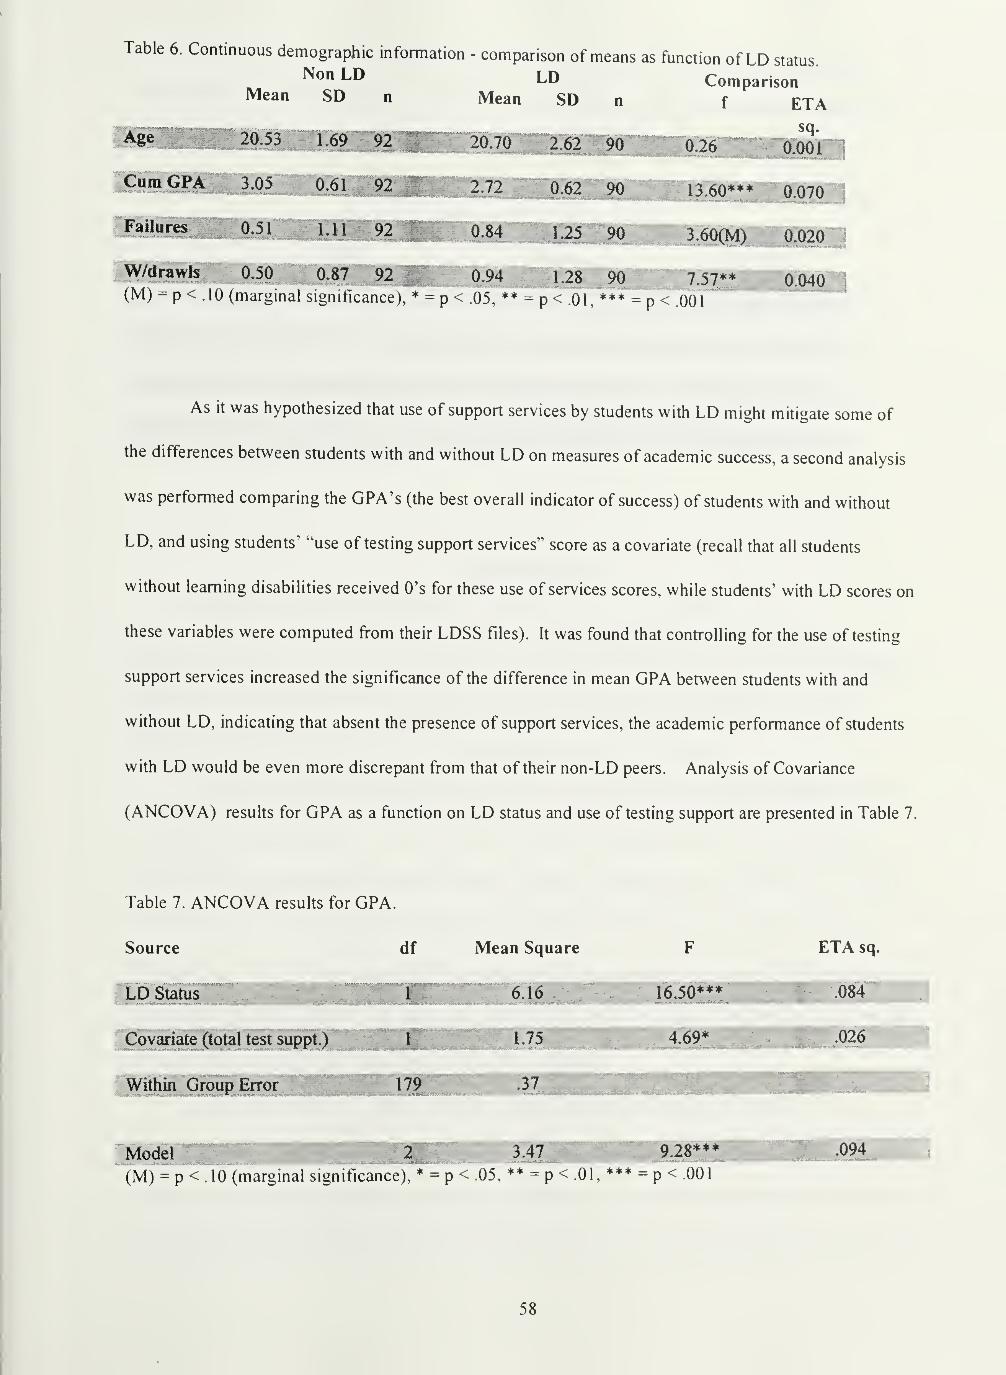
Table 6. Continuous demographic information - comparison of means as ftinction of LD status.
MeanNon LDSD n Mean
LDSD n
Compaf
rison
ETAsq.
1.69 92 ^1»WP20.70 2.62 90 0.26 0.001
CaraGPA 3.05 0.61lg||§13.60*** 0.070
Failures 0.51 1,11, ,92J 1.25 90 P-60(M) 0.020
W/drawb 0.50 0.87~
K 0.94 1.28 90 7.57**111 110.040(M) = p<. 10 (marginal significance), * = p< .05,
** = P<.01,*** = p<.001
As it was hypothesized that use of support services by students with LD might mitigate some of
the differences between students with and without LD on measures of academic success, a second analysis
was performed comparing the CPA's (the best overall indicator of success) of students with and without
LD, and using students' "use of testing support services" score as a covariate (recall that all students
without learning disabilities received O's for these use of services scores, while students' with LD scores on
these variables were computed from their LDSS files). It was found that controlling for the use of testing
support services increased the significance of the difference in mean GPA between students with and
without LD, indicating that absent the presence of support services, the academic performance of students
with LD would be even more discrepant from that of their non-LD peers. Analysis of Covariance
(ANCOVA) results for GPA as a function on LD status and use of testing support are presented in Table 7.
Table 7. ANCOVA results for CPA.
Source
LDStotus
df Mean Square
Covariate (total test su^C
Within Group Erroi
ETA sq,
(M) = p^^^^^^^^^^S?ffpH^* = P<™f!n™p< 001
,094
58
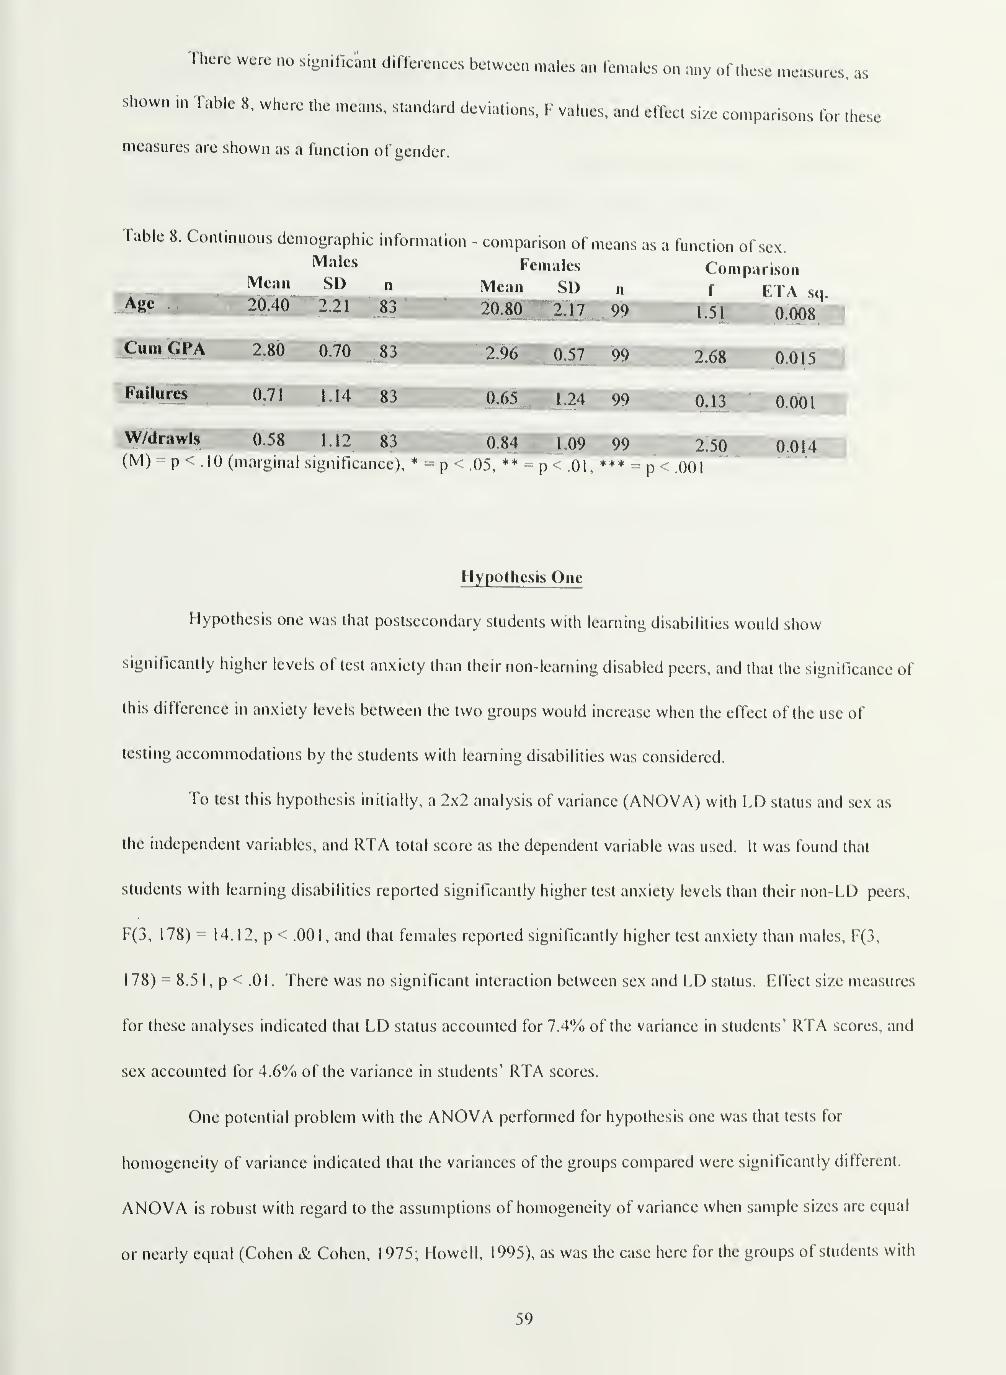
There were no significant dilTercnces between males an females on any of these measures, as
shown in Table 8, where the means, standard deviations, F vaU.es, and effect size comparisons tor these
measures are shown as a function of gender.
Table 8. Continuous demographic information - comparison of means as a function of sex.Males Females Comparison
I^^^" SI) n Mean SD n f ETA so20.40 2.21 83 JHI 20.80 2,17 99 1.51 0.008
2.80 0.70 83 —
:
2.96 0.57 99
0.71 1.14 83 0.65 1.24 99
W/drawIs 0.58 1.12 83 ||f|[ 0.84 '1,09 99 2(M) p < .10 (marginal significance), * = p < .05, **^p<.01,*** = p<.001
Hypothesis One
Hypothesis one was that postsecondary students with learning disabilities would show
significantly higher levels of test anxiety than their non-learning disabled peers, and that the significance of
this difference in anxiety levels between the two groups would increase when the effect of the use of
testing accommodations by the students with learning disabilities was considered.
To test this hypothesis initially, a 2x2 analysis of variance (ANOVA) with LD status and sex as
the independent variables, and RTA total score as the dependent variable was used. It was found that
students with learning disabilities reported significantly higher test anxiety levels than their non-LD peers,
F(3, 178) = 14.12, p < .001, and that females reported significantly higher test anxiety than males, F(3,
178) = 8.5 1, p < .01. There was no significant interaction between sex and LD status. Effect size measures
for these analyses indicated that LD status accounted for 7.4% of the variance in students' RTA scores, and
sex accounted for 4.6% of the variance in students' RTA scores.
One potential problem with the ANOVA performed for hypothesis one was that tests for
homogeneity of variance indicated that the variances of the groups compared were significantly different.
ANOVA is robust with regard to the assumptions of homogeneity of variance when sample sizes are equal
or nearly equal (Cohen & Cohen, 1975; Howell, 1995), as was the case here for the groups of students with
59

and without LD. However, in the interest of caution, and because the total sample was not as equally
balanced between males and females (83 males, 99 females), separate nonparametric Kruskal-Wallis one
way ANOVA's were performed on RTA total score for the factors of LD status and sex. Significant
differences in RTA scores were again found for both factors, corroborating the findings of the original
ANOVA procedures.
Means and standard deviations for students with and without learning disabilities on all scales,
including the RTA, are provided in Table 9; means and standard deviations for males and females on all
scales, including the RTA, are provided in Table 10. ANOVA results, including effect size measures, are
provided in Table 11. Results of the Kruskal-Wallis one way ANOVA's are presented in Table 12.
60
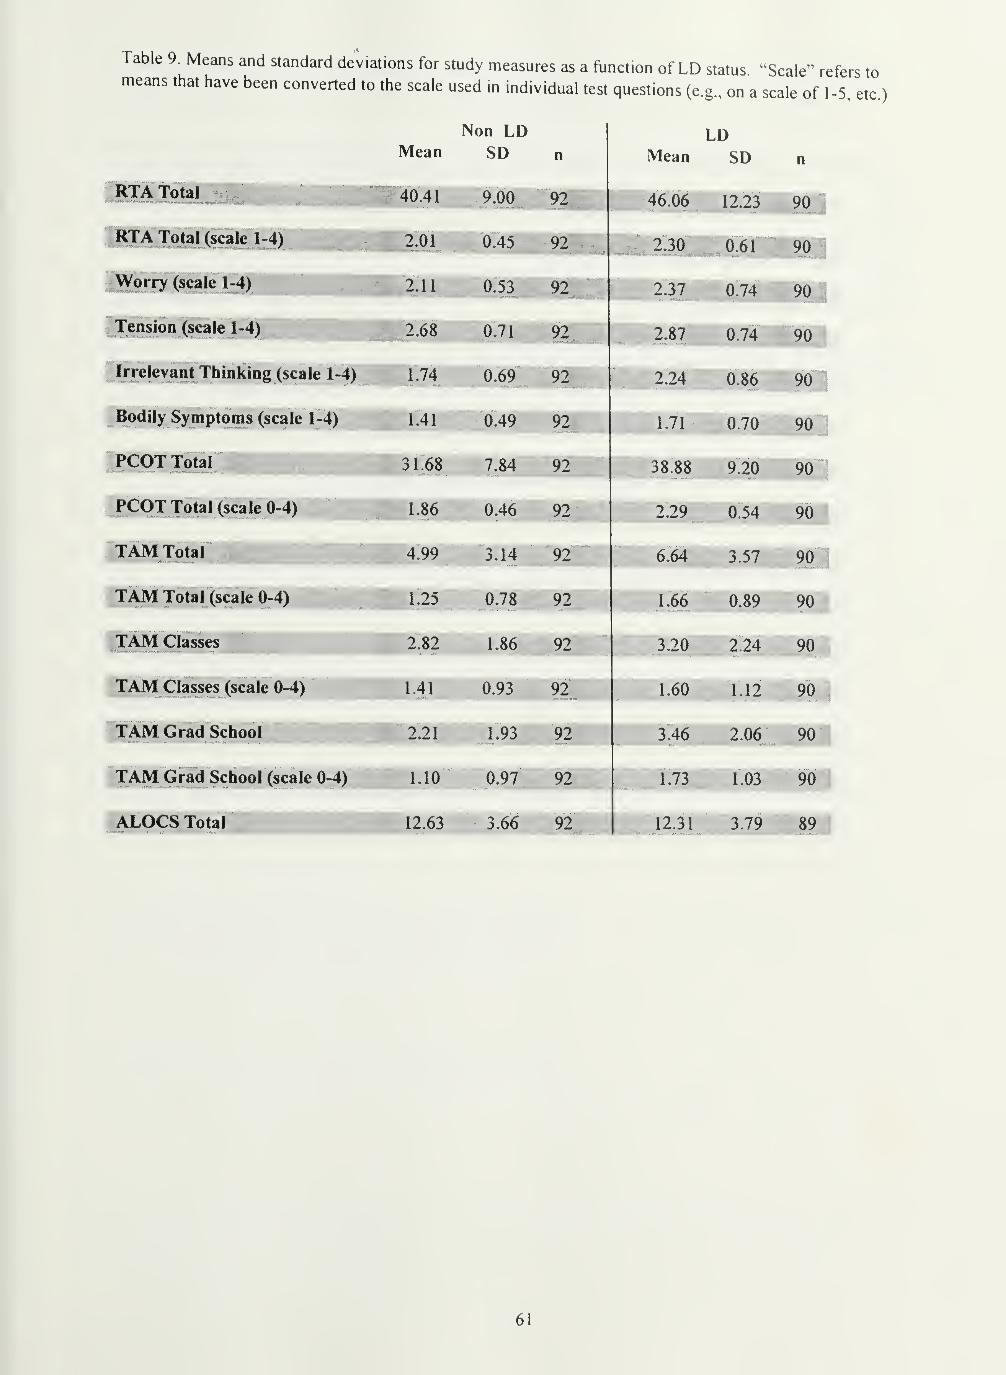
Table 9. Means and standard deviations for study measures as a function of LD status "Scale" refers tomeans that have been converted to the scale used in individual test questions (e.g., on a scale of 1-5, etc.)
Non LDMean SD n
LDiviean n
^o.uo \l,L5 9lW
-i^.ju u.oi yuRTA Total (scale 1 'f|^l|||M i |i| . 0 45 - 92
Worry (scale 1-4) Wltg/ggK. 2AI 0 SWKB^
Tension (scale 1-4) WKKB- 2,68 0 71 92 ^.0/ U./4 "cim
Irrelevant Thinking (scale 1-4) L74 0 69 92 '> 9J. A ftA OA
Bodily Symptoms (scale 1-4) L41 0 49 92 171 A 7A OA1. / 1 u. /u yu
PCOT Total mm^^ii^m^ 3I - y '^R Q IJA OA
PCOT Total (s^ailRi) .^^^gH 1.86 0.46 92 7 90 A OA
TAM Total mhhhhbhh 4 99 3 y^^2 6 64 7 orv.^
TAM Total (scale 0-4) flHHHHb-^^ ^-'^4HIIP 1 66 0 R9 QO^
TAM Q^^^^mmmmKg^^ ^ ^2 1 g6 9'> 3-20 2 24 90
TAM Classes (scale 0-4) 1.41 0.93 92 1 60 1 12 90
TAM Grad School ^WSM --^^ ^-93 92 3.46 2.06 90
TAM Grad School (scale 0-4) 1.10 0.97 92 1.73 1.03 90 •
ALOcs Total '^mmmm^^ ^^-^^ ^-^^ 12.31 3.79 89
61
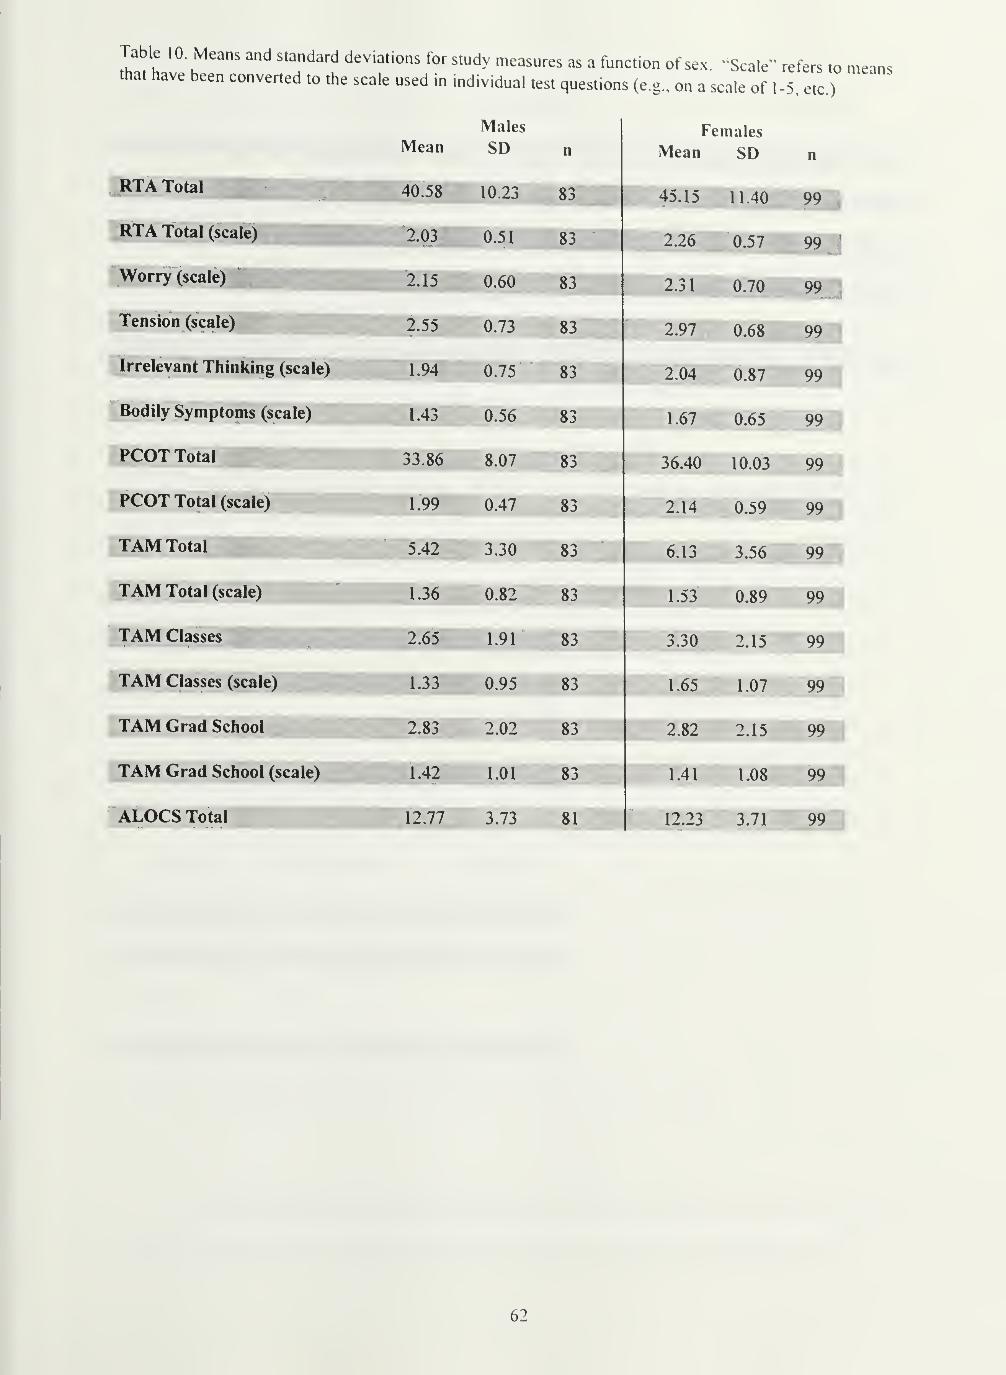
Table 10 Means and standard deviations for study measures as a function of sex. "Scale" refers to meansthat have been converted to the scale used in individual test questions (e.g., on a scale of 1-5, etc.)
Males FemalesMean SD n Mean SD n
RTA Total 40.58 10.23 83 45.15 11.40 99
KiA lotal (scale) 2.03 0.51 83 2.26 0.57 99'
worry (scaiej|||||||||^,^_2,15^^^_^ 0.60 83 2.31 0.70 99
tension (scale) 2.55 0.73 83 2.97 0.68 99
irrelevant Thinking (scale) 1.94 0.75 83 2.04 0.87 99
Bodily Symptoms (scale) 1.43 0.56 83 1.67 0.65 99
FCOT Total 33.86 8.07 83 36.40 10.03 99^
PCOT Total (scale) 1.99 0.47 83 2.14 0.59 99
TAM Total 5.42 3.30 83 6.13 3.56 99
TAM Total (scale) 1.36 0.82 83 1.53 0.89 99
TAM Classes 2.65 1.91 83 3.30 2.15 99
TAM Classes (scale) ^1^1 1.33^
'
0.95 83 1.65 1.07 99
TAM Grad School^^ 2.83 2.02 83 2.82 2.15 99
TAM Grad School (scale) 1.42 1.01 83 1.41 1.08 99
ALOCS Total 12.77 3.73 81 12.23 3.71 99
62
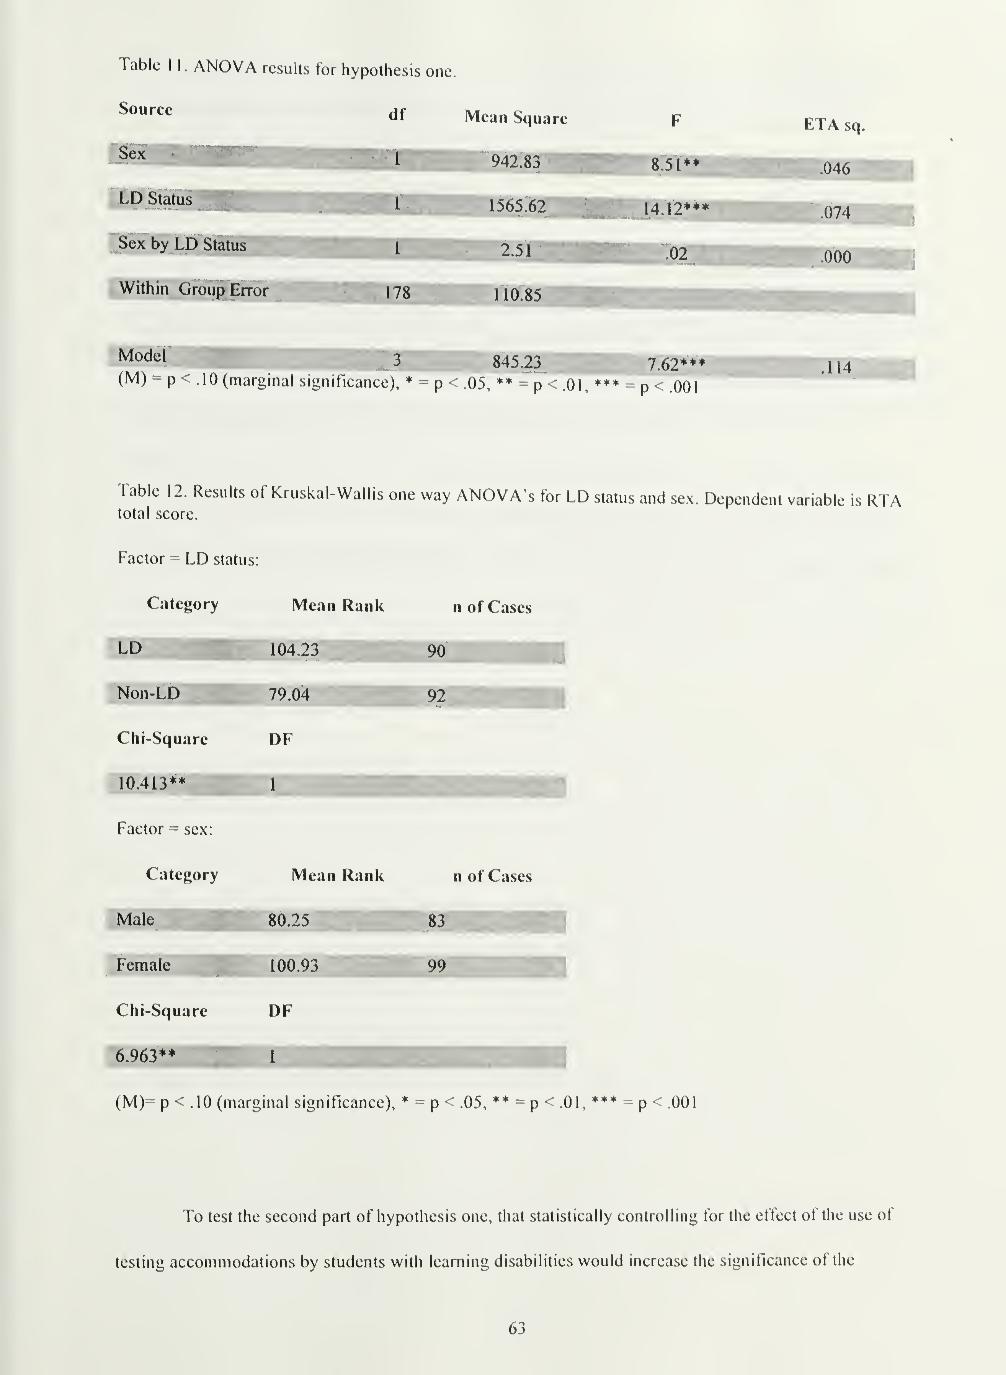
Table II. ANOVA results for hypothesis one
Source
'Sex
LD
Sex by LD^S^
Within Group Erf^
Model 3 g4523 7.62***(M) - p .10 (marginal significance), * - p - .05, ** -
p .01, - p < .001
114
Table 12. Results of Kruskal-Wallis one way ANOVA^s for LD status and sex. Dependent variable is RTAtotal score.
Factor = LD status:
Category Mean Rank n of Cases
LD 104.23 90
Non-LD 79.04 92 i
Chi-Square DF
10.413**. ,
1
Factor = sex:
Category Mean Rank n of Cases
Male 80.25 83
Female 100.93 99'
Chi-Square DF
6.963** 1
(M)= p < .10 (marginal significance), = p < .05, ** = p < .01, = p < .001
To test the second part of hypothesis one, that statistically controlling for the effect of the use of
testing accommodations by students with learning disabilities would increase the significance of the

difference in test anxiety between the two groups, a mulfple regression analysis was used, w.th LD status,
sex, use of general support services, and use of testing support services (recall that all students without
learning disabilities received O's for these use of services scores, while students with learning disabilities'
scores on these variables were computed from their LOSS tile) as independent variables, and RTA total
score as the dependent variable. Categorical variables (e.g., LD status and sex), each with k groups, were
recoded into a series of A-1 dummy variables, thus meaningful regression coefficients for these categorical
variables as a whole were not available, though their unique contribution to the overall R squared (Rsq),
over and above the combined effects of the other variables in the equation, was tested. The overall
regression was significant, F(4, 177) = 6.43, p < .001, with an overall Rsq of .13. The results of the
hypothesis tests (significance of Rsq change) for each variable indicated that use of testing support services
and use of general support services did not have a significant effect on student's test anxiety scores, with
each making a unique contribution of less than 1% of the total Rsq. Regression data is presented in Table
13.
64
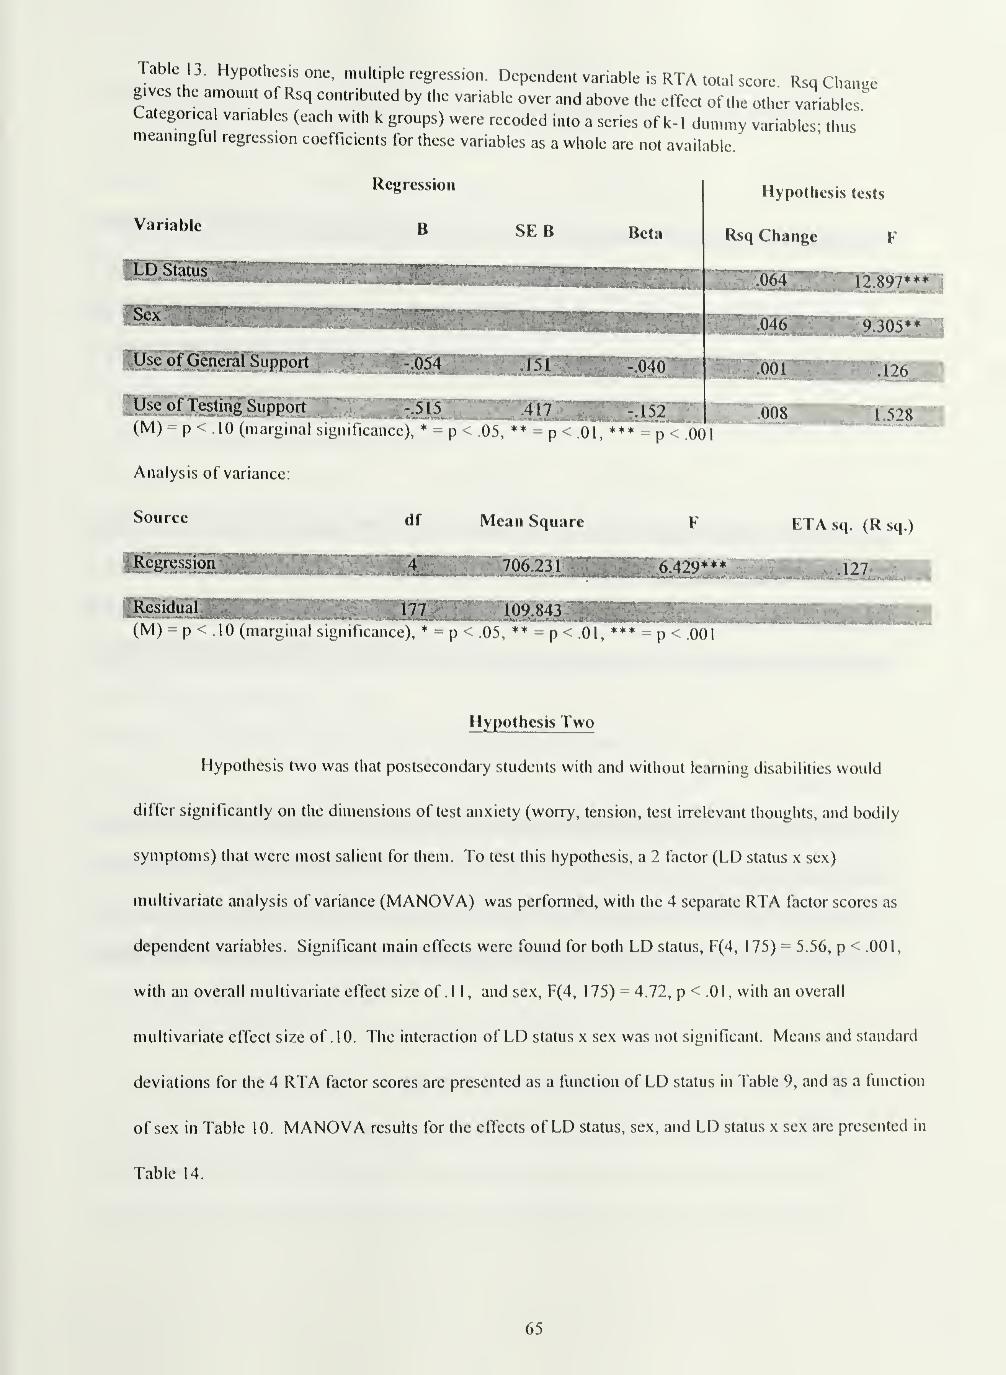
Table 13. Hypothesis one, multiple regression. Dependent variable is RTA total score Rsq Chaneegives the amount of Rsq contributed by the variable over and above the effect of the other variablesCategorical variables (each with k groups) were recoded into a series of k-1 dummy variables' thus
'
meaningful regression coefficients for these variables as a whole are not available
Variable
Regression
B SE B Beta
Hypothesis tests
Use of GenePSFSBfjpSif'W^
Usebftestitig Support -.515
(M) p .10 (marginal sigiiilkaiicc), *p
Analysis of variance:
05, * = p<.o'i,*** -p-^.OOl
Rsq Change
:064
.00
.008
1 2.897***
9.305
126
*^?528
Source df
V.-.- -t.-'-^d'^-'r-. ~^-r^
Mean Square
'706231
(M) = p .10 (marginal significancc)?^^^^ - p <*.01, *** = p < .001
ETAsq. (Rsq.)
Hypothesis Two
Hypothesis two was that postsecondary students with and without learning disabilities would
differ significantly on the dimensions of test anxiety (worry, tension, test irrelevant thoughts, and bodily
symptoms) that were most salient for them. To test this hypothesis, a 2 factor (LD status x sex)
multivariate analysis of variance (MANOVA) was pcrfonncd, with the 4 separate RTA factor scores as
dependent variables. Significant main effects were found for both LD status, F(4, 175) = 5.56, p < .001,
with an overall multivariate effect size of . 1 1 , and sex, F(4, 1 75) ^ 4.72, p < .0 1 , with an overall
multivariate effect size of . 10. The interaction of LD status x sex was not significant. Means and standard
deviations for the 4 RTA factor scores are presented as a function of LD status in Table 9, and as a function
of sex in Table 10. MANOVA results for the effects of LD status, sex, and LD status x sex are presented in
Table 14.
65
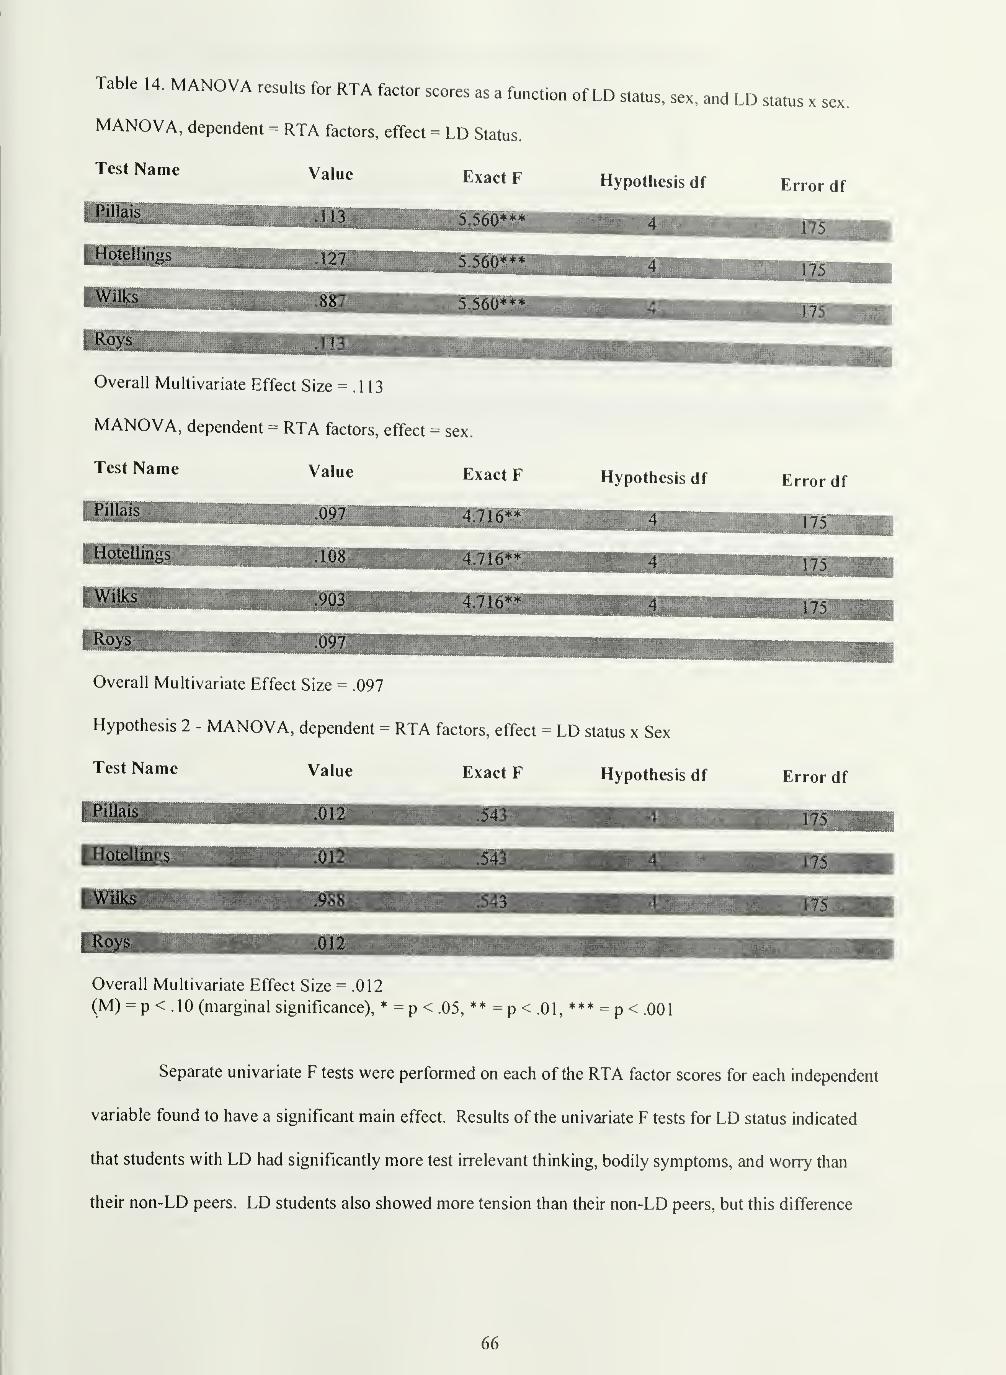
Table 14. MANOVA results for RTA factor scores as a function of LD status, sex, and LD status x
MANOVA, dependent = RTA factors, effect = LD Status.
Test Name Value
' Pillais
sex
Exact F Hypothesis df
LHotelliiigi
fWilHJ
Overall Multivariate Effect Size = .113
MANOVA, dependent = RTA factors, effect = sex.
Test Name
Hoteilings
Value Exact F Hypothesis df
rWilks 4.716
Overall Multivariate Effect Size = .097
Hypothesis 2 - MANOVA, dependent = RTA factors, effect = LD status x Sex
Test Name Value Exact F Hypothesis df
Overall Multivariate Effect Size = .012
(M) = p < .10 (marginal significance), * = p < .05, **=p<.0I,*** = p<.001
Error df
175
175
, 175'""^
Separate univariate F tests were performed on each of the RTA factor scores for each independent
variable found to have a significant main effect. Results of the univariate F tests for LD status indicated
that students with LD had significantly more test irrelevant thinking, bodily symptoms, and worry than
their non-LD peers. LD students also showed more tension than their non-LD peers, but this difference
66
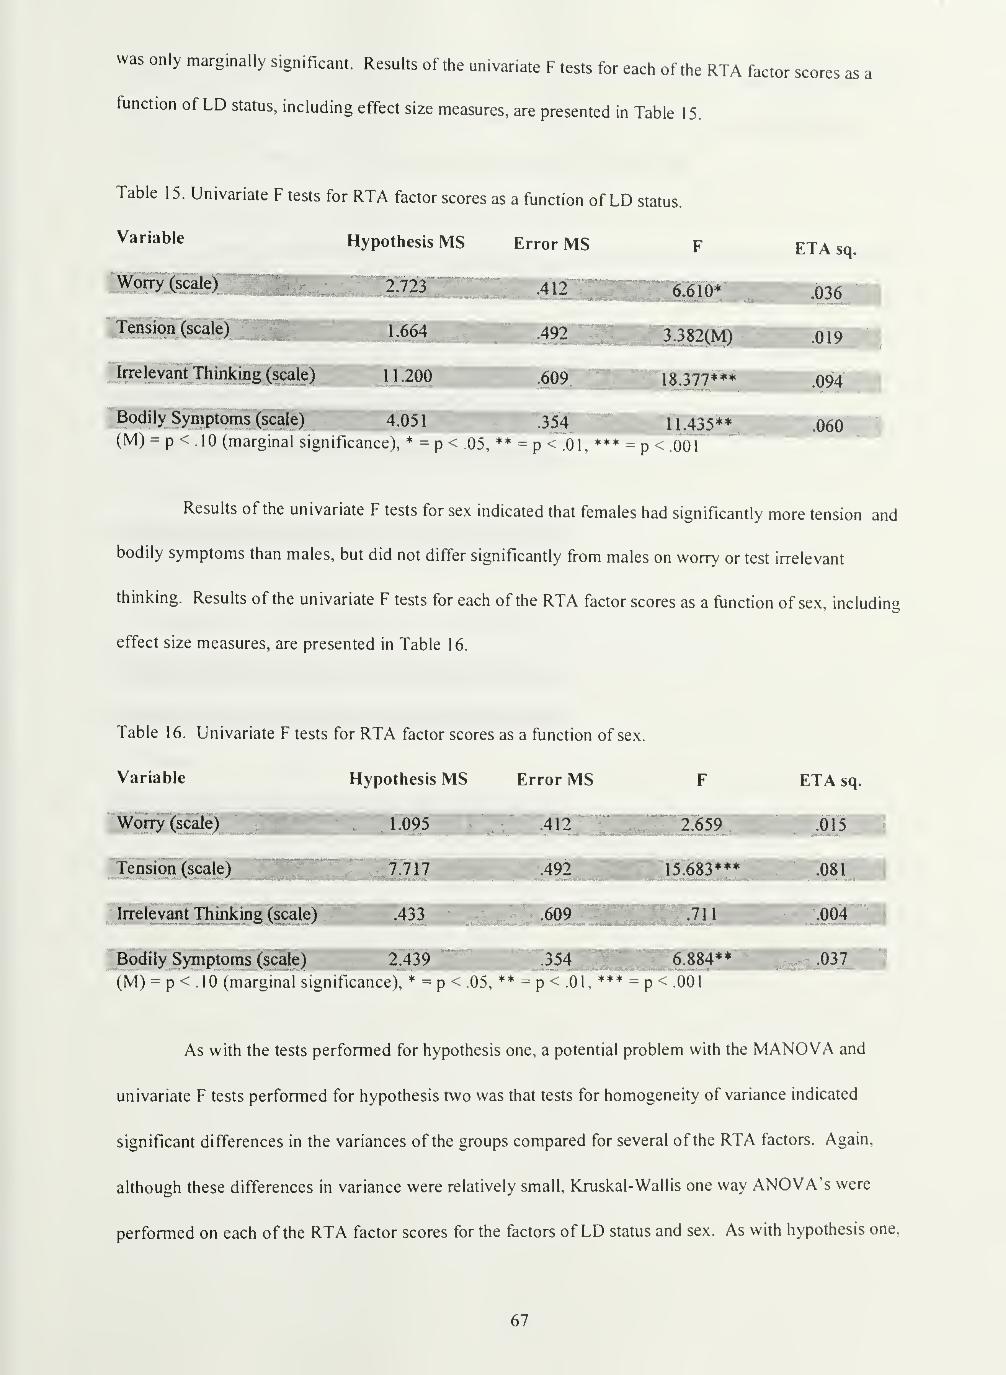
was only marginally significant. Results of the univariate F tests for each of the RTA factor scores as a
function of LD status, including effect size measures, are presented in Table 15.
Table 15. Univariate F tests for RTA factor scores as a function of LD status.
Variable Hypothesis MS Error MS
3.382(M)
18.377***
Tension (scale) |
Irrelevant Thinking (scale)
Bodily Symptoms (scale) " 4.051 .354 ||||p 11.435**(M) = p < .10 (marginal significance), * = p < .05, ** = p < .01 ,
** = p < .001
ETA sq.
.019
.094
.060
Results of the univariate F tests for sex indicated that females had significantly more tension and
bodily symptoms than males, but did not differ significantly from males on worry or test irrelevant
thinking. Results of the univariate F tests for each of the RTA factor scores as a function of sex, including
effect size measures, are presented in Table 16.
Table 16. Univariate F tests for RTA factor scores as a function of sex.
Variable
'Worry (scafe)
Tension (scale
Irrelevant Thinking (scale)1
Hypothesis MS
095
Error MS
412
492
.609
2,659
ETA sq.
015
Bodily Symptoms (scale) liiif 2.439 pi^^ .354 6.884**
(M) = p < .10 (marginal significance), * - p < .05, ** = p < .01, *** = p < .001
r .037
As with the tests performed for hypothesis one, a potential problem with the MANOVA and
univariate F tests performed for hypothesis two was that tests for homogeneity of variance indicated
significant differences in the variances of the groups compared for several of the RTA factors. Again,
although these differences in variance were relatively small, Kxuskal-Wallis one way ANOVA's were
performed on each of the RTA factor scores for the factors of LD status and sex. As with hypothesis one.
67

results ol-thcsc nonpar;„nc.ric tests nurroral tl.osc of the origi.ial MANOVA a,ul I icsis, corrohoraln,^, ihc
accuracy ol these ori^^inal tests. Res.ilts ol thc Kruskal-Wallis one way ANOVA's lor each ol lhe RI A
(actor scores as a tiinclion ol I ,| ) status ami sex are presented in Tables 17-20.
Table 17, Results of Kruskal-Wallis one way ANOVA's lor LI) status and sex. Dependent variable is RTAWorry scale score.
Factor M) status:
CatcKory Mvm\ Uank n of ( ascs
100.34 90
Noa-LD 82.85 92
C.'lii-S(niari' DF
5.048*1
Factor - sex:
Mean Rank n oTCa.scs
Male 85.52 83
Female 96.51
Chi-Sqii!ire DF
1.978 1
(M) p .10 (lna^^inal si^nilkaiice), * ^ p < .05, ** p .01,*** p- .001
68

Table 18 Results of Kruskal-Wallis one way ANOVA's for LD status and sex. Dependent variable is RTATension scale score.
Factor = LD status:
Category Mean Rank n of Cases
_LD ps.oivnHHNon-LD S5.13 ^^^^P
Chi-Square DF
2:743(M) 7 ;
Factor = sex:
Category Mean Rank n of Cases
Female jHHHP 04.66
Chi-Square DF
|i3.653***
(M)= p < .10 (marginal significance), * = p < .05, ** = p < .01, *** = p < .001
69
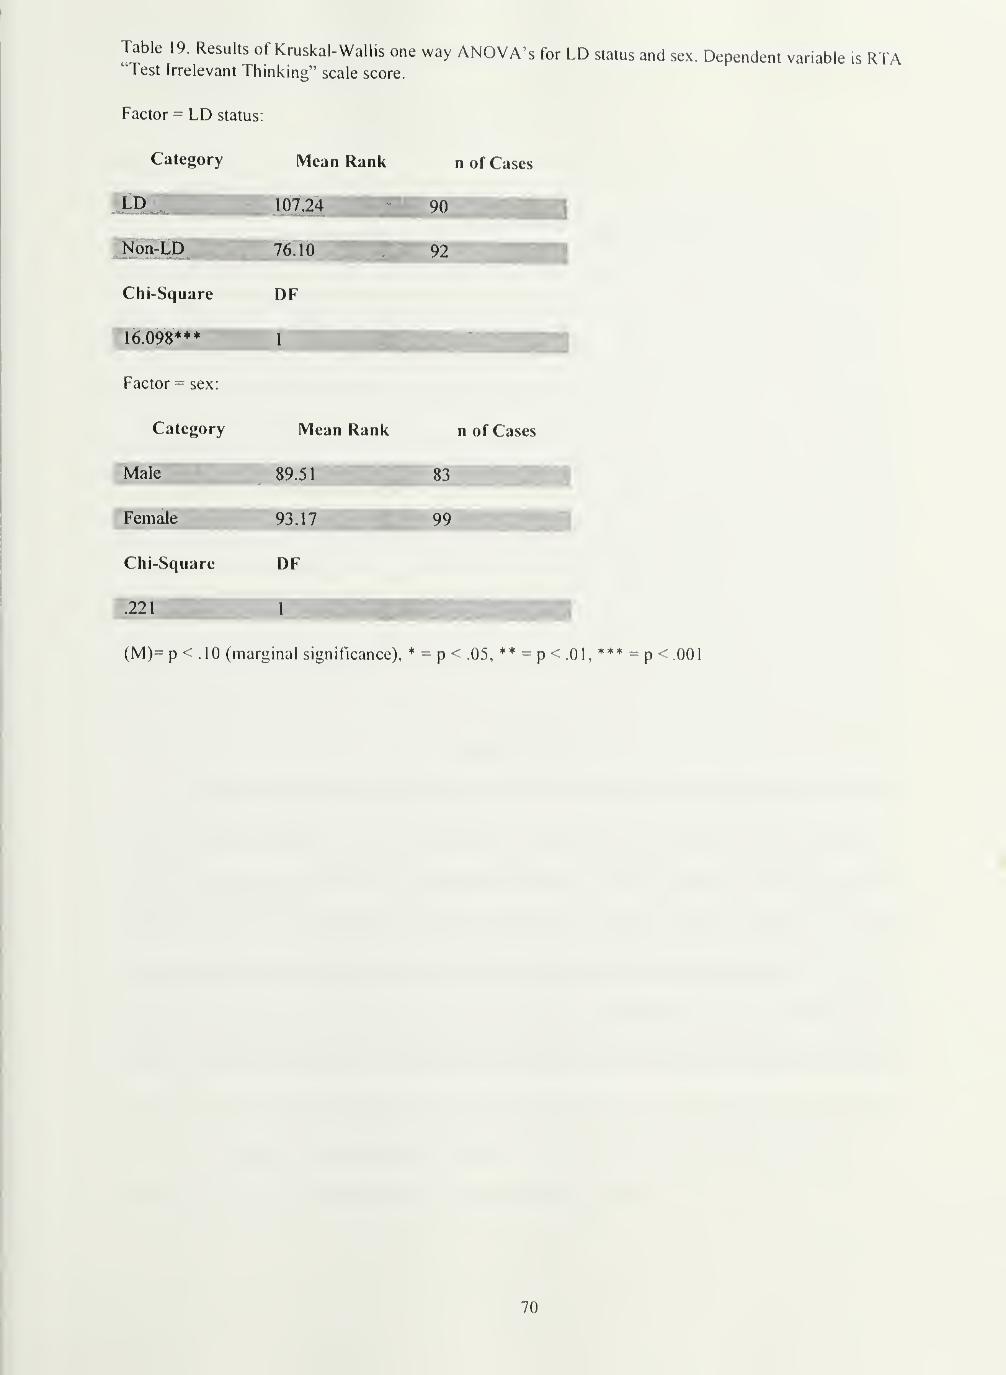
Table 19. Results of Kruskal-Wailis one way ANOVA's for LD status and sex. Dependent variable is RTA'Test Irrelevant Thinking" scale score.
Factor - LD status:
Category Mean Rank n of Cases
LD ,...107,24 90
Noa-LD 76.10 " 92 WtMChi-Square DF
16.098*** 1
•
Factor = sex:
Category Mean Rank n of Cases
Male 89.51 83
Female 9317 99
Chi-Square DF
.221
(M)= p < .10 (marginal significance), * = p < .05, ** = p < .01, = p < .001
70
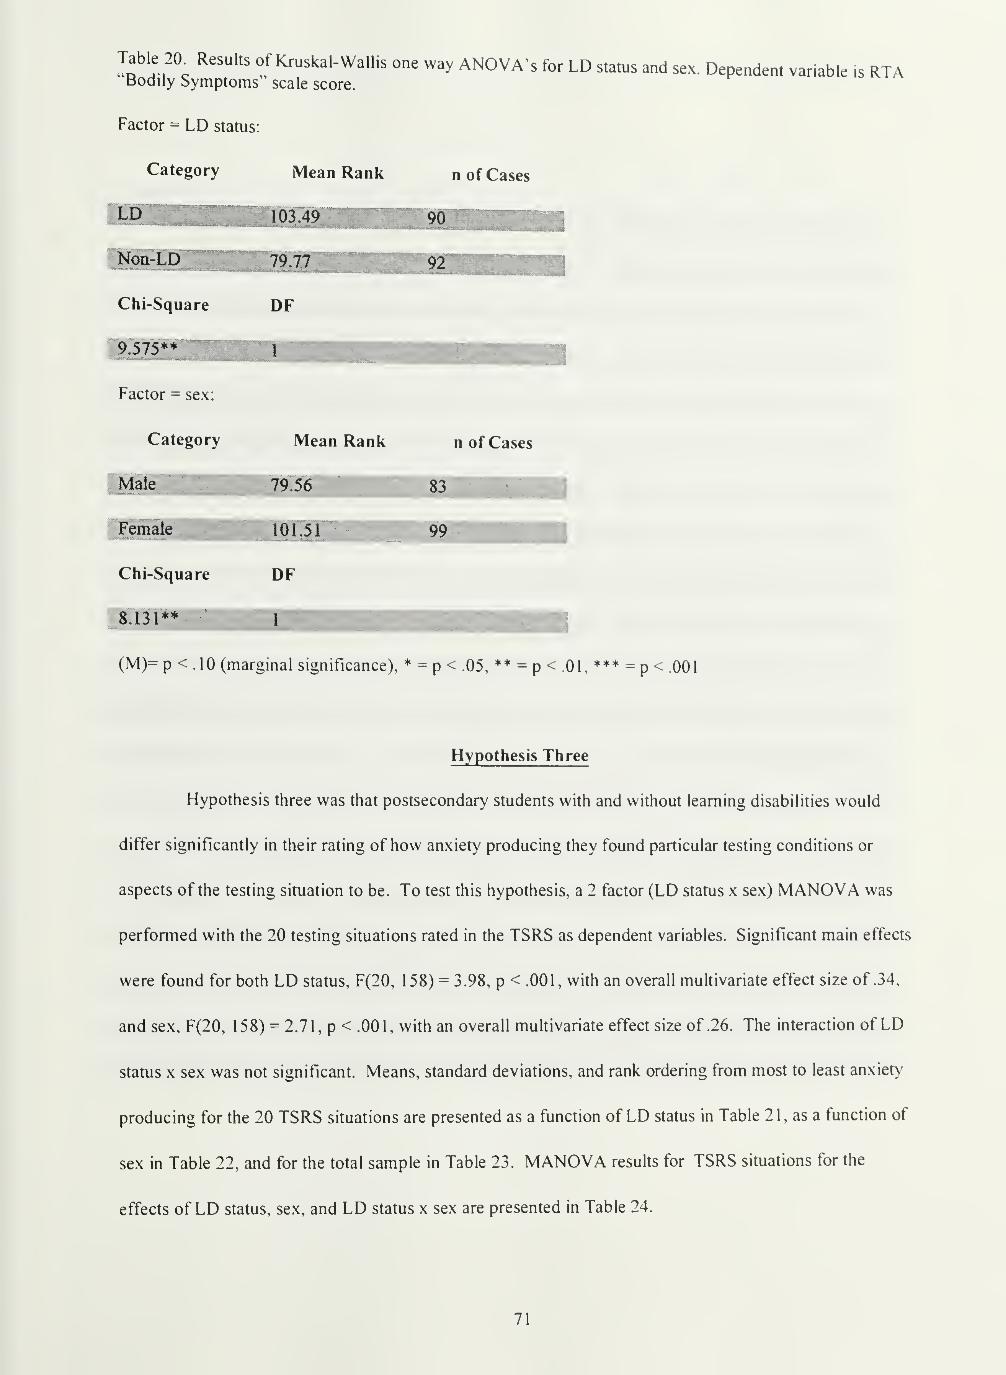
Table 20^ Results of ICruskal-Wallis one way ANOVA's for LD status and sex. Dependent variable is RTABodily Symptoms scale score.
Factor = LD status;
Category Mean Rank n of Cases
Non-LD ^
Chi-Square DF
9,575
Factor = sex;
Mean Rank n of Cases
IT
(M)= p < .10 (marginal significance), * = p < .05, ** = p < .01, *** = p < .001
Hypothesis Three
Hypothesis three was that postsecondary students with and without learning disabilities would
differ significantly in their rating of how anxiety producing they found particular testing conditions or
aspects of the testing situation to be. To test this hypothesis, a 2 factor (LD status x sex) MANOVA was
performed with the 20 testing situations rated in the TSRS as dependent variables. Significant main effects
were found for both LD status, F(20, 158) = 3.98, p < .001, with an overall multivariate effect size of .34,
and sex, F(20, 1 58) = 2.7 1 , p < .00 1 , with an overall multivariate effect size of .26. The interaction of LD
status X sex was not significant. Means, standard deviations, and rank ordering from most to least anxiety
producing for the 20 TSRS situations are presented as a function of LD status in Table 21, as a function of
sex in Table 22, and for the total sample in Table 23. MANOVA results for TSRS situations for the
effects of LD status, sex, and LD status x sex are presented in Table 24.
71
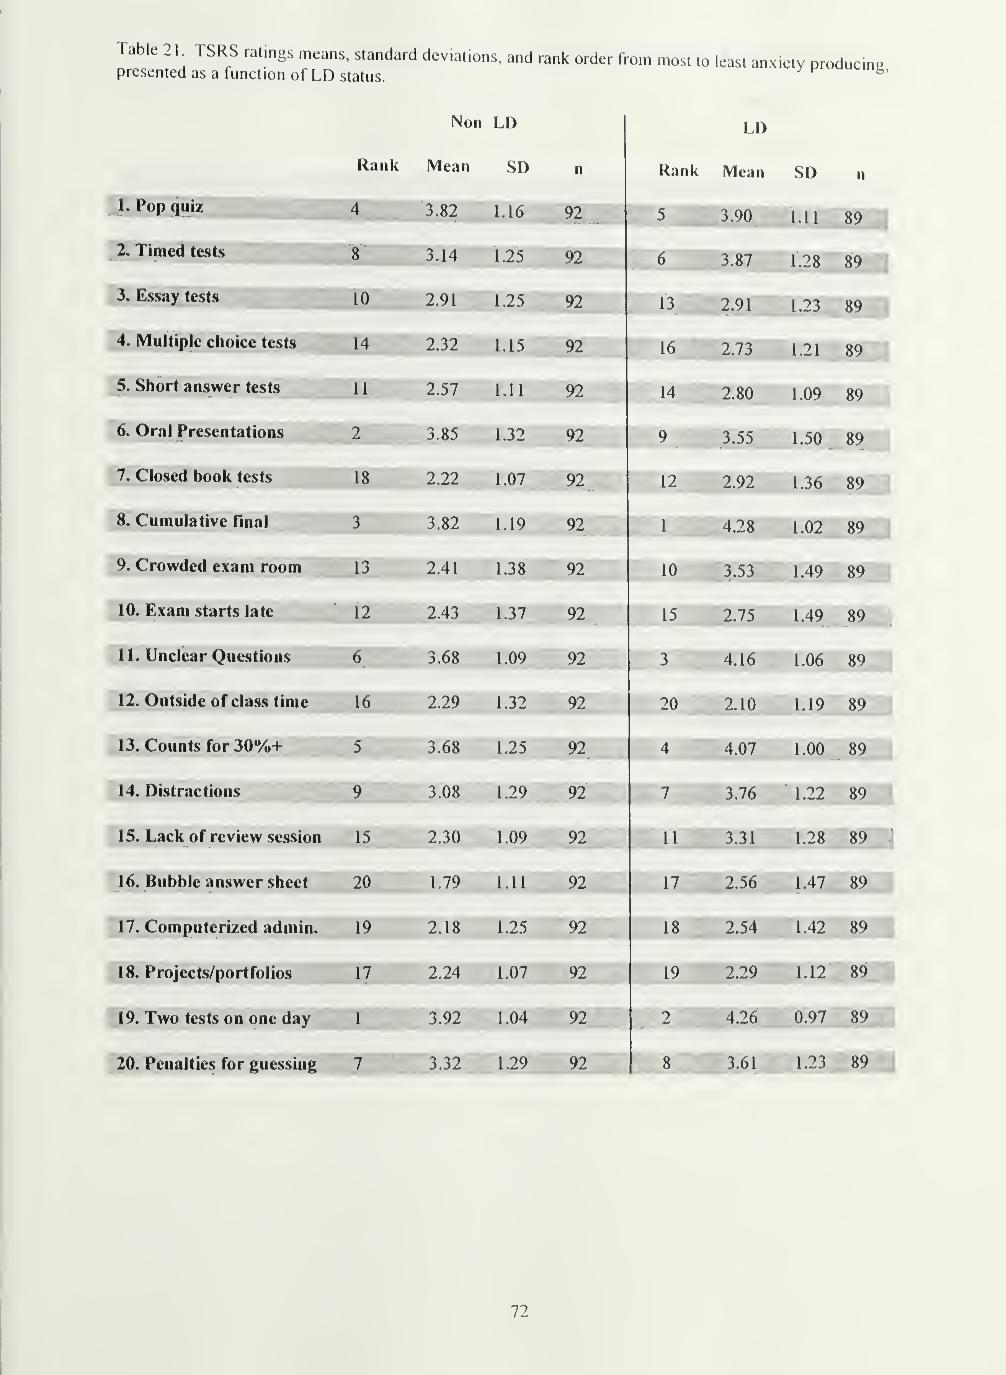
Table 21. TSRS ratings means, standard deviations, and rank order fropresented as a function of LD status.
m most to least anxiety producing.
Non LD
Rank Mean SD n
J. Pop quiz 4 3.82 1,16 92
LD
Rank Mean SD n
5 3.90 Lll 89
2* Timed tests 8 3.14 1.25 92 6 3.87 1.28 89
3. Essay tests jHf 10 2.91 1.25 92 13 2.91 1.23 891
4. Multiple choice tests 14 2.32 1.15 92 16 2.73 1.21 89
5. Short answer tests 11 2.57 1.11 92 14 2.80 1.09 89
6, Oral Presentations 2 3.85 1.32 92 9 3.55 1.50 89'
7, Closed book tests 18 2.22 1,07 92 12 2.92 1.36 89
8, Cumulative Tinai 3 3.82 1,19 92 1 4.28 1.02 89
9- Crowded exam room 13 2.41 1.38 92 10 3.53 1.49 89
10. Exam starts late 12 2.43 1,37 92 15 2.75 1.49 89
ll.Unclear Questions 6 3.68 1.09 92 3 4.16 1.06 89
12. Outside of class time 16 2.29 1.32 92 20 2.10 1.19 8MI
13. Counts for 30%+ 5 3.68 1.25 92 4 4.07 1.00 89
14. Distractions 9 3.08 1.29 92 7 3.76 1.22 89
15. Lack of review session 15 2.30 1.09 92 11 3.31 1.28 89
16* Bubble answer sheet 20 1.79 1,11 92 17 2.56 1.47 89 ,
17. Computerized admin. 19 2.18 1,25 92 18 2.54 1.42 89
18. Projects/portfolios ^K2.24 1.07 92 19 "2.29 1.12"^8r^
J9, Two tests on one day 3.92 1,04 92 2 4.26 0.97 89
20. Penalties for guessing 7 3.32 1.29 92 8 3.61 1.23 89
72
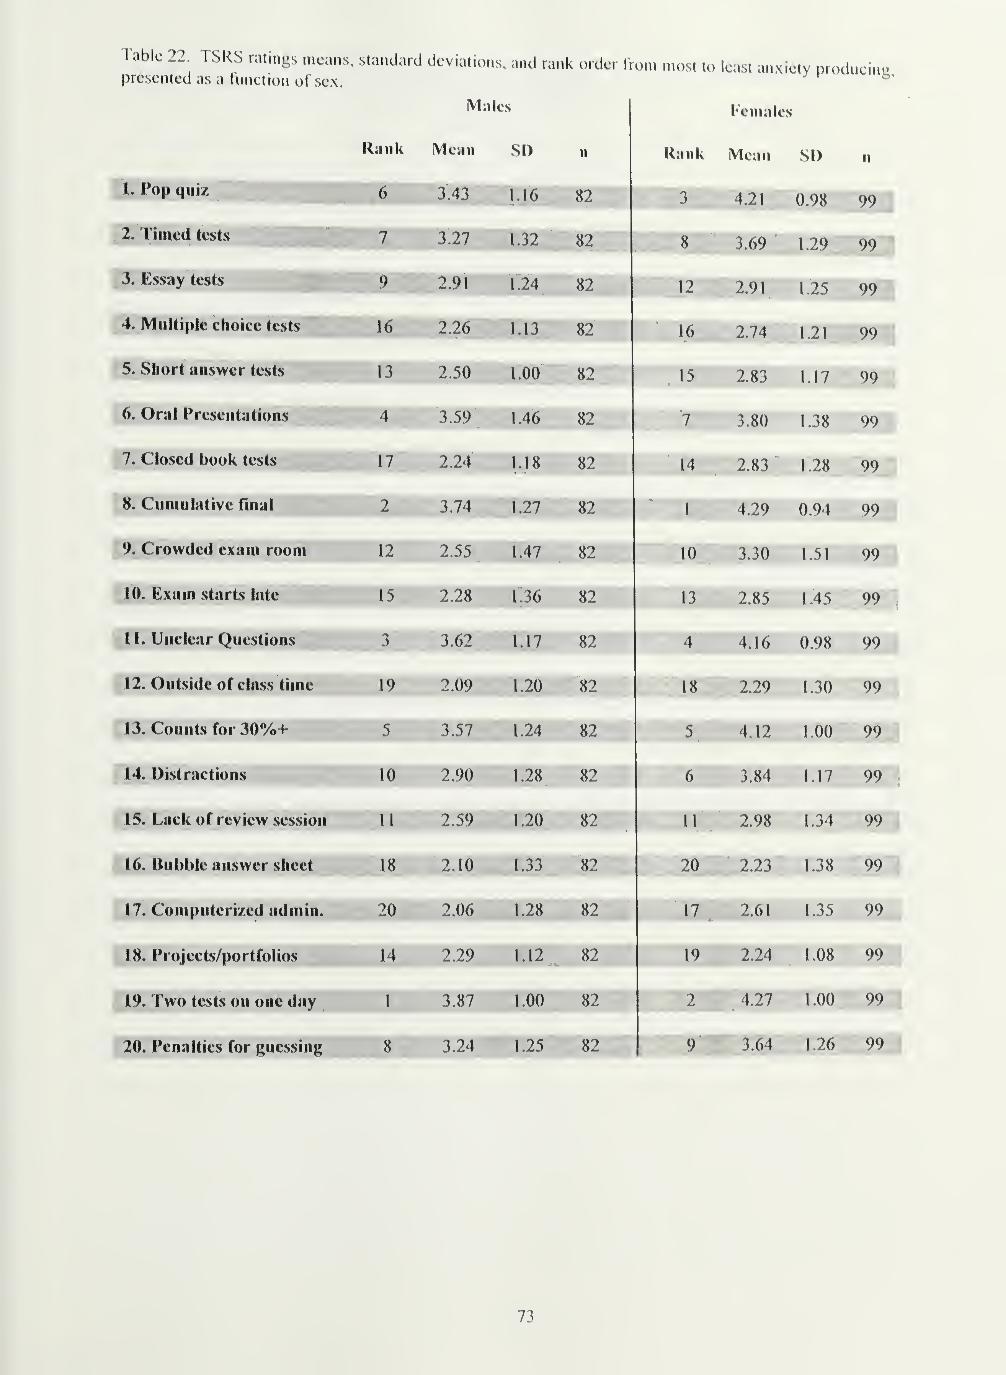
Table 22. TSRS ratings means, standard deviations, and rank order frompresented as a function of sex.
most to least anxiety producing,
Males
Rank Mean SD n
Females
r\«iiiK iTit«in c>Vf n
L Pop quiz 6 3.43 1.16 82 J H.Z 1 l/.Vo yy
2. Timed tests flHHHHHHHH ^-^^ 1*32 8^ 0 j*y}y l,Z.y yy
3. Essay tests WKKKKKKKK^ 2.91 1 24WtKl z.v 1 1 .zj VV
4. Multiple choice tests JHHHHH||^ L13 82 16 9 74 191 00»^' z. /*t 1 .z 1 yy
5. Short answer tests IHHHHHl 2.50 1 .00 82 IS 9 117 001 z.oJ 1.1/ yy
6. Oral Presentations MHHM 59 ] 4^ 1 ^ 80 1 '\% 00
7. Closed book tests ^''^''VHM Ll&^g&2 14 9 1 9Jl 001 t z.oj 1 .zo yy
8. Cumulative final "^^B 3.74 1.27'''''**^21 4 99 0 94 00
9. Crowded exam room 12 2.55 1.47 82 10 3 30 151 99
10. Exam starts late liip 15 2.28 136 82 13 2 85 1 45 99
1 1. Unclear Questions ^13.62 1.17 82 4 4 16 0 98 99
1 2. Outside of class time 19 2.09 1 .20 82 18 2 29 1 30 99
13. Counts for 30%4- 5 3.57 1.24 82 5 4.12 1.00 99
14. Distractions 10 2.90 1.28 82 6 3.84 1.17 99
15. Lack of review session 1 1 2.59 1.20 82 11 2.98 1.34 99
16. Bubble answer sheet 18 2,10 1.33 82 20 2.23 1.38 99
17. Computerized admin. 20 2.06 1.28 82 UPP 2.61 1.35 99
18. Projects/portfolios JHjjjp 14 2.29 K12 82 19 2.24 1.08 99
19. Two tests on one day 1 3,87 100 82 2 4.27 1.00 99
20. Penalties for guessing 8 3.24 1.25 82^ 9 3.64 1.26 99
73
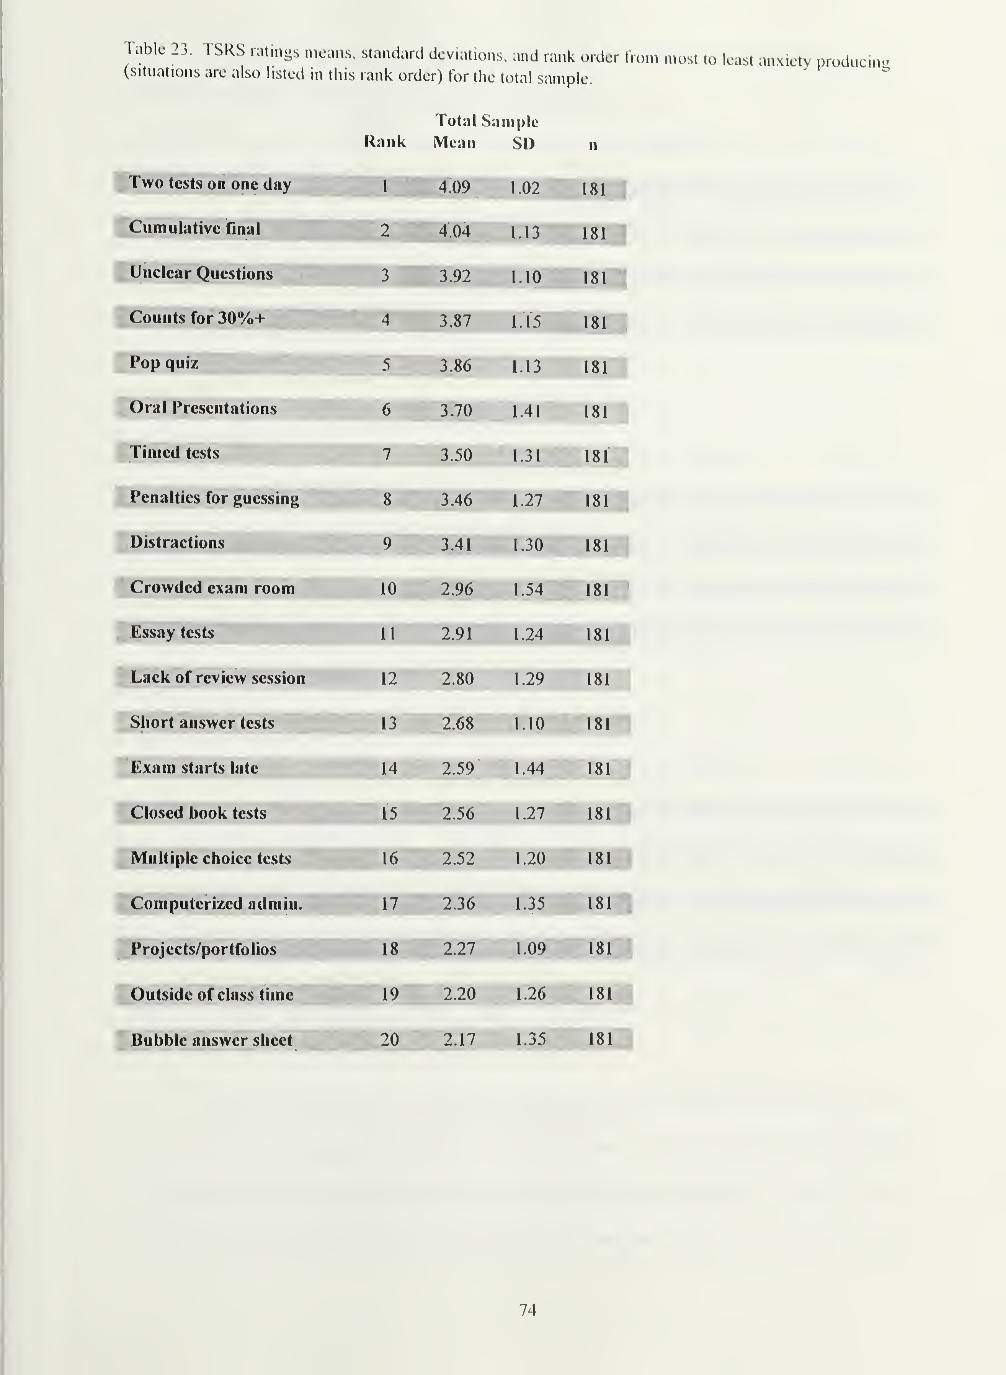
Tabic 23. TSRS ratings means, standard deviations, and rank order from most to least anxiety producin>.(situations are also listed in this rank order) for the total sample.
"
Total SampleRank Mean SI) n
Two tests on one day _ 1 4.09 1.02 181
Cumulative flnal _ 2 4.04 1.13 181
Unclear Questions "3 3.92 I.IO 181
Counts for 30%+ "4 ' ~3 87 1.15 181
Pop quiz 5 3.86 1.13 181
Oral Presentations 6 3.70 1.41 181
Timed tests 7 3.50 1.31 181
Penalties for guessing 8 3.46 1.27 181
Distractions 'flHft, 9 3.41 1.30 181
Crowded exam room 10 2.96 1.54 181
Essay tests 11 2.91 1.24 181
Lack of review session 12 2.80 1.29 181
Short answer tests 13 2.68 1.10 181
Exam starts late 14 2.59 1.44 181
Closed book tests 15 2.56 1.27 181
Multiple choice tests 16 2.52 120 181
Computerized iidmin.jMMMMH|to>
2 35 135 18I
Projects/portfolios 18 2.27 1.09 181
Outside of class time 19 2.20 1.26 181
Bubble answer sheet 20 2.17 1.35 181
74
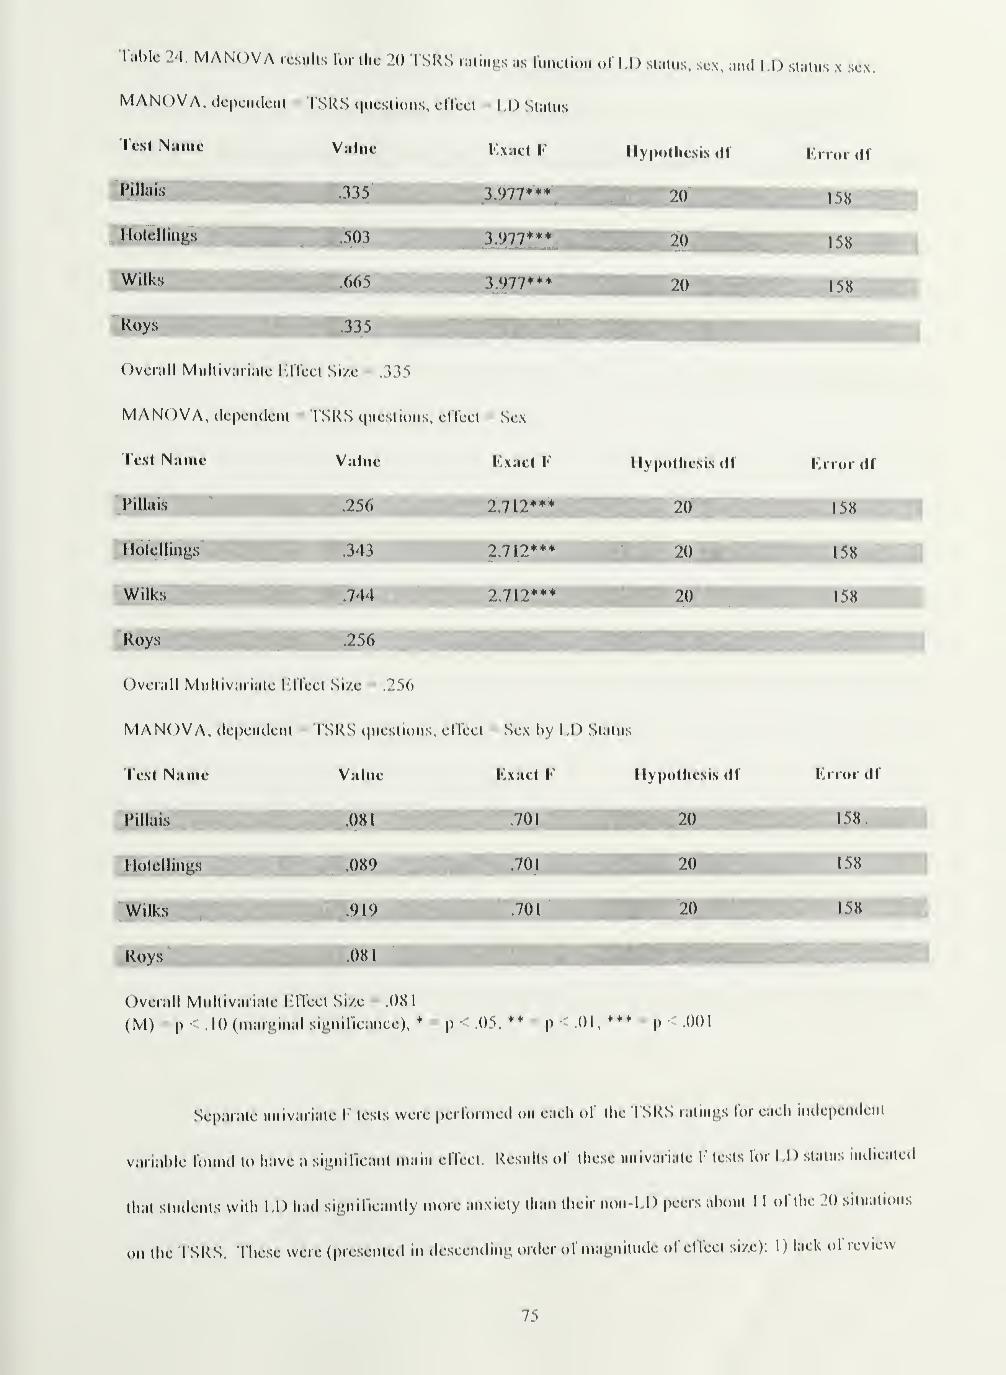
Tabic 24. MANOVA results lor the 20 I NKS ralmgs as lunction »r LI) status, sex. and l.D status x sex
MANOVA. dependent I SRS questions, elTett 1,1) Status
'Icsl Name Value KxacJ F llypodiesis (IT Frior (If
Pillais .335 '] 977** j^^lgmm^ 20 MMm 158
llulellings BHHB1 .503 3 977**
Wilks WHtBBKKi0665 jggi^ 3.977*** 158
H1335 0HOverall Multivariate I'.ITect Si/e 135
MANOVA, dependent TSRS questions, elTect Sex
l"t's( Nilmo Value FxiKl F lly|)<illicsis (If F.rror df
•Pilluis .256 2,712*** 20 158
.343 2.712*** 20 158
Wilks WtKKKmKMm •'^'^'^ —HK2.712*** nil 58
JHi
Overall Multivariate lUTeet Size .256
MANOVA, dependent TSRS questions. elToct - Sex by .1) Status
Test Name Value Fxact F Hypothesis (If F.rror (If
Pilluis .081 .701 20 158,
Overall Multivarialc l .lTccl Size - .081
(M) |) 10 (marginal siynificancc), * p .05, ** p Ol,*** p .001
Separate univariate I- tests were perl'ornietl on each ol ilu- I SRS ralin^^s lor each inilepemlcnt
variable Ibinul to have a siiinificant main ellecl Results ol these uinvariate I" tests lor I.I) status nulieatecl
that students with I D hail sij^nil leanlly more anxiety than then ntHi-LI ) peers about 1 1 of the 20 situations
ihe ISRS, These were (|)resenletl ni ileseending order ofmagmtude olellecl si/x): I) lack ol reviewon
75

sessions, 2) crowded exam room, 3) timed tests, 4) closed book (no notes can be used) tests, 5) computer
scan ("bubble") answer sheets, 6) distractions, 7) cumulative final exams, 8) unclear test questions, 9) tests
counting for more that 30% of final course grade, 10) multiple choice tests, and 11) two tests on one day.
Marginally significant differences in anxiety levels between the two groups (again, LD students more
anxious) were found for 1 ) tests admistered on computer, and 2) penalties for guessing. Results of the
univariate F tests for TSRS ratings as function of LD status, including effect size measures, are presented in
Table 25.
76
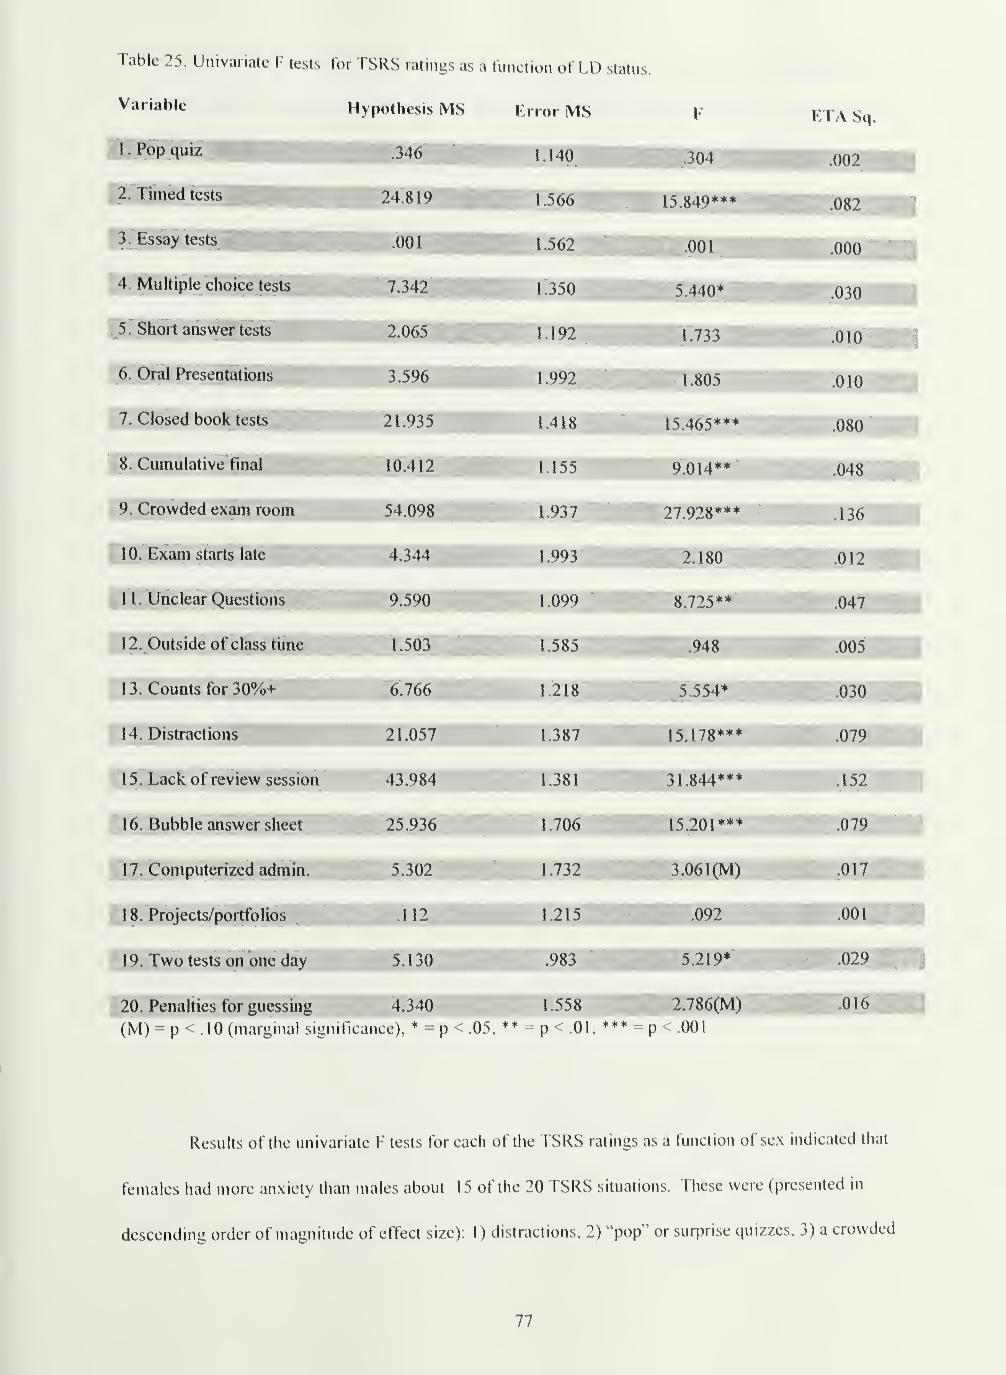
Table 25. Univariate F tests for TSRS ratings as a function of LD status.
Variable
1. Pop quiz
2. Timed tes
3. Essay tests
4. Multiple choice tests
5. Short answer tests
6. Oral Presentations
7. Closed book tes
8. Cumulative final I
9. Crowded exam room
10. Exam starts late
1 1. Unclear Questions
12. Outside of class time
13. Counts for 30%+
14. Distractions
15. Lack of review session
16. Bubble answer sheet
17. Computerized admin.
1 8. Projects/portfolios
19. Two tests on one day
3.596
21.935
10.412
54.098
4.344
9.590
1.503
6.766
21.057
43.984
25.936
1.992
1.418
1.155'
1.937
1.993
1.099
1.585
1.218
1.387
1.381
1.706
1.732
1.215
.983
1.805
15.465***
9.014
27.928***
2.180
8.725
15.178***
31.844***
iim 15.201***
I 3.06 1(M)
.092
5.219'
20. Penalties for guessing 4.340 1.558 HHf 2.786(M)
(M) = p < .10 (marginal signiticance), * - p - .05, * - p - .01, - p - .001
ETA Sq.
.002
.082
.000
.030
.010
i . .010
.080
.048
.136
.012
.047
.005
.030
.079
.152
.079
.001
.029
.016
I
Results of the univariate F tests for each of the TSRS ratings as a function of sex indicated that
females had more anxiety than males about 15 of the 20 TSRS situations. These were (presented in
descending order of magnitude of effect size): 1) distractions. 2) "pop" or surprise quizzes, 3) a crowded
77

exam room. 4) unclear test questions, 5) cumulative final exams. 6) tests counting for more than 30% of
final course grade. 7) closed book tests, 8) tests administered on a computer. 9) multiple choice tests. 10)
two tests on one day, 1 1) tests starting late. 12) lack of review sessions. 13) timed tests, 14) penalties for
guessing, and 15) short answer tests. The results of the univariate F tests for TSRS ratings as a function of
sex, including effect size measures, are presented in table 26.
78
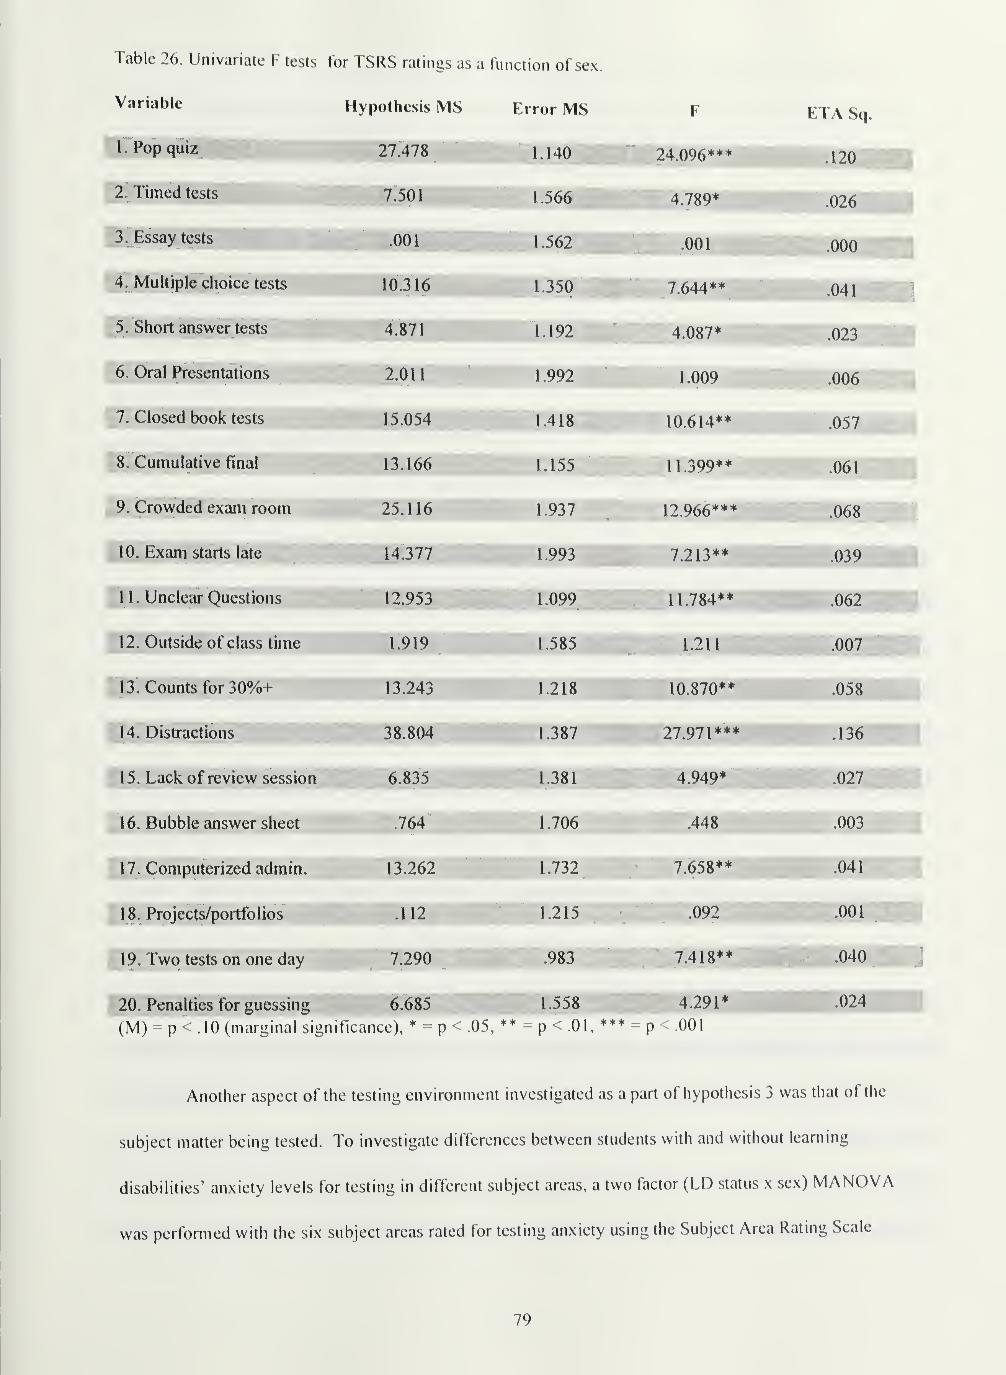
Table 26. Univariate F tests for TSRS ratings as a function of sex.
Variable
1 . Pop quiz
2. Timed tests
3. Essay tests
4. Multiple choice tests
5. Short answer tests
6. Oral Presentations
7. Closed book tests
8feC^ final
9. Crowded exam room
10. Exam starts late
1 1. Unclear Questions
12. Outside of class time j
13. Counts for 30%+
14. Distractions
15. Lack of review session
16. Bubble answer sheet
17. Computerized admin.
18. Projects/portfolios
19. Two tests on one day
20. Penalties for guessing Hiip.685 li||||H1.558 ^1^^ 4.291*
(M) - p-^ .10 (marginal significance), * - p < .05, * - p< .01, *** = p< .001
F ETA Sq.
24.096*** .120
4.789* .026
.001 .000
7.644** .041
W 4.087* .023
1.009 .006
10.614** .057
11.399** .061
12.966***1 .068
7.213** ^^^^ipf^^ffWH
03
11.784** .062
Bi.J-211 1HL. .007
,058
,136
.027
.003
.041
.001
.040
.024
Another aspect of the testing environment investigated as a part of hypothesis 3 was that of the
subject matter being tested. To investigate differences between students with and without learning
disabilities' anxiety levels for testing in different subject areas, a two factor (LD status x sex) MANOVA
was performed with the six subject areas rated for testing anxiety using the Subject Area Rating Scale
79
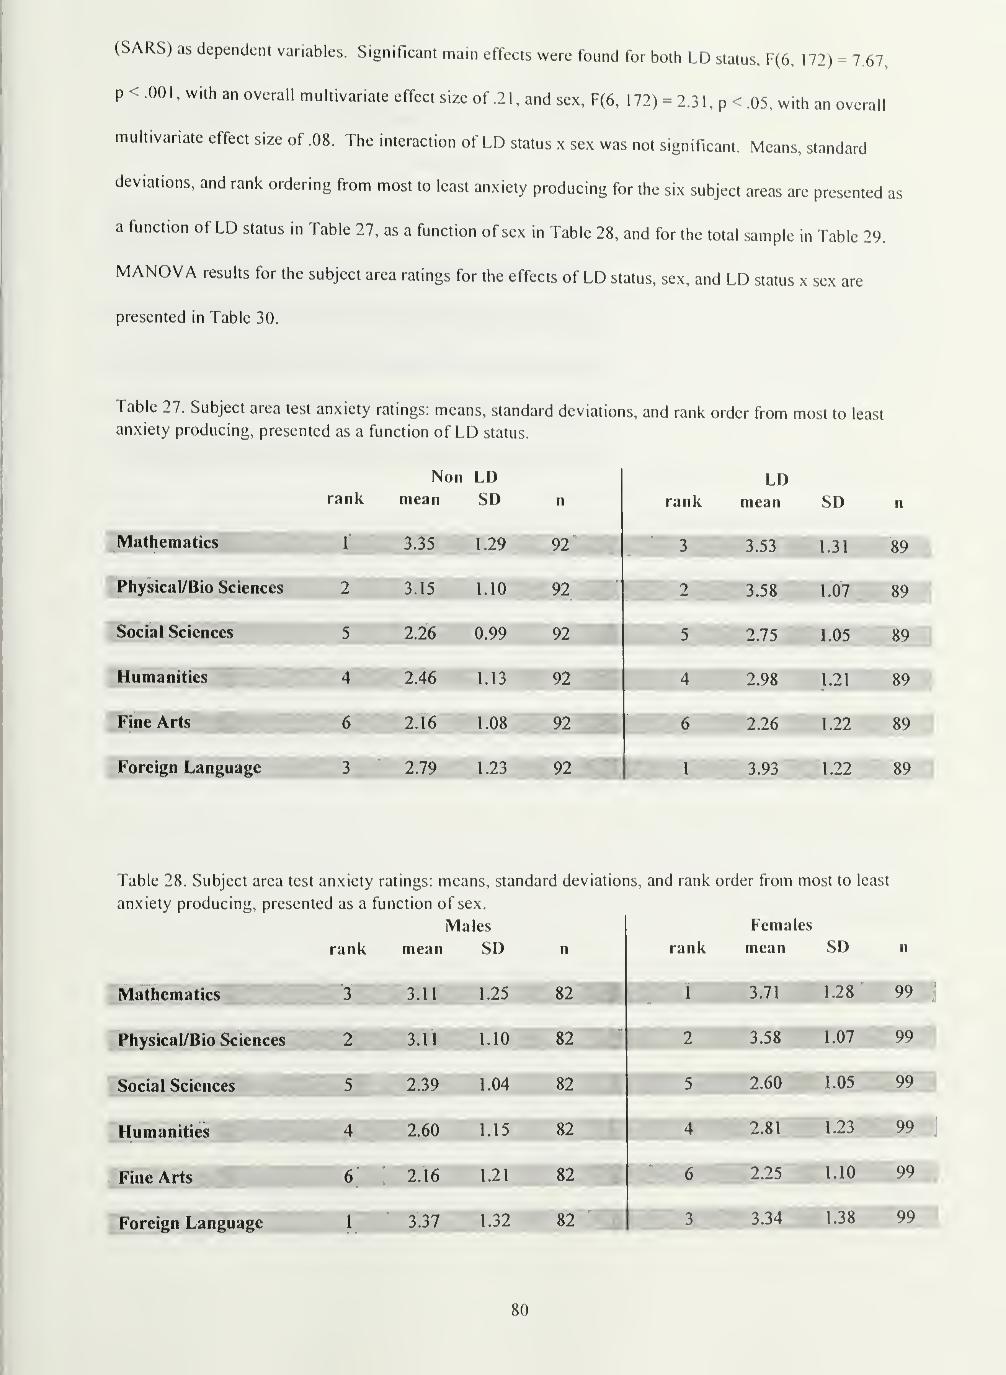
(SARS) as dependent variables. Significant main effects were found for both LD status, F(6, 172) = 7.67,
p < .001
,with an overall multivariate effect size of .2 1 , and sex, F(6, 1 72) = 2.3 1 , p < .05, with an overall
multivariate effect size of .08. The interaction of LD status x sex was not significant. Means, standard
deviations, and rank ordering from most to least anxiety producing for the six subject areas are presented as
a function of LD status in Table 27, as a function of sex in Table 28, and for the total sample in Table 29.
MANOVA results for the subject area ratings for the effects of LD status, sex, and LD status x sex are
presented in Table 30.
Table 27. Subject area test anxiety ratings: means, standard deviations, and rank order from most to least
anxiety producing, presented as a function of LD status.
Non LD LDrank mean SD n rank mean SD n
Mathematics 1 3.35 1.29 92 3 3.53 1.31 89
Physical/Bio Sciences 2 3.15 1.10 92'
3.58 1.07 89
Social Sciences 5 2.26*
0.99 92 2.75'
•"^1.05 89
Humanities 4 2.46 1.13 92 4 2.98 1.21 89
Fine Arts 6 2.16 1.08 92 6 2.26 1.22 89
Foreign Language 3 2.79 1.23 92 1 3.93 1.22 89
Table 28. Subject area test anxiety ratings: means, standard deviations, and rank order from most to least
anxiety producing, presented as a function of sex.
rank mean
Males
SD n rank
Females
mean SD n
nWalhciiiatics 3 3.11 1.25 82 1 3.71 1.28 99]
Physical/Bio Sciences 2 3.11 1.10 82 2 3.58 1.07 99
Social Sciences 5 2.39 1.04 82 5 2.60 1.05 99
Humanities 4 2.60 1.15 82 4 2.81 1.23 99
Fine Arts 6 2.16 1.21 82 6 2.25 1.10 .99
Foreign Language 1 3.37 1.32,
82 3 3.34 1.38 99
80

Table 29. Subject area test anxiety ratings: means, standard deviations, and rank order from most to leastanxiety producing (subject areas are also listed in this rank order) for the total sample.
Total Sample
rank mean SD n
Mathematics JHHI
^Physical/Bio Sciences 2 3.36 1.11 181
Foreign Language 3 3.35 L35 181 \
Humanities WtBm 4 2.71 L20 181;
Social Sciences III 5 2.50 1.05 181'
Fine Arts ^^UttHi 6 2.21 1.15 181"
81
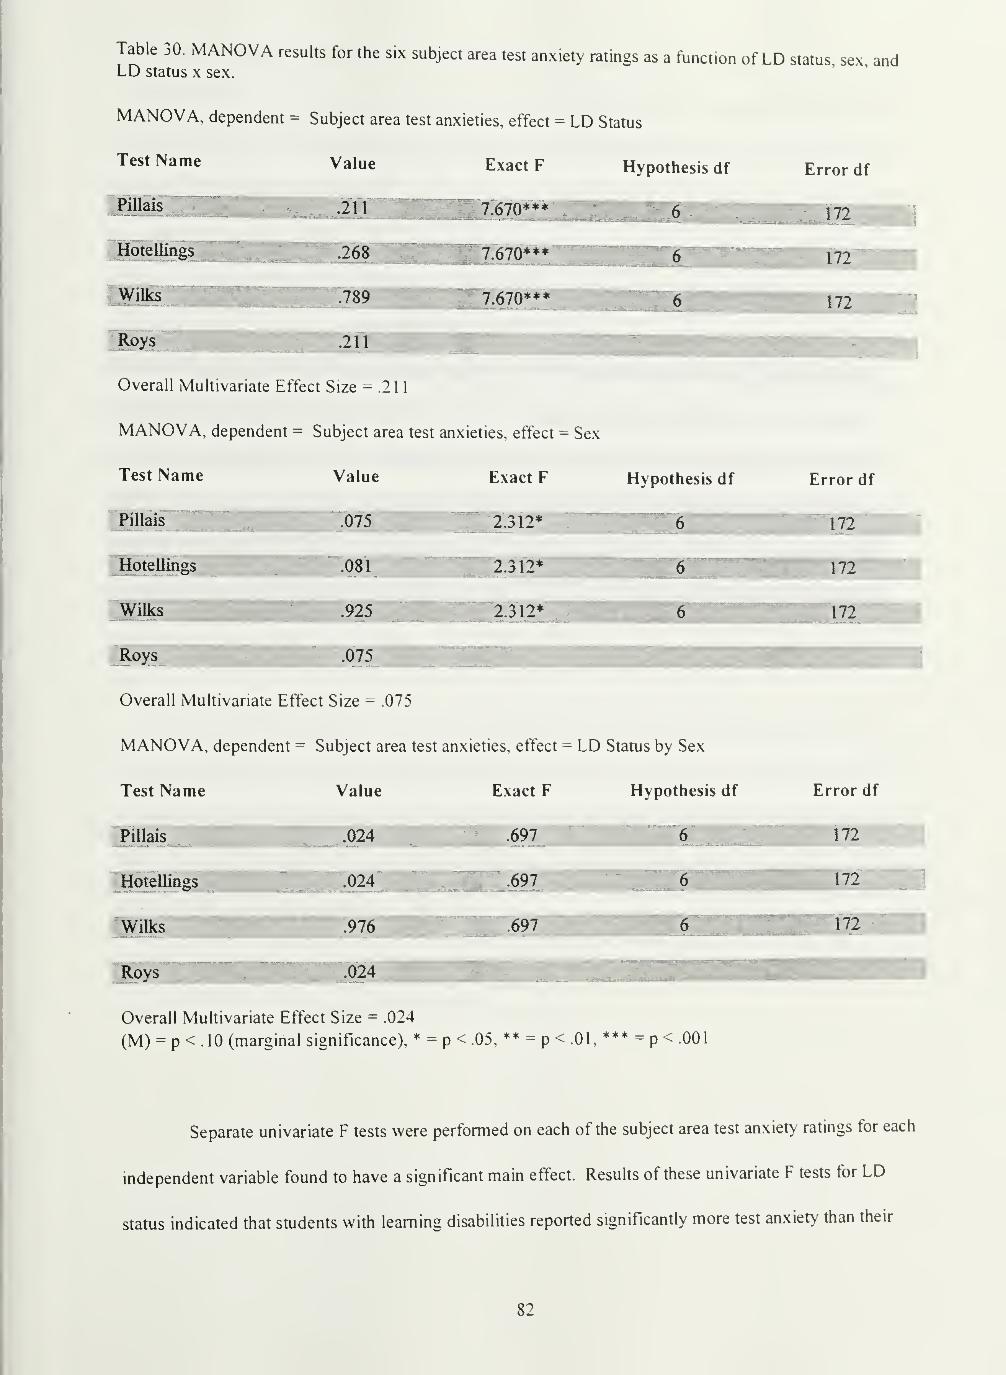
Table 30. MANOVA results for the six subject area test anxiety ratings as a ftinction of LD status, sex andLD status X sex. ''
MANOVA, dependent = Subject area test anxieties, effect = LD Status
Test Name Value Exact F Hypothesis df Error df
_piiiais IBHHBIi HE7.670*** ? 172
Hoteilmgs]|g|g||HH|1 -^^^ KL7.670*** j 172
m|789 IBB li: 7.670***
Overall Multivariate Effect Size = .211
MANOVA, dependent = Subject area test anxieties, effect = Sex
Test Name Value Exact F Hypothesis df Error df
piliais TMBBSBSBBtH075 IBK. 2.312* 1 Bi' 172
Hoteilings Sl^Hi -081 2.312* r 172
Wilks .JiH^H1.925 2.312*] iBp72
Roys ^^^^^BK075
Overall Multivariate Effect Size = .075
MANOVA, dependent = Subject area test anxieties, effect = LD Status by Sex
Test Name Value Exact F Hypothesis df Error df
Pillais SHHBHfll•024 WgiSB .69791 k; 172
Hoteiling^BHBH^Hl1 -024 H .697 mm. . nr .976 WMHi .69791 ^^172
'Roys jilBHHHHI 0111.024 'WM
Overall Multivariate Effect Size = .024
(M) = p < .10 (marginal significance), * = p < .05, ** = p < .01, *** = p < .001
Separate univariate F tests were performed on each of the subject area test anxiety ratings for each
independent variable found to have a significant main effect. Results of these univariate F tests for LD
status indicated that students with learning disabilities reported significantly more test anxiety than their
82
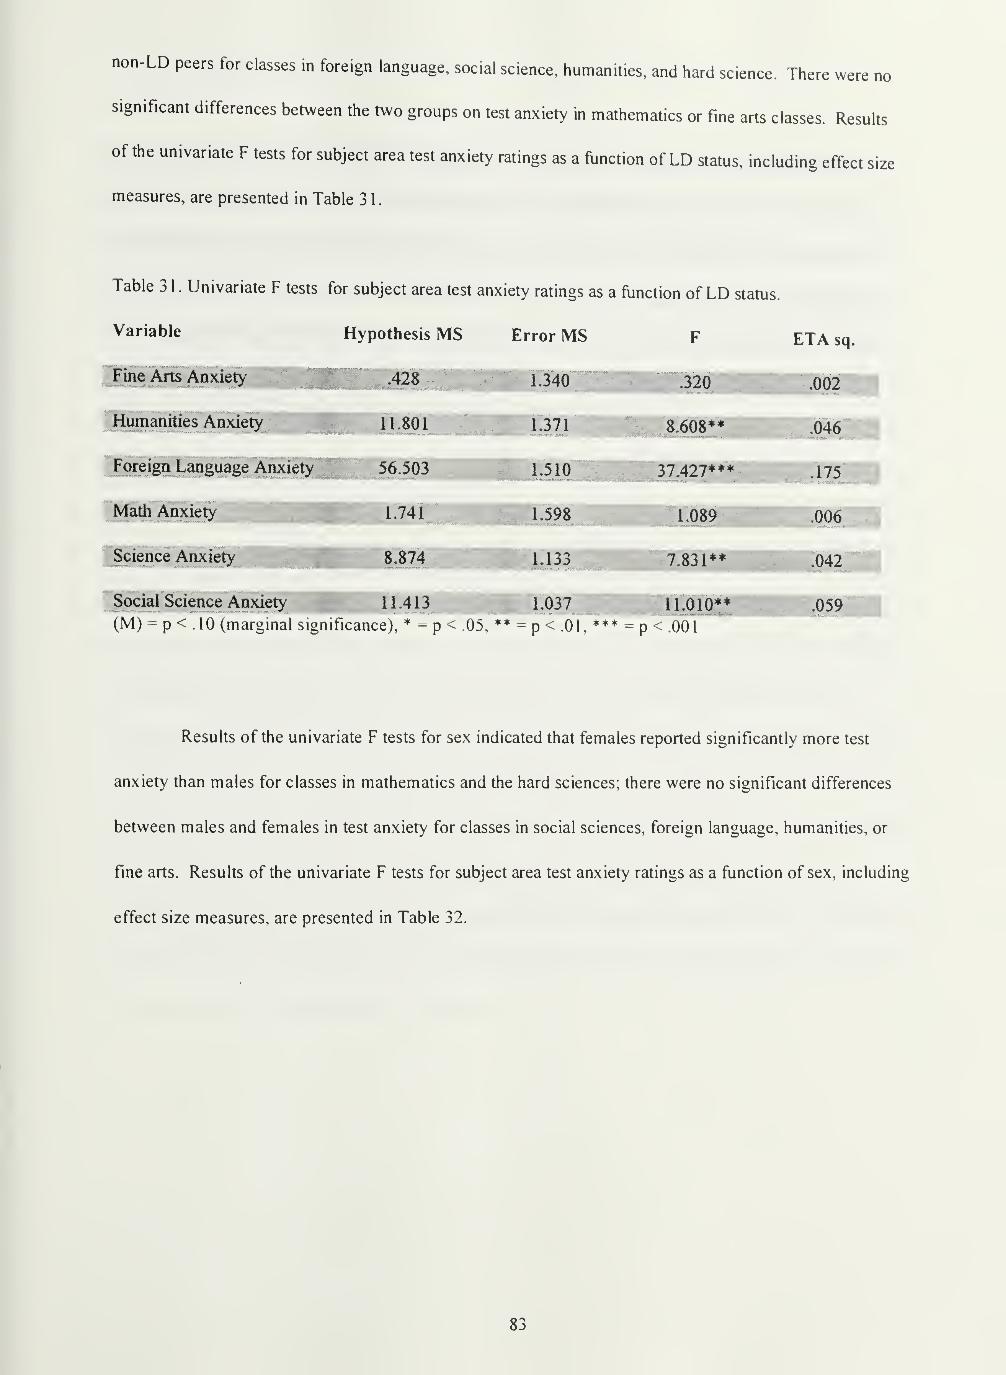
non-LD peers for classes in foreign language, social science, humanities, and hard science. There were no
significant differences between the two groups on test anxiety in mathematics or fine arts classes. Results
of the univariate F tests for subject area test anxiety ratings as a function of LD status, including effect size
measures, are presented in Table 3 1
.
Table 3 1.Univariate F tests for subject area test anxiety ratings as a function of LD status.
Variable Hypothesis MS Error MS F ETA sq.
Fine Arts Anxiety WtSSSiHi! -^^^ "Wif 1.340 B .002
Humanities Anxiety Jgj 1.371 8.608** .046
Foreign Language Anxiety 56.503 1.510 37.427*** .175
Math Anxiety itfH 1.741 1.598 1.089 .006
Science Anxiety ^^IhHIIHI: 8.S74 ^III- 1.133 7.831** lH^ .042
Social Science Anxiety""^
11.413 1.037 11.010**^^§.059(M) = p < .10 (marginal significance), * = p < .05, ** = p < .01, *** - p < .001
Results of the univariate F tests for sex indicated that females reported significantly more test
anxiety than males for classes in mathematics and the hard sciences; there were no significant differences
between males and females in test anxiety for classes in social sciences, foreign language, humanities, or
fine arts. Results of the univariate F tests for subject area test anxiety ratings as a function of sex, including
effect size measures, are presented in Table 32.
83
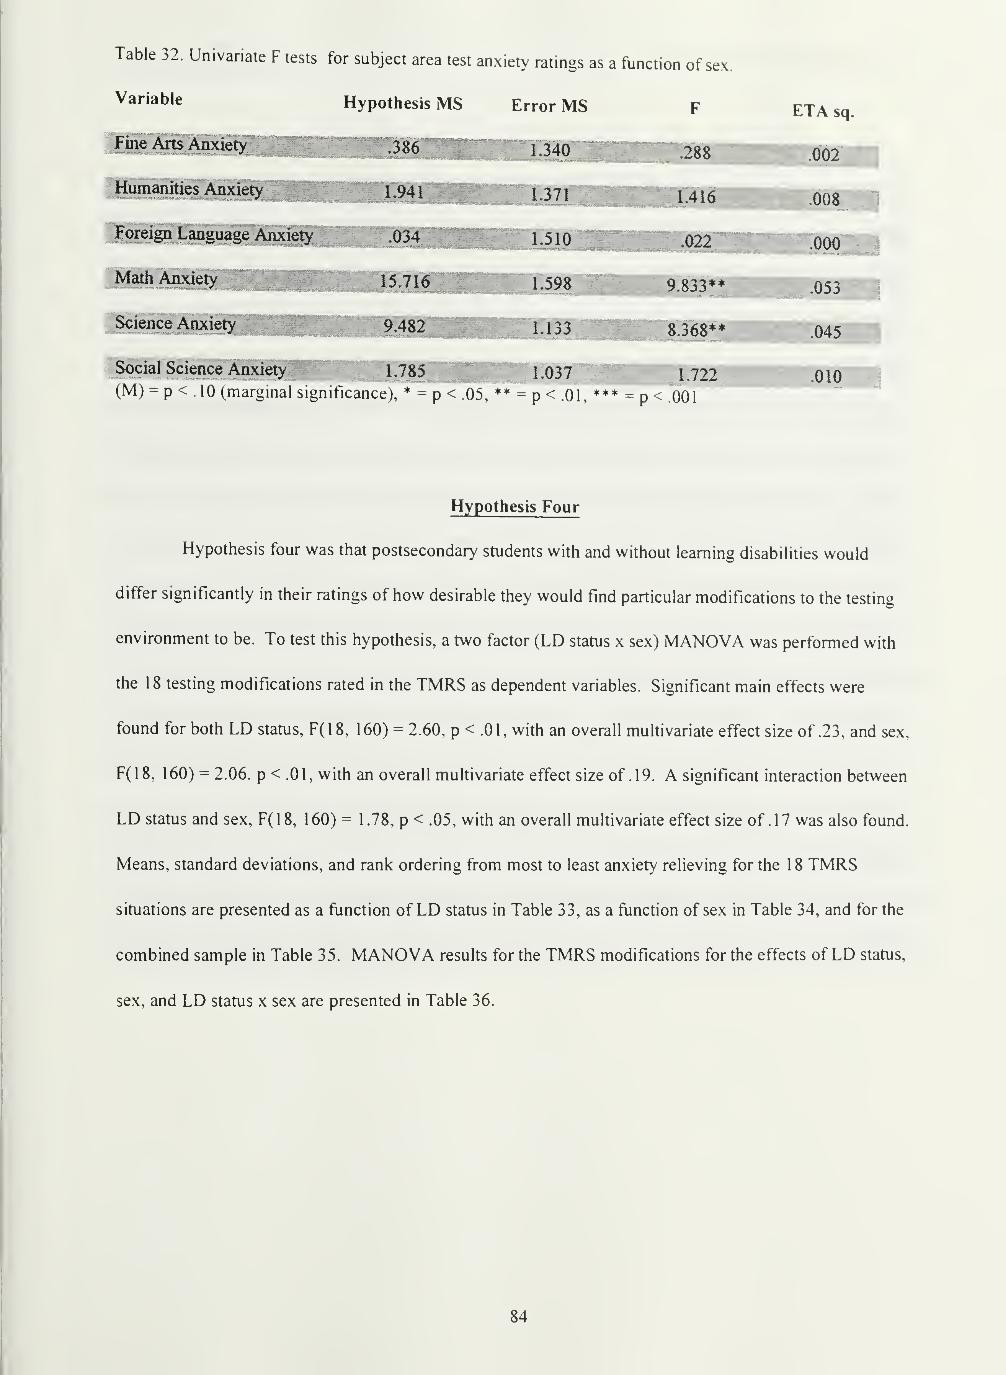
Table 32. Univariate F tests for subject area test anxiety ratings as a function of
^^''able Hypothesis MS Error MS
u941
ms4
Humanities Anxiei
Foreign Language Anxiety
sex.
Math/>^?9f^SH|BHI|mm-. i^-'?i6 '9^HfcJ-598 1 BSI^.833** .053 J
science AnxietyJHHH r 1.133 H||8.368** .045
Social Science Anxiety^(|| ^ 1-037 ^Hi:. 1-722 .010 Ji(.M) = p < .lU (marginal significance), = p < .05, ** = p< 01,*** = p<.001
Hypothesis Four
Hypothesis four was that postsecondary students with and without learning disabiMties would
differ significantly in their ratings of how desirable they would find particular modifications to the testing
environment to be. To test this hypothesis, a two factor (LD status x sex) MANOVA was performed with
the 18 testing modifications rated in the TMRS as dependent variables. Significant main effects were
found for both LD status, F(18, 160) = 2.60, p < .OK with an overall multivariate effect size of .23, and sex,
F(18, 160) = 2.06. p < .01, with an overall multivariate effect size of .19. A significant interaction between
LD status and sex, F(18, 160) = 1.78, p < .05, with an overall multivariate effect size of .17 was also found.
Means, standard deviations, and rank ordering from most to least anxiety relieving for the 18 TMRS
situations are presented as a ftinction of LD status in Table 33, as a function of sex in Table 34, and for the
combined sample in Table 35. MANOVA results for the TMRS modifications for the effects of LD status,
sex, and LD status x sex are presented in Table 36.
84
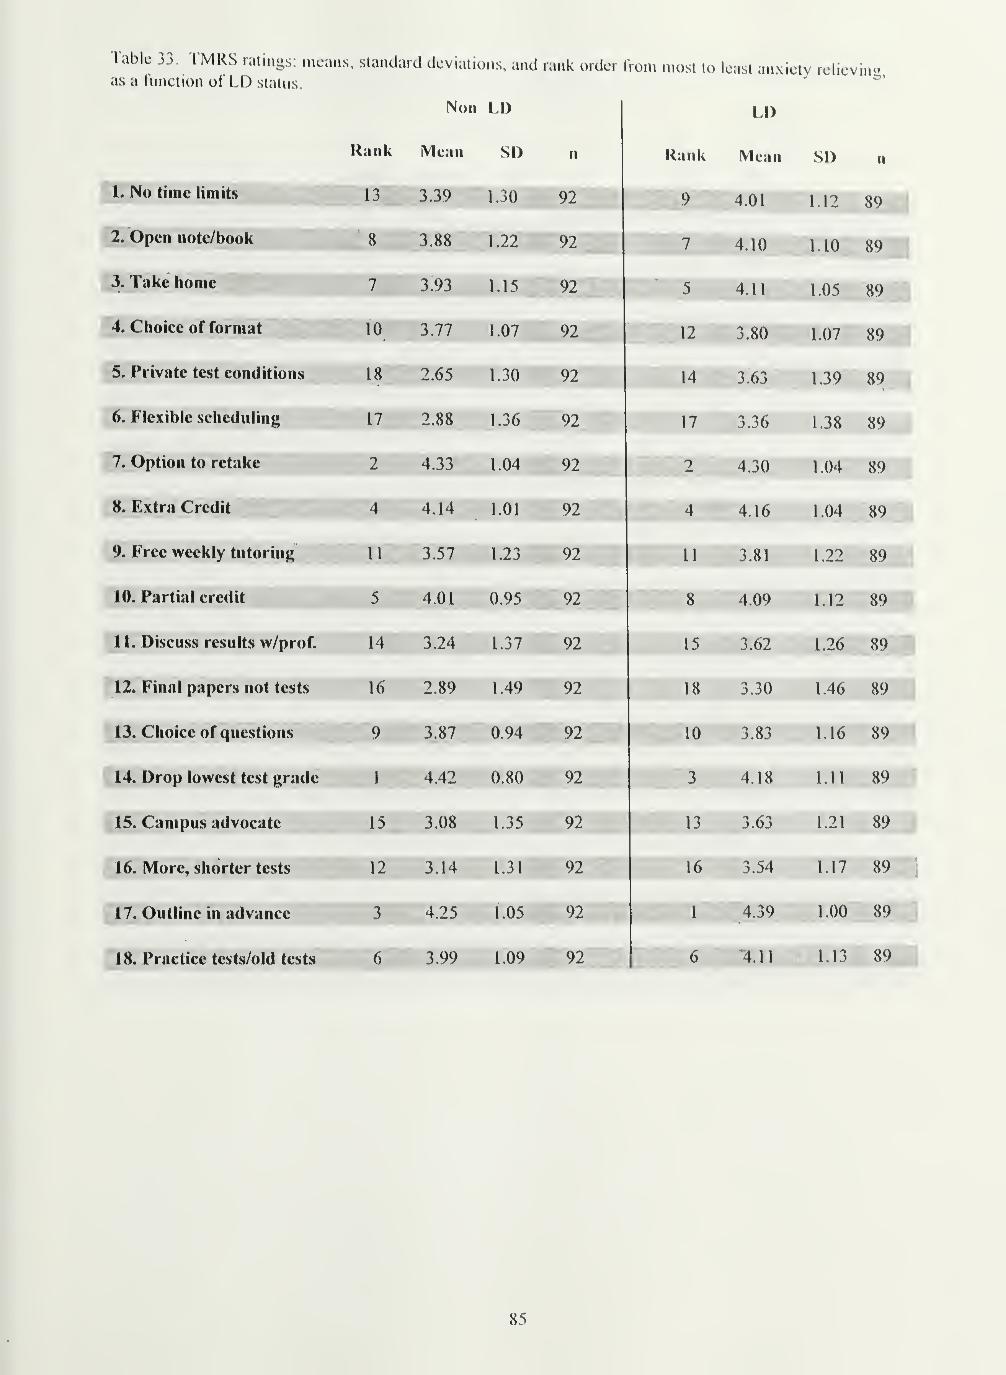
Table 33. TMRS ratings: means, standard deviations, and rank order t
as a function ot'LD status.
Non LI)
1. No time limits
2. Open note/book
3. Take home
4. Choice of format
5. Private test conditions
6. Flexible scheduling
7. Option to retake
8. Extra Credit
9. Free weekly tutoring
10. Partial credit
11. Discuss results w/prof.
12. Final papers not tests
13. Choice of questions
14. Drop lowest test grade
15. Campus advocate
16. More, shorter tests
17. Outline in advance
18. Practice tests/old tests
Rank Mean SD
13
8
10
18
11
14
3.39 1.30
3.93 1.15
3.77 1.07
2.65 1.30
17 2.88 1.36
4.33 1.04
4.14 1.01
3.57 1.23
4.01 0.95
3.24 1.37
16 2.89 1.49
3.87 0.94
4.42'" 0.80
15 3.08 1.35
12 3.14 1.31
n
92
3.88 1.22 92
92
92
92
92
92
92
92
92
92
92
92
92
92
92
4.25 1.05 92
3.99 1.09 92
rom most to least anxiety relieving,
LD
Rank Moan SI) n
4.01 1.12 89I
4.10 1.10 89
14
15
16
4.11
3.63
17 3.36
4.30
3.62
4.18
13 3.63
3.54
4.39
1.05 89
12 3.80 1.07 89
1.39 89
1.38 89
1.04 89
4.16 1.04 89
11 3.81 1.22 89
4.09 1.12 89
1.26 89
18 3.30 1.46 89
10 3.83 1.16 89
1.11 89
1.21 89
1.17 89
1.00 89
"4.11 1.13 89
85
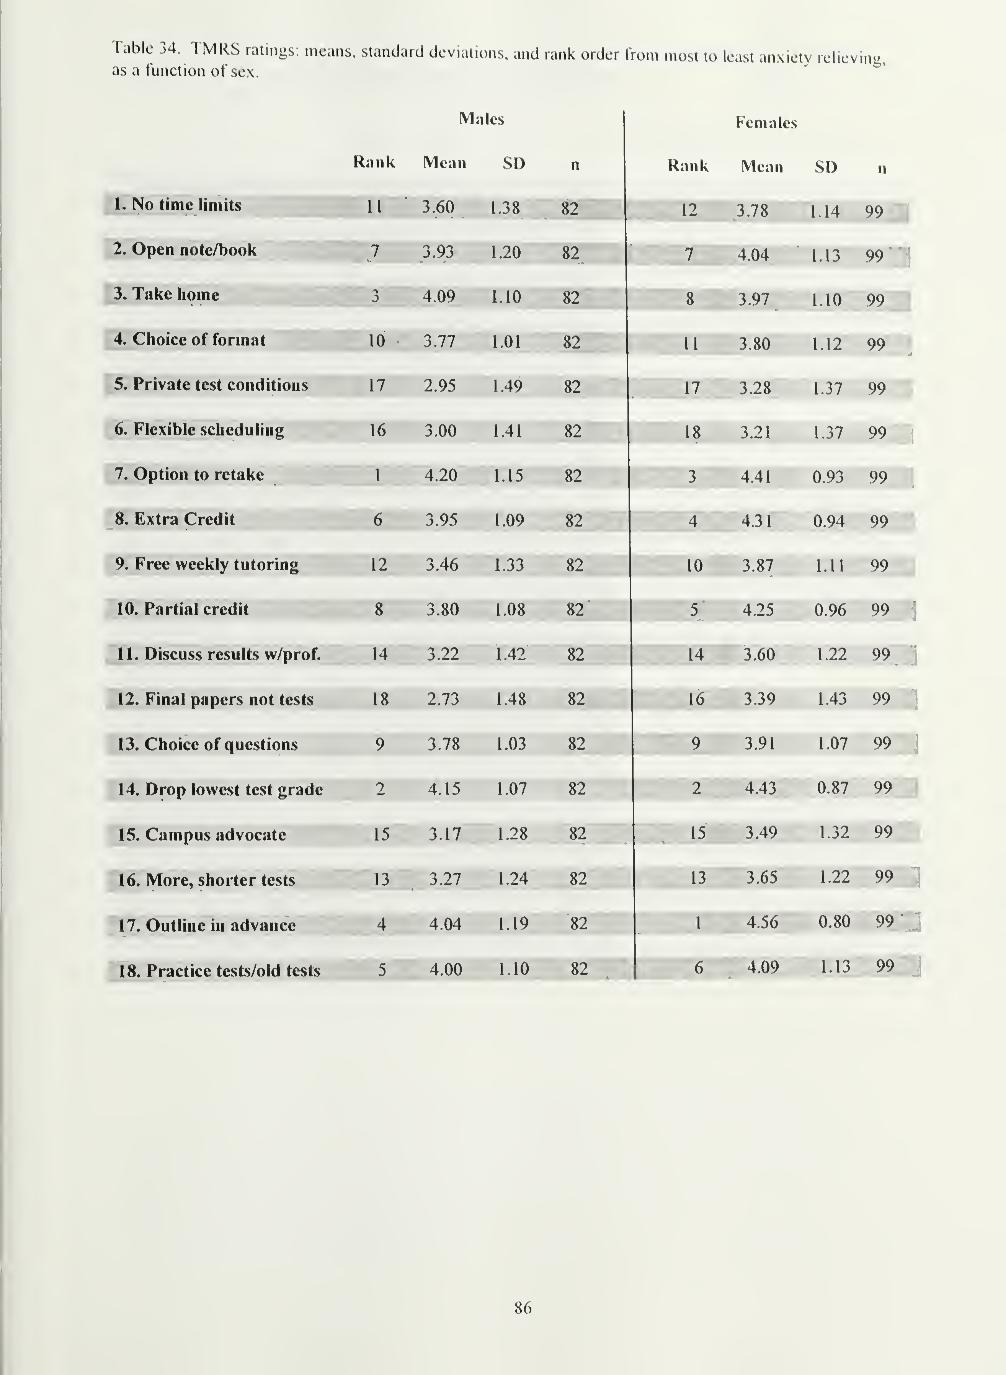
Table 34. TMRS ratings: means, standard deviations, and rank order from most to least anxiety relieving,as a function of sex.
Milies Females
Rank Mean SD n Rank Mean SD n
1. No time limits U 3.60 1.38 82 12 3.78 1.14 99
2, Open note/book 7 3.93 1.20 82 7 4.04 1.13 99
3. Take home flHHHHi 3 4.09 1.10 82' 8 3.97 1.10 99
4. Choice of format-•^-^
10 3.77 I.Ol 82 11 3.80 1.12 99
5. Private test conditions 17 2.95 1.49 82 17 3.28 1.37 99
6« Flexible scheduling 16 3.00 1.41 82 18 3.21 1.37 99
7. Option to retake 1 4.20 1.15 82 3 4.41 0.93 99
8. Extra Credit 6 3.95 1.09 82 4 4.31 0.94 99
9. Free weekly tutoring 12 3.46 1.33 82 10 3.87 1.11 99
10. Partial credit wMr 3.80 1.08" "S2 4.25 0.96 99
11, Discuss results w/prof* 14 3.22 1.42 82 14 3.60 1.22 99
12. Final papers not tests 18 2.73 1.48 82 16 3.39 1.43 99
13. Choice of questions 9 3.78 1.03 82 9 3.91 1.07 99
J4, Drop lowest test grade 2 4.15 1.07 82 2 4.43 0.87 99
15. Campus advocate 15 3.17 1.28 82 15 3.49 1.32 99
16. More, shorter tests 13 3.27 1.24 82 13 3.65 1.22 99
17. Outline in advance 4 4.04 1.19 82 1 4.56 0.80 99'
18. Practice tests/old tests 4.00 1.10 82 6 4.09 1.13 99
86

Table 35. TMRS ratings: means, standard deviations, and rank order from most to least anxiety relieving(modifications are also listed in this rank order) for the total sample.
Total Sample
Rank Mean SD n
Outline in advance
Option to retake
Drop lowest test grade
4.32 1.03 181
4.31 1.04 181
4.30 0.97 181
Extra Credi
Partial credit
4.15 1.02 181
U.05 1.04 181
llp^ractice tests/old tests 4.05 1.11 181
Take home
Open note/booK
Choice of questions
4.02 1.10 181
I 3.99 jttlitTifiiilfirf 181
*3.85 1.05 181
Choice of format 10 3.78 1.07 181
No time limits 3.70 1.25 181
Free weekly tutoring
More, shorter tests
3.69 1.23 181
3.48 1.24 181
Discuss results w/prof. 3.43 1.33 18
Campus advocate 15 3.35 1.31 181
Private test conditions 16 3.13 1.43 181
Flexible scheduling 17 3.12 1.39 181
Final papers not tests 18 3.09 ...1.49 181
87
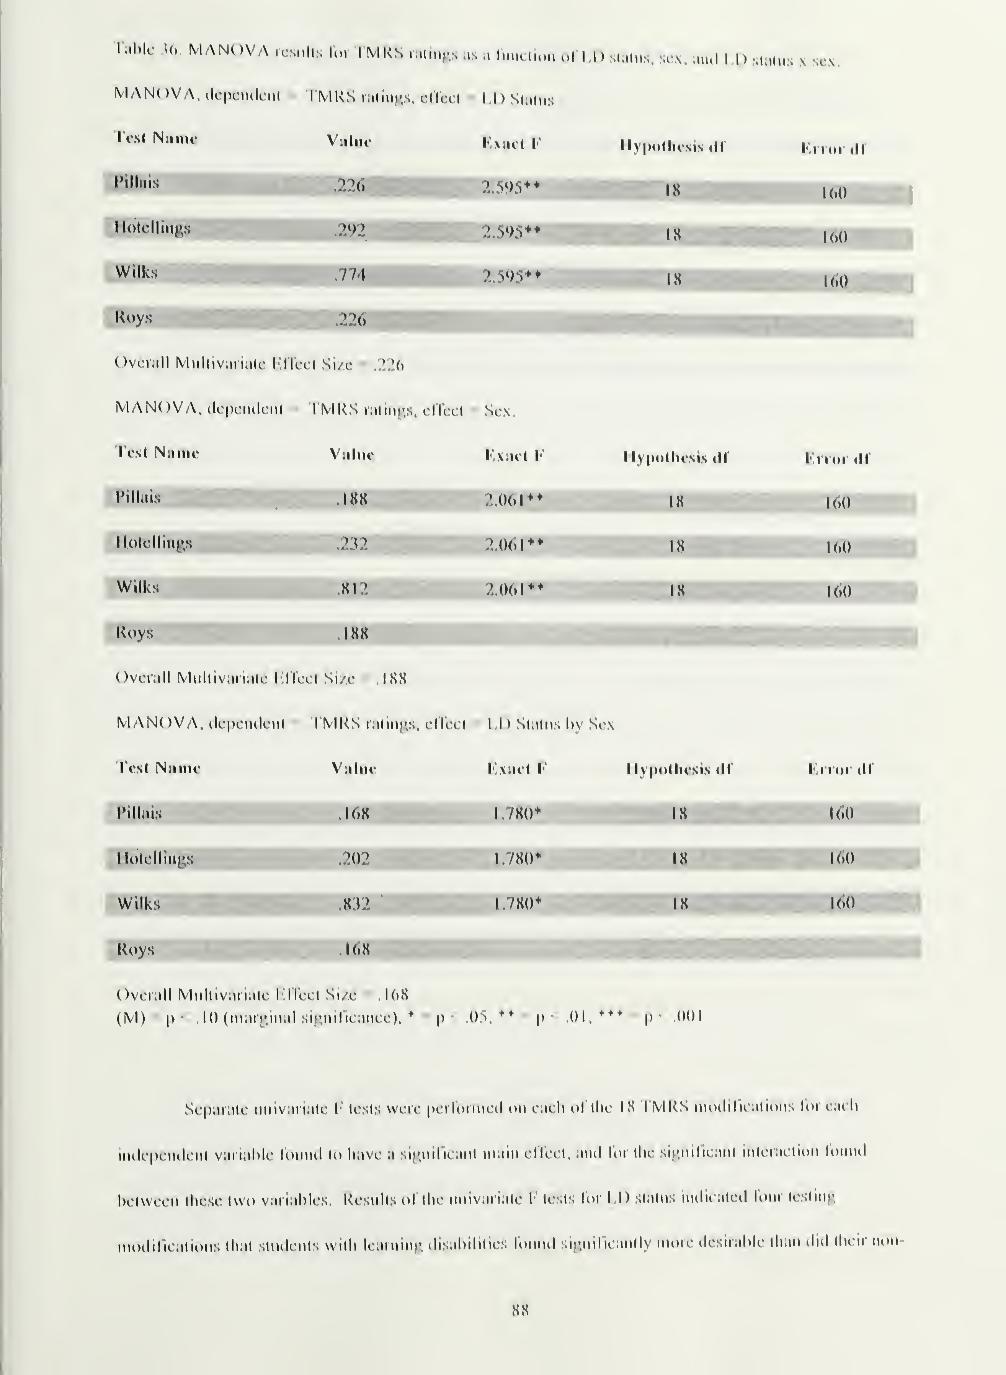
T.,hU- MANOVAivsullslo, I MRS lalinr.s ;,s inunclioin>riM) status, sex. m.l I 1) si;Uu.s X sex.
MANOVA, (U-|H-ii(lriil 1 MRS i.itmi's, i-llcil I D Sliiliis
llypolhcsis (II
18
18
18
Fi nn (II
KiO
1()0
Ovci.ill Miilliviiri;ilc I lUrl Si/i< ,??6
MANOVA. (li-|HMuliMil I MRS i;ilmi'.s, cllril Sox
I'c.sl INaiiic VllIlK I' XlU t I- llypollu-Nis (II' l'',ri (tr (11
I'illab 2.061* 18 160
ilolclliiigs ,91111m .232 .2,061** 18. 1 . . n a.. . ,,,, •.. . .
l()0
Wilks .812 2.061** "^^Mt 18 1 i(>o
Roys .188 iai
Ovci.ill Mullivariair 1 Ifivl Si/o IHS
MANOVA. tlriu'iulrnl 1 MRS i;itin|'.s, I'lltHt I.I) Sl.itiis In Srx
Test INaiiic Value F.xiu-I I' llypollu-sis (If l'"ri (»r (11
I'illais .168 I./KO* 18 i()0
llolcllings .202 .,^.„.1.780* 18
Wilks 'I^^HK .832 t.780* WM1 18 .H
Roys .168
Overall Miillivariato
(M) p ". 10 (marginal
.•i t Size U>H
siniiincinicc).*
p * |) 01. |> 001
Srpaialr iimv.ii i.ilr I Icsis wtMc pri lomu'd on c,u h (»1 llic I S 1 MRS inoililii alions h>i each
imlepoiuliMil variable loxwul \o have a sit'iMlieanl inaiii elleLl. ami U>i Ihe siniulieaiU inlcracliou Uniiul
between Ihese two variables. Kesults ol liie univarialc I' Icsls lor IJ) slalus iiulieated four testing
nuKiilkalions that stiKlenls with learning disabilities lound signilieanlly more ilesirable than ilid Iheir non
K8

LD peers. These were (presented in descending order of magnitude of effect size): 1) private testing
conditions, 2) absence of time limits, 3) presence of an advocate on campus to whom they could go for
help about testing and grades, and 4) flexible scheduling of test times. Marginally significant differences
between students with and without learning disabilities were found for: 1) final papers instead of tests
(students with LD found this more desirable than did non-LD students), 2) chance to discuss test results
with a professor (again, students with LD found this more desirable), and 3) the option to drop one's lowest
test grade in a class (non-LD students found this more desirable than students with LD). Results of the
univariate F tests for TMRS ratings as a ftinction of LD status, including effect size measures, are presented
in Table 37.
f
89
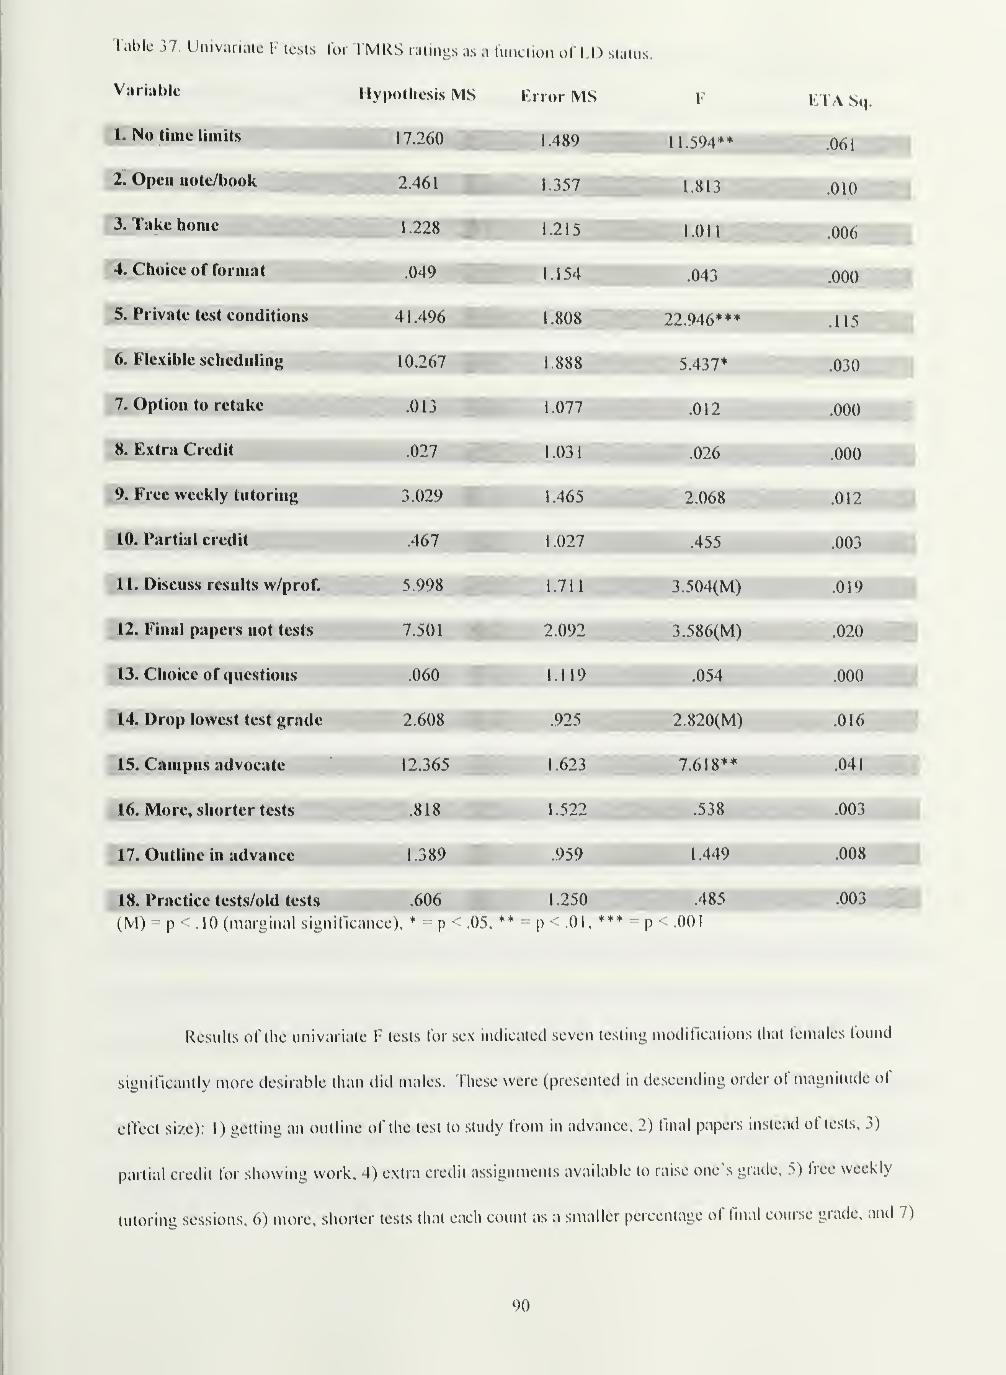
Tabic 37. Univariate I- icsls for VMRS ratings as a function of l.D status.
Variable
1. No time limits
2. Open iiole/book
3. Take home
4. Choice of format
Hypothesis IMS Frror IMS
5. Private test conditions
6. Flexible scheduling
7. Option to retake
8. Extrn Credit
9. Free weekly tutoring
10. Partial credit
11. Discuss results w/prof.
12. Final papers not tests
13. Choice or questions
14. Drop lowest test grade
15. Campus advocate
16. More, shorter tests
17. Outline in advance
17.260
2.461
1.228
.049
41.496
10.267
.013
.027
3.029
.467
5.998
7.501
.060
2.608
12.365
.818
1.389
1.489
1.357
1.215
1.154
1.808
1.888
1.077
1.031
1.465
1.027
1.711
2.092
1.119
.925
1.623
1.522
.959
F
11.594**
1.813
l.Oll
.043
22.946«««
5.437*
.012
.026
2.068
.455
3.504(M)
3.586(M)
.054
2.820(M)
7.618**
.538
1.449
18. Practice tests/old tests .606 'ggggg' \ ISO^ggggf' .485
(M) - p .10 (marginal significance). = p < .05, * = p .0 1 .** - p • .001
ETA Sq,
.061
.010
.006
.000
.115
.030
.000
.000
.•012
.003
.019
.020
.000
.016
.041
.003
.008
.003
Results ol lhe imivariale I' tests for sex indicated seven testing modifications that females found
significantly more desirable than did males. These were (presented in descending order of magnitude ot
effect size): 1) getting an outline of the test to study from in advance, 2) final papers instead of tests, 3)
partial credit for showing work, 4) extra credit assignments available to raise one's grade, 5) free weekly
tutoring sessions, 6) more, shorter tests that each count as a smaller percentage of final course grade, and 7)
00
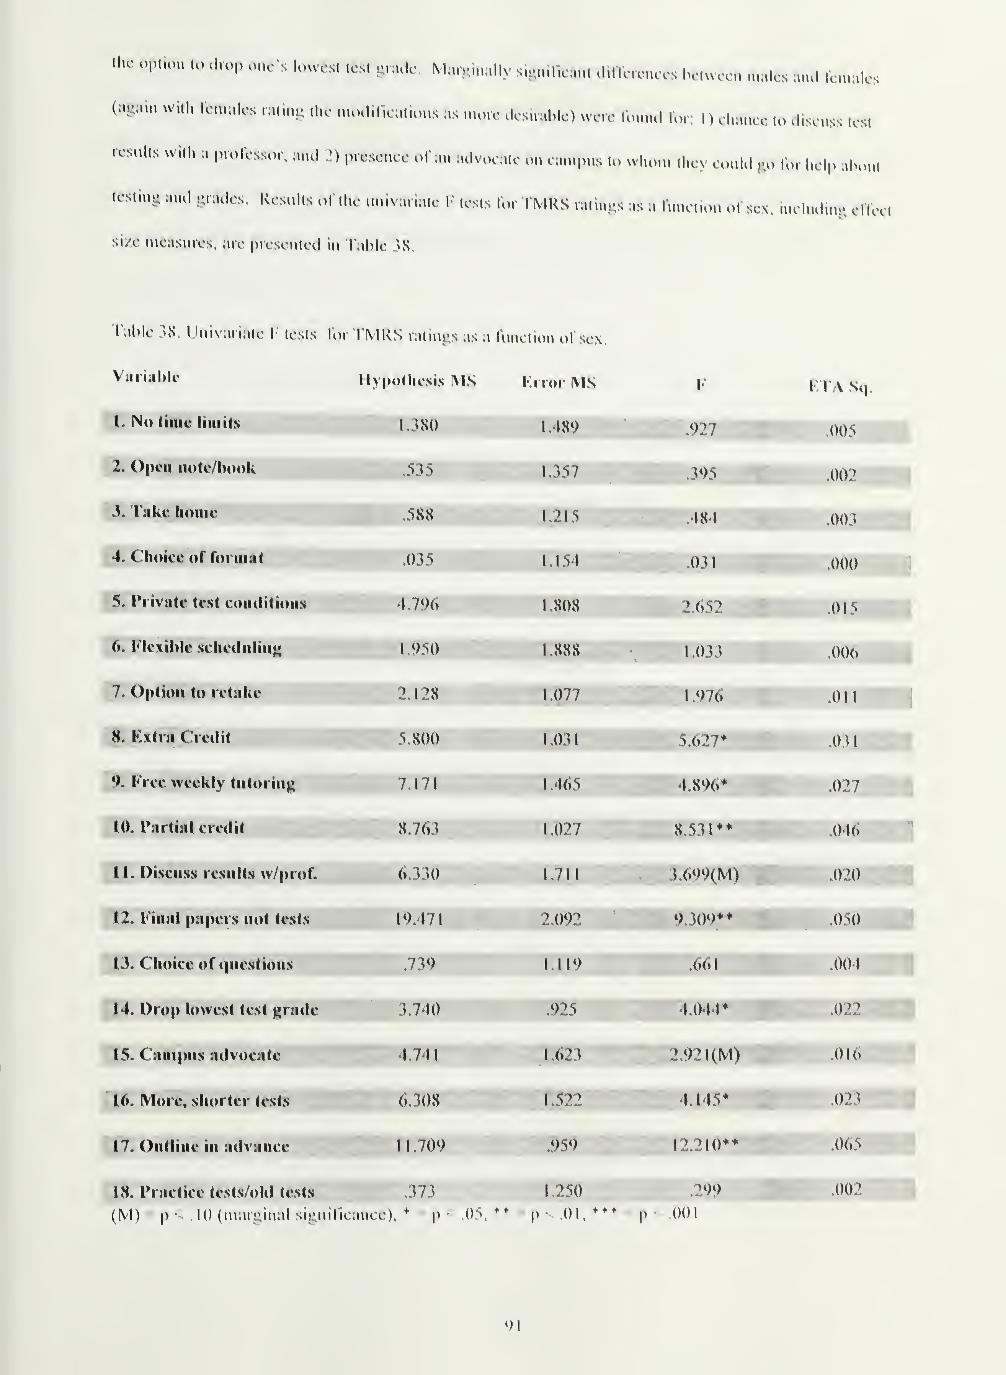
"H- opi.on to drop OMC-s lowest test grade. M.,;,,n.,lh si^nlK-.,,,. .l,llc,o,u-es Ivtuven n,;.les ,„ui iV.nales
(again with females rating the iiUKiilications as more desirable) were Unnul to, I ) di.uKe to diseiiss test
.csi.lts with a professor, and presence of an advoeate on can.pus to whon, lhe> eot.ld go to, help ahout
tostin., a.ui .rades Results of the univariate I' tests for TMRS ratinj^s as a tunetion of sex. inehuhng effeet
si/e measures, are presented in 1 able >S
i ahle >,S, Univariate 1 tests for IMKS ratin!-,s as a fuiu lion of sex,
Varia()U'
1. No time limits
2. Open iioto/book
3. Tiikc home
4. Choice or format
5. Private te.st conditions
6. Klexihie sehedulinK
7. Option to retake
8. Kxtra Credit
9. Free weekly tntoring
to. Partial credit
U. Discnss resnlts w/prof.
12. Final papers not tests
1J. Choice or (|nestions
14. Drop lowest test grade
15. Canipns advocate
16. More, shorter tests
17. Ontline in advance
llvpotliesis MS I'.rror MS
1.380
.535
.588
.035
4.796
I .050
2.128
5.800
7.171
8.763
6.330
19.471
.739
3.7-U)
•1.7-n
6.308
II. 70')
1.489
•^357
1.215
1.154
1.808
1 X8S
1.077
1.031
1.465
1.027
1.711
2.092
ill')
.925
1.623
1.522
.959
.927
.395
.181
.031
2.652
1.03 J
1.976
5.627*
4.896*
8.53 1*
3 6')«)(M)
9.309*
.(>(>!
4.(M4*
2.92 1 (M)
4.145*
12.210**
18. Practice tests/old tests .373 1.250 .299
(M) p- .l()(margmal signilieanee). -»p<.05. p-.Ol.*** |i 001
FT V Sq.
.005 ,
.002
.003
.000
.015
.006
.011
.03
1
.027
.0I(>
.020
.050
.001
.022
.01(>
.023
.0().s
.002 'JB
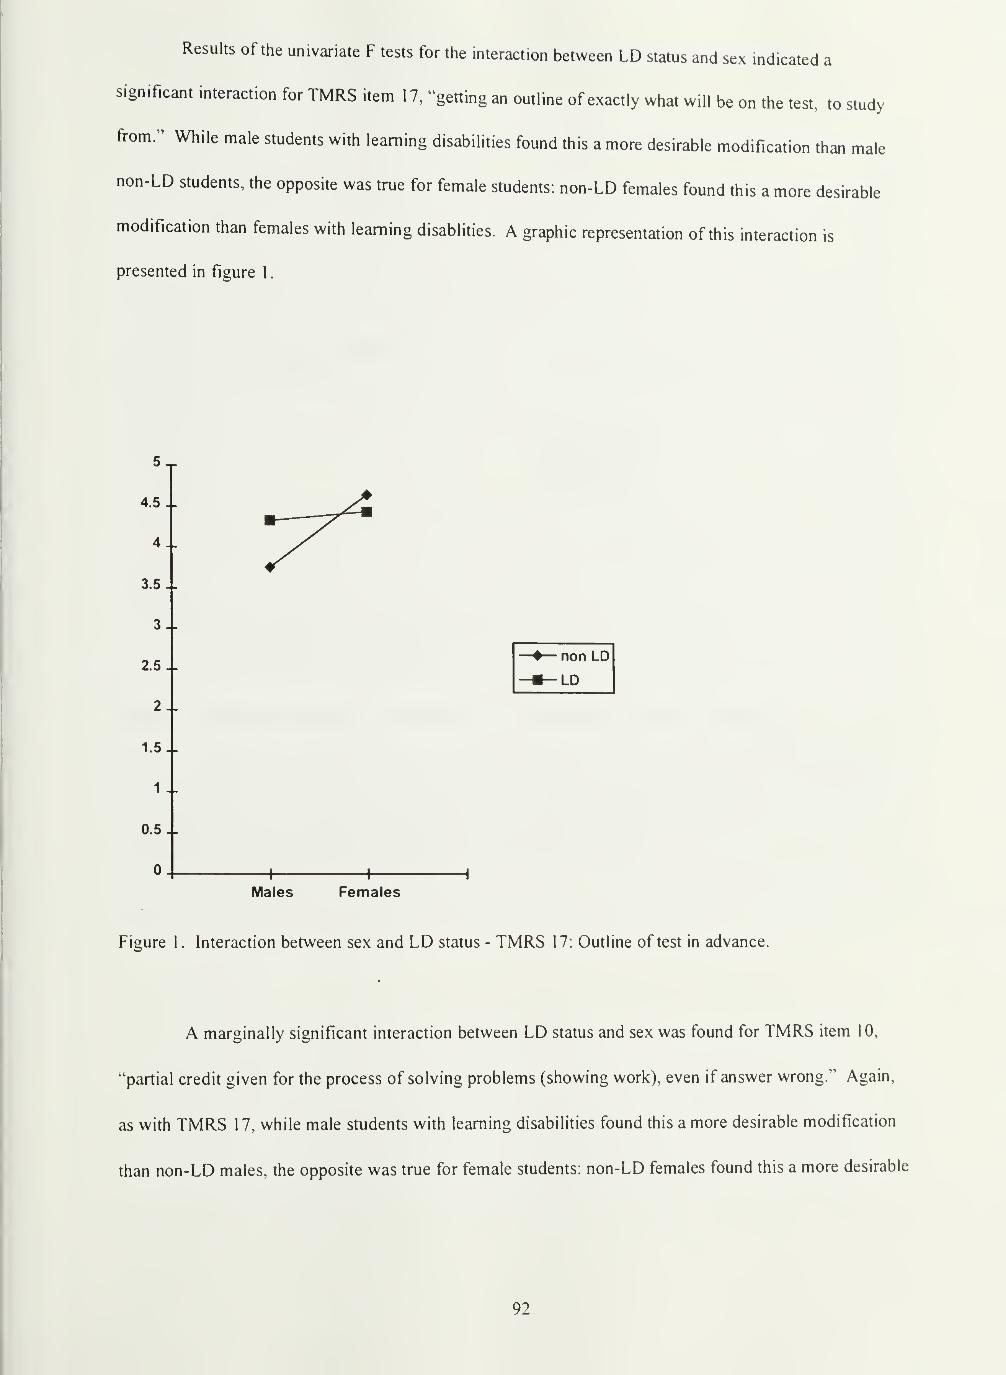
Results of the univariate F tests for the interaction bet^veen LD status and sex indicated a
significant interaction for TMRS item 17, "getting an outline of exactly what will be on the test, to study
from." While male students with learning disabilities found this a more desirable modification than male
non-LD students, the opposite was true for female students; non-LD females found this a more desirable
modification than females with learning disablities. A graphic representation of this interaction is
presented in figure 1.
5-
4.5..
4
3.5..
3
2.5..
2..
1.5 ..
1 -.
0.5.
-
0..
Males Females
Figure 1. Interaction between sex and LD status - TMRS 17: Outline of test in advance.
A marginally significant interaction between LD status and sex was found for TMRS item 10,
"partial credit given for the process of solving problems (showing work), even if answer wrong." Again,
as with TMRS 17, while male students with learning disabilities found this a more desirable modification
than non-LD males, the opposite was true for female students: non-LD females found this a more desirable
92
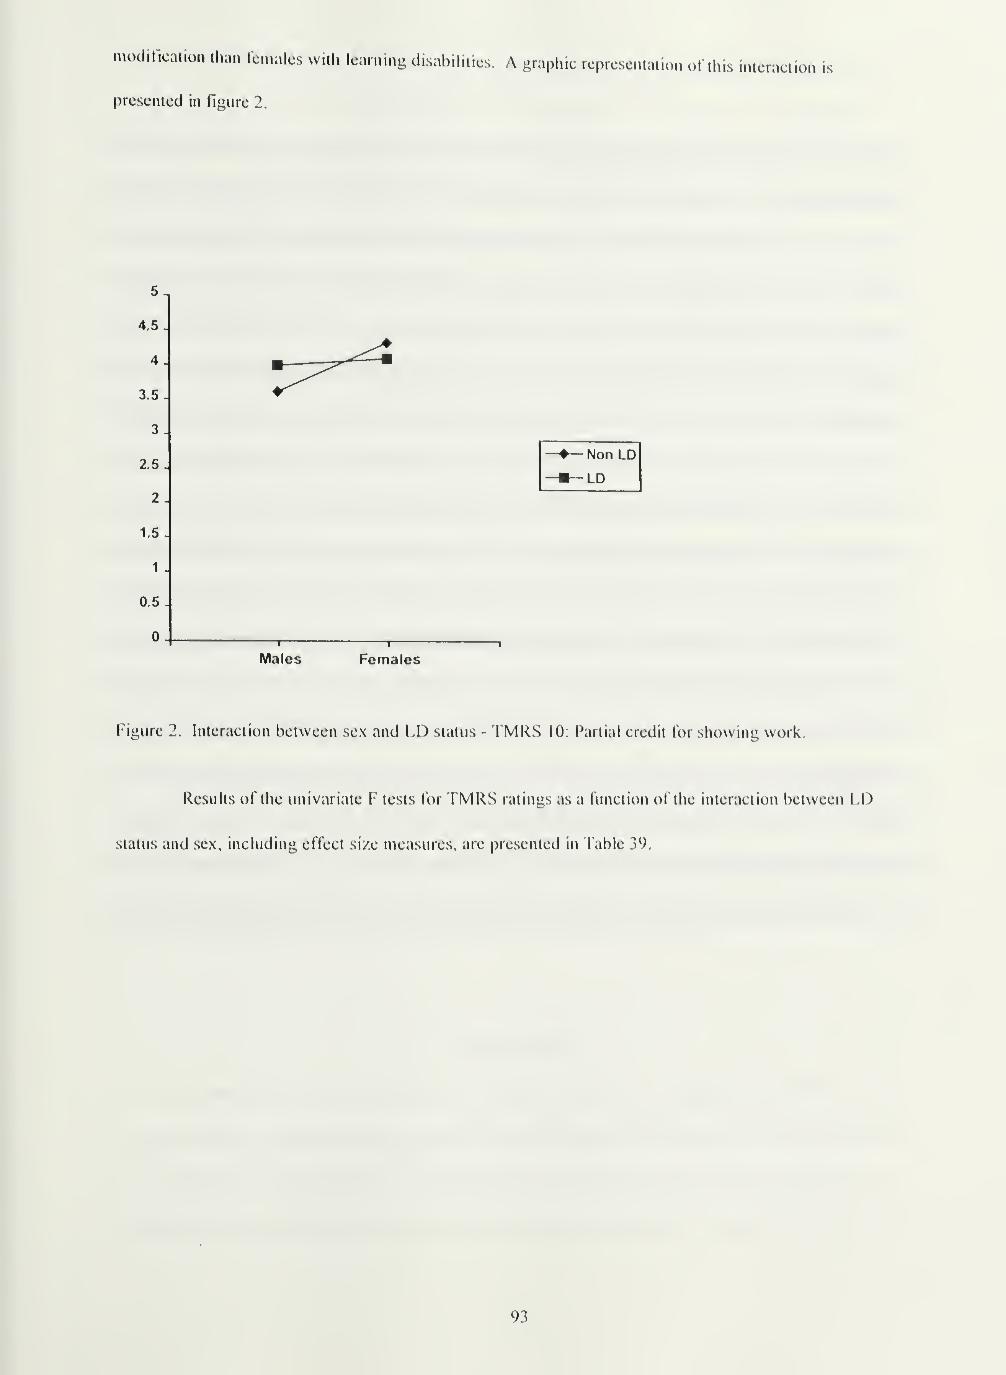
niodillcalion than fcnalcs with learning disabilities. A graphic representation oftliis interaction is
presented in figure 2.
S.
4.5 .
4
3.5 J
3
2.5
2
1.5
1
0.5
0
Males Females
Figure 2. Interaction between sex and LD status - TMRS 10: Partial credit for showing work.
Rcsuhs of the univariate F tests for TMRS ratint's as a function of the interaction between
status and sex, including effect si/e measures, are presented in Table 3^>.
93
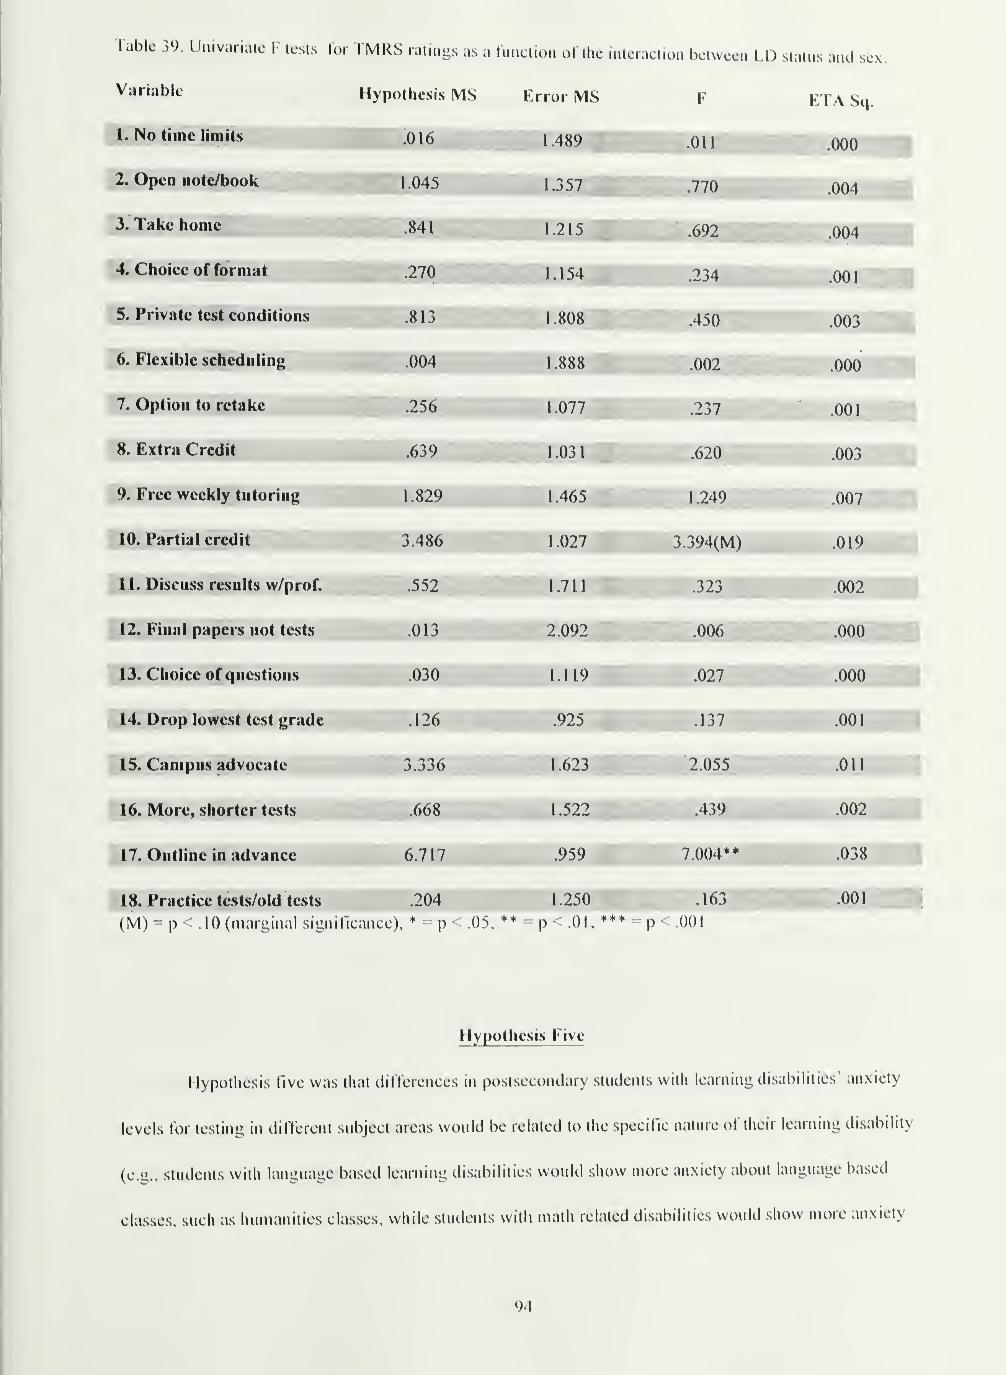
Table 39. Univariate I' tests tor TMRS ratings as a function of the interaction between LD
Variable
1. No time limits
2. Open note/book
3. Take home
4. Choice of format
5. Private test conditions
6. Flexible scheduling
7. Option to retake
8* Extra Credit
9. Free weekly tutoring
10. Partial credit
11. Discuss results w/prof,
12. Final papers not tests
13. Choice of questions
14. Drop lowest test grade
15. Campus advocate
16. More, shorter tests
17. Outline in advance
18. Practice tests/old tests
1 Y^i^i^vf.
Hypothesis IMS
.016
.841
.270
.813
.004
.256
.639
1.829
3.486
.552"
.013
.030
.126
3.336
.668
6.717
.204
Error IMS
1.489
....1-357
1.215
1.154
1.808
1.888
1.077
1.031
..1-465
1 .027
1.711
2.092
1.119
.925
1.623
1.522
.959
1.25
F
.011
.770
.692
.234
.450'
.002
.237
.620
.. 1-249
3.394(M)
.323
.006
.027
.137
2.055
.439
7.004**
163
status and sex,
ETA Sq.
.000
.004
.004
.001
'.003
.000
.001
.003
.007
.019
.002
.000
.000
.001
.Oil
.002
.038
.001
1
(M) p • .10 (nuuginal signitlcance), * = p< .05, ** - p .01, *** = p < .001
Hypothesis Five
Hypothesis five was that dilTercnccs in postsecondary students with learning disabilities' anxiety
levels for testing in ditferent subject areas would be related to the specific nature of their learning disability
(e.g., students with language based learning disabilities would show more anxiety about language based
classes, such as humanities classes, while students with math related disabilities would show more anxiety
94
about math based classes). To test this hypothesis, separate univariate ANOVA^s using nature of learning
disability as the independent variable were performed on test anxiety ratings for each subject area listed in
the SARS. Four diagnostic groupings of learning disability were used: 1) primarily
verbal/auditory/writing/language, 2) primarily non-verbal/visual/math, 3) primarily cognitive:
memory/attention/organization, and 4) combination verbal and non-verbal. As noted earlier, each student
with a learning disability was placed in one of these categories based on a review of the diagnostic
information in his/her LOSS file.
It was found that, for each subject area, the relationships between the mean anxiety scores for the
different diagnostic groups were in the direction expected (e.g., students with primarily language based
learning disabilities showed more test anxiety for language oriented classes than students with primarily
non-verbal learning disabilities; students with primarily non-verbal learning disabilities showed more test
anxiety for math and science classes than did students with primarily language based learning disabilities);
however, this effect did not reach significance for any of the six subject areas considered. Means and
standard deviations for fine arts test anxiety as a function of nature of learning disability are presented in
Table 40, ANOVA results for fine arts test anxiety as a function of nature of learning disability, including
effect size measures, are presented in Table 4 1 . Means and standard deviations for humanities test anxiety
as a function of nature of learning disability are presented in Table 42, ANOVA results for humanities test
anxiety as a function of nature of learning disability, including effect size measures, are presented in Table
43. Means and standard deviations for foreign language test anxiety as a function of nature of learning
disability are presented in Table 44, ANOVA results for foreign language test anxiety as a function of
nature of learning disability, including effect size measures, are presented in Table 45. Means and standard
deviations for mathematics test anxiety as a function of nature of learning disability are presented in Table
46, ANOVA results for mathematics test anxiety as a function of nature of learning disability, including
effect size measures, are presented in Table 47. Means and standard deviations for hard science test
anxiety as a function of nature of learning disability are presented in Table 48, ANOVA results for hard
science test anxiety as a function of nature of learning disability, including effect size measures, are
presented in Table 49. Means and standard deviations for social sciences test anxiety as a function of
95
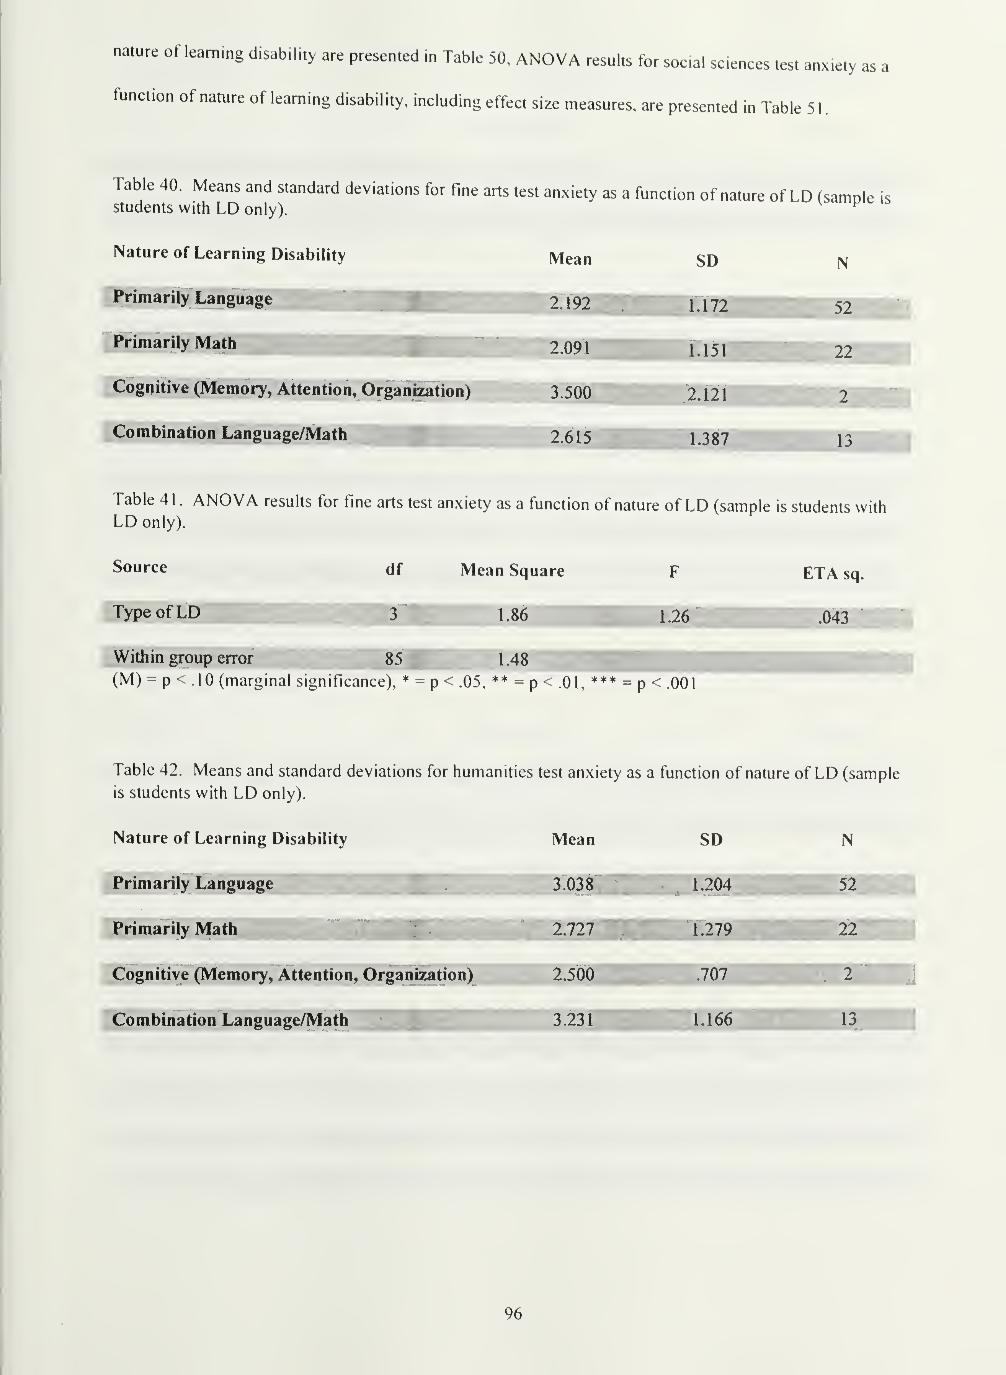
nature of learning disability are presented in Table 50, ANOVA results for social sciences test anxiety as a
function of nature of learning disability, including effect size measures, are presented in Table 51.
Table 40. Means and standard deviations for fine arts test anxiety as a function of nature of LD (sample isstudents with LD only).
^
Nature of Learning Disability Mean SD N
Primarily Language 2.192. 1.172 52
Jfrimariiy Math 2.091 "WK 1.151 22
cognitive (Memory, Attention, Organization) 3.500 2.121
"
Combination Language/Math 2.615 1.387 13
Table 41ANOVA results for fine arts test anxiety as a function of nature of LD (sample is students with
LD only).
Source df Mean Square F ETA sq.
Type ofLD " ' '3"
'. 1-86 1.26 .043
Within group error 85 Bf^l.48(M) = p < .10 (marginal significance), * = p < .05, ** =p<.01 ,*** = p<.001
Table 42. Means and standard deviations for humanities test anxiety as a function of nature of LD (sample
is students with LD only).
Nature of Learning Disability Mean SD N
Primarily Language _ .3.038 L204 52
Primarily Math . 2,727 L279 22
Cognitive (Memory, Attention, Organization) '2^500 .707
- 2
Combination Language/Math 3.231 L166 13
96
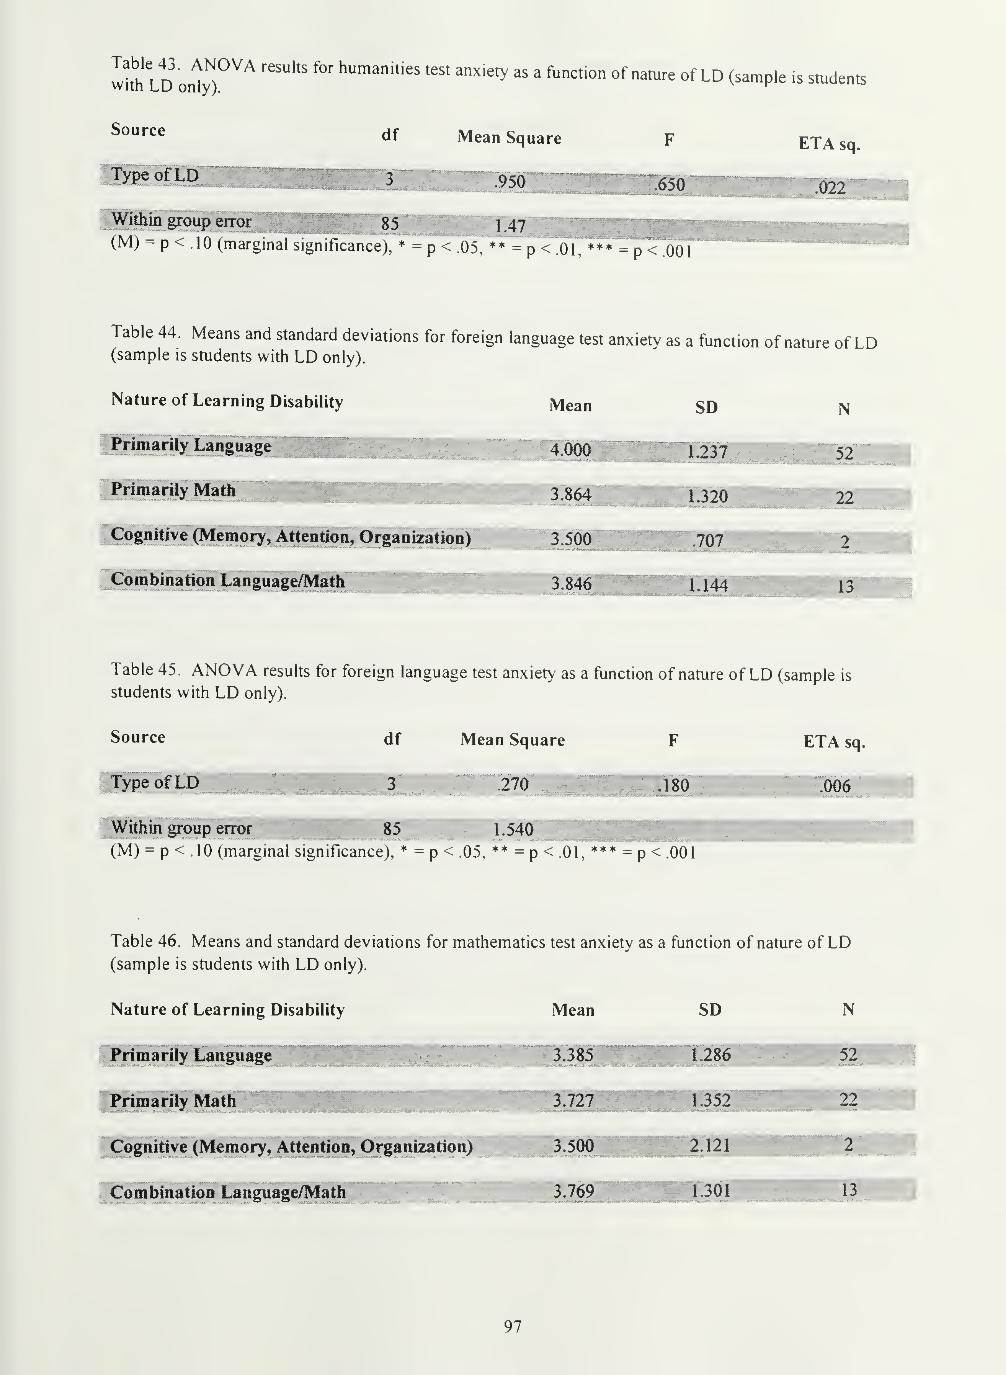
withlo on'lyT^^^""^ humanities test anxiety as a function of nature of LD (sample is students
S""--" df Mean Square F ETA sq.
TypeofLD —3 .950:^^^^^^^^^^^^^ ^ ; J^^^^ .022
Within group error 85 " 1.47(M) = p < .10 (marginal significance), * =p < .05, ** =p < .01, = p < .001
Table 44. Means and standard deviations for foreign language test anxiety as a function of nature of LD(sample is students with LD only).
Nature of Learning Disability Mean SD N
Primarily Language 4.000 1.237 52
rrimanlyMath 3.864 1.320 22
« . ^ . . . _ ...,„.„.. , .. . _.
cognitive (Memory, Attention, Organization) 3.500 .707 2
Combinatioa Language/Math 3.846 L144
Table 45. ANOVA results for foreign language test anxiety as a function of nature of LD (sample is
students with LD only).
Source df Mean Square F ETA sq.
TypeofLD,
"3 270 .180 .006
Within group error 85 1.540
(M) = p < .10 (marginal significance), * = p < .05, ** = p < .01, *** = p < .001
Table 46. Means and standard deviations for mathematics test anxiety as a function of nature of LD(sample is students with LD only).
Nature of Learning Disability Mean SD N
Primarily Language 3.385 1.286 52
Primarily Math 3.727 1.352 22
Cognitive (Memory, Attention, Organization) 3.500 2.121 2 1
Combination Language/Math 3.769 1.301 13
97
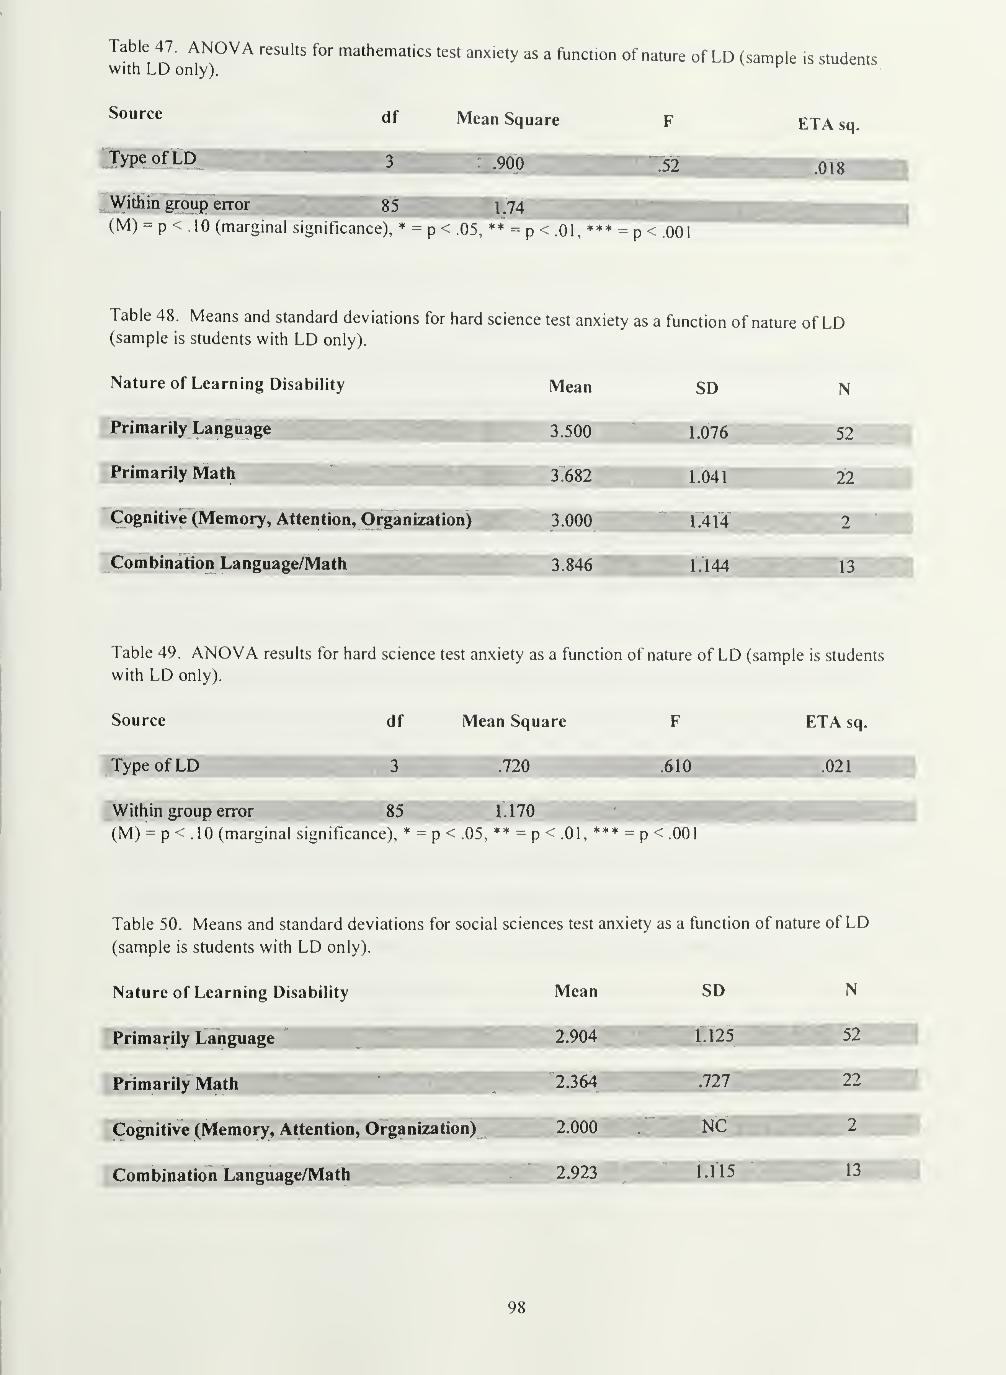
Table 47. ANOVA results for mathematics test anxiety as a ftinction of nature of LD (sample is studentswith LD only).
^
df Mean Square F ETA sq.
Type ofLD^ 3 .900 .52 .018
Within group error 85 L74(M) = p < .10 (marginal significance), * = p < .05, ** = p .01, ** - p < .001
Table 48. Means and standard deviations for hard science test anxiety as a function of nature of LD(sample is students with LD only).
Nature of Learning Disability Mean SD N
Primarily Language 3.500 1.076 52
Primarily Math 3.682 1.041 22
Cognitive (Memory, Attention, Organization) 3,000 1.414 2
Combination Language/Math ' 3.846 1.144 13
Table 49. ANOVA results for hard science test anxiety as a function of nature of LD (sample is students
with LD only).
Source df Mean Square F ETA sq.
Type ofLD 3 .720 .610 .021
Within group error 85 1.170
(M) - p < .10 (marginal significance), * - p < .05, ** = p < .01, *** = p < .001
Table 50. Means and standard deviations for social sciences test anxiety as a function of nature of LD(sample is students with LD only).
Nature of Learning Disability Mean SD N
Primarily Language 2.904 1.125 52
Primarily Math 2.364 .727 22
Cognitive (Memory, Attention, Organization) 2.000 NC 2
Combination Language/Math 2.923 ^ ... LI 15
98
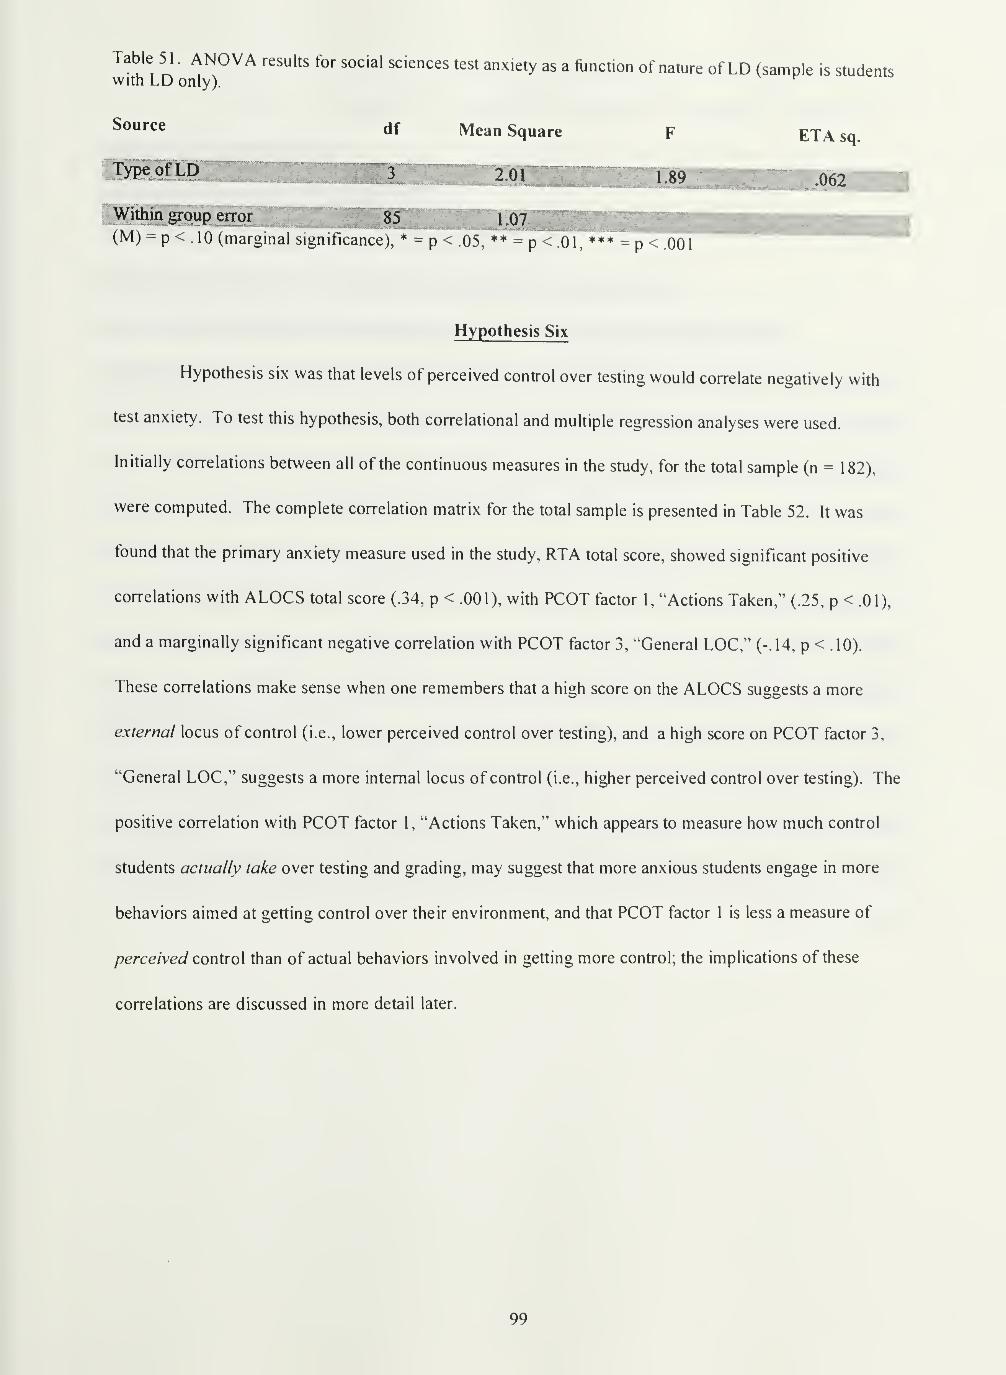
Table 51. ANOVA results for social sciences test anxiety as a function of nature of LD (sample is studentsWith LD only).
Source
Type
F
i:89
ETA sq.
.062
Withm group errormwM)mmm^^^^^^^^^^^^^
^
(M) = p < .10 (marginal significance), * = p < .05, ** = p < .01, ** = p< QOl
Hypothesis Six
Hypothesis six was that levels of perceived control over testing would correlate negatively with
test anxiety. To test this hypothesis, both correlational and multiple regression analyses were used.
Initially correlations between all of the continuous measures in the study, for the total sample (n = 182),
were computed. The complete correlation matrix for the total sample is presented in Table 52. It was
found that the primary anxiety measure used in the study, RTA total score, showed significant positive
correlations with ALOCS total score (.34, p < .001), with PCOT factor 1, ^^Actions Taken," (.25, p < .01),
and a marginally significant negative correlation with PCOT factor 3, "General LOG," (-.14, p < .10).
These correlations make sense when one remembers that a high score on the ALOGS suggests a more
external locus of control (i.e., lower perceived control over testing), and a high score on PGOT factor 3,
"General LOG," suggests a more internal locus of control (i.e., higher perceived control over testing). The
positive correlation with PGOT factor 1, "Actions Taken," which appears to measure how much control
students actually take over testing and grading, may suggest that more anxious students engage in more
behaviors aimed at getting control over their environment, and that PGOT factor 1 is less a measure of
perceived control than of actual behaviors involved in getting more control; the implications of these
correlations are discussed in more detail later.
99
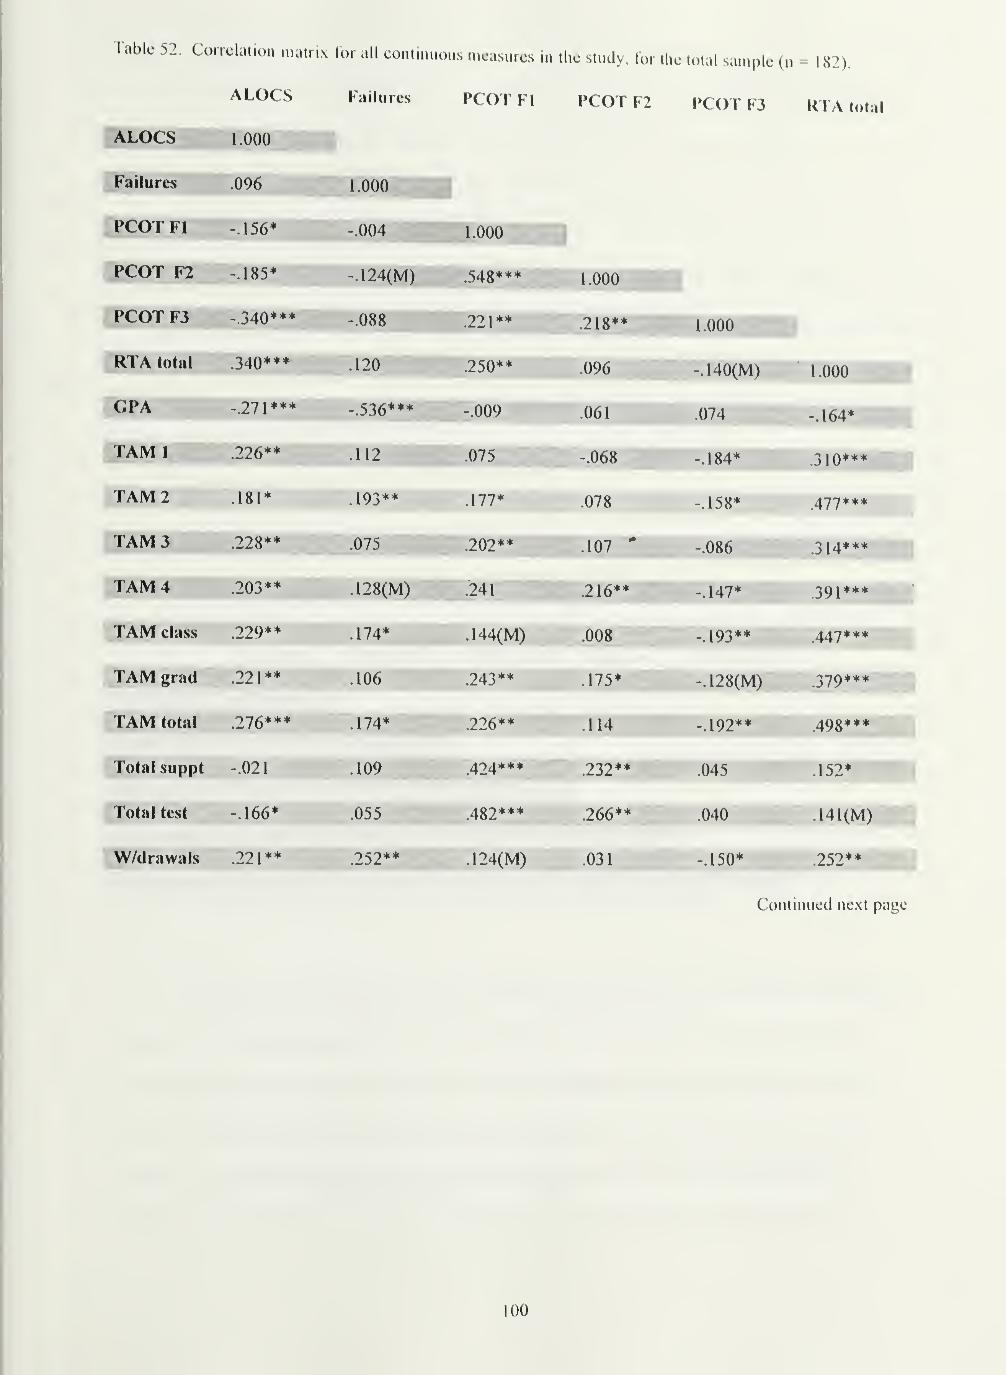
Table 52. Correlation matrix for all continuous measures in the study, for the total sample (n = 182).
Failures PCOT Fl PCOT F2 PCOT F3 RTA total
ALOCS 1 000
Failures 096 1 000
PCOT Fl -.156* - 004
PCOT F2 -.185* 1 f\f\f\l.UUU
PCOT F3 -.340*** -.088"
^221** .218** i.oooimii[
RTA total .340*** .120 .250** .096 -.140(M) 1.000
-.271*** -.536*** -.009 .061 .074 -.164*
TAM 1 .226** .112 .075 -.068 -.184* .310***
TAM 2 .181* .193** .177* .078 -.158* .477***
TA1V13 .228** .075 .202** ,107•
-.086 .314***
TAM 4 .203** .128(M) .241 .216** -.147*
TAM class .229** .174* .144(M) .008 -.193** .447***
TAM grad .221** .106 .243** .175* -.128(M) .379***
TAM total .276*** .174* .226** .114 -.192** .498***
Total suppt -.021 .109 .424*** .232** .045 .152*
Total test -.166* •055 ^ .482*** .266** .040 .141(M)
W/drawals .221**.252''imL. .124(M) .031 -.150* .252**
Conliiuicd next page
100
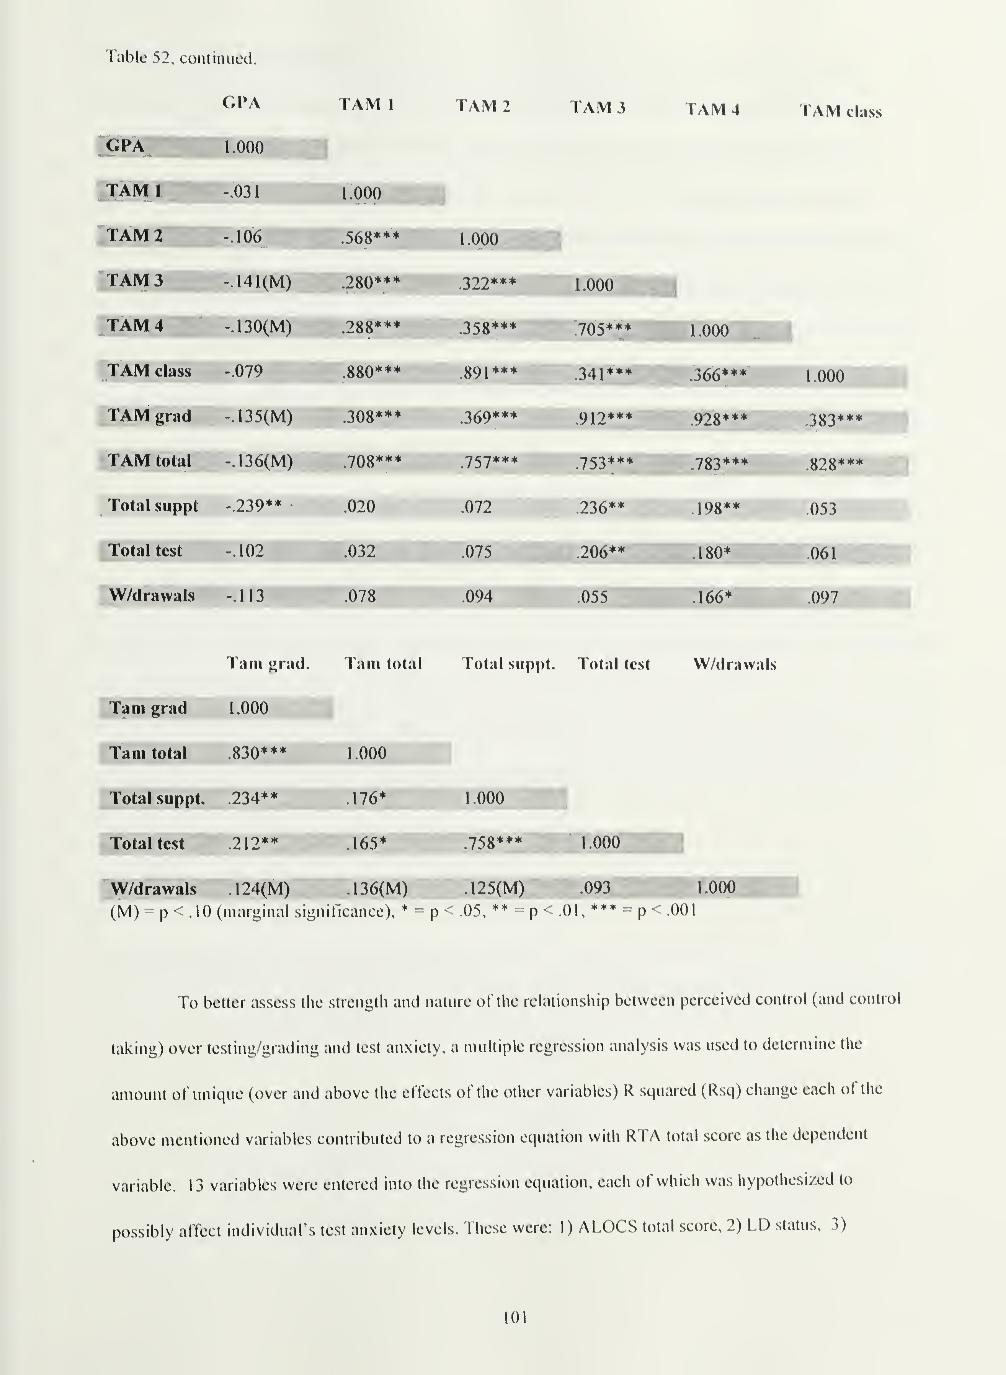
Table 52, continued
CPA TAIM 1 TAIM 2 TAIM ^ T A IVI J1 /VIVI 4 I Alvi Class
CPA 1.000
TAM 1 -.031 1.000
,TAIVI2 -.106 .568*** 1.000
TAM 3 -.141(N4) .280*** .322*** 1.000i
TAM 4 -.130(M) .288*** .358*** .705*** 1.000
TAM class -.079 .880*** .891*** .341*** .366*** 1.000 :
TAM grad -.135(M) .308*** .369*** .912*** .928*** .383*** mTAM total -.136(M) .708*** .757*** .753*** .783*** .828***
Total suppt -.239** .020 .072 .236** .198** .053
Total test -.102 .032 .075 .206** .180* .061
W/drawals -.113 .078 .094 .055 .166* .097
Tarn jjrad. Tain total Total suppt. Total test
Tarn grad 1.000
1.000
.176*
.165*
Tarn total .830***
Total suppt. 234**
Total test .212
1.000
.758*** 1.000
.093
W/drawals
W/drawals . 1 24(M) . 1 36(M) . 125(M)
(M) - p - .10 (marginal significance), * p - .05, ** p • .01, ** p .001
1.000
To better assess the strength and nature of the relationship between perceived control (and control
taking) over testing/grading and test anxiety, a multiple regression analysis was used to determine the
amount of unique (over and above the effects of the other variables) R squared (Rsq) change each of the
above mentioned variables contributed to a regression equation with RTA total score as the dependent
variable. 13 variables were entered into the regression equation, each of which was hypolhesi/ed to
possibly affect individual's test anxiety levels. These were: 1 ) ALOCS total score, 2) LD status, 3)
101

academic major. 4) use of testing support services, 5) use of general support services, 6) sex, 7) PCOT
lactor 1, 8) PCOT factor 2, 9) PCOT factor 3, 10) grade level, 1 1 ) (ii'A, 12) number of courses failed in
college, and 13) number of courses withdrawn from due to fear ol failure. Categorical variables (e.g., sex,
grade, LD status), each with k groups, were recoded into a series k- \ dummy variables, thus meaningful
regression coefficients for these categorical variables as a whole were not available, though their unique
contribution to the overall Rsq of the regression was tested. The overall regression was significant, F(I6,
161) 4.79, p - .001, with an overall Rsq of .36.
The results of the hypothesis tests for each variable indicated that (listed in decreasing order of
magnitude of effect size) ALOCS total score, sex, and PCOT factor 1, "Actions Taken," signillcantly
increased the Rsq of the regression over and above the combined effects ol the other variables in the
equation. Marginally significant increa.ses in Rsq were found for (listed in decreasing order of magnitude
of effect size) grade level, LD status, and PCOT factor 3 "General LOC." Regression data for hypothesis
six is presented in Table 53.
102
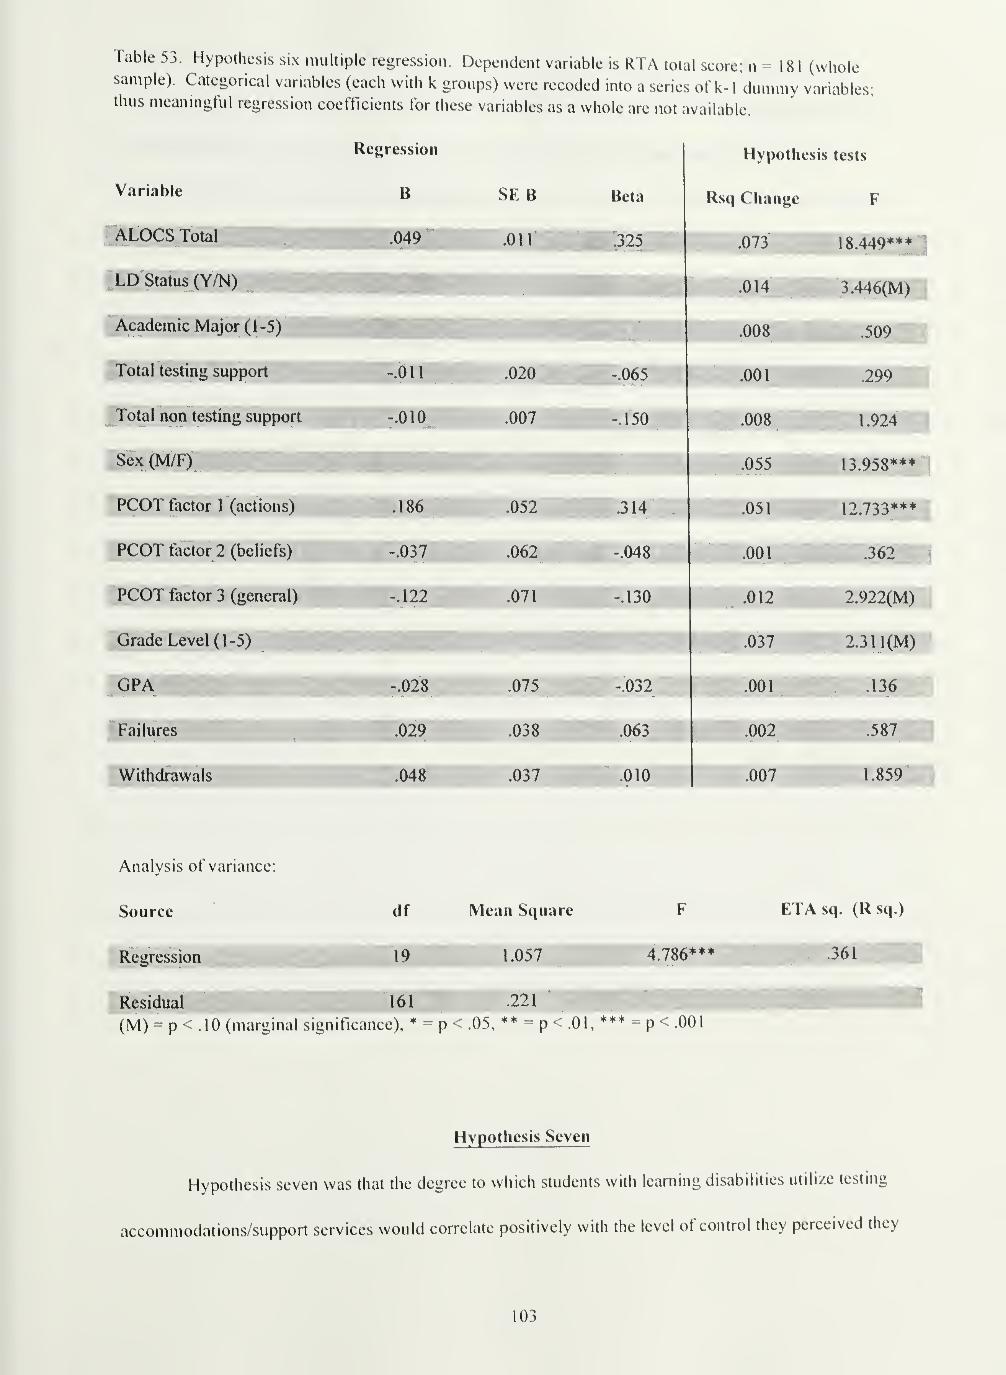
ible 53. Hypothesis six multiple regression. Dependent variable is RTA total score; n = 181 (wholeimple). Categorical variables (each with k groups) were recoded into a series of k-1 dummy variables;us meaningful regression coefficients for these variables as a whole are not available.
Regression
Variable B SE B Beta Rsn C^hiinap
ALOCS Totaljyy^yi^^ .049 .011 325 073 18 440***^
LD Status (Y/N) WKKHt^^ 014 3 446<'M'fc
Academic Major (1-5) flHHHHHH^ 008 509
Total testing support -.011 .020 -.065 001 299 9Total non testing support
m WKM^ASO 008 1 924
Sex (M/F) 055 13 958***
.051 12.733*** ^
PCOT factor 2 (beliefs) -.037 .062 -.048 .001 .362\
PCOT factor 3 (general) —-.122 '^ggSj .071 JH|-.130 .012 2.922(M) :
Grade Level (1-5) WKBtKKSKSKKKK^^ PH|.037 2.311(M)
.001 .136
.007 1.859
Analysis of variance:
Source df Mean Square ETAsq. (Rsq.)
Regression 1.057 4.786 ,361
(M) = p<^^^S^S^^!^^^^^^^, ** = p < .01, = p < .001
Hypothesis Seven
Hypothesis seven was that the degree to which students with learning disabilities utilize testing
accommodations/support services would correlate positively with the level of control they perceived they
103

iKKi over testing. To test this hypothesis, again both correlational and regression analyses were used.
Initially, correlations between all ol the continuous measures in the study, for the sample of students with
learning disabilities only (n = 90), were computed. The complete correlation matrix lor the sample of
students with learning disabilities is presented in Table 54. it was found that of the two primary measures
of the use of learning disabilities support services (use of general support services and use of testing
support services) only use of testing support services showed any significant correlations with measures of
perceived control. Use of testing support services score correlated significantly with ALOCS total score (-
.29, p < .01 ;
again it must be remembered that high scores on the ALOCS are indicative of a more external
locus of control, hence the negative correlation), and PCOT factor I , "Actions Taken" (.26, p < .05).
I hese correlations are as expected, as one way of exercising control and "taking action" is to use the
testing support services available. A marginally significant correlation was found between use of testing
support services and PCOT factor 3, "General LOC" (.20, P< .10). This supports the conceptualization of
PCOT factor 3 as a weaker measure of the general academic locus of control measured by the ALOCS. A
marginally significant correlation was also found between the use of general support services and PCOT
factor 3 (.19, p- .10).
104
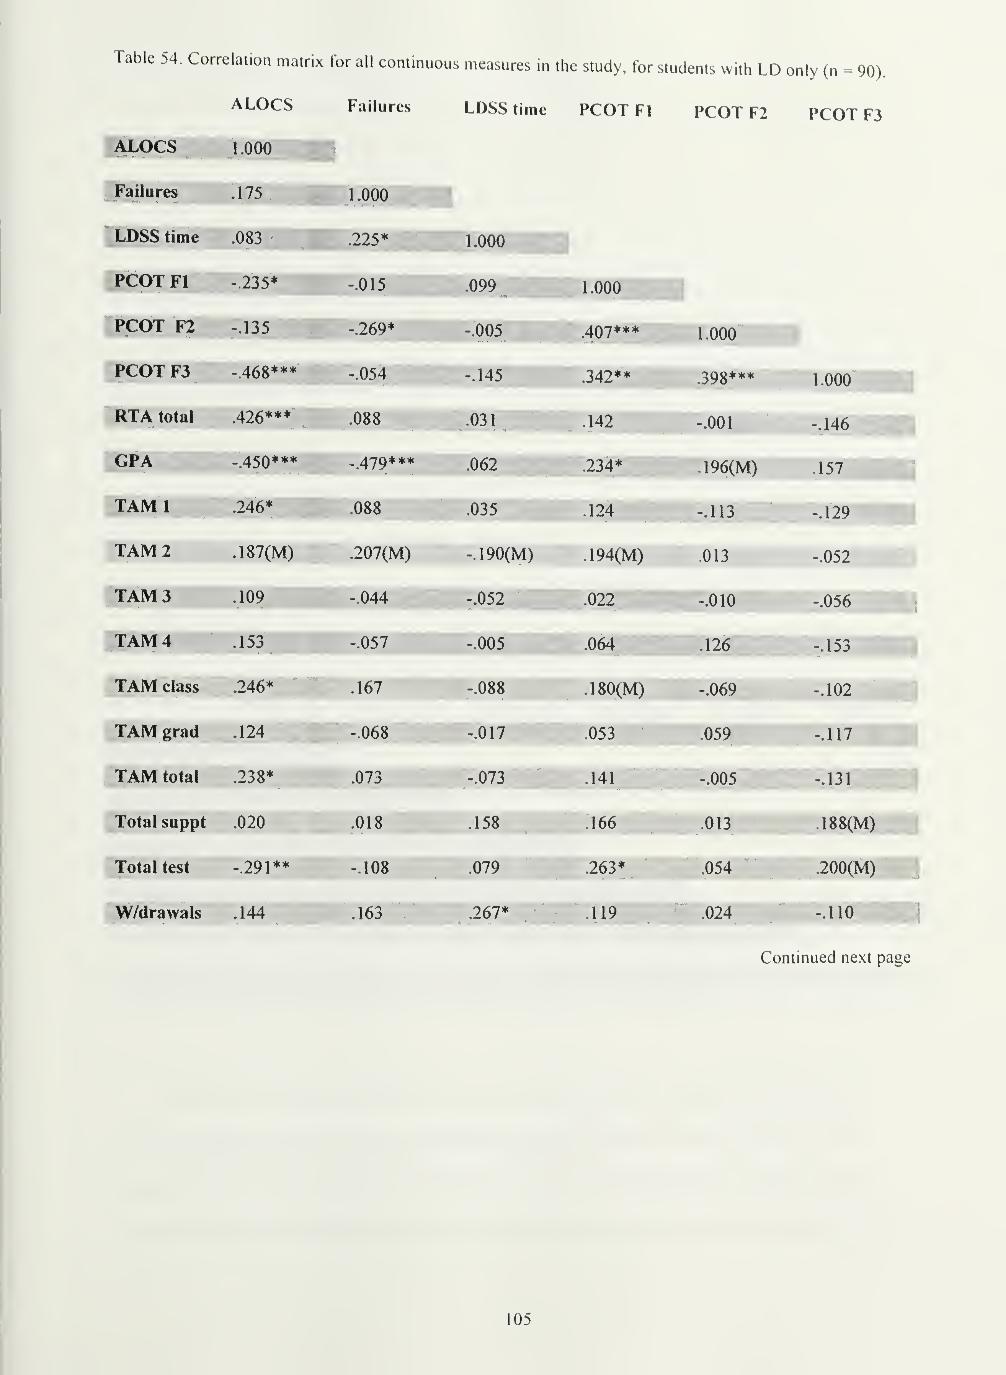
Table 54. Correlation matrix for all continuous measures in the study, for students with LD only (n = 90).
PCOT F2 PCOT F3ALOCS Failures M^LJiJiJ lllllC rl-VJ 1 r 1
ALOCS 1 .OOOjgigllg
Failures .175 ^"WlljlU- 1.000
LDSS time .083 .225* 1.000
PCOT Fl -.235* -.0151 .099 1.000
PCOT F2 -.269*— B-.005 mmm1
. .407***—
1
rcu 1 F3 -.468*** -.054 H .342**SBRTA total .426*** .031 .142
(iPA - 450***^''sT^ -.479*** ' .062 jllll .234* SHT
TAM 1 245* -^"BW!^.088 .124
TAM2 .187(M) .207(M) -.190(M) .194(M)
TAM 5.|Hfi -.044 -.052 .022
TAM1
-1^3flH .„-005 Bi
TAM class .246*
TAMgrad .124
TAM total .238*
Total suppt .020
Total test -.291
W/drawals .144
.167
-.068
: .073
618
.108
163
-.088
-.017
-.073
.158
.267*
.180(M)
.053
.141
.166
.263*
.119
1.000
.398***
-.001
.196(M)
-.113
.013
-.010
.126
-.069
.059
-.005
.013
.054
.024
1.000
-.146
.157
-.129
-.052
-.056
-.153
-.102
-.117
-.131
.188(M)
.200(M)
-.110
Continued next pa
105
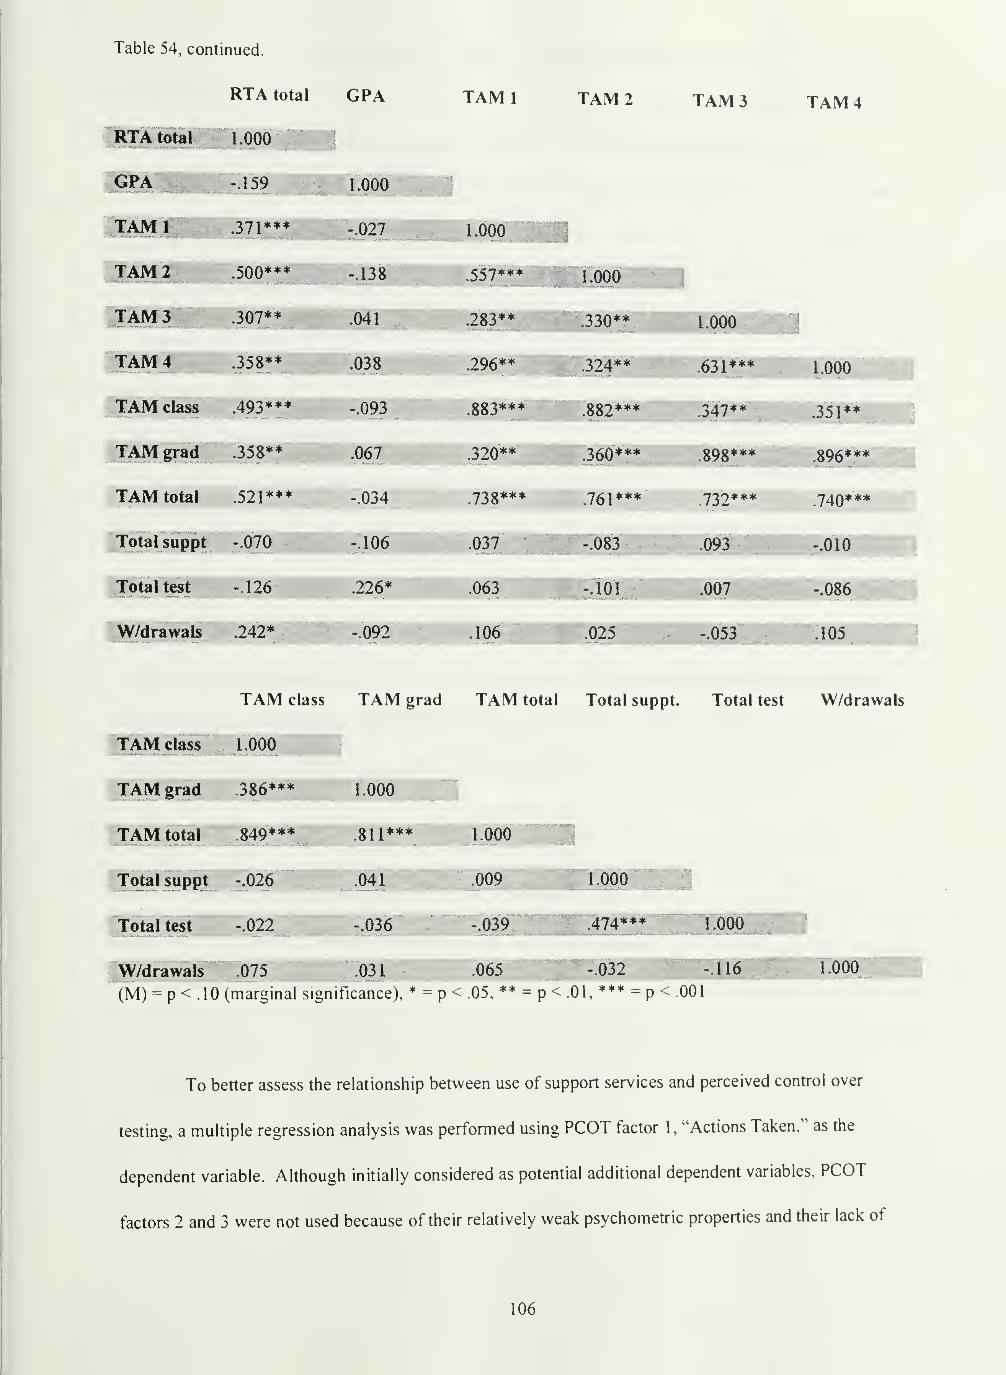
Table 54, continued.
RTA total CPA TAM 1 TAM2
RTA total 1.0
GPA
TAMl
TAM
TAM
TAM
.159
.371
I .500***
I .307**
TAM class,^u^93***
TAMgrad .358**
TAM total .521***
Total suppt -.070
Total test
W/drawals .242*
1.000
:-t>27
-.138
.041
.038
«993
.067
-.034
-.106
.226
-.092
1.000
.330
a .000
557***
283**
296*^
883***
320** ;^.J60***
,738***
.037
.063
106
.761
-.083
101
025
TAM 3
1.000
.631*
.898***
732***
.093
.007
-.05;
TAM 4
1.000
>351**
.896***
740***
-.010
-.086
105
Total test
TAM class TAM grad TAM total Total suppt. Total test W/drawals
TAM class 1.000
TAM grad .386* **
TAM total .849***
Total suppt -.026
-.022
1.000
.811**
.041
-.036
1.000
.009
-.039
1.000
;474** 1.000
w/drawals .075 .031 .065 -.032 -.116
(M) = p < .10 (marginal significance), * = p < .05, ** = p < .01, *** = p < .001
1.000
To better assess the relationship between use of support services and perceived control over
testing, a multiple regression analysis was performed using PCOT factor 1, "Actions Taken," as the
dependent variable. Although initially considered as potential additional dependent variables, PCOT
factors 2 and 3 were not used because of their relatively weak psychometric properties and their lack of
106
significant correlation with the independent variables of interest (use of testing support and use of general
support services). The regression analysis was used to determine the unique amount of Rsq each of these
variables of interest contributed to the regression equation. Seven variables, including the variables of
primary interest were used in the regression equation, each of which was hypothesized to potentially relate
to individual's control taking over testing/grading situations. These were: 1) sex, 2) study skills deficits
(Y/N), 3) use of testing support services, 4) use of general support services, 5) grade level, 6) age
diagnosed as learning disabled, and 7) ALOCS total score. Categorical variables (e.g., sex, grade level),
each with k groups, were recoded into a series of k-\ dummy variables, thus meaningful regression
coefficients for these categorical variables as a whole were not available, though their unique contributions
to the overall Rsq of the regression were tested. The overall regression for PCOT factor 1, ''Actions
Taken," was significant, F(12, 76) = 1.96, p< .05, with an overall Rsq of .24.
The results of the hypothesis tests for each variable indicated that no one variable made a
significant unique contribution to the overall regression, over and above the combined effects of the other
variables in the equation. Students' grade level (freshman through graduate) resulted in a marginally
significant unique increase in Rsq. The variables of interest, use of testing support and use of general
support services, made non-significant contributions to the overall Rsq when the effects of the other
variables were also considered. Regression data for hypothesis seven is presented in Table55.
107
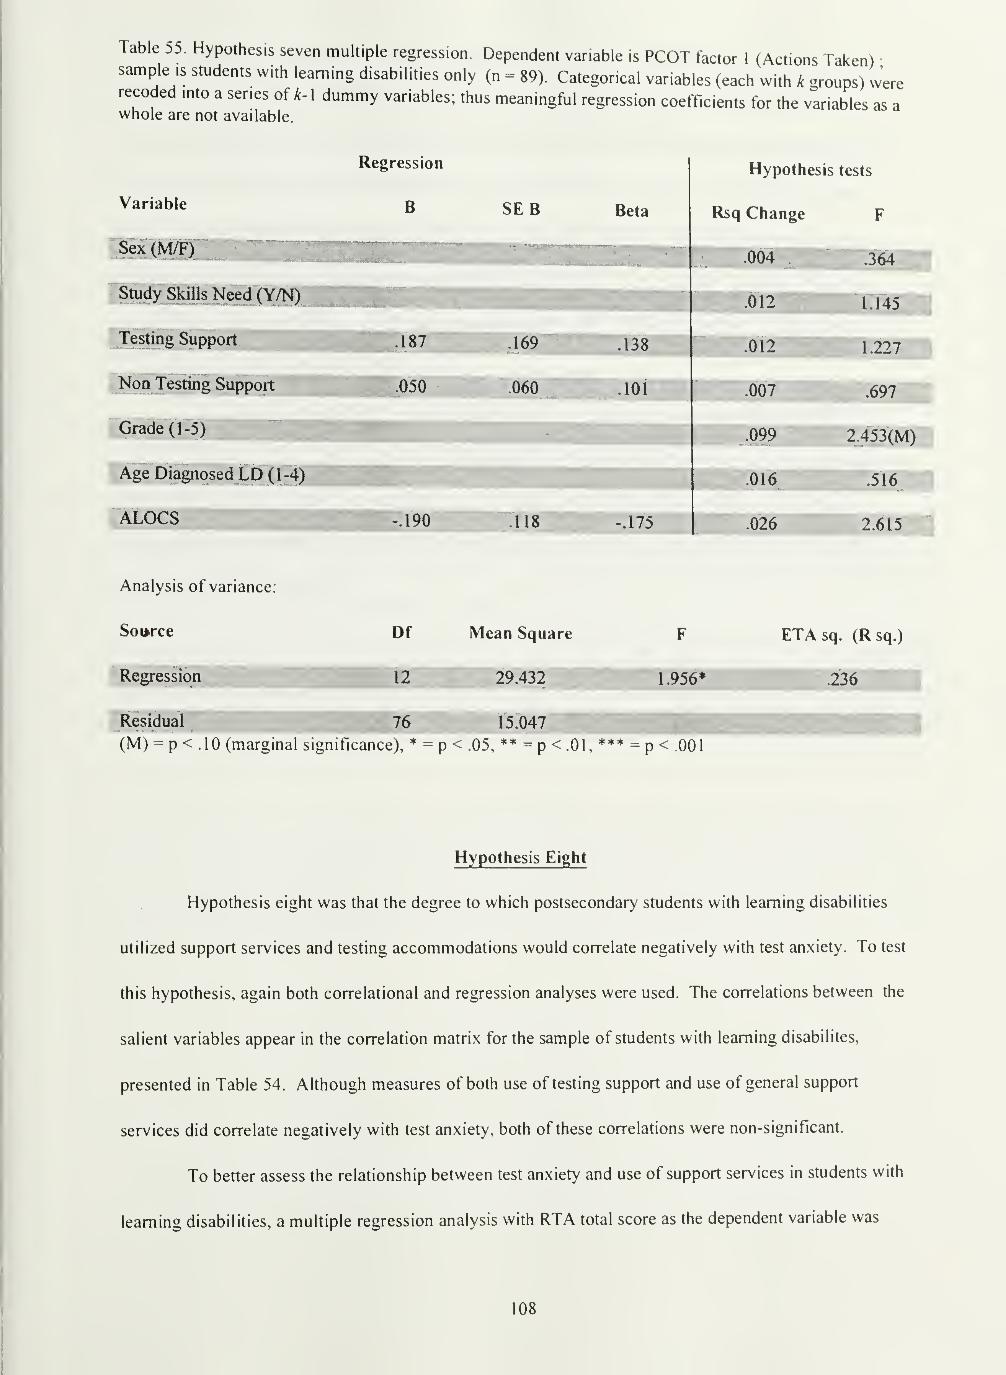
Table 55. Hypothesis seven multiple regression. Dependent variable is PCOT factor 1 (Actions Taken) •
sample .s students with learning disabilities only (n = 89). Categorical variables (each with k groups) wererecoded into a series of k-\ dummy variables; thus meaningful regression coefficients for the variableswhole are not available.
as a
Variable
Study Skills"WeeaiTOJ
Testing Support
Non Testing Support
Grade (1-5)
Age Diagnosed LD (1-4)
ALOCS
Regression
B
T8T
.050
SEB
169
.060
Beta
138
101
190 118 175
Hypothesis tests
Rsq Change
.004
.012
:oi2^^^
.007
.099
.016
.026
F
.364
1.145
"1.227'
.697
2.453(M)
.516
2.615
Analysis of variance:
Soiwce Df Mean Square
(M) = p < .10 (marginal significance), * = p < .05, ** = p < .01, p < .001
ETAsq. (Rsq.)
Regression 12 29.432 1.956* .236
Residual 76 15.047
Hypothesis Eight
Hypothesis eight was that the degree to which postsecondary students with learning disabihties
utilized support services and testing accommodations would correlate negatively with test anxiety. To test
this hypothesis, again both correlational and regression analyses were used. The correlations between the
salient variables appear in the correlation matrix for the sample of students with learning disabilites,
presented in Table 54. Although measures of both use of testing support and use of general support
services did correlate negatively with test anxiety, both of these correlations were non-significant.
To better assess the relationship between test anxiety and use of support services in students with
learning disabilities, a multiple regression analysis with RTA total score as the dependent variable was
108
performed on the sample of students with learning disabilities only. 1 1 variables hypothesized to be
predictive of test anxiety, including the two measures of use of support services, were entered into the
regression equation, and the unique amount of Rsq change accounted for by each variable over and above
the combined effects of the other variables in the equation was tested. Categorical variables (e.g., sex,
grade level), each with k groups, were recoded into a series of k-\ dummy variables, thus meaningful
regression coefficients for these categorical variables as a whole were not available, though their unique
contributions to the overall Rsq of the regression were tested. The overall regression was significant, F(14,
74) = 2.90, p< .01, with an overall Rsq of .35.
The results of the hypothesis tests (significance of Rsq change) for each variable indicated that
ALOCS total score, PCOT factor 1 (Actions Taken), and sex significantly increased the Rsq over and above
the combined effects of the other variables in the equation. None of the other variables in the equation,
including the two measures of use of support services, were significant. Regression data for hypothesis
eight is presented in Table 56.
109
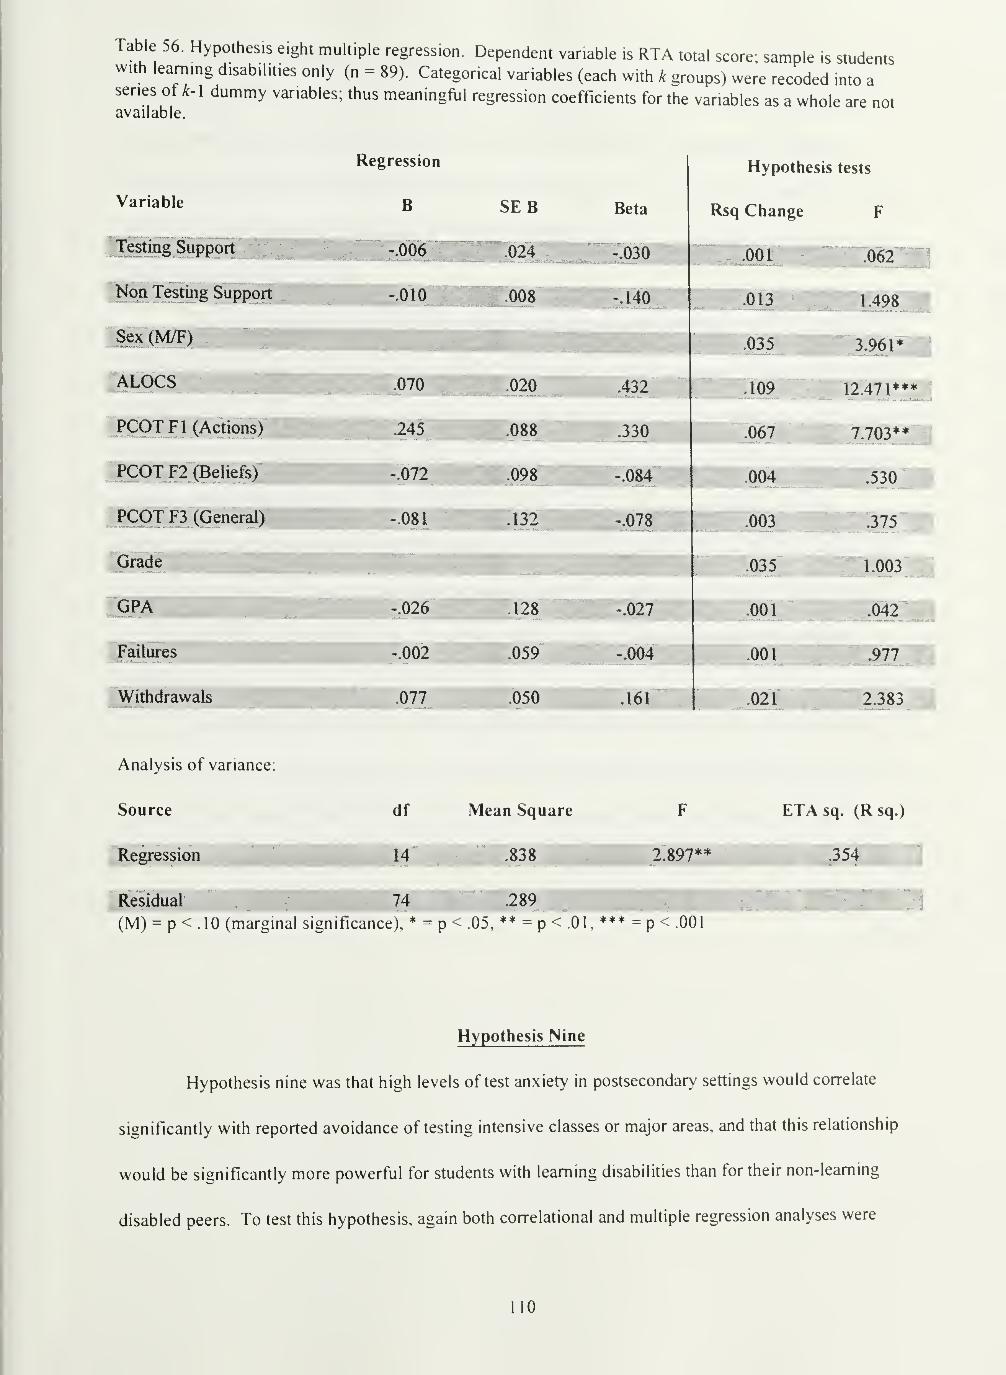
Table 56. Hypothesis eight multiple regression. Dependent variable is RTA total score; sample is studentswith learning disabilities only (n = 89). Categorical variables (each with k groups) were recoded into aseries of A-1 dummy variables; thus meaningfti! regression coefficients for the variables as a whole are notavailable.
Regression Hypothesis tests
Variable B SE B Beta Rsq Change F
Testing Support H^:o24' -.030 ^001 .0625
Non Testing Support "'*^BBK.010
1
.013 1.498 m
.035 3.961* 1
ALQcs ^^^^sBmBBBm .109 12.471***'
PCOTFl (Actions) ;|wBSm^^^ 1 Ml 7.703**:
PCOTF2 (Beliefs)JHH mm .098 -.084. . .004 .530 '
PCOT F3 (General) ^ K-.078 .003 .375
.035 1.003
CPA ^mmmmBBmWmM- " --026
1
Hff -128 -.027 .001'
' :042^
FailureilHHBnHiHSr " --002 -.004 .001 .977
Withdrawals ^^HH .050 .161 .021 2.383
Analysis of variance:
Source df Mean Square F ETA sq. (Rsq.)
Regression 14 .838 2.897** .354
(M) = p < foSr^ ** = p < .01, ** = p < .00
Hypothesis Nine
Hypothesis nine was that high levels of test anxiety in postsecondary settings would correlate
significantly with reported avoidance of testing intensive classes or major areas, and that this relationship
would be significantly more powerful for students with learning disabilities than for their non-learning
disabled peers. To test this hypothesis, again both correlational and multiple regression analyses were
110
used. In terms of correlations, the relationship between RTA total score, TAM factor 1 (Admissions Test
Avoidance), TAM factor 2 (Class Avoidance), and TAM total score were investigated. Correlations
between these variables for the total sample (n = 182) appear in Table 52. As predicted, significant
correlations were found between RTA total score and TAM factor 1, "Admissions Test Avoidance/' (.38, p
< .001), RTA total score and TAM factor 2, ^'Class Avoidance,^' (.45, p < .001), and RTA total score and
TAM total score (.50, p < .001).
To better assess the relationship between test anxiety and testing avoidance, and to investigate the
nature of the interaction between LD status and test anxiety as it relates to testing avoidance, three multiple
regression analyses, the first using TAM factor 1 as the dependent variable, the second using TAM factor 2
as the dependent variable, and the third using TAM total score as the dependent variable, were performed
using the total sample (n = 1 82). Independent variables were RTA total score, LD status, and the
interaction between RTA total score and LD status. As LD status is a categorical variable it was recoded
into a dummy variable, thus no meaningful regression coefficients were available for this variable, but its
unique contribution to the overall Rsq over and above the combined effect of the other variables was
tested.
For TAM factor 1, "Admissions Test Avoidance,'' the overall regression was significant, F(3, 178)
= 13.56, p > .001, with an overall Rsq of .19. The results of the hypothesis tests (significance of Rsq
change) for each variable indicated that only RTA total score made a significant unique contribution to the
overall Rsq over and above the combined effects of the other variables. Regression data for hypothesis
nine, regression 1 (TAM factor 1) is presented in Table 57.
4
111
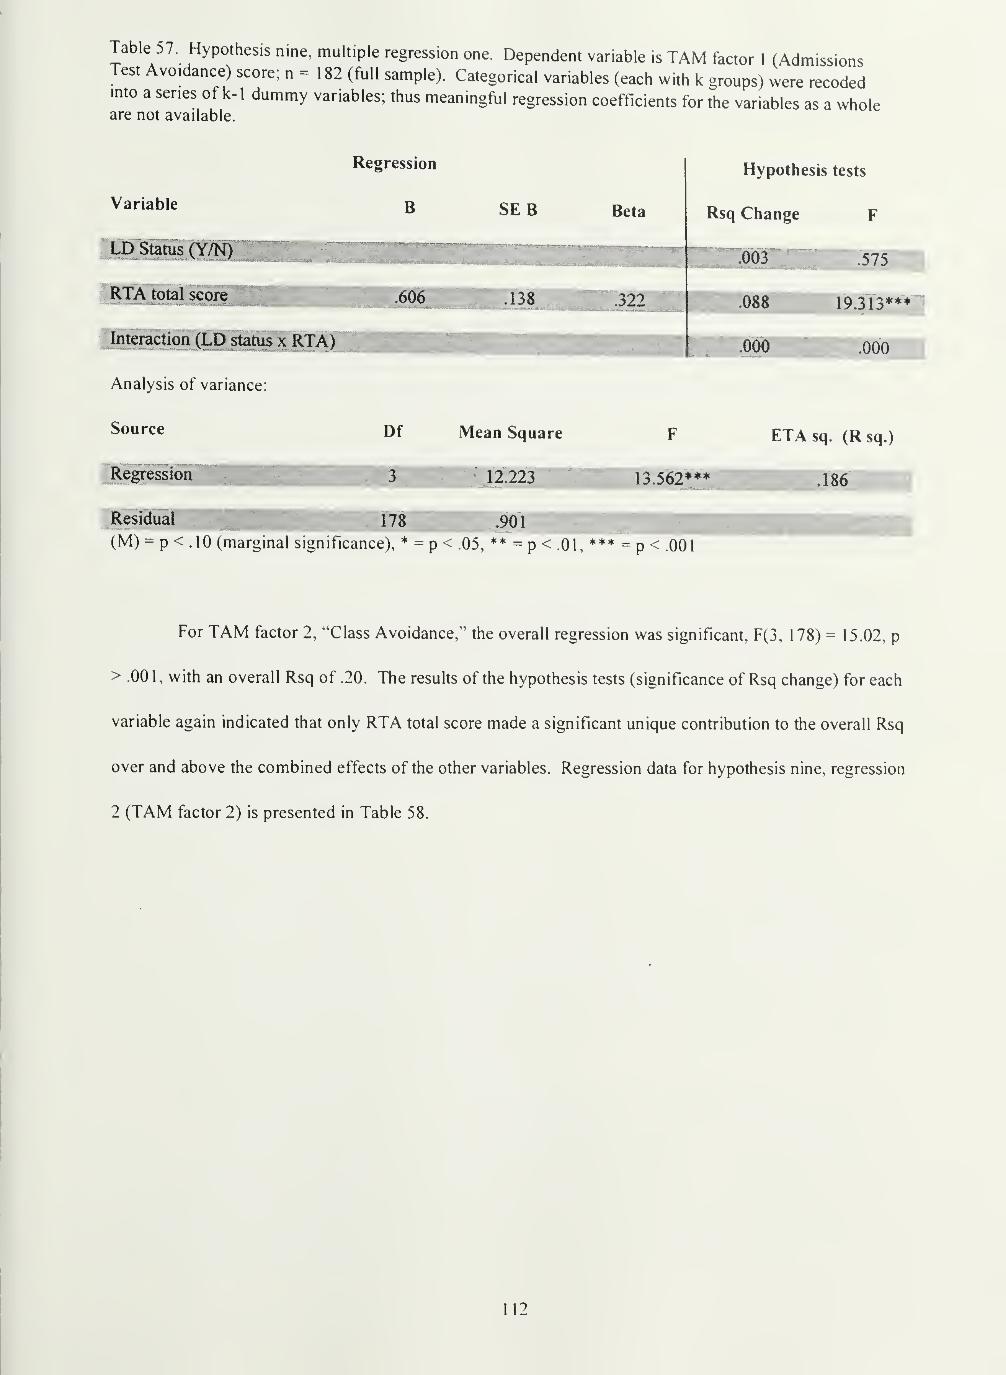
Table 57. Hypothesis nine, multiple regression one. Dependent variable is TAM factor 1 (AdmissionsTest Avoidance) score: n = 182 (ftill sample). Categorical variables (each with k groups) were recodedinto a series of k-1 dummy variables; thus meaningftil regression coefficients for the variables as a wholeare not available.
Variable
Regression
B SEB Beta
Hypothesis tests
Rsq Change F
td Status(ywWKM B^003 .575
KiA total score JHlHl .322'
.088 19.313***
mieraction (JLU stanisirlc.000
Analysis of variance:
Source Df Mean Square F ETA sq. (Rsq.)
RegressionJIIIIII^^ E 12.223MM 13.562 .186
(M) = p < .10 (marginal significance), * = p < .05, ** = p < .01, *** = p < .001
For TAM factor 2, "Class Avoidance," the overall regression was significant, F(3, 178) = 15.02, p
> .00 1 , with an overall Rsq of .20. The results of the hypothesis tests (significance of Rsq change) for each
variable again indicated that only RTA total score made a significant unique contribution to the overall Rsq
over and above the combined effects of the other variables. Regression data for hypothesis nine, regression
2 (TAM factor 2) is presented in Table 58.
112
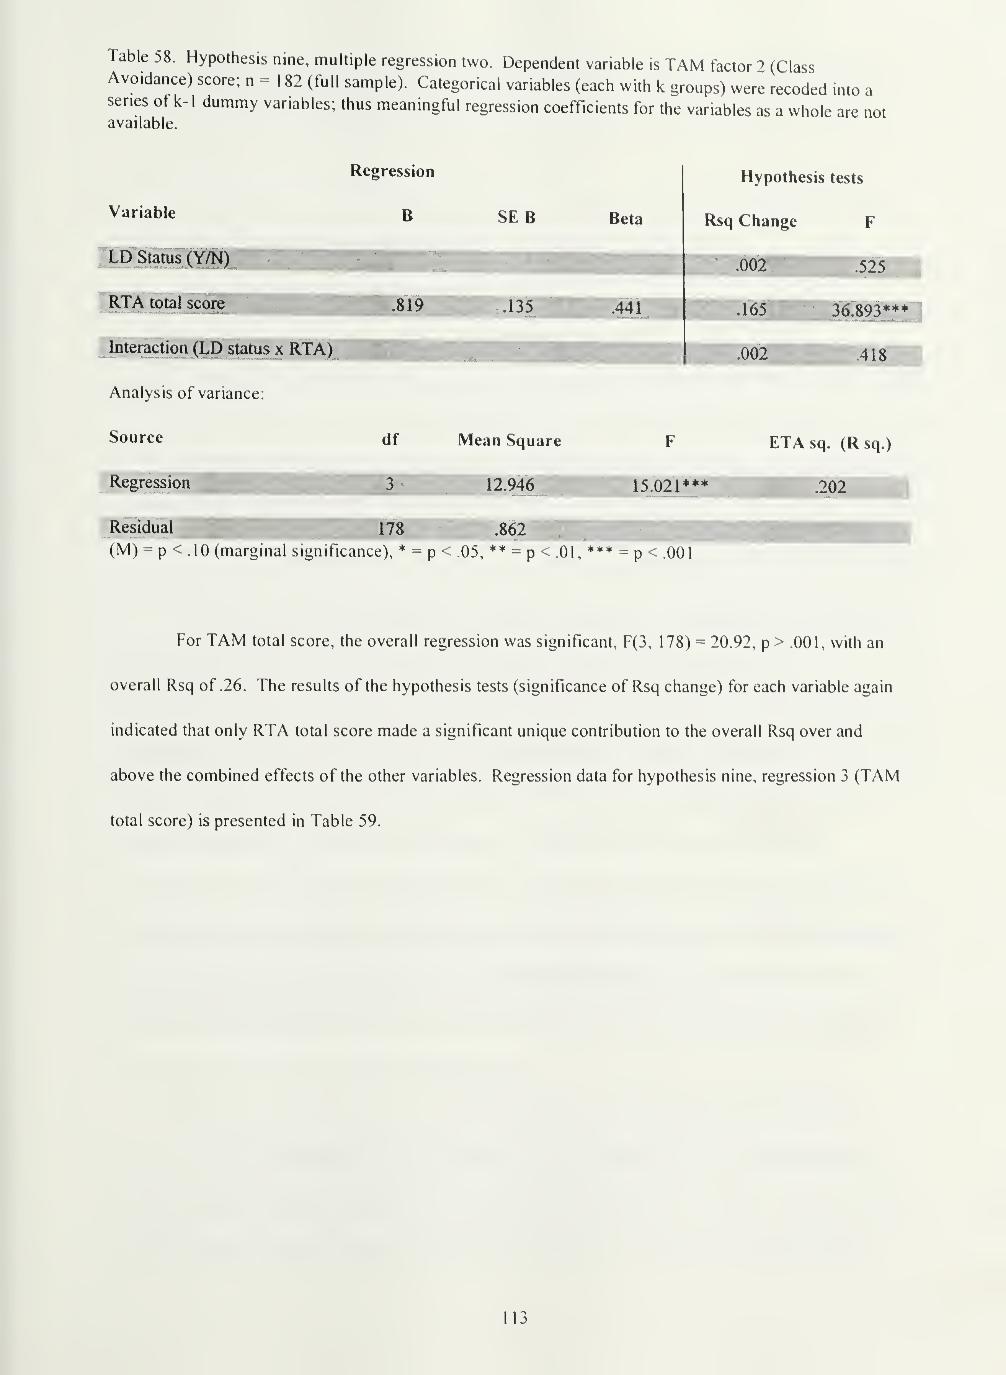
Table 58. Hypothesis nine, multiple regression two. Dependent variable is TAM factor '> (ClassAvoidance) score; n = 182 (full sample). Categorical variables (each with k groups) were recoded into aseries ot k-1 dummy variables; thus meaningful regression coefficients for the variables as a whole are notavailable.
Variable
Regression
B SE B Beta
Hvnnthpcic fpcfc
Rsq Change F
.002 .525
K 1A total score ^flHHHH,819 mm K441 9HK165 . 36 89^***
Interaction (LD status x RTA)^ 1.002 .9Hn|418
Analysis of variance:
Source df Mean Square F ETAsq. (Rsq.)
^ 15.021
W .862 ^WP"(M) = p < .10 (marginal significance), * = p < .05, ** = p < .01, *** = p < .001
For TAM total score, the overall regression was significant, F(3, 1 78) = 20.92, p > .00 1 , with an
overall Rsq of .26. The results of the hypothesis tests (significance of Rsq change) for each variable again
indicated that only RTA total score made a significant unique contribution to the overall Rsq over and
above the combined effects of the other variables. Regression data for hypothesis nine, regression 3 (TAM
total score) is presented in Table 59.
113
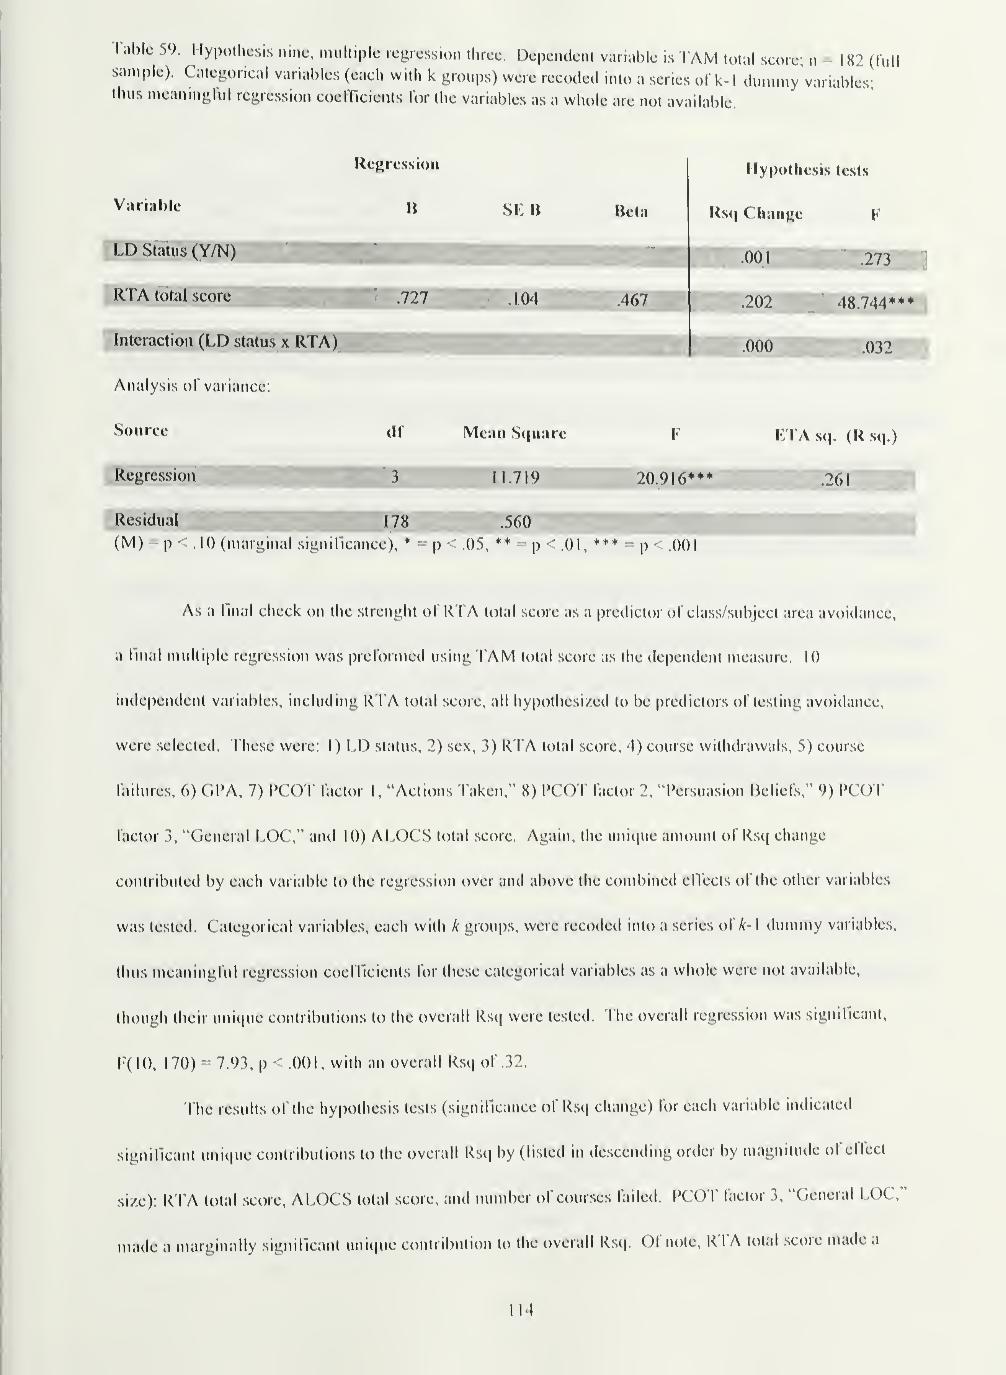
Table 59. Hypothesis nine, multiple regression three. Dependent variable is TAM total score; n - 182 (lullsample). C'ateiiorical variables (each with k groups) were recoded into a series ol k-l dummy'variables;thus meaninglul regression coefiicients for the variables as a whole are not available
Variable
LD Status (Y/N)
Kcyrcssion
B SEB Beta
RTA total score'
'
'WtKB" .727
"Interaction (LD status x RTA)
.104 .467
Hypothesis tests
Rsq Change
.001 ,273
.202
.000
48.744
.032 1Analysis of variance:
Source
Regression
df Mean Square
11.719 20.916
K I A sq. (R sq.)
.261
Residual 178 .560
(M) = p < .10 (marginal significance), p .05,** p .01,*** p .001
As a dnal check on the strenght of RTA total score as a predictor of class/subject area avoidance,
a final multiple regression was preformed using TAM total score as the dependent measure. 10
independent variables, including l< l A lolal score, all hypothesized to be predictors of testing avoidance,
were selected. These were: 1 ) LI) status, 2) sex, 3) R I'A total score, 4) course withdrawals, 5) course
failures, (>) GPA, 7) PCO T factor 1, "Actions faken," 8) PCOT factor 2, "Persuasion Beliefs " 9) PCOT
lactor 3, "General LOC," and 10) ALOCS total score. Again, the unique amount of Rsq change
contributed by each variable to the regression over and above the combined elTccts of the other variables
was tested. Categorical variables, each with k groups, were recoded into a series of ^-1 dummy variables,
thus meaningful regression coefficients for these categorical variables as a whole were not available,
though their unique contributions to the overall Rsq were tested. The overall regression was signillcant,
i'(IO, 170) 7.93, p - .001, with an overall Rsq of .32.
The results of the hypothesis tests (significance of Rsq change) lor each variable indicated
signillcant unique contributions to the overall Rsq by (listed in descending order by magnitude of effect
size): R TA total score, ALOCS total score, and number of courses failed. PCOT factor 3, "General LOC,"
made a marginally significant unique contribution to the overall Rsq. Of note, RTA total score made a
114
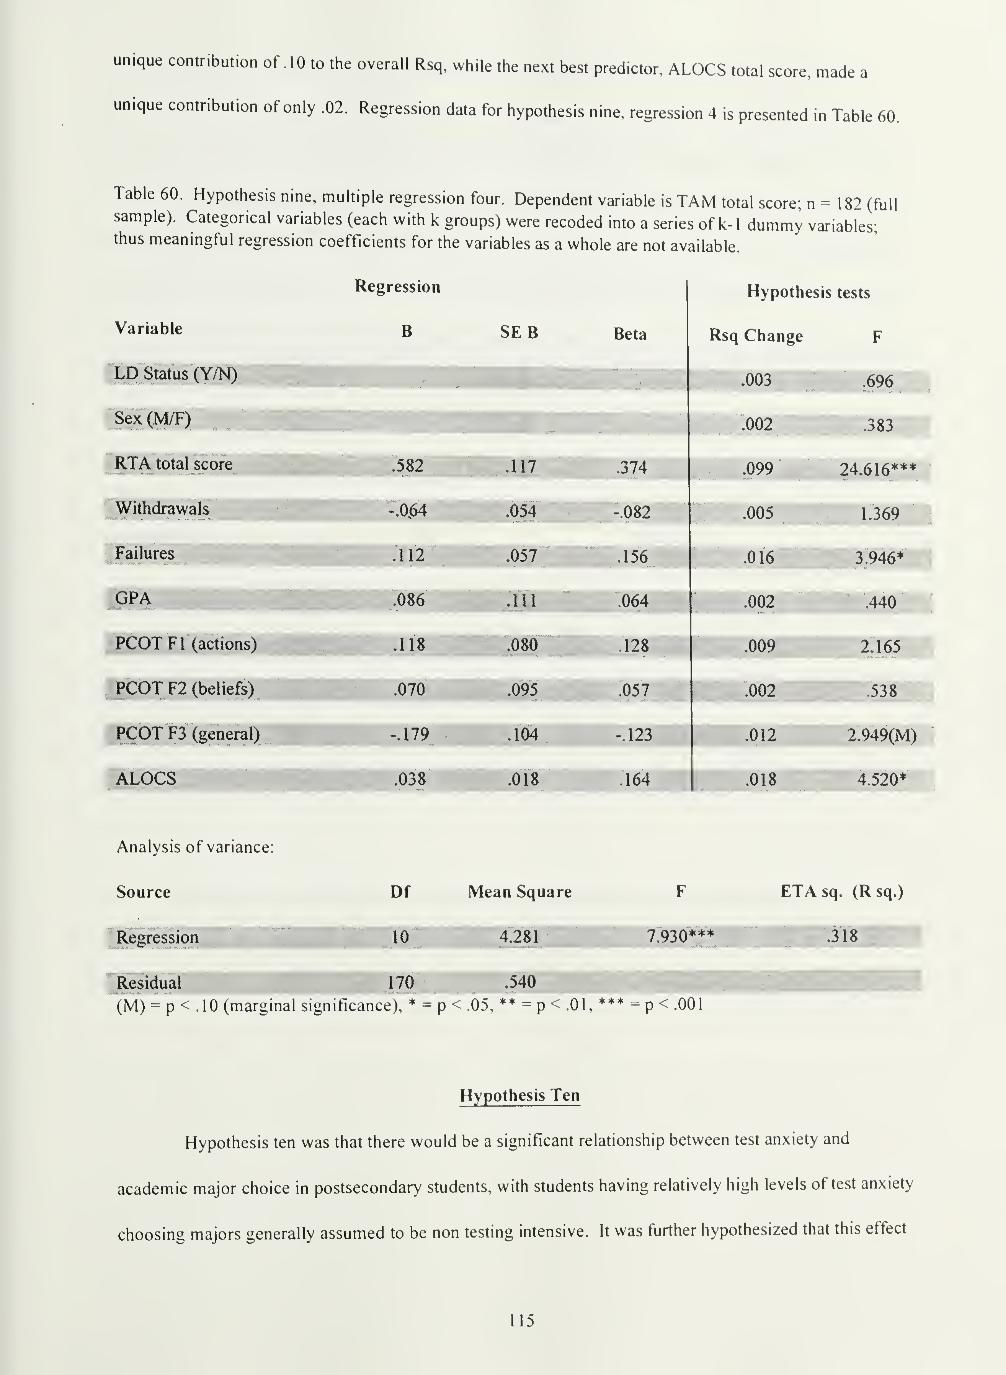
unique contribution of .10 to the overall Rsq, while the next best predictor, ALOCS total score, made a
unique contribution of only .02. Regression data for hypothesis nine, regression 4 is presented in Table 60.
Table 60. Hypothesis nine, multiple regression four. Dependent variable is TAM total score; n = 182 (fullsample). Categorical variables (each with k groups) were recoded into a series of k-1 dummy variables;thus meaningful regression coefficients for the variables as a whole are not available.
Regression Hypothesis tests
Variable B SE B Beta Rsq Change F
LD Status (Y/N) .003 .696
.002 .383
RTA total score .582 .117 .374 .099 24.616***
Withdrawals -.0.64 .054 -.082 .005 1.369
Failures .057....^^ .156 .016 3.946*
GP/|HHnHraiHHnI '^^^ .064 ^1m .002 .440
PCOT Fl (actions) | .080 .128 .009 2.165
PCOTF2 (beliefs) J .095 .057 .002 .538
PCOT F3 (general) .104 -.123 .012 2.949(M)
ALOCS .038 .018 .164 .018 4.520*
Analysis of variance:
Source Df Mean Square F ETA sq. (Rsq.)
Regression 10 4.281 7.930 .318
Residual 170 .540
(M) = p < .10 (marginal significance), * = p < .05, ** = p < .01, *** = p < .001
Hypothesis Ten
Hypothesis ten was that there would be a significant relationship between test anxiety and
academic major choice in postsecondary students, with students having relatively high levels of test anxiety
choosing majors generally assumed to be non testing intensive. It was further hypothesized that this effect
115
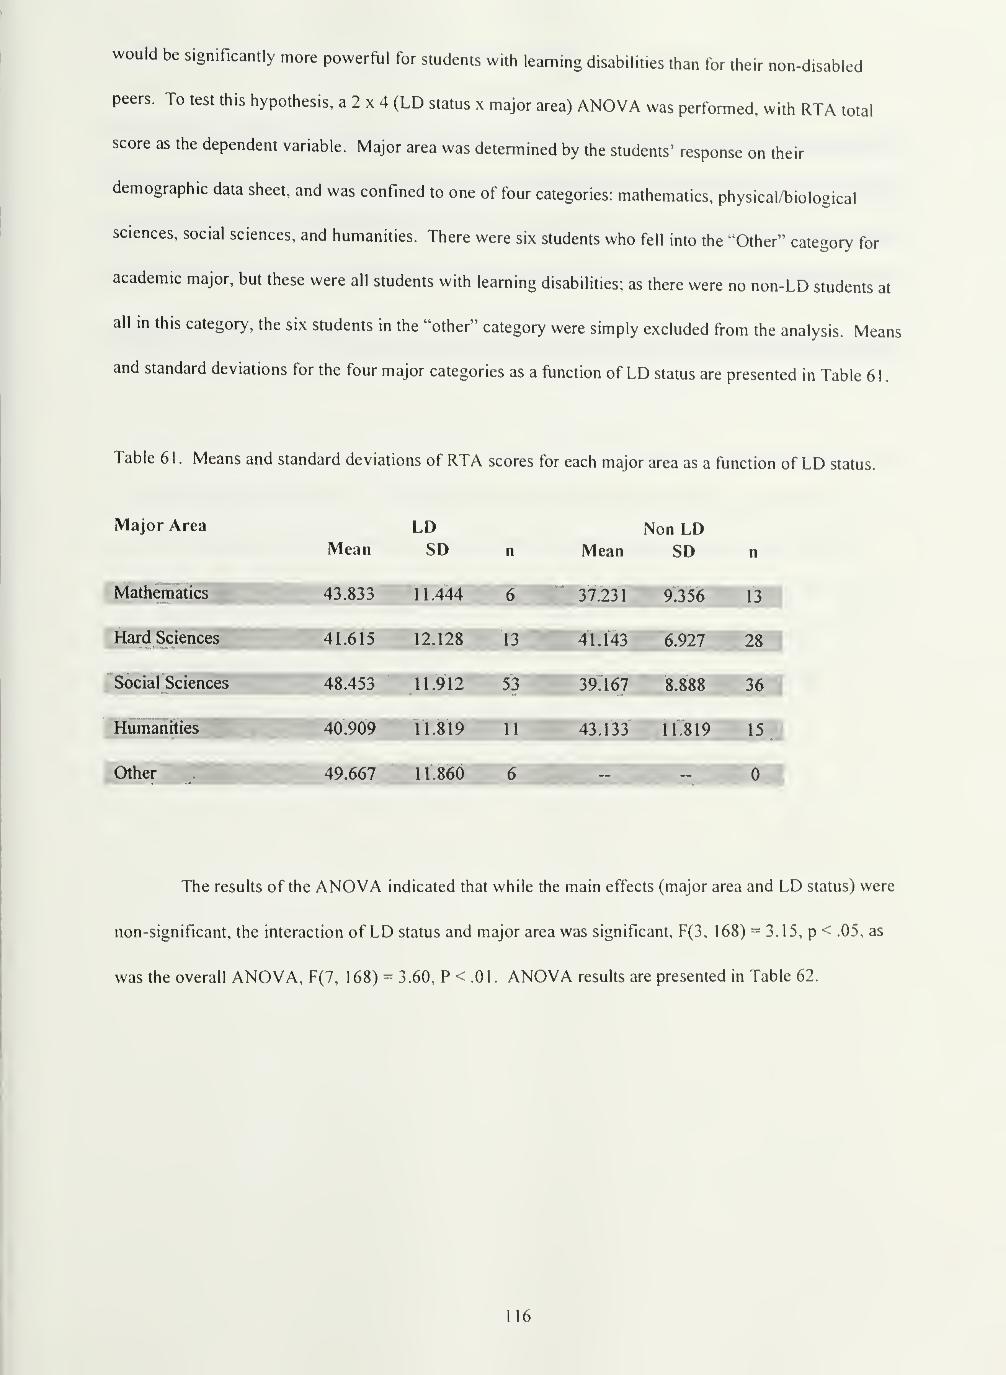
would be significantly more powerftil for students with learning disabilities than for their non-disabled
peers. To test this hypothesis, a 2 x 4 (LD status x major area) ANOVA was performed, with RTA total
score as the dependent variable. Major area was determined by the students' response on their
demographic data sheet, and was confined to one of four categories: mathematics, physical/biological
sciences, social sciences, and humanities. There were six students who fell into the "Other" category for
academic major, but these were all students with learning disabilities; as there were no non-LD students at
all in this category, the six students in the "other" category were simply excluded from the analysis. Means
and standard deviations for the four major categories as a function of LD status are presented in Table 61.
Table 6 1.Means and standard deviations of RTA scores for each major area as a function of LD status.
Major Area LD Non LDMean SD n Mean SD n
Mathematics 43.833. , n -444 6 37.231 9.356 13
Hard Sciences 41.615 12.128 13 41.143 6.927 28
Social Sciences 48.453 11.912'
' 53 39'. 167 " 8.888 36'
Humanities 40.909 11.819 11 43.133 11.819 15 '
Other 49.667 11.860 6 0 ;
The results of the ANOVA indicated that while the main effects (major area and LD status) were
non-significant, the interaction of LD status and major area was significant, F(3, 168) = 3.15, p < .05, as
was the overall ANOVA, F(7, 168) = 3.60, P < .01. ANOVA results are presented in Table 62.
116
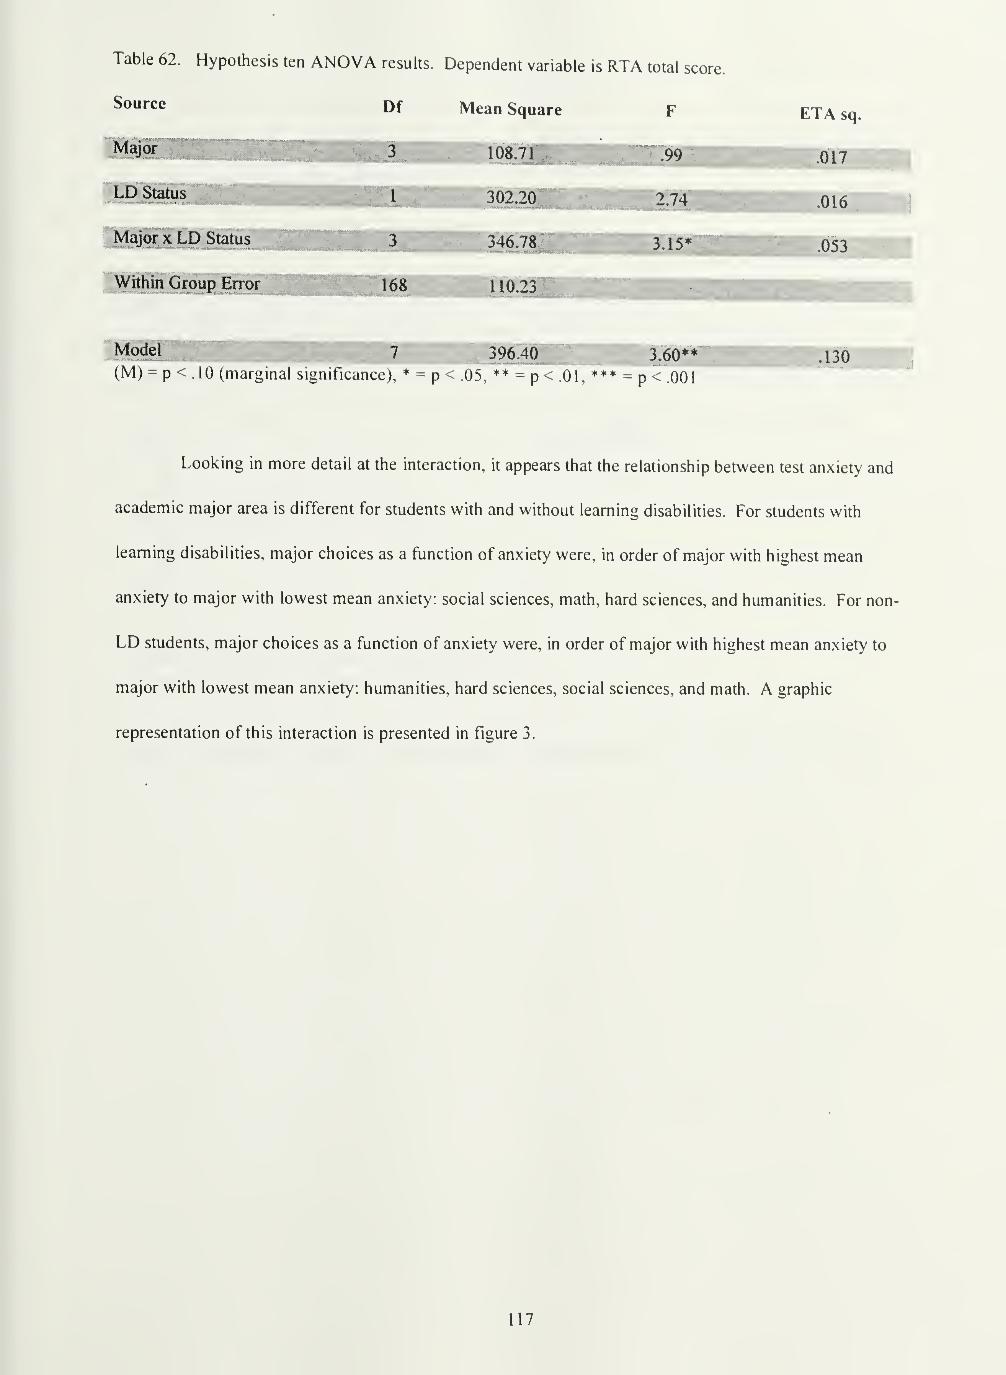
Table 62. Hypothesis ten ANOVA results. Dependent variable is RTA total score.
Source Df Mean Square F
LD Status^iMlliMHMBB^ 3Q2>2(aBllllll^
Major X LD Statu
Within Group Error
Model 7 396.4CWMBMi 3.60**
(M) = p < .10 (marginal significance), * = p < .05, ** = p< .01, *** - p < ,001
130
Looking in more detail at the interaction, it appears that the relationship between test anxiety and
academic major area is different for students with and without learning disabilities. For students with
learning disabilities, major choices as a function of anxiety were, in order of major with highest mean
anxiety to major with lowest mean anxiety: social sciences, math, hard sciences, and humanities. For non-
LD students, major choices as a function of anxiety were, in order of major with highest mean anxiety to
major with lowest mean anxiety: humanities, hard sciences, social sciences, and math. A graphic
representation of this interaction is presented in figure 3.
117
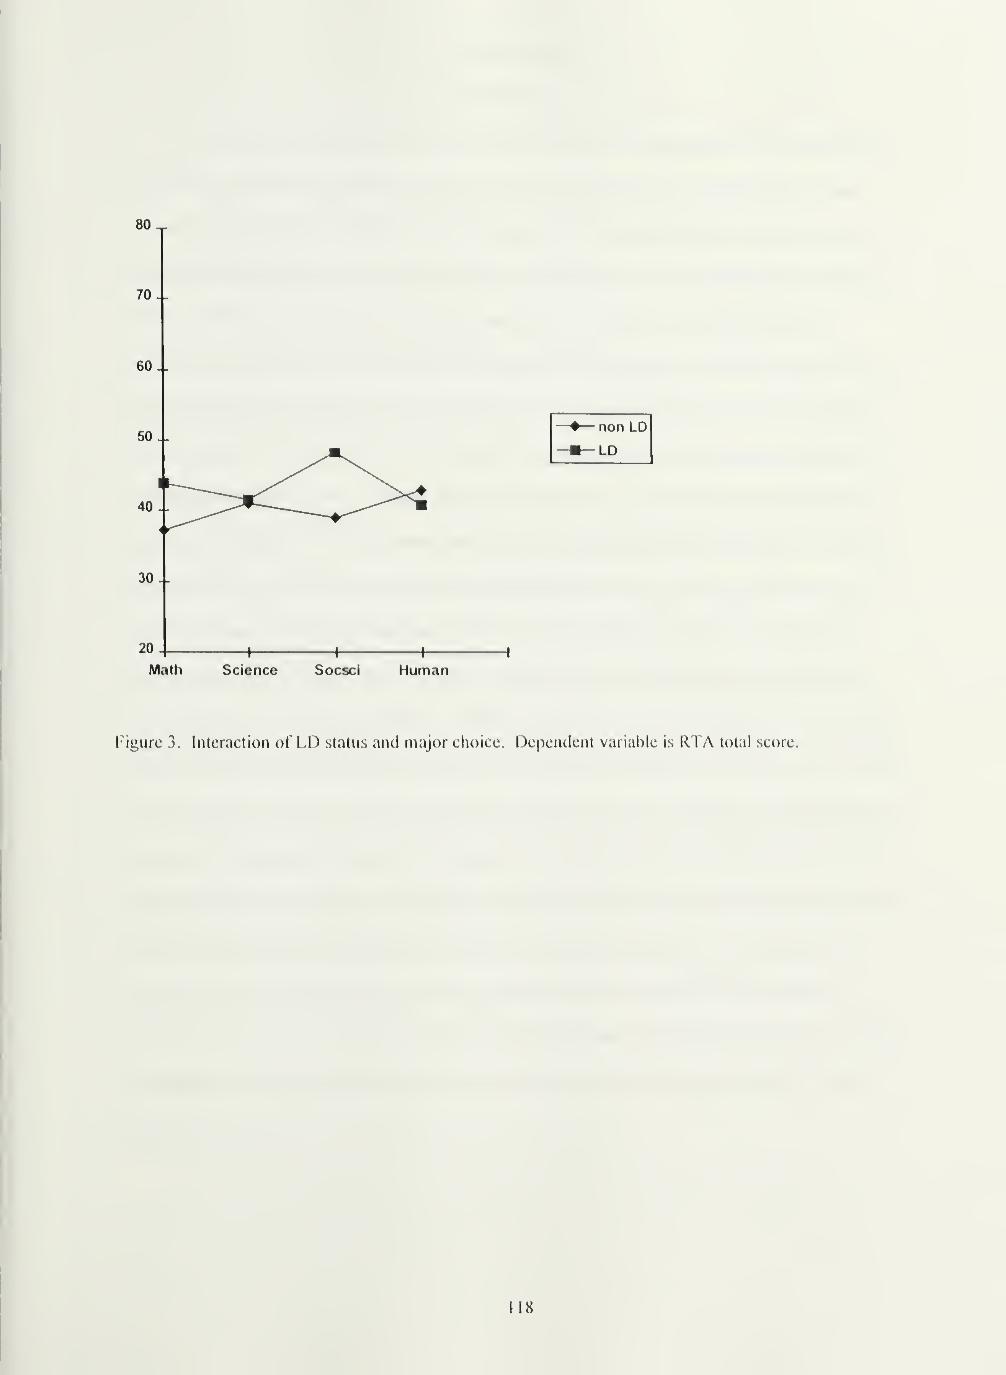
80 ^
70
60
30 --
Math Science Socsci Human
Figure 3. Interaction of LD status and major choice. Dependent variable is RTA total score.
I 18
CHAPTLR 4
DISCUSSION
Study findings will first be discussed separately for each research question and its corresponding
hypothesis(esX followed by a general discussion of the overall implications and limitations of the study.
A major contention behind the choice of students with learning disabilities as a focus of the
current study was that this group of students was an exemplar of a group who had experienced a history of
academic difficulties and marginalized academic status. The initial analyses performed on the
demographic variables related to academic success supported this contention. As expected, students with
learning disabilities had experienced a more difficult academic history than their non-learning disabled
peers, showing lower GPA's and more course failures and withdrawals. These findings mirror those of
Geislhardl and Munsch (1006) and Cosden and MacNamara (1997). Although many of the students with
disablities participating in the study (almost 80%) had been diagnosed and receiving support services for
many years, they were still experiencing academic difficulties relative to their non-disabled peers. This
suggests that many students with disabilities do have a history of academic difficulty that is both long
standing and on going. As such, their choice as a group for .study was well justified. It is important to
note, however, that the differences between students with and without learning disabilities on measures on
academic success though significant, were quite small One possible reason for this is attrition. It may be
that only the highest achieving students with learning disabilities choose to progress to the university level.
This possibility suggests that differences in academic success between students with and without learning
disabilities, and their side effects, such as negative self image (Renick & Hailer, 1989; Swanson 8l Howell,
1996), may be much more pronounced at the high school and middle school levels. This possibility is
important to keep in mind when reviewing study findings. As noted in the review of the literature,
existing research (I Icmbree, 1988) suggests that test anxiety is lower at the college than at the high school
level, probably for reasons of attrition; it seems likely that the same sitiiation occurs relative to academic
performance problems.
119
Research Question One
Research Question one concerned differences in the level and nature of test anxiety between
students with and without learning disablities at the postsecondary level, as well as the effect of testina
accommodations used by students with learning disabilities on these differences. Hypothesis one, that
students with learning disabilities would show higher levels of test anxiety than non-disabled students, and
that this effect would increase in significance when the effects of the testing accommodations available to
students with learning disabilities were considered, was partially supported- Students with learning
disabilities did show higher levels of test anxiety as expected, but the use of testing accommodations had
no effect on this relationship. This finding mirrors those of Bryan, Sonnefeld, and Grabowski (1983) who
found, working at the middle school level, that students with LD reported higher levels of test anxiety than
their non-LD peers. Given the demographic analyses performed in the current study indicating that the
students with disabilities did in fact experience a more difficult academic history than the non-disabled
students, this finding of higher anxiety in the students with LD also lends support to the large body of
research suggesting that a long standing history of academic difficulty is one of the factors that unites
groups of students traditionally found to be high in test anxiety (e.g., LD, at risk, minority).
It is important to mention that the effect size of the difference in test anxiety between the students
with and without learning disabilities was quite small; as noted previously this may be to some extent a
function of attrition, with lower performing students (who are more likely to be both LD and highly
anxious) at the high school level choosing not to go on to a traditional four year university such as the
University of Massachusetts. It was originally thought that the fairly small size of the difference in anxiety
between students with and without learning disabilities might be a function of the use of support services
(which would presumably mitigate anxiety) by the students with learning disabilities, but this possibility
was not supported. It appears that the support services offered to students with LD at UMASS have little
effect on test anxiety. Possible reasons for this finding will be discussed in more detail later, when the
effects of the use of support services are considered more extensively.
While hypothesis one considered differences in the level of test anxiety between students with and
without LD, hypothesis two considered differences in the nature of test anxiety between these groups.
120
ionssuggesting that students with and without learning disabilities would differ significantly on the dimensi
of test anxiety that were most salient for them. This did in fact turn out to be the case. While students with
LD were higher on all measures of test anxiety than non-LD students, this difference was particularly great
for the "test irrelevant thinking" dimension. In contrast, between males and females, where there was also
a significant difference in test anxiety levels, "tension" was the factor on which differences were greatest.
Although this is speculation not directly supported by study data, this finding may make sense in the
context of the frequent complaints of attentional problems by students with LD and the common
comorbidity of LD and ADHD (Barkley, 1990; Shelton and Barkley, 1994). This possible connection
between LD and ADHD suggests that a high "test irrelevant thinking" subscale score may be unique to
students with LD and not simply a function of a difficult academic history generally; however, RTA
subscale comparisons would need to be made between LD students and those of other academically
disadvantaged groups, such as "at risk" and minority students, to see if real differences in subscale profiles
exist. That females were significantly higher on the ^lension" subscale than males is probably reflective of
the fact that the "tension" items on the RTA are those that measure test anxiety generally rather than
dealing with specific manifestations of it (e.g., "I am anxious about tests"); previous research indicates that
females experience higher anxiety ("trait" anxiety) generally than males (Bander and Betz, 1981).
Between students with and without LD, "tension" was the RTA scale with the least difference, supporting
the idea that differences in test anxiety between students with and without LD are more a function of
something unique to being LD than of an underlying predisposition to be more anxious generally.
Certainly these findings are preliminary, and further research could be done, possibly with an LD
sample that had a clearly identified sub-group of students with a comorbid diagnosis of ADHD. Beyond
this, as mentioned previously, RTA subscale profiles for different groups of academically marginalized
students (including students with LD) might be compared. The current findings do indicate, however, that
the nature of test anxiety may be variable as a function of the background and abilities of a given student.
Research Question Two
Research question two concerned differences between students with and without LD in terms of
the specific aspects of the testing situation they found to be anxiety producing. This research question was
121
investigated via hypothesis three, that students with and without LD would differ sioniUcanlly in their
(TSRS) rating of how anxiety producing they found particular aspects of testing situations to be. This
hypothesis was supported. \u general, students with 1.1) rated almost all situations of the TSRS as more
anxiety producing than did non-LD students, and females rated almost all situations more anxiety
producing than males. Ihis tlnding was expected, in that the ISKS correlates at .71 with the RfA, and
thus functions overall as a general measure of lest anxiety. Between students with and without LD in
particular, however, differences in ratings for some situations were much greater than differences in ratings
tor others. The 1 1 situations that showed signitlcant differences in ratings between students with and
without LI) should be looked at more carefully, to determine if effecting changes in these areas might
prove helpful to students with LD. For example, the largest differences in anxiety ratings between the
groups were on ^Mack of review sessions" and "crowded exam room." These arc situations that are fairly
easy to modify, and doing so might prove very benellcial to students with disabilities.
Given that students with LD rated almost all (18 of 20) of the TSRS situations as more anxiety
producing than did their non-LD peers, it seems important to look at the two situations that non-LD
students showed more concern about. These were "oral presentations,'' and "tests given outside of class
time/' Perhaps because oral presentations are an alternative evaluation format in which students generally
have more control over how they demonstrate their knowledge, students with LD (who rated this ninth oui
of 20 in terms of anxiety) feel at less of a disadvantage than they might in a traditional test, and this takes
away some of the anxiety occasioned by the presentation itself (this presentation anxiety appears to be
quite high for non-LD students, who rated this situation second out of 20 in terms of anxiety). In terms of
"tests given outside of class time," students with LD may show less anxiety on tests scheduled outside of
class than non-LD students as a result of, due to their special needs, more experiences with alternatively
scheduled tests.
It is also important to remember that students with LD were detlned for this study on the basis of
their receipt of support services from LDSS. These students were thus already receiving, or eligible to
receive, a variety of test accommodations, including untimed tests in private quarters, alternative torms of
tests (e.g., essay vs. multiple choice), and rescheduling of multiple tests on one day; students with learning
122
disabilities were also regularly encouraged to see professors and \ \\ for extra help. To some extent the
situations students with LD rated on the ISRS as most anxiety producing (e.g., tuned tests, crowded exam
room) reflected the absence of these accommodations which were generally available to them, t his
suggests that possibly the students with LD in the study had come to expect these comnion
accommodations and found the prospect of not having them quite anxiety producing. This possibility, of
course, operates in concert with the fact that provided accommodations (such as untimed tests) reflect real
disability based needs, and test situations disregarding these needs would be likely to cause anxiety
whether one had grown to expect the accommodation or not. I he connection between conunon IDSS
acconnnodations and students' with LD TSRS ratings, then, is probably reflective of an interplay between
habituated expectations and real learning needs.
TSRS Differences between males and females, as noted, were also reflective of the tendency of
the TSRS to mirror overall R fA results. Females were significantly more anxious than males about most
of the I'SRS situations. These basically across the board differences appear to be reflective of male-female
differences in trait anxiety generally (Bander & Bet/, 1981; Sarason, 1%3). Of note, however, as in the
TSRS comparison between students with and without LD, situations involving distractions (e.g., '^crowdcd
exam room," and "distractions") showed some of the largest differences in anxiety ratings between males
and females. This finding seems to relate to prior research (Nottleman, 1975; llembrcc, 1988) suggesting
that off task thoughts and behaviors are major components/correlates of test anxiety. More anxious
students appear to be more distractible, and to be aware of this as a problem. These findings about the
connection between anxiety and distractibility may also relate to students' with LD heightened scores on
the "Test Irrelevant Vhinking" subscale of the R l A; however, females were not elevated on the " Test
Irrelevant I hinking" scale relative to males, though their TSRS scores for situations relating to distractions
were high. 1 he connection between test anxiety, attention, LD, and gender thus needs to be investigated
further to tease out how all of these variables relate. This is an important area of study, because, as noted
in the review of the literature, distractibility may be one of the mechanisms through which test anxiety
translates into poorer test performance. Distractions are also a fairly easy (in most cases) testing problem
to address; doing so may provide great benefits for the test anxious.
Some of the most useful data overall from the TSRS is simply the rank ordering of test situations
from most to least anxiety producing for the fiill sample. Many of these situations would be quite easy to
remedy, (e.g., "unclear test questions," "pop quiz") by the instructor alone. Others are more involved,
operating at an institutional level (e.g., "two tests on one day"), but almost all could be addressed. The top
nine situations all carry an anxiety rating of 3.4 (out of 5; 3 = a "fair amount" of anxiety) or higher; these
certainly are the first aspects of the testing situation that should be looked at by any institution wishing to
help students with this issue.
The second aspect of test situations looked at in hypothesis three, subject area, showed clear
differences in anxiety levels for testing in different subject areas between students with and without LD,
and between males and females. Most notably, students with LD were much more anxious about testin" in
foreign language classes than were non-LD students; this difference is probably reflective of the fact that
almost three quarters of the sample of students with LD had a language based LD. Females were
significantly more anxious about testing in mathematics classes than were males; this echos the findings of
Bander and Betz (1981) that differences in test anxiety between males and females are greater for sex
stereotyped domains, and is reflective of the general stereotype in our society that math is not an academic
domain where women excel.
In summary then, the results of the TSRS and of the subject area test anxiety ratings do show clear
differences in the aspects of testing found to be anxiety producing by groups of students with different
academic histories, abilities, needs, and socialization. These results fit nicely with the model of test anxiety
developed by Zohar (1998), which suggests that students' actual levels of test anxiety vary in different
situations as a function of their self efficacy for grade attainment on a particular exam in addition to their
general level of trait anxiety. Results of the TSRS and subject area ratings suggest that such self efficacy
for grade attainment may be a function of the above mentioned factors of academic history, needs, and
socialization.
Research Question Three
Research question three concerned differences between students with and without learning
disabilities in terms of the types of modifications to the testing environment that they felt would be most
124
helpful in reducing their test anxiety. This research question was investigated via hypothesis four, that
students with and without learning disabilities would differ in their (TMRS) ratings of how desirable
particular modifications to the testing environment were. It was found that students with and without LD,
and males and females, did differ significantly on their ratings of a variety of testing modifications. As
would be expected from RTA and TSRS findings, in general students with LD rated the majority of the
TMRS modifications more favorably than did non-LD students; females rated every modification more
highly than did males. These general findings are again reflective of the fairly high correlation (.54)
between the TMRS and the RTA; however, an interesting pattern emerged when looking at the
modifications that students with LD rated significantly more favorably than did their non-LD peers. These
modifications mirrored almost exactly the accommodations that the students with LD were already
receiving: private test conditions, untimed tests, a campus advocate (i.e., case manager), and flexible
scheduling of test time. This finding suggests that the LD acccommodations provided at the University of
Massachusetts, Amherst, are perceived by students as useful and helpful in relieving anxiety. It also
suggests that once students have actually experienced an accommodation and have become used to
receiving it (i.e., many of these students had received similar accommodations in middle and high school)
they are more likely to regard it as desirable and/or necessary. Doubtless a combination of these two
factors was responsible for the nature of the differences in ratings of testing modifications between students
with and without learning disabilities. This finding is also interesting in that it repeats to some extent the
findings for hypothesis three, involving the T5RS ratings.
Given that students with LD rated almost all (15 of 18) situations on the TMRS as more anxiety
relieving than did their non-LD peers, it seems important to look at the modifications that non-LD students
found more appealing. Of the three modifications preferred by non-LD students, only ''drop lowest test
grade" approached significance in terms of the amount it was more highly rated. On the other two
modifications, "option to retake test," and "choice of test questions," mean ratings of students with and
without LD were virtually equal. In terms of the larger difference between the groups on ^'drop the lowest
test grade," it seems possible that non-LD students generally consider a low test grade to be a unique
experience, caused primarily by remediable behaviors (e.g., lack of studying) that can be compensated for
125

by better performance on other tests. Students with LD, given their more pervasive diniculties with, and
anxiety about testing, may be more likely to perceive all tests as potentially problematic. For non-LD
students, then, dropping a single bad test grade might make more of a dilTercnce, as they believe they can
make up for this on other tests. However for students with LD, other modifications, involving how testing
is conducted generally over the course of the whole semester appear to be more desirable. It is important
to note however, that both groups rated this accommodation highly, and that the size of the difference
between the ratings of the two groups (.24 point on a scale of 1-5) is of small magnitude and may just be
unique to the data for these particular groups of students.
Differences between male and female students on the I'MRS ratings uniformly showed females as
perceiving modifications as more desirable than males. As with the TSRS findings, this result seems
reflective of the general and well documented (Bander & Bet/, 1981; Sarason, 1963) differences in overall
(trait) anxiety level between males and females, with no specific conclusions to be drawn from it.
In terms of the interaction between sex and LD status on the TMRS found on items 10 and 17,
there seems to be little to say. These interactions were quite small in effect; given this, and given the fact
that significant interactions were only found for two of the 18 situations of the rMRS, they do not seem
particularly meaningful or indicative of any important trends in the data, for these two modifications,
"partial credit given for showing work," and "outline in advance of what will be on the test," LD status
seems to smooth out differences in ratings due to gender (i.e., males and females with learning disabilities
rated these situations similarly, while non-LD females rated these modifications as a bit more desirable
than did non-LD males); however, as this effect is not repeated throughout the TMRS or exhibited by any
of the other measures used in the study, it appears to be of little consequence in general.
As with the test situations rating data, some of the most useful data overall from the test
modifications ratings is simply the rank ordering of test modifications from most to least anxiety relieving
for the full sample. Most of these modifications would be quite easy to institute (e.g., "outline of test in
advance," "option to retake,^' "drop lowest test grade") by the instructor alone. Others are more involved,
(e.g., "free weekly tutoring," "campus advocate"), but almost all could be addressed. All modifications
126
rated carry a rating of 3 or higher (on a scale of lo; 3 = would reduce anxiety a ^'fair amount"), thus
implementing any of the modifications listed would likely be seen as quite helpful by students.
Research Question Four
Research question four concerned the nature of a student's LD, and whether or not this would
differentially affect their test anxiety levels for different subject areas. This research question was
investigated via hypothesis five, that differences in students' with LD anxiety levels for testing in different
subject areas would be related to the specific nature of their LD. It was thought, for example, that students
with language disabilities would be more anxious about testing in foreign language classes, while students
with math based disabilities would be more anxious about testing in math based classes. This hypothesis
was not supported, however. It was found that anxiety level did not differ as a flinction of type of learning
disability for any of the six subject areas investigated.
The failure of these results to achieve significance may have been due to a variety of factors.
Clear classification of students into language learning disability, math learning disability, cognitive
(memory, attention, or organizational) learning disability, or combination learning disability diagnostic
categories was not always possible, resulting in students being placed in the diagnostic category in which
they fit ''best," though in many cases their diagnostics may have indicated some learning needs relative to
other categories. Beyond this, the uneven and in some cases small (purely cognitive disablities, n = 2;
combination language/math disabilities, n = 14) sample sizes may have made differences between the
diagnostic groups difficult to detect. Given that the relationship between mean anxiety scores for the
different diagnostic groups were as hypothesized (though not pronounced enough to achieve significance)
for each subject area, future studies should explore this question using larger, more evenly matched, and
more clearly classified/diagnostically pure samples.
Research Question Five
Research question five concerned the relationship between testing accommodations, perceived
control over testing, and test anxiety. This research question was investigated via hypotheses six, seven,
and eight. Hypothesis six, that higher levels of perceived control would correlate negatively with test
anxiety, was partially supported. Higher external academic locus of control (LOC) scores did correlate
127
positively with test anxiety, indicating that students who felt they had less control over their academics had
more anxiety.
Perceived control over testing, as measured in this study using PCOT factor one, "Actions Taken,"
did not correlate with test anxiety as originally expected, but this appears to be a function of what this
factor actually ended up measuring. PCOT factor one turned out to be a measure of actual behaviors
students engaged in relative to the testing situation (e.g., asking for extra time, extra help) as opposed to the
amount of control they believed they had. Hence, students who scored high on PCOT factor one scored a
bit higher on test anxiety (instead of lower, as expected). This finding probably occurred for the total
sample because PCOT factor one questions directly reflected behaviors that students with LD at UMASS
are encouraged to engage in by their case managers, hence, this measure is to some extent confounded with
the variable of LD status, which has a similar relationship with test anxiety (students with LD have higher
anxiety). Supporting this speculation is the fact that for the sample of students with LD only, PCOT factor
one did not correlate significantly with test anxiety at all.
The best correlate of test anxiety in terms of control over testing , or in terms of academic LOC
generally, then, appears to be the ALOCS, suggesting that a generalized sense of control over academics is
related to lower test anxiety. This effect appears to be independent of LD staUis, as the LD and non-LD
samples in the study had virtually identical mean scores on the ALOCS. This conclusion is supported by
the previous research of Hembree (1988), who also found that high test anxiety was significantly correlated
with an external LOC (less student control).
In looking at the relationship between perceived control and use of testing accommodations in
students with LD, hypothesis seven suggested that students with learning disabilities' use of testing support
and general support services would be related to their levels of perceived control over testing. Although
LOC as measured by the ALOCS and by PCOT factor one (actions taken to improve the test/grading
situation) correlated significantly with use of support services, in the regression model predicting level of
PCOT factor one, "Actions Taken," use of services (either testing specific or general support) was not
uniquely predictive of control taking. The finding that use of services was not uniquely predictive of
control taking, in conjunction with the significant correlation between ALOCS scores and use of testmg
128
services, suggests one possible interpretation of the data: that students with a more internal LOC
(conceptualized as a long standing and stable personality trait) tend to use support services as a way of
manifesting control, as opposed to the original conceptualization of the study, that the availability and use
of support services by students would increase their (internal, psychological) sense of control over testing
and over academics generally. Although the salient variables are to some degree confounded, making it
difficult to assess the exact nature of the relationships between them, the analyses performed do suggest
that in general a more internal LOC leads students to use testing/support services, and to "take action" with
professors (e.g., asking for extra time). Availability and use of support services in and of themselves do
not as much appear to increase students' sense of control over their testing/grades as to be a vehicle
through which a general sense of control can be manifested. This does not imply that support services are
not useful, however. As noted, support services are a vehicle through which students can exercise more
control over testing. This increased control may translate into higher grades, as indicated by the fact that
PCOT factor one, measuring actions taken to get more control over testing/grades, and use of testing
support services both correlate positively with GPA. It should also be remembered that when investigating
the differences in GPA between students with and without learning disabilities, students' use of testing
support services was a significant covariate, mitigating the differences in achievement between these two
groups. Support services aid students, but this help appears to be more practical, as opposed to
psychological (i.e., changing underlying attitudes/beliefs).
In terms of test anxiety and use of support services, hypothesis eight suggested that the use of
support services by students with learning disabilities would correlate negatively with test anxiety. Support
services were conceptualized as mitigating test anxiety through providing a (again, psychological) "safety
net" of sorts. This was not found to be the case. Support services did not correlate significantly with test
anxiety. Again, as in analyses performed on the total sample of students, in the regression model using
students with LD only, the best predictor of test anxiety in students with LD was the ALOCS, suggesting,
as noted before, that a more external LOC is related to higher test anxiety generally. Although PCOT
factor one appeared as a significant unique predictor of test anxiety when combined with the other
predictor variables in the regression equation for students with LD, the correlation between PCOT factor
129
one .iiul R TA score alone was very low and nonsii^nitlcant. Thus wlule the regression equation suggests
that (to a very weak degree) liigh anxious students Make action" more, it seems more reasonable to
surmise, given all the data available, that there is no real relationship between VCOT factor one, "Actions
Taken," and test anxiety for students with LD. Use of support services, then, does not appear to be directly
related to test anxiety levels in either direction: use of services does not reduce anxiety, and high anxiety
does not drive students to use services.
In general, then, there does appear to be a relationship between test anxiety, control taking, and
use of support services, but the nature of this relationship does not appear to be as originally
conceptualized. It was hypothesized that control over testing (originally conceived of as independent of
more general measures of LOC) and lest anxiety were variables that were relatively malleable with respect
to environmental inlluence (e.g., use of support services), and that changes in support services use would
affect these variables. This does not appear to be the case, at least not with the sample of students used in
this study. There are several reasons why this might be so. First, in terms of measures, it may be that the
measures of use of support services do not reflect students' commitment to utilizing LOSS
accommodations as well as they might. Ratings of use of support services were based on archival data
only, aiul while these retlected the amount of contact students had with LDSS, they did not necessarily
reflect the nature of such contact. A better measure of students' use of services might have been ratings by
the individual students' case managers. This was not possible, however, as students frequently had seen 2-
3 different case managers during their time using LDSS services, and most of these case managers were
graduate students who, at the time study data was collected, had since left the university. Although not
possible to obtain for this study, then, a more precise measure of the extent and nature of LDSS students'
use of support services might have provided a more accurate view of the effects of such services. Of note,
of the two measures of use of support services, only "use of testing support services" showed significant
relationships with other variables, fhe "use of general support services" score was in no way related to
any of the other variables in the study. This is probably reflective of the quality of the different measures
comprising the two scores. Ihe "use of general support services" score was based on less specilic
information than the "use of testing support services" score and was thus less precise. This difference
130
between the two measures is in general indicative of the problems encountered in developing accurate
measures for these variables, and suggests that more specific measures of these variables overall might
have led to clearer results regarding their functions and importance.
Another measure which did not operate as anticipated was the PCOT. The PCOT was intended to
measure student^s beliefs about their control over testing as a general (and fairly stable) construct. PCOT
factor one, "Actions Taken/' was the most psychometrically adequate factor to emerge from the total scale,
but this factor measured behaviors related to testing/grading rather than beliefs/attitudes, it may be that
beliefs about control over testing are variable as a function of the situation and depend upon factors such as
the instructor's demeanor and attitude in any given class, while the behaviors measured by PCOT factor
one may be more habitual and consistently engaged in. As such, perceived control over testing may not be
a static concept amenable to quantification, PCOT items that attempted to measure beliefs about testing
alone were relegated to PCOT factor two "Persuasion Beliefs," a notably less reliable factor than PCOT
factor one. Thus, although PCOT factor one provided interesting data, it did not really provide the data
necessary to assess beliefs about control over testing. However, as noted, "control over testing" may
simply be a concept that is too situationally variable to be measured reliably anyway. This conclusion
actually obliquely supports one of the major contentions of this study, namely that test anxiety and some of
its related correlates are in significant part a function of the environment, and cannot be quantified as
general traits.
As stated, the data gathered do suggest a relationship between LOC, test anxiety, and use of
support services. Only tentative inferences can be made about this relationship, given that all of the
correlations between the relevant variables were low to moderate at best. Thus, the following speculations
about the relationships between these variables are made with caution. In general, LOC appears to be the
central factor, relating both to test anxiety and to use of services. Those students who have a strong sense
of control are double winners in that they generally have lower anxiety and that they generally engage in
more positive behaviors to help themselves; both of these factors are traditionally related to better grades.
Those students with a more external LOC tend to be more anxious and tend to do less to take control over
their situations and help themselves. As Bandalos et al. (1995) note, high test anxiety is related to stable,
131
internal attributions for failure; these types of attributions are consistent with the external LOC found to be
related to high test anxiety in this study. Although this is speculation not directly supported by study data,
these findings suggest that high anxious students with LD (in this study, at least) may be to some degree
experiencing "learned helplessness" (Phillips et al., 1980, p. 338), where a sense of ftitility about their
academic situation lowers their motivation to utilize options that may be helpful to them (i.e., support
services). By failing to utilize helpful options, such students do not experience the success they might, and
potentially remain stuck in a cycle of anxiety and perceived powerlessness. It is important to note at this
point that at the postsecondary level we may only see the lowest level manifestations of such a cycle.
Students for whom such a dynamic was most damaging may well have already left formal education before
ever reaching the postsecondary level.
In general, then, an external LOC and high test anxiety appear to form a negative constellation
that does not support positive self helping behaviors or fuel improved academic performance. Use of
support services does not so much appear to affect this constellation as to be affected by it. Of course it is
possible that if a student is encouraged and guided to use available support services, positive experiences
might result which over the long run could translate into increased feelings of control and ultimately also
reduce anxiety somewhat. This possibility needs further investigation. Future studies should attempt to
measure these variables (particularly use of support services) more precisely, include additional variables
(such as the atmosphere of the particular class under consideration), and use path analytic techniques or
structural equation modeling to better assess the nature of the relationships between these variables, and
how they may develop over time.
Research Question Six
The final research question of the study concerned the relationship between test anxiety and
avoidance of testing intensive classes or major areas. The first part of hypothesis nine, that high levels of
test anxiety would correlate significantly with reported avoidance of testing intensive classes/majors, was
supported; the second part of hypothesis nine, that this effect would occur to a greater degree for students
with LD that for non-LD students, was not supported. Test anxiety showed strong, significant correlations
with all measures of testing avoidance for all students. Regression analyses showed that test anxiety was
132
the single best predictor, standing well above all others used, of self reported testing avoidance. This
relationship was not found to be stronger for students with LD than for non-LD students, however. These
results echo the findings of Strom et al. (1987), who found that test anxiety correlated negatively with a
measure of preference for course difficulty. Test anxiety is already known to affect performance; these
findings about course avoidance suggest a much more insidious effect: that of heading off students from
participating in courses, majors, or fields of service that they might enjoy, and where they might excel and
make valuable contributions. Future studies might look at the factors that affected individual's choices of
college majors and careers, using test anxiety as one variable, and determine more precisely the extent to
which test anxiety might affect such decisions.
In this study, hypothesis ten constituted an attempt, with the data available, to look at the
relationship between test anxiety and academic major choice, to determine if, for this group of students,
such an important decision had been affected by test anxiety. Hypothesis ten was that there would be a
significant relationship between test anxiety and academic major choice, with more anxious students
choosing less testing intensive majors, and that this effect would be more pronounced for students with LD.
It was hypothesized, then, that for ''typical" students (i.e., non-LD) those with lower test anxiety would be
more willing to major in areas traditionally viewed as "scary" and testing intensive, such as mathematics,
while those with higher anxiety would tend to major in less "scary", less traditionally testing intensive
fields, such as the humanities and social sciences. Although mean differences by major area were not
significant, they were in these hypothesized directions for non-LD students. This was not the case for
students with LD, however, to the degree that the interaction between LD status and major category was
significant. For non-LD students, math majors had the lowest test anxiety, and humanities majors had the
highest (as predicted); for students with LD, however, humanities majors showed the lowest test anxiety
and social science majors (followed by math majors) the highest. This interaction suggests that students
may in fact have their major choice affected by test anxiety; however, this effect is different for students
with and without LD, because they tend to have (relative) difficulty with different subject areas. In fact,
the differences in RTA score by major choice for students with and without LD to some extent reflect the
subject area anxiety ratings by students with and without LD investigated as a part of hypothesis three. On
133

llic subjccl area anxicly lalm.i^s siutlciils witli LU rated lant^iiagc classes as much more anxiety producing
than any other kind; this was not the ease Ibr non-LI) suuienis, who rated math as most anxiety producing.
While the anxiety ratings lor subject areas by students with and without 11) do not cuu ilv |>arallcl the
linihngs of regarding test anxiety and major choice, there is enough overh\p to speculate that perhaps test
anxiety, as it idiosyncratieally manifests itself in different students due to their different academic histories
and learning needs, may affect long term choices about learning such as which llelds of study to pursue
and which to avoid. I Infortunately, this conclusion can not clearly be drawn on the basis of this study due
to several limitations.
First, academic major categories were broadly ilelineil, with each category, social sciences in
particular, covering many different majors. "Social science" majors ranged from Accounting to Sociology;
in other words, covering majors that are quite math oriented to majors that are much more similar to
humanities. This was rellected in the data, in that more students fell into the social science major than any
other group. Due to this, sample sizes for the different majors were imequal, and some were ciuite small
(e.g., math majors with LD ^6; humanities majors with 1,1) 11) Beyond this, first, second, and even
third year students may still be choosing and changing majors, so the major area imliealeil by any given
student may not rellect what that student's final choice will ultimately be. f uture studies should carefully
select approximately equal and reasonably sized samples of students who are committed to majors that are
clearly exemplars for iheu" particular major category (e.g., psychology majors for "social sciences").
Another problem with the current study regarding majors stems from the manner in which the
non-LD sample was selected. 60% of the males in this sample were taken from a chemistry lab course,
while all of the females and the remaining 40% of the males were taken from a psychology course.
Although both of these courses fulfilled general education requiremenls at ihe university, the males (who,
remember, generally have lower test anxiety) from the chemistry class were primarily math and science
majors. Although they did not constitute the entire non-LD male sample, they were 60% of it. Due to this
unfortunate and unforseen sampling problem, findings involving academic major choice and test anxiety
may be confounded with sex to some extent and so must be interpreted with caution. Still, given the
differences between the samples of students with and without LD, and the ways in which these relate to
134
subject area anxieties as might be expected, as well as the strong correlation found between measures of
test anxiety and measures of course and subject area avoidance, this is clearly a phenomenon deserving of
further study.
General Discussion
In general then, several broad conclusions can be drawn from this study. Test anxiety is clearly a
phenomenon that varies both quantitatively and qualitatively as a function of individual differences in
academic history, areas of academic strength and need, and nature of available academic support; test
anxiety also varies as a function of specific aspects of the test situation, such as the subject area testing is
being conducted in. These factors all work together in any given test situation to affect the student
differently each time. As current models of test anxiety suggest (Zohar, in press; Spielberger & Vagg,
1995), though anxiety as a trait is one component of test anxiety, test anxiety is not simply a constant trait
based phenomenon that is set for a particular person regardless of the situation .
Further research, as noted earlier, is indicated in several areas to continue to tease out how specific
areas of need (e.g., language versus math based learning needs) translate into anxiety for particular
assessment situations. The relationship between test anxiety and distractibility also merits further
investigation, particularly in students who may already have attentional problems. This is a particularly
important area for research if distractibility/attention problems are a vehicle through which test anxiety is
translated into poorer performance. Studies looking at the long term effects of test anxiety on choices
involving classes and courses of study are also indicated. Longitudinal and retrospective studies could
begin to more clearly illuminate the way anxiety may limit individuals' options and affect life choices.
Such research is important, because long term consequences such as this may ultimately prove more
damaging to individuals than short term performance deficits; beyond this, short term performance deficits
probably act in concert with long term effects, by strengthening individual's beliefs that they ''can't
handle" testing in certain academic areas, and thus reinforcing avoidance of these areas.
The findings of this study regarding the effects of modifications to the testing environment are a
bit more difficult to interpret. On the one hand, student self reports indicated a variety of modifications to
the testing environment that they believed would be helpful to them in reducing anxiety; on the other hand
135
students with LD who actually took advantage of available testing accommodations did not show a
significant reduction in test anxiety, it is possible that the use of these accommodations may simply not
affect general, non-sitationally based measures of test anxiety like those used in the study, though they may
mitigate anxiety in varying degrees for specific tests, depending upon the particulars of the situation. It is
also possible that the modifications actually available to students with LD in the study, although
appropriate accommodations for disability, are not the most useful for ameliorating anxiety per se. When
one looks at the modifications chosen by students as most important for reducing test anxiety, these more
reflect how professors provide review materials and set up grading options, as opposed to specific
measures aimed at particular learning needs (e.g., untimed testing). Test accommodations as conceived of
by LOSS are in place to equalize a student with a disability's chance of successful performance, not to
mitigate anxiety. Thus, the effect of the quite specific modifications offered by LOSS may not be as useful
a measure of the potential value of environmental modifications in mitigating test anxiety as are the actual
student ratings of proposed modifications (TMRS). In general, then, it appears that modifications to the
testing environment could help reduce test anxiety. Again, though, as the nature of test anxiety appears to
be variable as a function of individual factors and the particulars of any given test situation, modifications
would ideally be tailored to some extent to fit individual student needs as they applied in context. This
does not mean that every student needs unique modifications, it simply means that a menu of commonly
useful modifications might be developed from which instructors could choose, given their own needs and
the needs of individual (or groups of) students. Future studies could manipulate some of these variables
(presence and absence of particular modifications) and begin to assess their actual effects and usefulness.
Studies such as these would be fairly easy to institute, as many of the modifications to the testing
environment rated most highly by students (e.g., outline of test materials in advance, option to retake tests,
dropping of lowest test grade) are already commonly used in college courses. Further research could
determine what combination of these modifications would be both most helpful to students and most
acceptable to instructors. Perhaps ultimately a viable model for conducting non (or less) stressful
assessments might be developed that could be implemented as a general rule in college classrooms. The
idea of Universal Instructional Design (Silver, Bourke, & Strehom, 1998) is moving in such a direction;
136
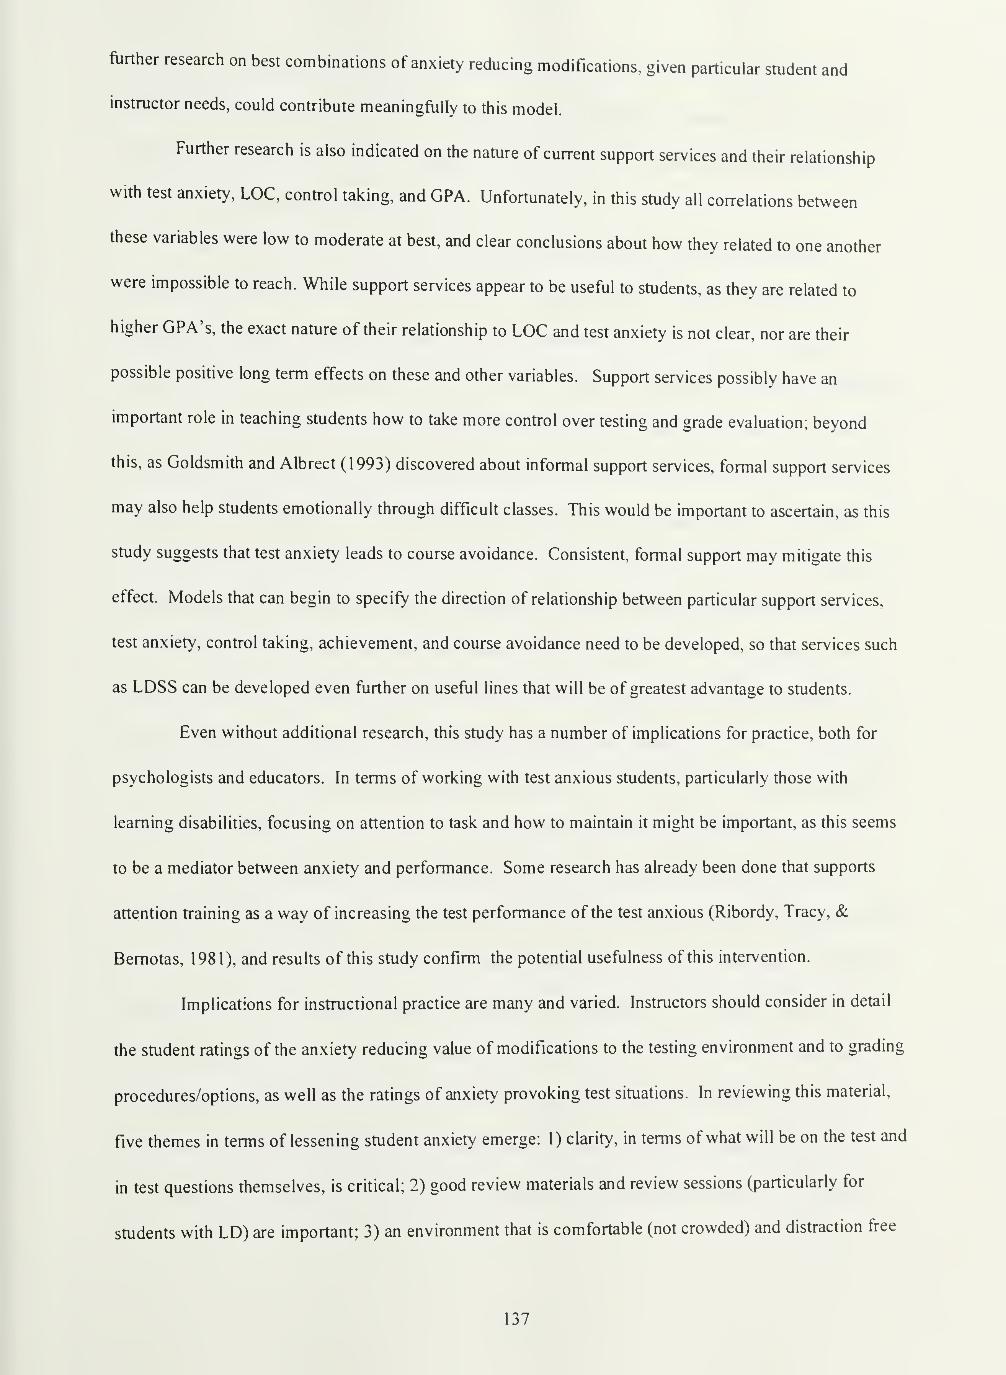
further research on best combinations of anxiety reducing modifications, given particular student and
instructor needs, could contribute meaningfully to this model.
Further research is also indicated on the nature of current support services and their relationship
with test anxiety, LOG, control taking, and GPA. Unfortunately, in this study all correlations between
these variables were low to moderate at best, and clear conclusions about how they related to one another
were impossible to reach. While support services appear to be useful to students, as they are related to
higher CPA's, the exact nature of their relationship to LOG and test anxiety is not clear, nor are their
possible positive long term effects on these and other variables. Support services possibly have an
important role in teaching students how to take more control over testing and grade evaluation; beyond
this, as Goldsmith and Albrect (1993) discovered about informal support services, formal support services
may also help students emotionally through difficult classes. This would be important to ascertain, as this
study suggests that test anxiety leads to course avoidance. Consistent, formal support may mitigate this
effect. Models that can begin to specify the direction of relationship between particular support services,
test anxiety, control taking, achievement, and course avoidance need to be developed, so that services such
as LDSS can be developed even further on useful lines that will be of greatest advantage to students.
Even without additional research, this study has a number of implications for practice, both for
psychologists and educators. In terms of working with test anxious students, particularly those with
learning disabilities, focusing on attention to task and how to maintain it might be important, as this seems
to be a mediator between anxiety and performance. Some research has already been done that supports
attention training as a way of increasing the test performance of the test anxious (Ribordy, Tracy, &
Bemotas, 1981), and results of this study confirm the potential usefulness of this intervention.
Implications for instructional practice are many and varied. Instructors should consider in detail
the student ratings of the anxiety reducing value of modifications to the testing environment and to grading
procedures/options, as well as the ratings of anxiety provoking test situations. In reviewing this material,
five themes in terms of lessening student anxiety emerge: 1) clarity, in terms of what will be on the test and
in test questions themselves, is critical; 2) good review materials and review sessions (particularly for
students with LD) are important; 3) an environment that is comfortable (not crowded) and distraction free
137
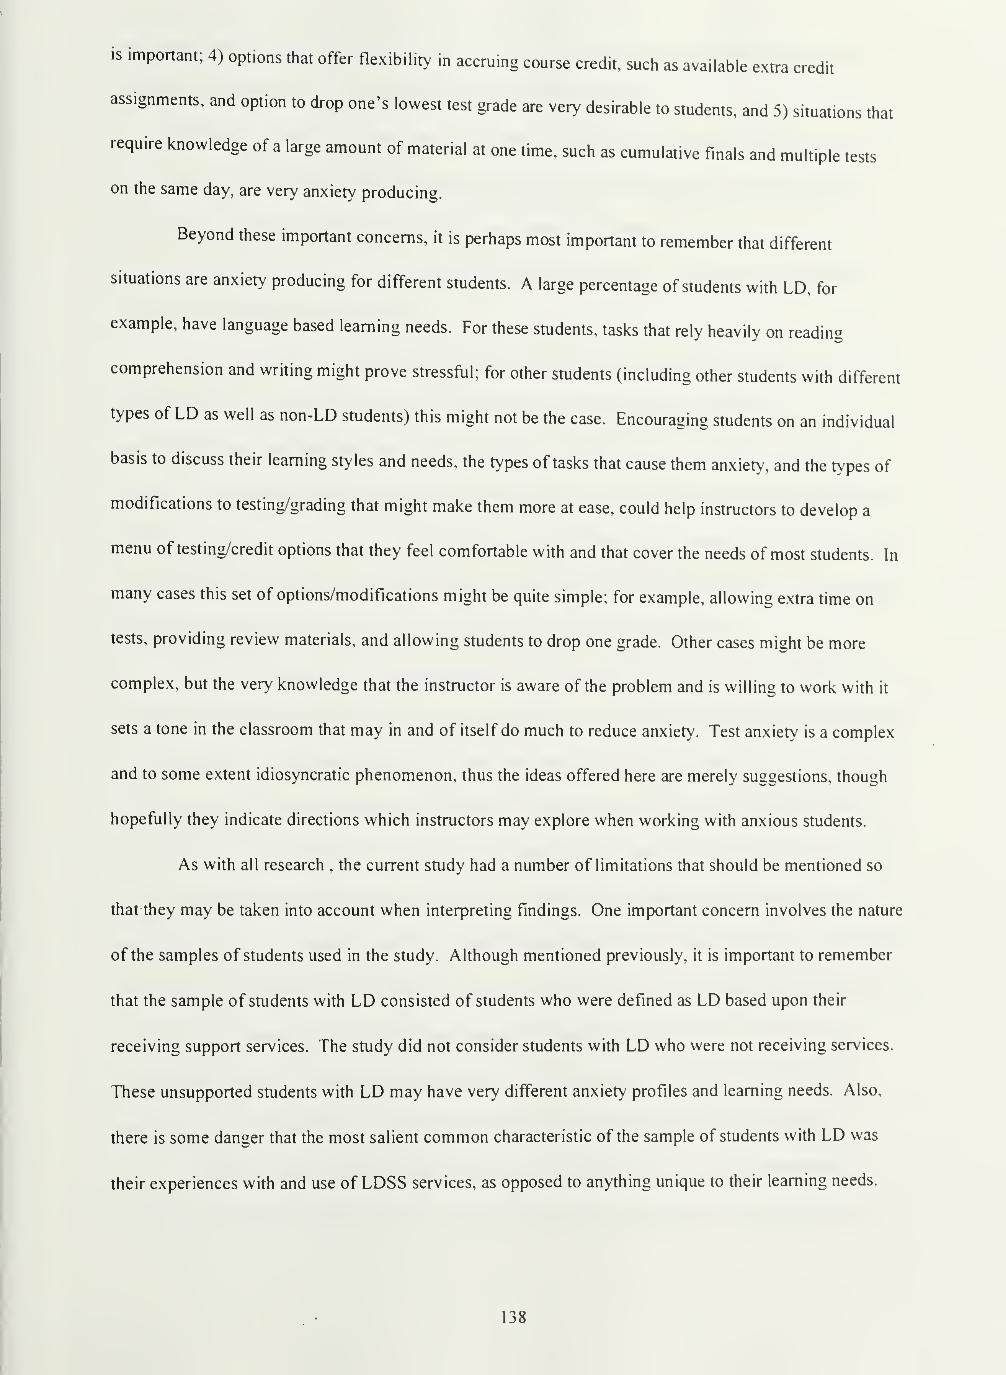
is important; 4) options that offer flexibility in accruing course credit, such as available extra credit
assignments, and option to drop one's lowest test grade are very desirable to students, and 5) situations that
require knowledge of a large amount of material at one time, such as cumulative finals and multiple tests
on the same day, are very anxiety producing.
Beyond these important concerns, it is perhaps most important to remember that different
situations are anxiety producing for different students. A large percentage of students with LD, for
example, have language based learning needs. For these students, tasks that rely heavily on reading
comprehension and writing might prove stressflil; for other students (including other students with different
types of LD as well as non-LD students) this might not be the case. Encouraging students on an individual
basis to discuss their learning styles and needs, the types of tasks that cause them anxiety, and the types of
modifications to testing/grading that might make them more at ease, could help instructors to develop a
menu of testing/credit options that they feel comfortable with and that cover the needs of most students. In
many cases this set of options/modifications might be quite simple; for example, allowing extra time on
tests, providing review materials, and allowing students to drop one grade. Other cases might be more
complex, but the very knowledge that the instructor is aware of the problem and is willing to work with it
sets a tone in the classroom that may in and of itself do much to reduce anxiety. Test anxiety is a complex
and to some extent idiosyncratic phenomenon, thus the ideas offered here are merely suggestions, though
hopefully they indicate directions which instructors may explore when working with anxious students.
As with all research , the current study had a number of limitations that should be mentioned so
that they may be taken into account when interpreting findings. One important concern involves the nature
of the samples of students used in the study. Although mentioned previously, it is important to remember
that the sample of students with LD consisted of students who were defined as LD based upon their
receiving support services. The study did not consider students with LD who were not receiving services.
These unsupported students with LD may have very different anxiety profiles and learning needs. Also,
there is some danger that the most salient common characteristic of the sample of students with LD was
their experiences with and use of LDSS services, as opposed to anything unique to their learning needs.
138
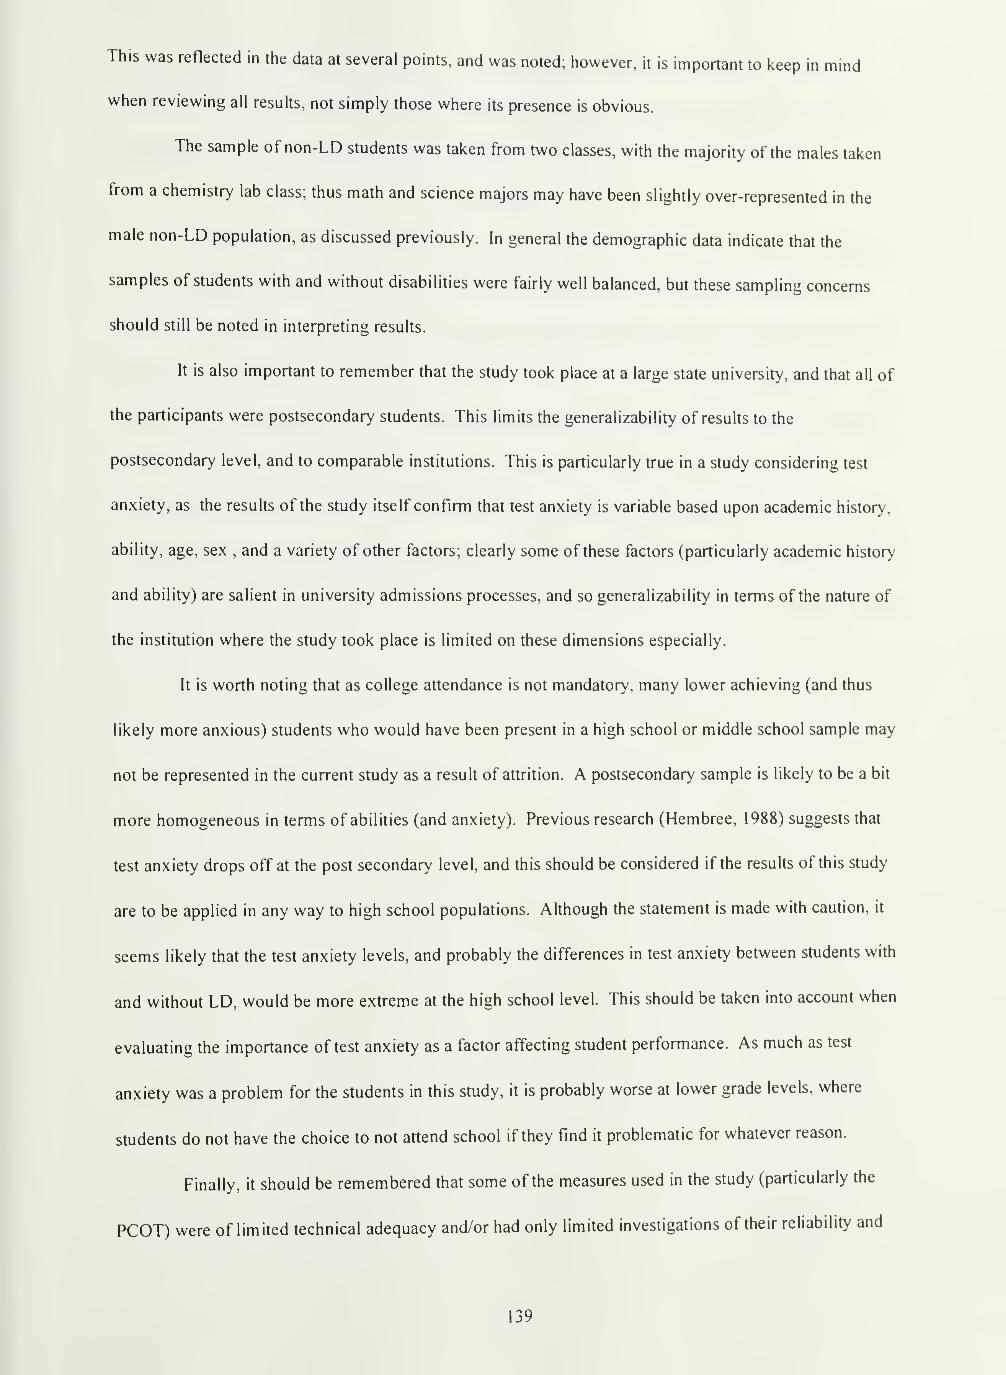
This was renected in the data at several points, and was noted; however, it is important to keep in mind
when reviewing all results, not simply those where its presence is obvious.
The sample of non-LD students was taken from two classes, with the majority of the males taken
from a chemistry lab class; thus math and science majors may have been slightly over-represented in the
male non-LD population, as discussed previously. In general the demographic data indicate that the
samples of students with and without disabilities were fairly well balanced, but these sampling concerns
should still be noted in interpreting results.
It is also important to remember that the study took place at a large state university, and that all of
the participants were postsecondary students. This limits the generalizability of results to the
postsecondary level, and to comparable institutions. This is particularly true in a study considering test
anxiety, as the results of the study itself confirm that test anxiety is variable based upon academic history,
ability, age, sex , and a variety of other factors; clearly some of these factors (particularly academic history
and ability) are salient in university admissions processes, and so generalizability in terms of the nature of
the institution where the study took place is limited on these dimensions especially.
It is worth noting that as college attendance is not mandatory, many lower achieving (and thus
likely more anxious) students who would have been present in a high school or middle school sample may
not be represented in the current study as a result of attrition. A postsecondary sample is likely to be a bit
more homogeneous in terms of abilities (and anxiety). Previous research (Hembree, 1988) suggests that
test anxiety drops off at the post secondary level, and this should be considered if the results of this study
are to be applied in any way to high school populations. Although the statement is made with caution, it
seems likely that the test anxiety levels, and probably the differences in test anxiety between students with
and without LD, would be more extreme at the high school level. This should be taken into account when
evaluating the importance of test anxiety as a factor affecting student performance. As much as test
anxiety was a problem for the students in this study, it is probably worse at lower grade levels, where
students do not have the choice to not attend school if they find it problematic for whatever reason.
Finally, it should be remembered that some of the measures used in the study (particularly the
PCOT) were of limited technical adequacy and/or had only limited investigations of their reliability and
139

ings.
validity performed. Result found using these measures should be interpreted with caution. Concerns
regarding the PCOT and LDSS data measures in particular are discussed earlier, but readers should assess
these materials (presented in Appendix A) themselves as they review and assess study fmdi
Conclusion
In conclusion, this study continues to demonstrate the prevalence and importance of test anxiety
as a phenomenon affecting students' academic performance, attitudes, and choices. Importantly, test
anxiety is not an equalizing phenomenon, as it more severely affects students who are already academically
troubled and thus increases the already too large gap in achievement and opportunity between
academically, economically, and socially advantaged and disadvantaged students. Forttinately, as previous
research suggests and this sUidy reiterates, there are a number of environmental factors that can be
manipulated to mitigate students' test anxiety levels. It is hoped that the presentation and investigation of
some such factors in this sUidy will spark both further research on, and implementation of, modifications to
the testing environment, so that test anxious students will be better served and not remain at a disadvantage
in our schools.
140
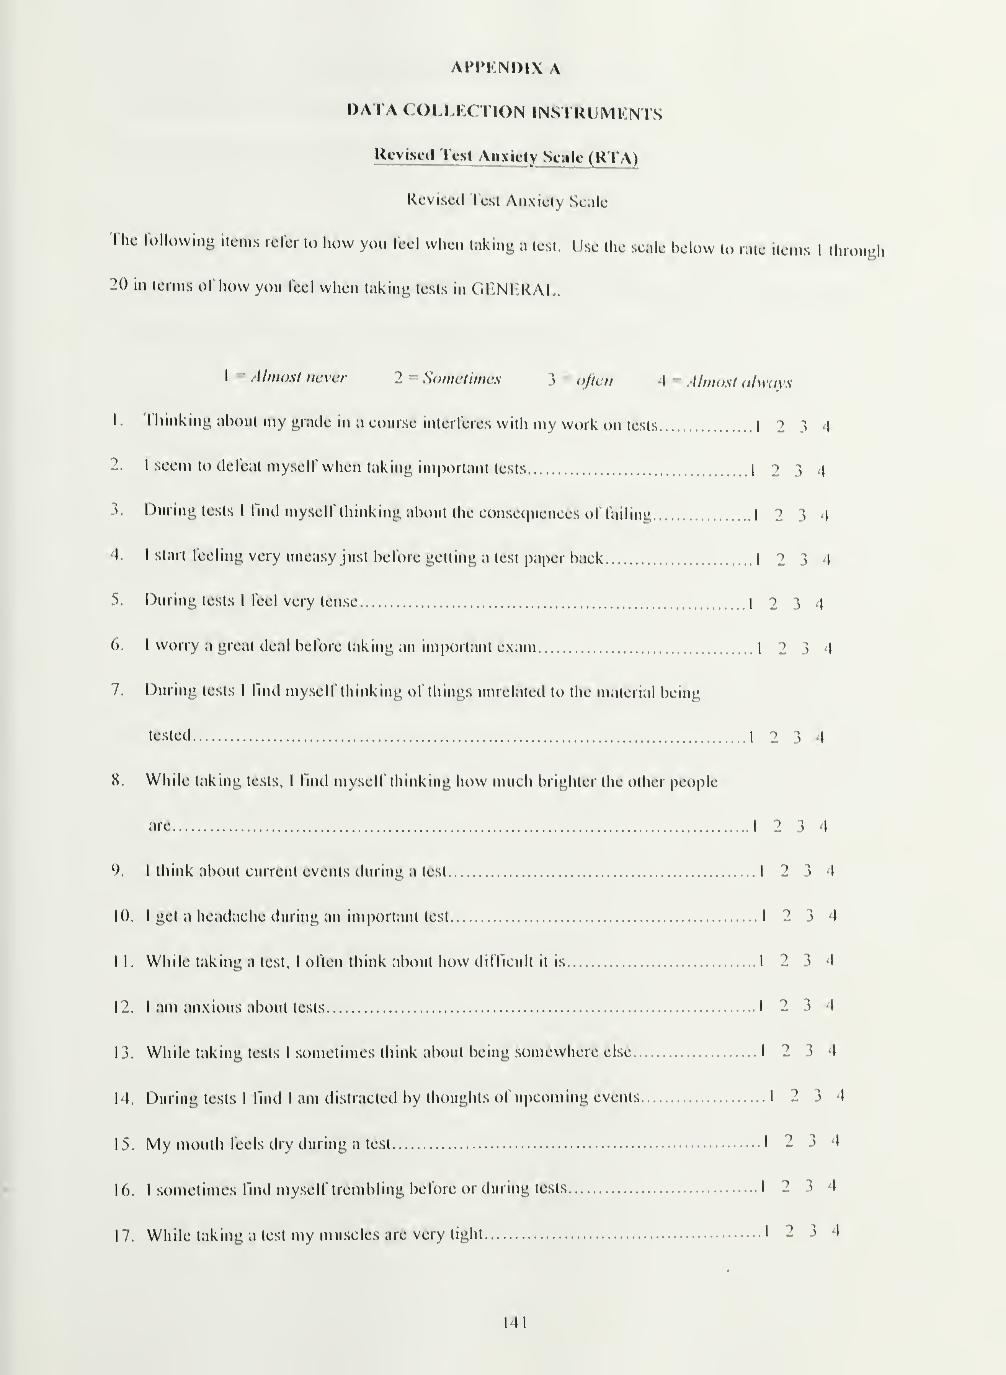
Dvvmi; iicins refer to how you feel when taking a test. Use the scale below to rale items I tluoi^Mi
ArPKINDIX A
DATA (OLUXHON IINS I KUMKN I S
Revised Test Anvicty Scale (\U \)
Revised Test Anxiety Scale
I hc lollowmi; iicMis refer to how you feel when taking a test. Use the scale below to rale items 1 thi
20 in lenns of how you feci when lakini; Icsis in (il-Nl RAl..
1 = Almost never 2 = Sometimes 3 « often 4 = Almost always
1. ThinkinL; about my grade in a course interferes wilh my work on tests 1 2 3 4
2. I seem to defeat myself when taking important testsI 2 3 4
3. During tests I find myself thinking about the consequences of failing 1 2 3 4
4. I start feeling very imeasy just before getting a test paper back 1 2 3 4
5. During tests I feel very tense1 2 3 4
(). 1 worry a great deal before taking tin important exam 1 2 3 4
7. During tests 1 llnd myself thinking of things unrelated to the material being
tested1 2 3 4
8. While taking tests, 1 find myself thinking how much brighter the other people
are 1 2 3 4
9. I think about current events during a test 12 3 4
10. I get a headache during an important test 12 3 4
1 i . While taking a test, 1 otlcn think about how difficult it is I 2 3 4
12. I am anxious about tests 1 2 3 4
13. While taking tests I sometimes think about being somewhere else 12 3 4
14. During tests 1 find 1 an) distracted by thoughts of upcoming events 1 2 3 4
15. My mouth feels dry during a test I 2 3 4
16. I sometimes find myself trembling before or during tests 1 2 3 4
17. While taking a test my mu.scles are very tight I 2 3 4
141

18. I have difficulty breathing while taking a test 12 3 4
19. During the test1 think about how I should have prepared for the test 1 2 3 4
20. I worry before the test because I do not know what to expect 1 2 3 4
Thank you !
Notes: To obtain sub-scale scores, Worry items = 1, 2, 3, 8, 1 1, 19; Tension items = 4, 5, 6, 12, 20; Test
Irrelevant Thinking items = 7, 9, 13, 14; Bodily Symptoms items = 10, 15, 16, 17, 18.
142

Academic Locus of Control Scale (ALOCS)
Academic Beliefs
Please read each of the following statements, and in the blank immediately before the statement put a "T
if you believe the statement is more true than false, and put an "F" if you believe the statement is more
false than true.
1 • College grades most often reflect the effort you put into classes. (F)
2. 1 came to college because it was expected of me. (T)
3. I have largely determined my own career goals. (F)
4. Some people have a knack for writing, while others will never write well
no matter how hard they try. (T)
5. I have taken a course because it was an easy good grade at least once. (T)
6. Professors sometimes make an early impression of you and then no matter
what you do , you cannot change that impression. (T)
7. There are some subjects in which I could never do well. (T)
8. Some students, such as student leaders and athletes, get free rides in college classes. (T)
9. I sometimes feel there is nothing I can do to improve my situation. (T)
10. I never feel really hopeless - there is always something I can do to improve my situation. (F)
1 1 . I would never allow social activities to affect my studies. (F)
12. There are many more important things for me than getting good grades. (T)
_13. Studying every day is important. (F)
14. For some courses, it is not important to go to class. (T)
15. I consider myself highly motivated to achieve success in life. (F)
16. 1 am a good writer. (F)
17. Doing work on time is always important to me. (F)
18. What I learn is more determined by college and course requirements than
by what I want to learn. (T)
19. I have been known to spend a lot of time making decisions which others
143

do not take seriously. (F)
20. I am easily distracted. (T)
.21.1 can be easily talked out of studying. (T)
.22. 1 get depressed sometimes, and then there is no way I can accomplish what
I know I should be doing. (T)
.23. Things will probably go wrong for me sometime in the near future. (T)
24. I keep changing my mind about my career goals. (T)
25. I feel 1 will someday make a real contribution to the world if 1 work
hard at it. (F)
26. There has been at least one instance in school where social activity impaired
my academic performance. (T)
27. I would like to graduate from college, but there are more important things
in my life. (T)
28. I plan well and I stick to my plans. (F)
Notes: Score is determined by summing the number of externally answered items. External answers are in
parentheses at the end of each question. Higher scores thus retlect a more external locus of control; lower
scores, a more internal locus of control.
144
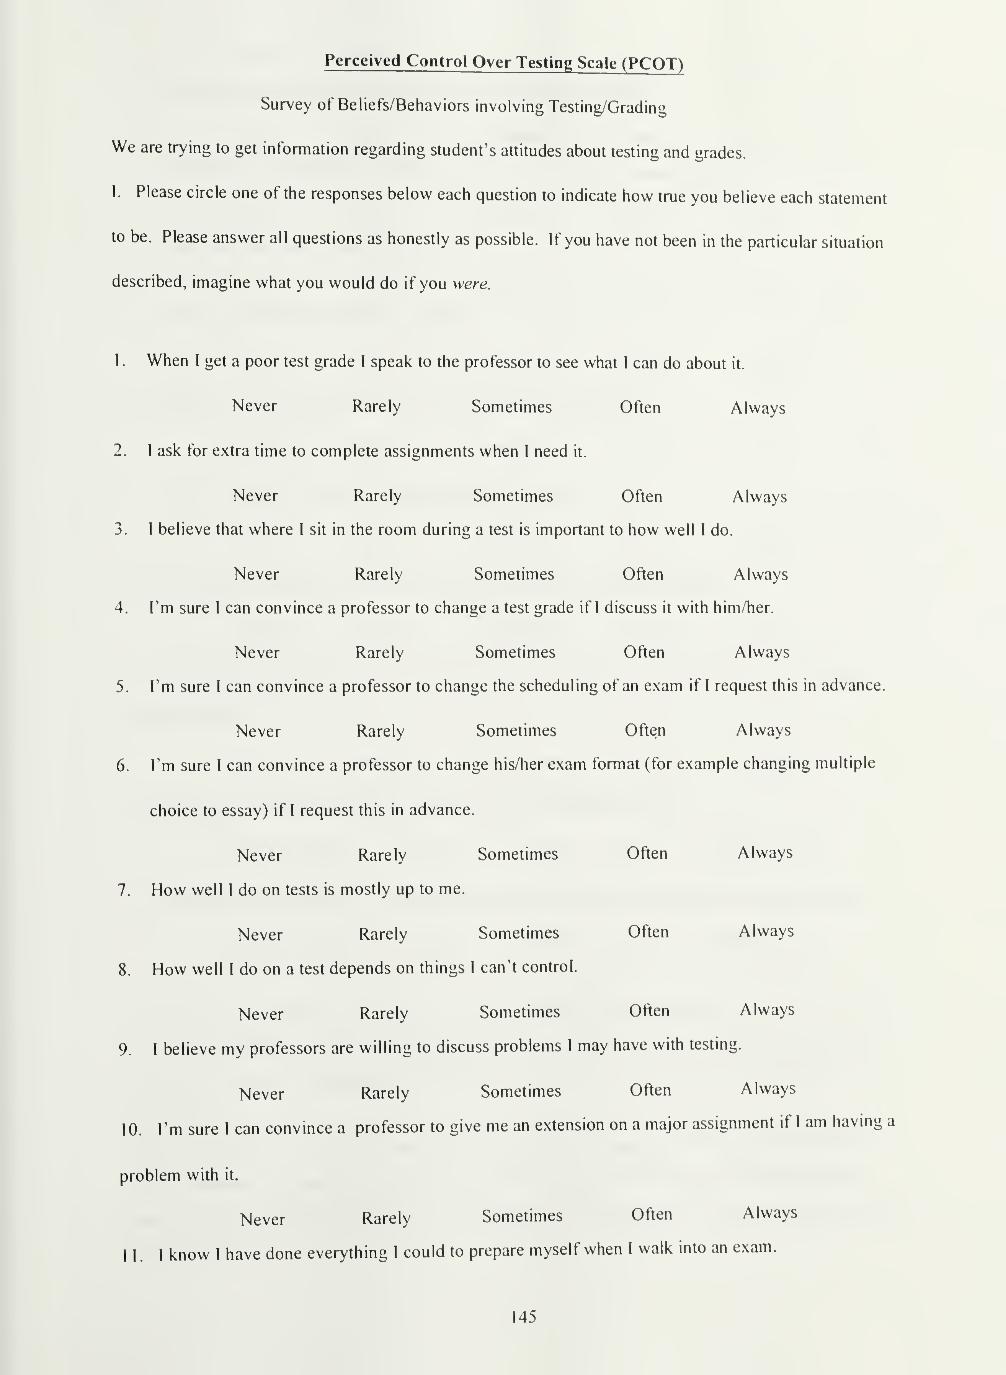
Perceived Control Over Testing Scale (PCOT)
Survey of Beliefs/Behaviors involving Testing/Grading
We are trying to get information regarding student's attitudes about testing and grades.
I. Please circle one of the responses below each question to indicate how true you believe each statement
to be. Please answer all questions as honestly as possible. If you have not been in the particular situation
described, imagine what you would do if you were.
1. When 1 get a poor test grade 1 speak to the professor to see what I can do about it.
Never Rarely Sometimes Often Always
2. 1 ask for extra time to complete assignments when I need it.
Never Rarely Sometimes Often Always
3. I believe that where I sit in the room during a test is important to how well 1 do.
Never Rarely Sometimes Often Always
4. Vm sure I can convince a professor to change a test grade if I discuss it with him/her.
Never Rarely Sometimes Often Always
5. Vm sure I can convince a professor to change the scheduling of an exam if I request this in advance.
Never Rarely Sometimes Often Always
6. Tm sure 1 can convince a professor to change his/her exam format (for example changing multiple
choice to essay) if I request this in advance.
Never Rarely Sometimes Often Always
7. How well 1 do on tests is mostly up to me.
Never Rarely Sometimes Often Always
8. How well 1 do on a test depends on things I can't control.
Never Rarely Sometimes Often Always
9. I believe my professors are willing to discuss problems I may have with testing.
Never Rarely Sometimes Often Always
10. Tm sure 1 can convince a professor to give me an extension on a major assignment if I am havmg a
problem with it.
Never Rarely Sometimes Often Always
11. 1 know I have done everything 1 could to prepare myself when 1 walk into an exam.
145
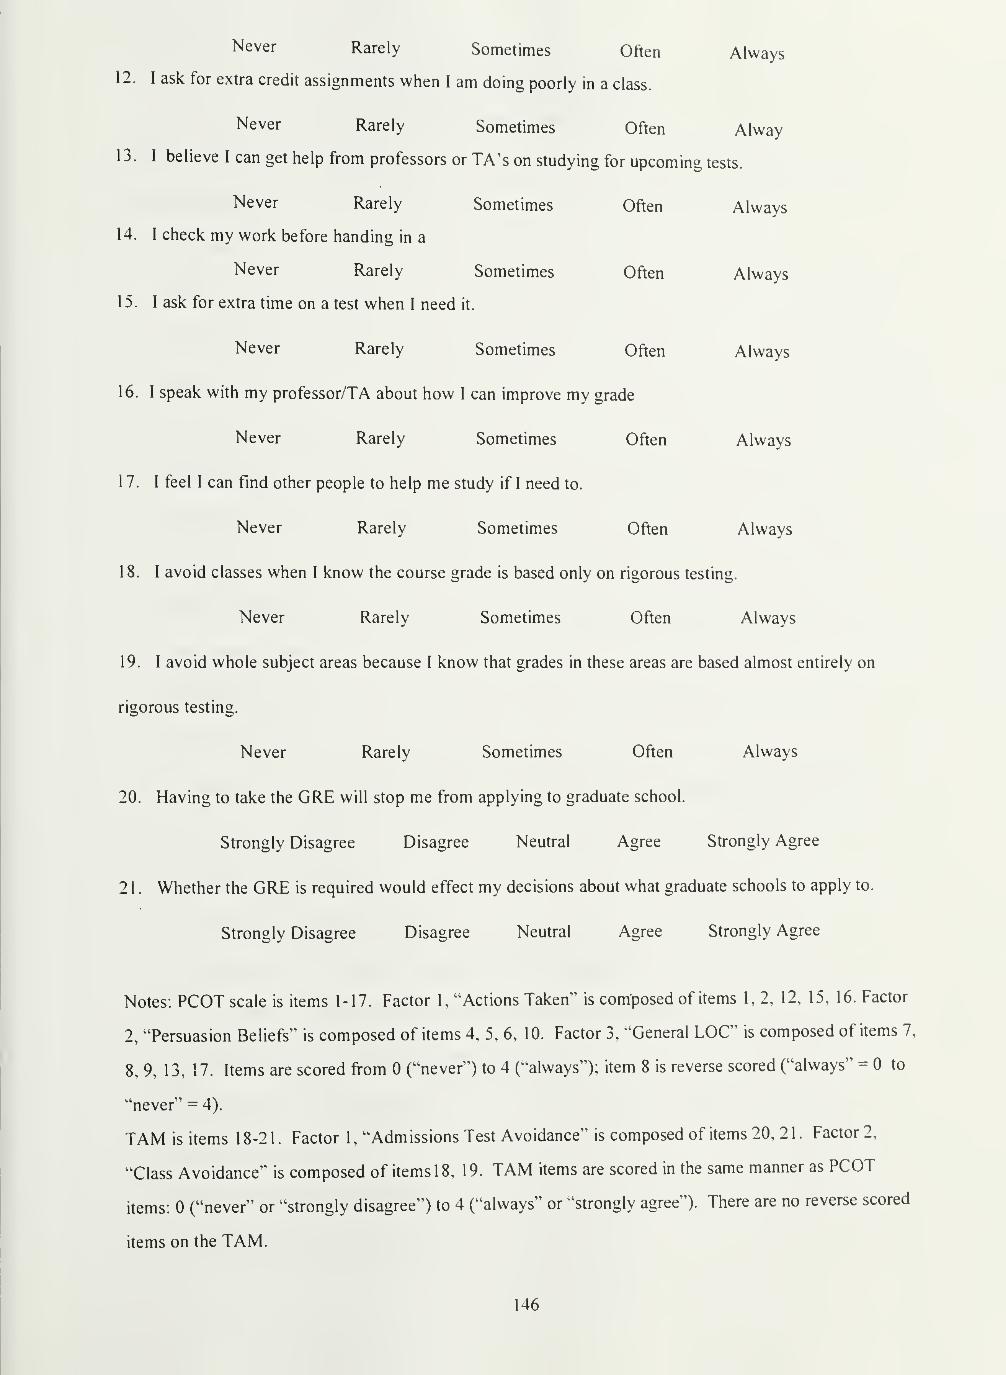
Never Rarely Sometimes Often Always
12. I ask for extra credit assignments when I am doing poorly in a class.
Never Rarely Sometimes Often Alway
13. I believe I can get help fi-om professors or TA^s on studying for upcoming tests.
Never Rarely Sometimes Often Always
14. I check my work before handing in a
Never Rarely Sometimes Often Always
15. I ask for extra time on a test when I need it.
Never Rarely Sometimes Often Always
16. I speak with my professor/TA about how I can improve my grade
Never Rarely Sometimes Often Always
1 7. I feel I can find other people to help me study if I need to.
Never Rarely Sometimes Often Always
18. I avoid classes when I know the course grade is based only on rigorous testing.
Never Rarely Sometimes Often Always
19. I avoid whole subject areas because I know that grades in these areas are based almost entirely on
rigorous testing.
Never Rarely Sometimes Often Always
20. Having to take the ORE will stop me from applying to graduate school.
Strongly Disagree Disagree Neutral Agree Strongly Agree
2 1 . Whether the GRE is required would effect my decisions about what graduate schools to apply to.
Strongly Disagree Disagree Neutral Agree Strongly Agree
Notes: PCOT scale is items 1-17. Factor 1, "Actions Taken ' is composed of items 1,2, 12, 15, 16. Factor
2, "Persuasion Beliefs" is composed of items 4, 5, 6, 10. Factor 3, ^^General LOG" is composed of items 7,
8, 9, 13, 17. Items are scored from 0 ("never ^) to 4 ("always"); item 8 is reverse scored ("always" = 0 to
"never" = 4).
TAM is items 18-21. Factor 1 , "Admissions Test Avoidance" is composed of items 20, 2 1.Factor 2,
"Class Avoidance" is composed of itemslS, 19. TAM items are scored in the same manner as PCOT
items: 0 ("never" or "strongly disagree") to 4 (^^always" or "strongly agree"). There are no reverse scored
items on the TAM.
146
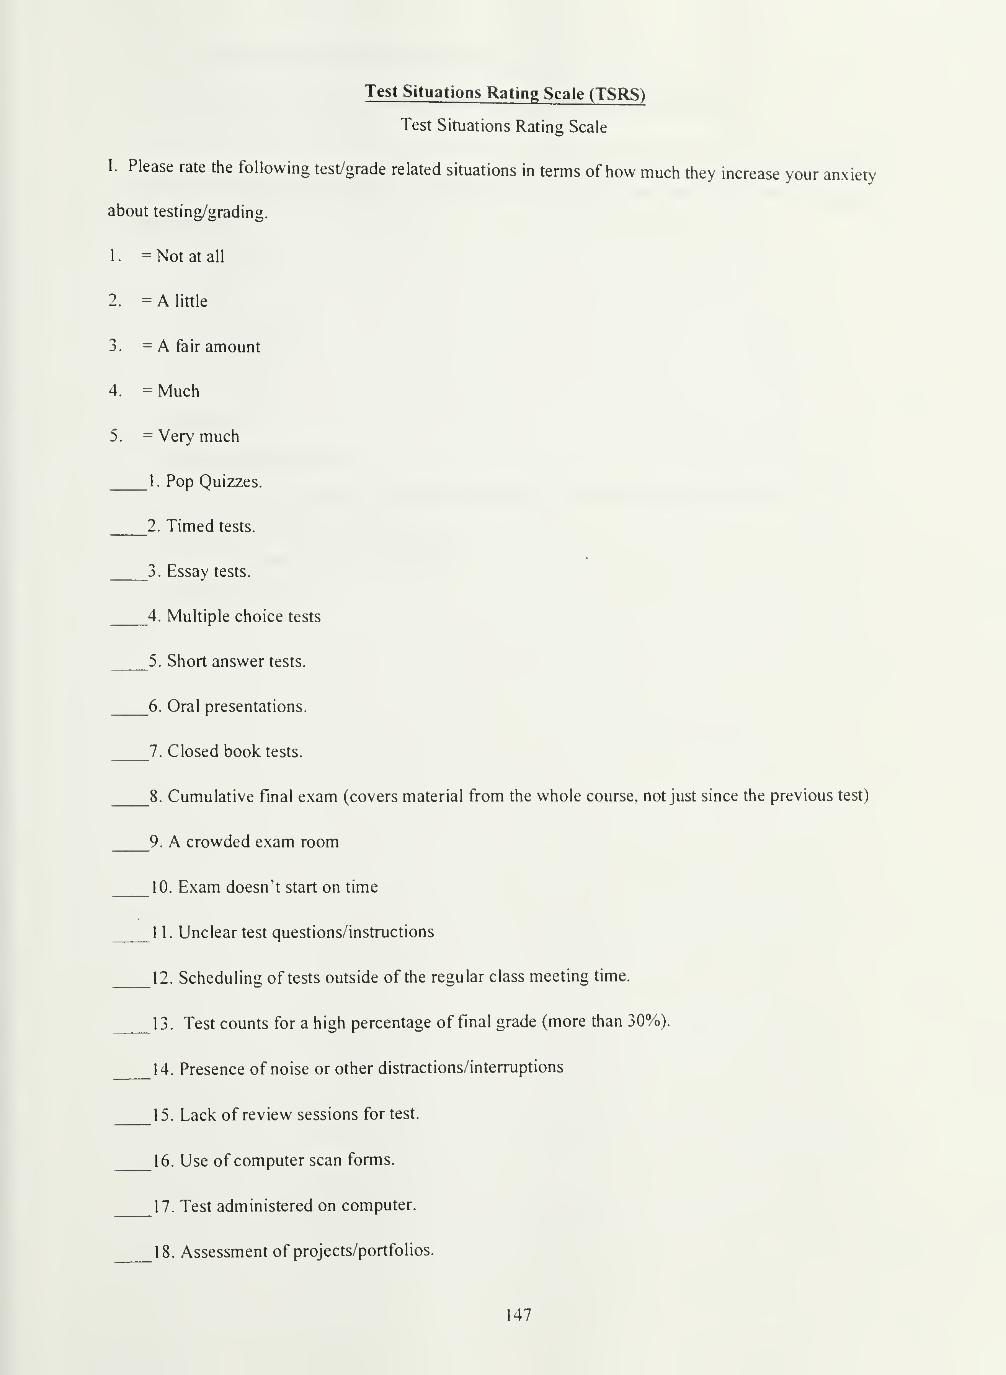
Test Situations Rating Scale (TSRS)
Test Situations Rating Scale
I. Please rate the following test/grade related situations in terms of how much they increase your anxiety
about testing/grading.
1. = Not at all
2. = A little
3. = A fair amount
4. = Much
5. = Very much
1. Pop Quizzes.
2. Timed tests.
3. Essay tests.
4. Multiple choice tests
5. Short answer tests.
6. Oral presentations.
7. Closed book tests.
8. Cumulative final exam (covers material from the whole course, not just since the previous test)
9. A crowded exam room
10. Exam doesn't start on time
1 1. Unclear test questions/instructions
12. Scheduling of tests outside of the regular class meeting time.
13. Test counts for a high percentage of final grade (more than 30%).
14. Presence of noise or other distractions/interruptions
15. Lack of review sessions for test.
16. Use of computer scan forms.
17. Test administered on computer.
18. Assessment of projects/portfolios.
147

1^^- I wo or more ini|n>il.iMt tests on the same ihy
20. I'cnallics for guessing (e.g., points subtracted Ironi score lor wronp. answers)
II Please rate how anxiety producing you find testing to be in eacli ol the lollowing subject areas, using
the lolU)wing scale:
I not at all
?. a little
3 ' a fair amount
4 *= very much
5 = completely
1 Mathematics
2. Physical/biological sciences
3. Social sciences (psychology, socit>lo!»y. business, economics, consumer studies, etc.)
'I 1 lumanities (I'Uglish, History, etc.)
5. I'ine Arts (Music, Dance, Ail, Theater)
6 l'oreiL\n l anmiages
MS
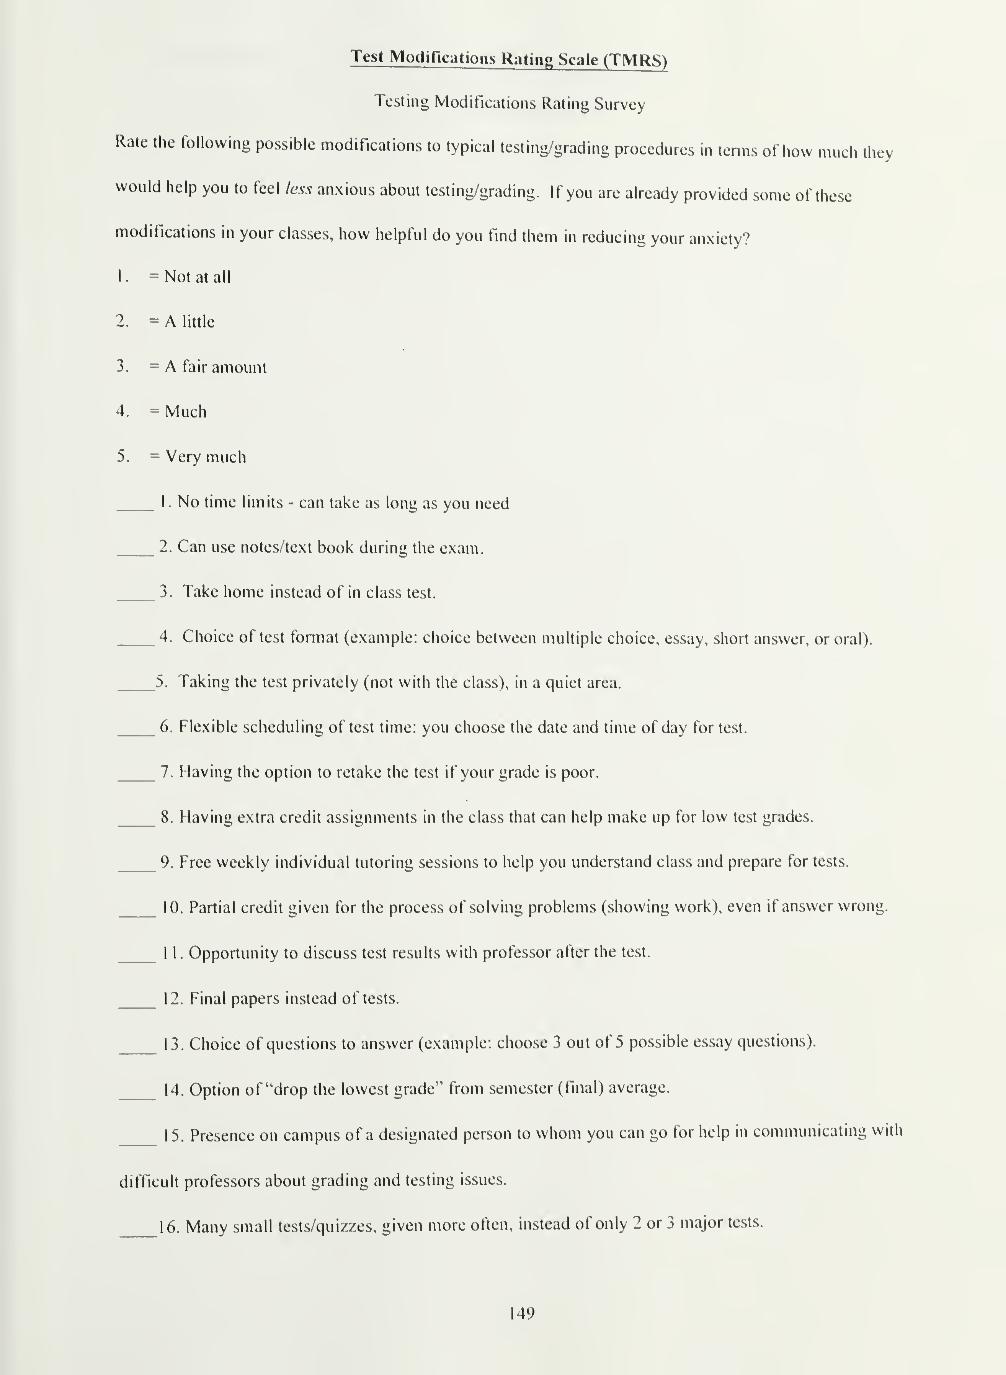
lev
Test IModifications Rating Scale (TMRS)
Testing Modifications Rating Survey
Rate the following possible modifications to typical testing/grading procedures in terms of how much th.
would help you to feel less anxious about testing/grading. If you are already provided some of these
modifications in your classes, how helpful do you find them in reducing your anxiety?
1. = Not at all
2. = A little
3. = A fair amount
4. = Much
5. = Very much
1 . No time limits - can take as long as you need
2. Can use notes/text book during the exam.
3. Take home instead of in class test.
4. Choice of test format (example: choice between multiple choice, essay, short answer, or oral).
5. Taking the test privately (not with the class), in a quiet area.
6. Flexible scheduling of test time: you choose the date and time of day for test.
7. Having the option to retake the test if your grade is poor.
8. Having extra credit assignments in the class that can help make up for low test grades.
9. Free weekly individual tutoring sessions to help you understand class and prepare for tests.
10. Partial credit given for the process of solving problems (showing work), even if answer wrong.
1 1 , Opportunity to discuss test results with professor after the test.
12. Final papers instead of tests.
13. Choice of questions to answer (example: choose 3 out of 5 possible essay questions).
14. Option of "drop the lowest grade" from semester (final) average.
15. Presence on campus of a designated person to whom you can go for help in communicating with
difficult professors about grading and testing issues.
16. Many small tests/quizzes, given more often, instead of only 2 or 3 major tests.
149

1 7. Getting an outline of exactly what will be on the test, to study from.
18. Getting practice tests or copies of old tests to prepare with.
150
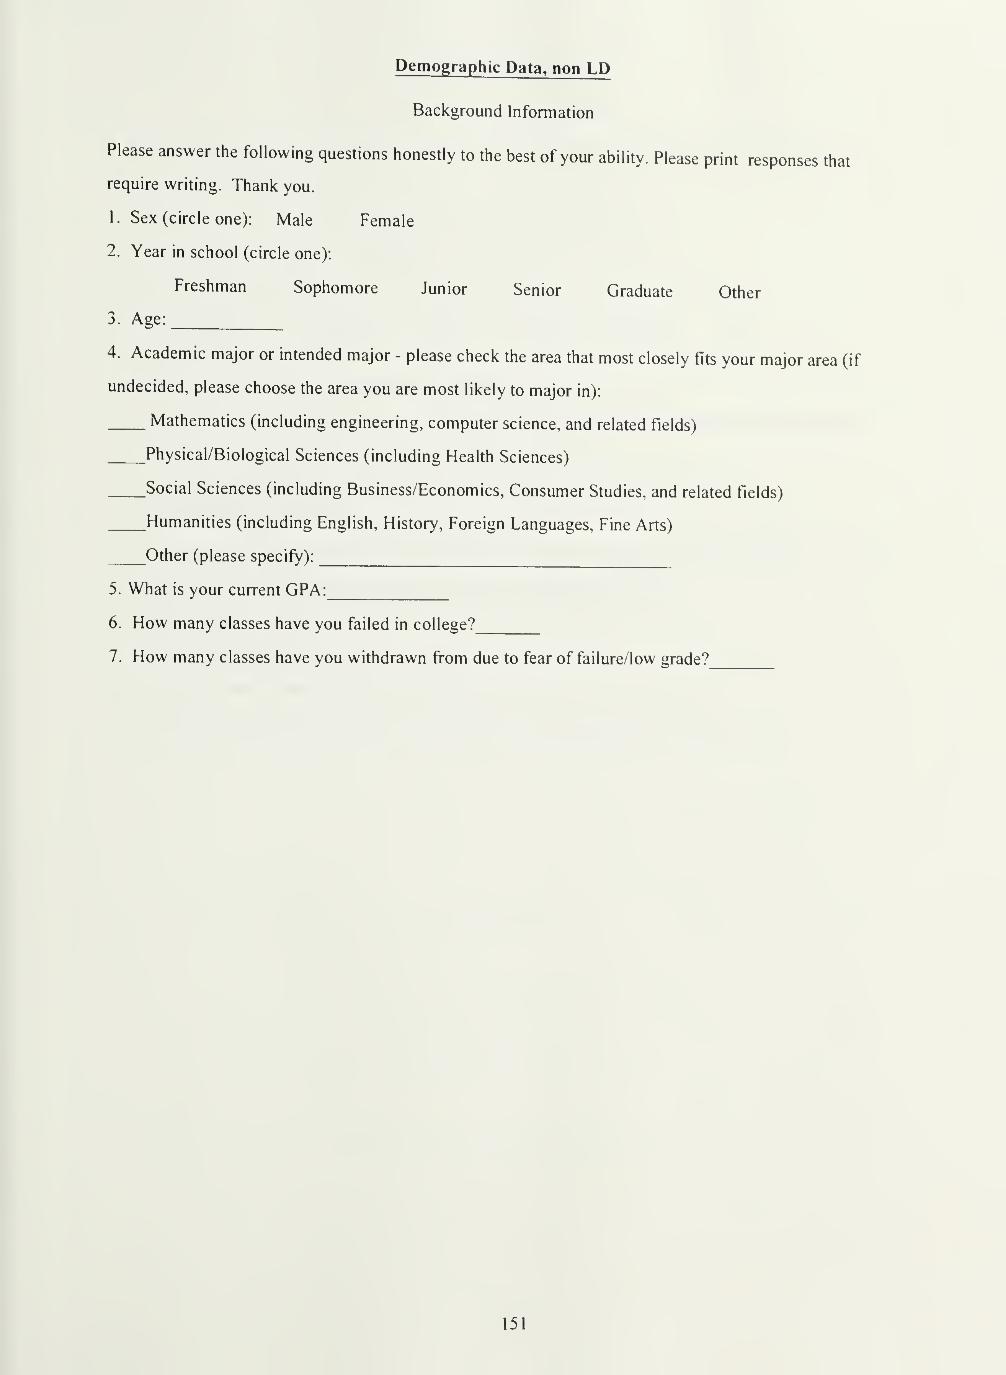
Demographic Data, non LP
Background Information
Please answer the following questions honestly to the best of your ability. Please print responses that
require writing. Thank you.
1. Sex (circle one): Male Female
2. Year in school (circle one):
Freshman Sophomore Junior Senior Graduate Other
3. Age:
4. Academic major or intended major - please check the area that most closely fits your major area (if
undecided, please choose the area you are most likely to major in):
Mathematics (including engineering, computer science, and related fields)
Physical/Biological Sciences (including Health Sciences)
Social Sciences (including Business/Economics, Consumer Studies, and related fields)
Humanities (including English, History, Foreign Languages, Fine Arts)
Other (please specify):
5. What is your current CPA:
6. How many classes have you failed in college?
7. How many classes have you withdrawn from due to fear of failure/low grade?
151
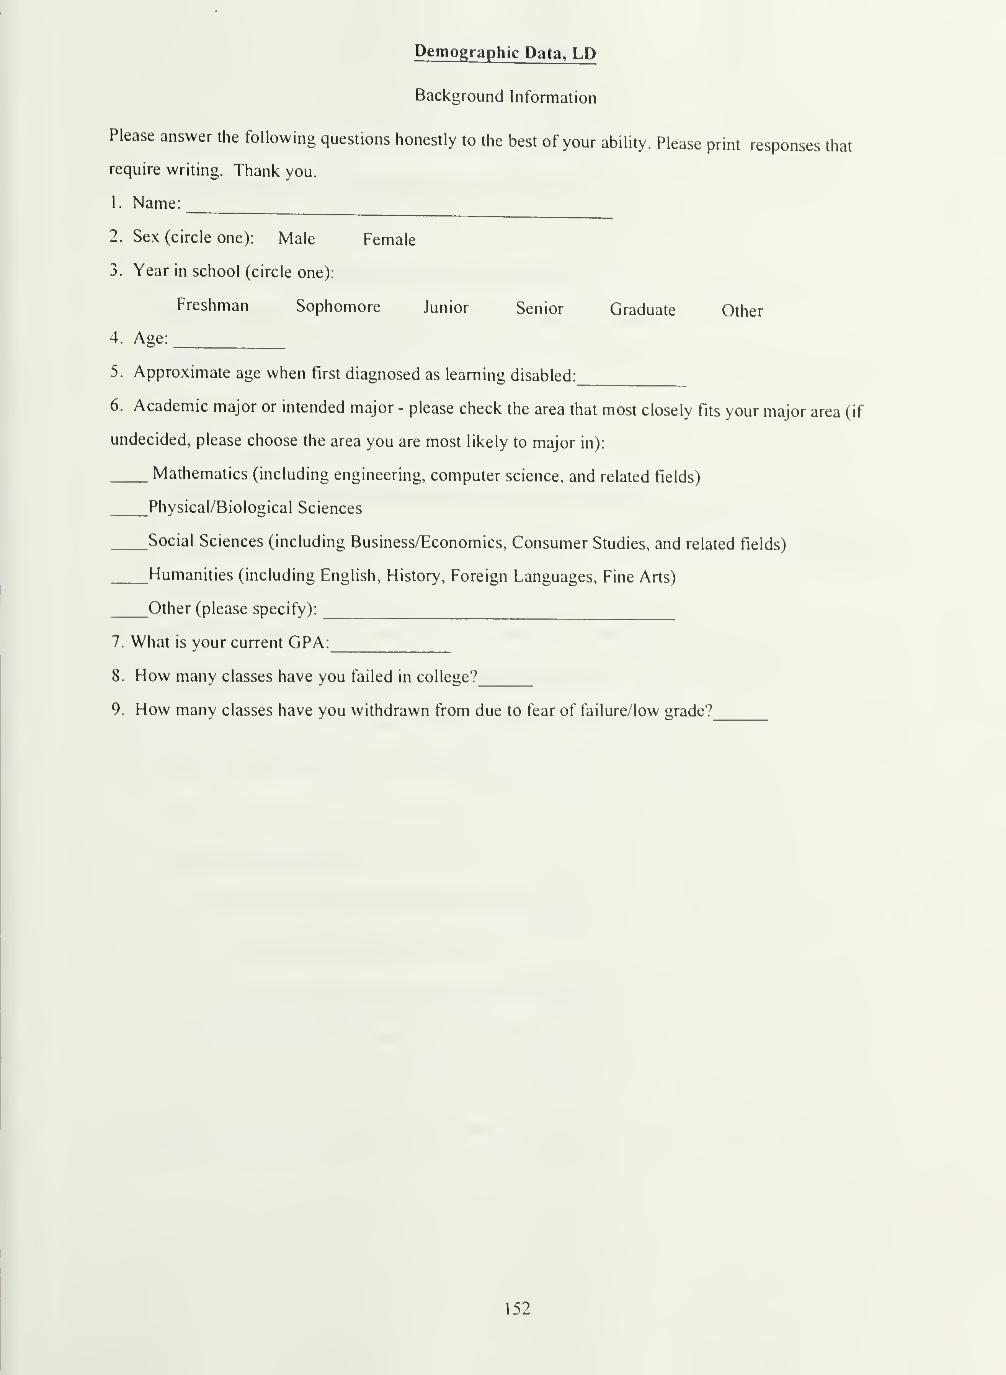
Demographic Data, LP
Background Information
Please answer the following questions honestly to the best of your ability. Please print responses that
require writing. Thank you.
1. Name:
2. Sex (circle one): Male Female
3. Year in school (circle one):
Freshman Sophomore Junior Senior Graduate Other
4. Age:
5. Approximate age when first diagnosed as learning disabled:
6. Academic major or intended major - please check the area that most closely fits your major area (if
undecided, please choose the area you are most likely to major in):
Mathematics (including engineering, computer science, and related fields)
Physical/Biological Sciences
Social Sciences (including Business/Economics, Consumer Studies, and related fields)
Humanities (including English, History, Foreign Languages, Fine Arts)
Other (please specify):
7. What is your current CPA:
8. How many classes have you failed in college?
9. How many classes have you withdrawn from due to fear of failure/low grade?
152
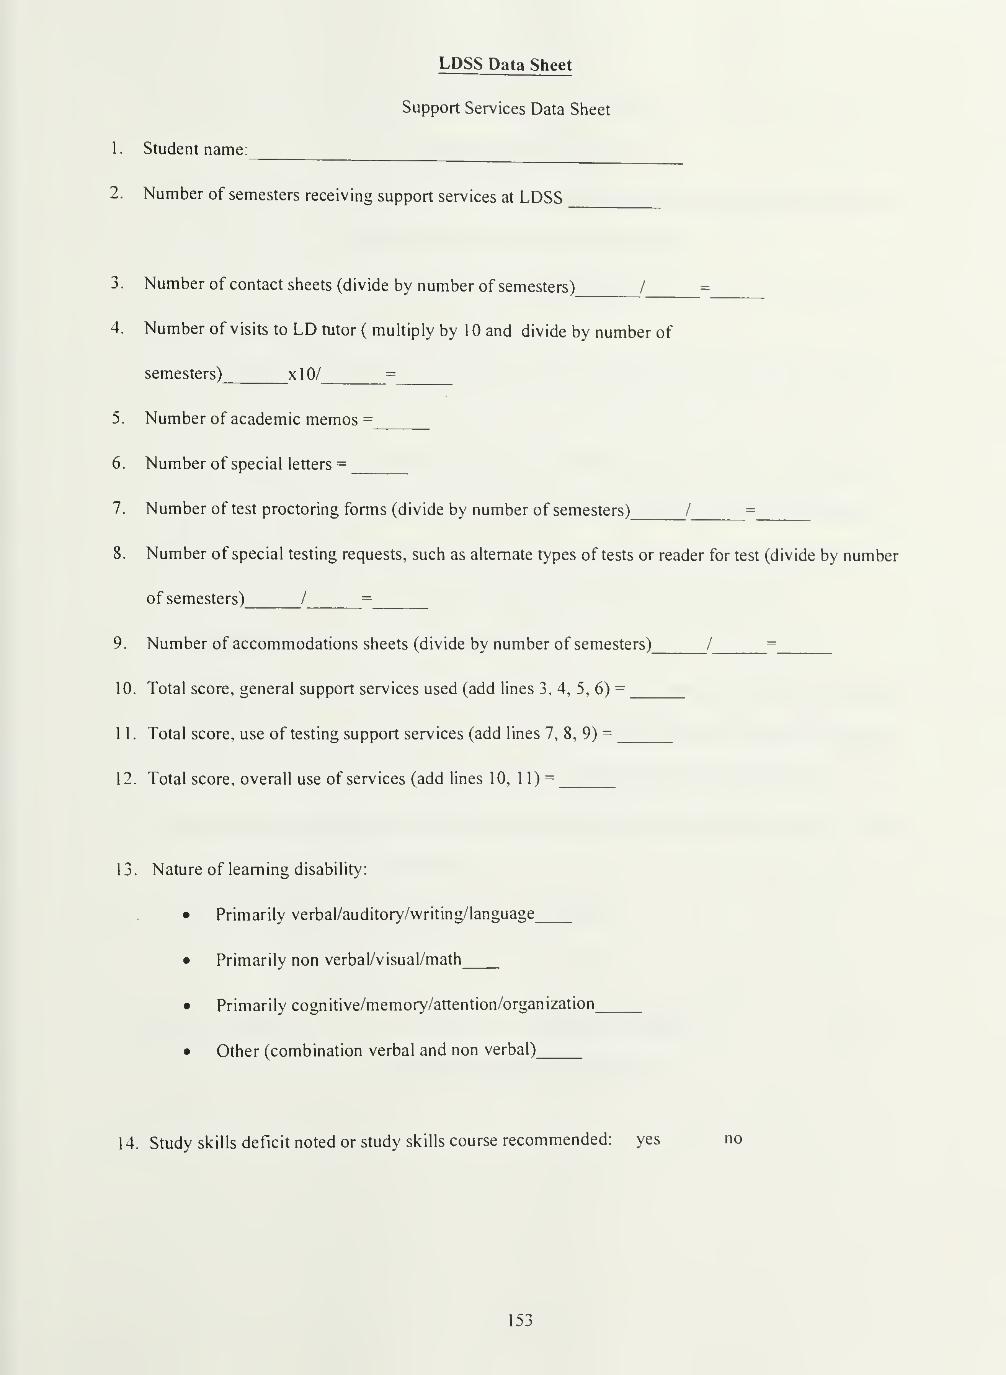
LOSS Data Sheet
Support Services Data Sheet
1 . Student name:
2. Number of semesters receiving support services at LOSS
3. Number of contact sheets (divide by number of semesters) /=
4. Number of visits to LD tutor ( multiply by 10 and divide by number of
semesters) x 1 0/ =
5. Number of academic memos =
6. Number of special letters =
7. Number of test proctoring forms (divide by number of semesters) / =
8. Number of special testing requests, such as alternate types of tests or reader for test (divide by number
of semesters) / =
9. Number of accommodations sheets (divide by number of semesters) / =
10. Total score, general support services used (add lines 3, 4, 5, 6) =
1 1 . Total score, use of testing support services (add lines 7, 8, 9) =
12. Total score, overall use of services (add lines 10, 11) =
1 3 . Nature of learning disability:
• Primarily verbal/auditory/writing/language
• Primarily non verbal/visual/math
• Primarily cognitive/memory/attention/organization
• Other (combination verbal and non verbal)
14. Study skills deficit noted or study skills course recommended: yes no
153
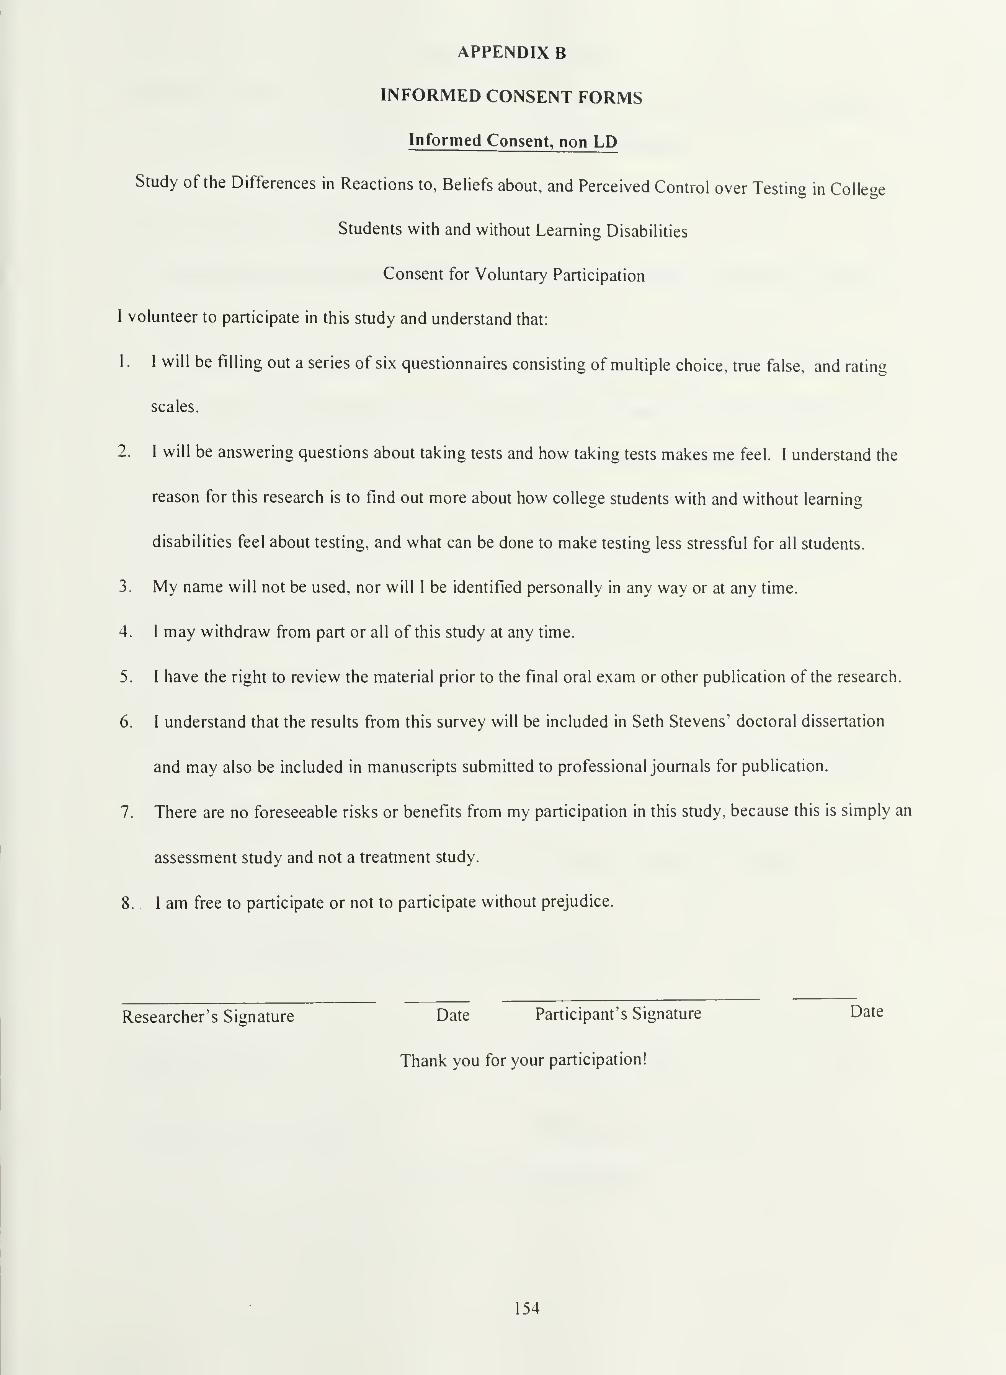
APPENDIX B
INFORMED CONSENT FORMS
Informed Consent, non LP
Study of the Differences in Reactions to, Beliefs about, and Perceived Control over Testing in College
Students with and without Learning Disabilities
Consent for Voluntary Participation
I volunteer to participate in this study and understand that:
1. I will be filling out a series of six questionnaires consisting of multiple choice, true false, and rating
scales.
2. 1 will be answering questions about taking tests and how taking tests makes me feel. I understand the
reason for this research is to find out more about how college students with and without learning
disabilities feel about testing, and what can be done to make testing less stressful for all students.
3. My name will not be used, nor will I be identified personally in any way or at any time.
4. I may withdraw from part or all of this study at any time.
5. I have the right to review the material prior to the final oral exam or other publication of the research.
6. 1 understand that the results from this survey will be included in Seth Stevens' doctoral dissertation
and may also be included in manuscripts submitted to professional journals for publication.
7. There are no foreseeable risks or benefits from my participation in this study, because this is simply an
assessment study and not a treatment study.
8. I am free to participate or not to participate without prejudice.
Researcher's Signature Date Participant's Signature Date
Thank you for your participation!
154
Informed Consent, LP
Study of the Differences in Reactions to, Beliefs about, and Perceived Control over Testing in College
Students with and without Learning Disabilities
Consent for Voluntary Participation
I volunteer to participate in this study and understand that:
1. I will be filling out a series of six questionnaires consisting of multiple choice, true false, and rating
scales.
2. I will be answering questions about taking tests and how taking tests makes me feel. I understand the
reason for this research is to find out more about how college students with learning disabilities feel
about testing, and what can be done to make testing less stressful for these students.
3. My file at Learning Disabilities Support Services (LDSS) will be reviewed, by the researcher only, for
the purpose of gathering information about my learning disability and about how much I use the
services provided by LDSS.
4. My name will not be used, nor will I be identified personally in any way or at any time.
5. I may withdraw from part or all of this study at any time.
6. I have the right to review the material prior to the final oral exam or other publication of this research.
7. I understand that the results from this survey will be included in Seth Stevens' doctoral dissertation
and may also be included in manuscripts submitted to professional journals for publication.
8. There are no foreseeable risks or benefits from my participation, because this is simply an assessment
study, not a treatment study.
9. I am free to participate or not to participate without prejudice.
Researcher's Signature Date Participant's Signature Date
Participants Name (please print) Participants telephone number
Thank you for your participation!
155

APPENDIX C
ACADEMIC MAJOR CATEGORIES
The following is a list of all academic majors at UMASS. Each major is followed by a code,
indicating how this particular major should be categorized. The codes are as follows: M= Mathematics and
related fields (e.g., Engineering); P/BS = Physical and Biological Sciences and related tlelds (e.g., Health
Sciences); SS = Social Sciences (includes Business); H= Humanities (includes languages and fine arts); O
= Other (Majors not easily classifiable, such as Landscape Contracting and other School of Agriculture
type majors). If a student is in BDIC, their major must be classified according to which field it primarily
falls into. Any student listing his/her major as " undecided" (even though they are instructed not to do this)
should be put into the other category.
Accounting - MAfro American Studies - HAnimal Science - P/BS
Anthropology - SS
Apparel Marketing - SS
Art-H
Art History - HAstronomy - P/BS
Biochemistry and Molecular Biology - P/BS
Biology - P/BS
Building Materials and Wood Technology - OChemistry - P/BS
Chemical Engineering - P/BS
Chinese - HCivil and Environmental Engineering - MClassics - HClassics and Philosophy - HCommunication - HCommunication Disorders - P/BS
Comparative Literature - HComputer Science - MComputer Systems Engineering - MDance - HEconomics - SS
Electrical Engineering - MEngineering - MEnglish - HEntymology - P/BS
Environmental Design - OEnvironmental Health - P/BS
Environmental Science - P/BS
Exercise Science - P/BS
Family and Consumer Sciences -SS
Finance and Operations Management - SS
156
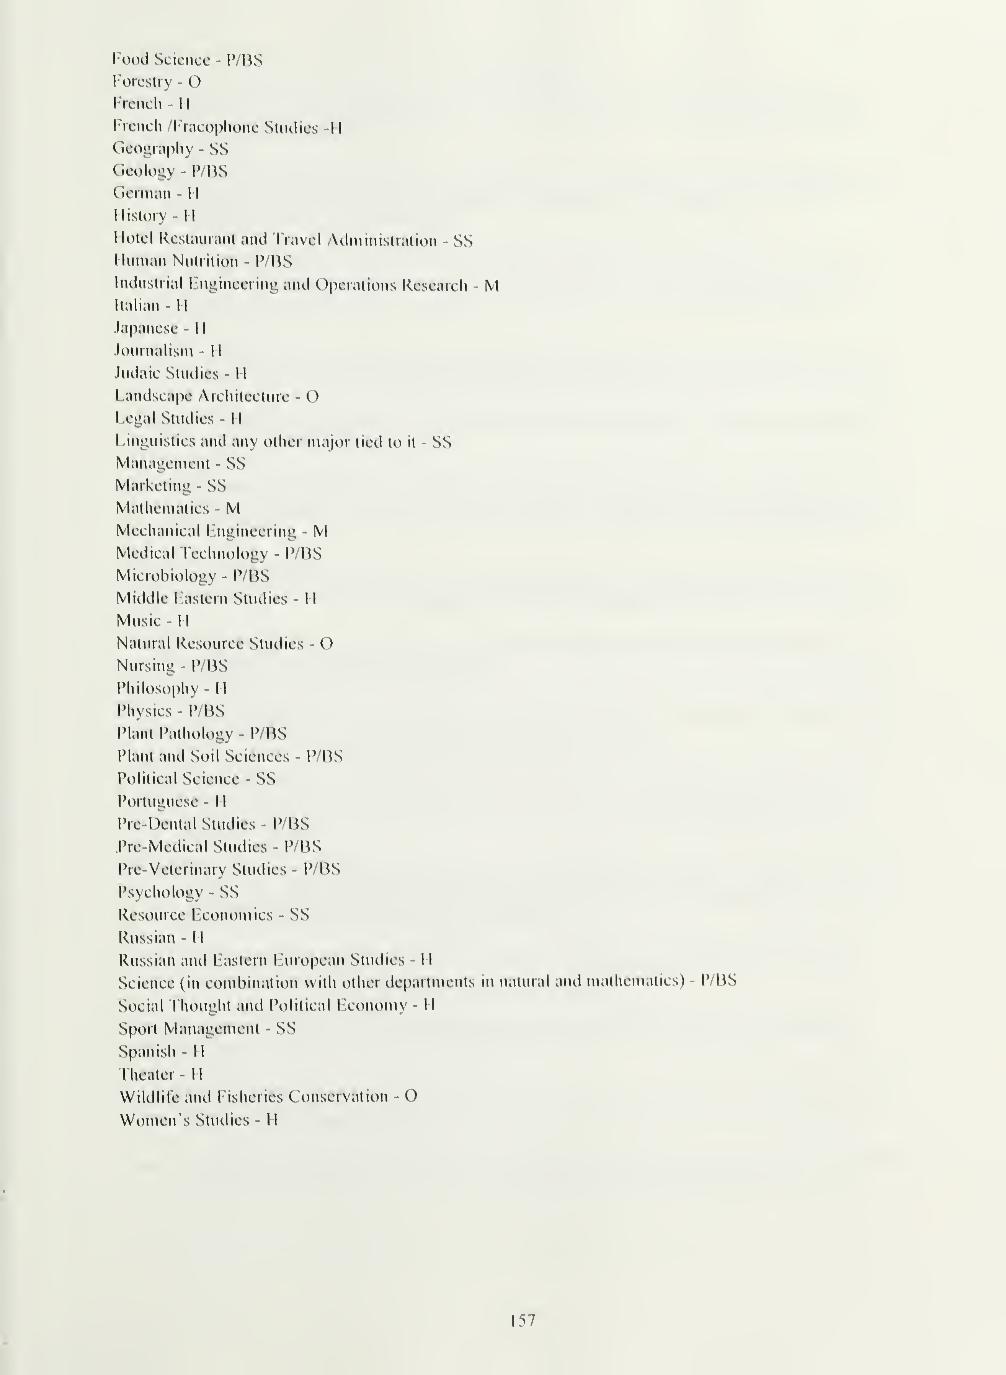
Food Science - P/BS
Forestry - OFrench - HFrench /Fracophone Studies -HGeograpliy - SS
Geology - P/BS
German - I I
History - II
Hotel Restaurant and Travel Administration - SSi hnnan Nutrition - P/!^S
industrial ringineering and Operations Research - MItalian - II
Japanese - 1 \
Journalism - HJudaic Studies - HLandscape Architecture - OLegal Studies - HLinguistics and any other major tied to it - SS
Management - SS
Marketing - SS
Mathematics - MMechanical Lngineering - MMedical Technology - P/BS
Microbiology - P/BS
Middle Hastern Studies - HMusic - HNatural Resource Studies - ONursing - P/BS
Philosophy - nPhysics - P/BS
Plant Pathology - P/BS
Plant and Soil Sciences - P/BS
Political Science - SS
Portuguese - I I
Pre-Hcntal Studies -P/BS
Pre-Mcdical Studies -P/BS
Pre-Vetennai7 Studies - P/BS
Psychology - SS
Resource Economics - SS
Russian - HRussian and Eastern European Studies - H
Science (in combination with other departments in natural and mathematics) - P/BS
Social rhought and Political Economy - HSport Management - SS
Spanish - HTheater - 1
1
Wildlile and Fisheries Conservation - O .
Women's Studies - H
157
RFI FRFNCES
Alpcil, R., & Habcr, R. ( 1^)()0). Anxicly in academic achievement situations. Journal of Abnormal andSocial Psychology, 6
K
207-2 15.'
Anderson, S. B., & Sauser, W. 1., Jr. (I W.S). Measurement ol tcst anxiety, an overview. In SpielluMoer. C.D. & Vagg, l\ R. (eds.) Test Anxiety: Iheory, Assessment, and I'reatment (pp. 15-33).
Washington, DC: Taylor and Francis.
nandalos, D. L., Yates, K., & Tiionuiike-Christ, T. (1995). Effects of math self-concept, perceived self-
efllcacy, and attributions for failure and success on test anxiety. Journal of Educational
Psycho logy 87(1). (>1 1-623.
Bander, R. S., & Bet/. N. i:. ( 1*)81). Flic relationship of sex and sex role to trait and situationally specific
anxiety types. Journal of Research tn IVisonalit y, 15(3) , 312-322.
Barkley, R. A. (1990). Attention defi cit hyperactivity disorder: A handbook for diagnosis and treatment.
New York: Guilft>rd Press."
Bear, G. G., Clever, A., & Proctor, W. A. ( 1 Self perception of nonhandicapped children and
children with learning disabilities in integrated classes. Journal of Special i:ducation 24(4), 409-
426.
Benson, J. it Bandalos, D. L. (1992). Second-order confirmatory factor analysis of the Reactions to fests
scale with cross-validation. Multivariate Behavioral Researc h, 27(3) 459-487.
Benson, J. A l-l-/ahhar. N ( 1*)94). further refinement and validation of the Revised Test Anxiety Scale.
Structural l-quation Modeliii!^.. 203-221.
Bron/all, A. I,., Murgatroyd, D., it McNeilly, R. A. (1974). Test anxiety among black college students: a
cross cultural study. Journal of Negro Education 43(2) . 190-193.
Brown, S. I)., it Nelson, f. I,. (198 >). Beyond the uniformity myth; A comparist>n oi academically
successful and unsuccessful test anxious college students. Journal of Counseling Psychology
30(3) , 367-374.
Bruck, M. (198(>). Social and emotional adjustments of learning disabled chiklren: A review of the issues.
In S. J. Ceci (lui.). Handbook of cognitive. st>cial. and neuroin\chological aspects of Learning
njsabilities (pp.361-380). Hillsdale. NJ: f.rlbaum.
Bryan, J. M., Sonnefeld, \ ,. J., & Grabowski, B. (198^). fhe relationship between fear of failure and
learning disabilities. Learning Hisability (Quarterly. 217-222.
Cohen. J., A C\>hen, P. (1975). Applied multiple regression/correlation analysis for the beha vioral
sciences. Hillsdale. NJ: Lawrence 1 arlbaum.
(\Mminian, A. L. (1989). Some characteristics of relations anuuig depression, anxiety, and sell-eflicacy.
Perceptual and Motor Skills 09(3) , 755-7()4.
Cosden. M. A. iSl: Macnamara, J (1997). Self concept and perceived social support among college students
with and without learning disabilities. Learning Di.sability (Quarterly, :0(l) 2-12.
158
Couch, J v.. Turner, W. E., & Garber, T. B. ( 1<)7<)). Sclfstatcmcnts, test anx iety a .ul academicachievement: a correlation al analysis. Paper presented at the International Association forBehavior Analysis: International Organization (5th, Dearborn, Michigan, June 16-19, 1979).(I RIC Document Reproduction Service No. ED 176 160)
Covington, M. V., & Omclich, C. L. (1987). "I knew it cold before the exam": a test of the anxiety-blockage hypothesis. Journal of Educalional Psychology. 79 (4), 393-400.
Darke, S. (1988). Anxiety and workmg memory capacity. Cognition and Emotion, 2(2 ), 145-154.
Devito, A. J., iSi Kubis, J. V. Actual and recalled test anxiety and llcxibihly, rigidity, and selfcontrol. Journal of Clinical [Psychology 39(6) , 970-975.
Dia/-Eefebvre, R. (1989) "j just didn't have enough time..." assisting the busy adult learner developcritical rcadin^and thinking skdK Paper presented at the International Conference on TeachingExcellence (I Ith, Austin, fX, May 21, 1989). (|;ric Document Reproduction Service No. ED311 203)
Dodds, J. II. (1975). An attribution theory approach to the correlations of children's anxiety with IQ, sex,
SES, and school achievement. [CD-R()M|. University Microlllms, Dissertation Copies, P .O. Box1764, A nn Arbor, Mich. 48106, Order No. 76-18,507. Abstract from: SilverPlattcr (lie: ErTc
'
item: ED bH 761.
Ducette, J. Wolk, S. ( 197 1 ). 1 ho limilalious ol the inlcractu)n hypothesis in regard to ability grouping
Temple University, Philadelphia, PA. (Eric Document Reproduction Service No. ILD 056 330)
Dunn, J. A., & Shanks, P. 1-. (1967). Childrcirs attitude s towards school and th eir relationships w ith
school anxiety, study I. School anxiety and cognitive liiiKlioning - exploratory studies. (Report
Number IRCOPPS-R-4-l). Michigan University, Ann Arbor, Midwest Research Center. (Eric
Document Reproduction Service No. I D 056 330)
Dykeman, B I- ( 1994). fhe effects of motivational orientation, self-efficacy, and feedback condition on
test anxiety. Journal of Instructional Psychoh>gy 21(2 ). Ill- 1 19.
El-/ahar. N E., & Mocevar, D. ( 1991 ). Cultural and sexual differences in test anxiety, trait anxiety, and
arousability: l -gvpt, Brazil, and the United Slates. Journal of Cross Cultural Psychology 22(2) ,
238-249.
Entwistle. I) R ,(irccnbeij„',cr, i; ( P>70) A survey ol Maryland ninth graders: II. test anxiety. (Report
number 68) Johns I lopkins University. Baltimore. MD.. Center for the Study of Social
Organization of Schools (Eric Document Reproduction Service No. ED 042 181
)
Everson,!! 1, I obias, S , I laitman. 1 1 , & Gourgey, A. ( 1993). lest anxiety and the curriculum: the
subject matters. (Eric Document Reproduction Service No. ED 366 598)
Friend, K. I".. (1982). Stress and performance: elTccts of subjective workload and time urgency. Personnel
Psychology 35(3) , 623-633.
Geen. R (i (1985). Test anxiety,persistence, and rcspons^ewitholding under conditions of repealed
lailure. Paper presented at the annual meeting of the Midwestern Psychological Association
(57th, Chicago, IE. May ?- I, l*>8S). (Eric Document Reproduction Service No. ED 261 283)
Geislhardt, C, & Munsch, J. (1996). Coping with sclun)! stress; a comparison of adolescents with and
without learning disabilities. Journal of Learning Disabilities, 29(3), 287-296.
159
Gjesme, T. (1981). The factor structure of test anxiety among children with different characteristics.Scandinavian Journal of Educational Research 25(2) , 63-98.
Goldsmith, D., & Albrecht, T. (1993). The impact of supportive communication networks on test anxietyand performance. Communication Education, 42 (2) , 142-158.
Green, L. T. (1990). Test anxiety, mathematics anxiety, and teacher comments: relationships to
achievement in remedial mathematics classes. Journal of Negro Education, 59 (3) , 320-335.
Grierl, M. J., & Bisanz, J. (1995). Anxieties and attitudes related to mathematics in grades 3 and 6.
Journal of Experimental Education 63(2) , 139-158.
Guida, F. V., & Ludlow, L. H. (1989). A cross cultural study of test anxiety. Journal of Cross Cultural
Psychology 20(2) , 178-190.
Head, L. Q., & Knight, C. B. (1988). The effects of trait anxiety on state anxiety and the perception of test
difficulty for undergraduates administered high and low difficulty tests. Paper presented at the
annual meeting of the Mid-South Educational Research Association (17th, Louisville, KY,November 8-11, 1988). (Eric Document Reproduction Service No. ED 303 509)
Helmke, A. (1988). The role of classroom context factors for the achievement impairing effect of test
anxiety. Anxiety Research 1(1) , 37-52.
Hembree, R. (1988). Correlates, causes, effects, and treatment of test anxiety. Review of Educational
Research, 58 (1), 47-77.
Hill, J. L. (1996). Speaking out: perceptions of students with disabilities regarding adequacy of services
and willingness of faculty to make accommodations. Journal of Postsecondary Education and
Disability, 12(1), 22-43.
Howell, D. C. (1995). Fundamental statistics for the behavioral sciences. Belmont, CA: Duxbury Press.
Hunsley, J. (1985). Cognitive processes in mathematics anxiety and test anxiety: the role of appraisals,
internal dialogue, and attributions. Journal of Educational Psychology 79(4) 388-392.
Julkunen, K. (1992). Trait and test anxiety in the foreign language classroom. Revised version of a paper
presented at a teaching symposium (Helsinki, Finland, January 25, 1991), (ERIC Document
Reproduction Service No. ED 345 551)
King, N. J., Ollendick, T. H., & Gullone, E. (1990). School related fears of children and adolescents.
Australian Journal of Education, 34 ( 1 ), 99- 1 12.
Learning Disabilities Support Services. (1997). Policies and Procedures. [Brochure]. Amherst, MA:
University of Massachusetts.
Lee, J. H. (1995). Information processing model of test anxiety and its effect on the speed-accuracy trade
off (ACT or the spreading activation explanation. Paper presented at the annual meeting of the
American Educational Research Association (San Francisco, CA, April 18-22, 1995). (ERIC
Document Reproduction Service No. ED 390 91 1)
Liebert, R., & Morris, L. (1967). Cognitive and emotional components of test anxiety: A distinction and
some initial data. Psychological Reports, 20 ,975-978.
160
Littig, K. E., & Knapp, A. (1978). The effects of ability grouping and course level on trait anxiety and test^"^1^^- Zeitschrift far Epirische Padagogik 2(1) . 2-16. Abstract from: SilverPlatter File-PsycINFO item: 63-04149.
Lyon, G. R. (1996), Learning disabilities. In E. J. Mash & R. A. Barkley (eds.), Child Psvchopatholoay(pp.390-435). New York: Guilford.
^
Mackenzie, A. M, (1994). Examination preparation, anxiety, and examination performance in a group ofadult students. International Journal of Lifelon.^ Education 13(5) , 373-388.
Madsen, H. S., & Murray, N. (1984). Retrospective evaluation of testing in ESL content and skills courses.Paper presented at the annual meeting of the Teachers of Speakers of Other Languages ( 1 8th,
Houston, TX, March 6-1 1, 1984). (Eric Document Reproduction Service No. ED 249 815)
Mandler, G., & Sarason, S. (1952). A study of anxiety and learning. Journal of Abnormal and Social
Psychology, 47, 166-173.
Marso, R. N. (1970). Classroom testing procedures, test anxiety, and achievement. Journal ofExperimental Education 38(3) , 54-58.
Morrison, T. L. (1979). Classroom structure, work involvement, and social climate in elementary school
classrooms. Journal of Educational Psychology 71(4) , 471-477.
Mueller, J. H., Elser, M. J., & Rollack, D. N. (1993). Test anxiety and implicit memory. Bulletin of the
Psychonomic Society, 31(6), 531-533.
Naveh-Benjamin, M. (1991). A comparison of training programs intended for different types of test
anxious students: further support for an information processing model. Journal of Educational
Psychology, 83 (1), 134-139.
Nottleman, E. D. (1975). Test anxiety and off task behavior in evaluative situations. Paper presented at
the Biennial Meeting of the Society for Research in Child Development (Denver, Colorado, April
10-13, 1975). (ERIC Document Reproduction Service No. ED 113 022)
Paulman, R. G., & Kennelly, K. J. (1984). Test anxiety and ineffective test taking: different names, same
construct? Journal of Educational Psychology, 76(2), 279-288.
Phillips, B. N. (1978). School stress and anxiety . New York: Human Sciences Press (pp. 44-48).
Phillips, B. N„ Pitcher, G. D., Worsham, M. E., «fe Miller, S. C. (1980). Test anxiety and the school
environment. In I. G. Sarason (ed.), Test anxiety: Theory, research and applications (pp.327-346).
Hillsdale, NJ: Erlbaum.
Phillips, J. B., & Endler, N. S. (1982). Academic examinations and anxiety: the interaction model
empirically tested. Journal of Research in Personality 16(3) ,303-318.
Rapaport, R. J. (1984). Test anxiety and causal attributions following success and failure in an
achievement situation. Paper presented at the Annual Meeting of the Midwestern Psychological
Association (55th, Chicago, IL, May 3-5, 1984). (ERIC Document Reproduction Service No. ED
247 507)
Renick, M. J. & Harter, S. (1989). Impact of social comparisons on the developing self perceptions of
learning disabled students. Journal of Educational Psychology. 81(4) 631-638.
161
Ribordy, S. C, Tracy, R, J., & Bemotas, T. D. (1981). The effects of an attentional training procedure onthe performance ofhigh and low test-anxious children. Cognitive Therapy and Research 5 19-28. —
Rocklin, T. (1989). Individual differences in item selection in computerized self adapted testing. Paperpresented at the annual meeting of the American Educational Research Association (SanFrancisco, CA, March 27-31, 1989). (Eric Document Reproduction Service No. ED 310 136)
Saigh, P. A. (1985). Unscheduled assessment: test anxiety, academic achievement, and social validity.
Educational Research Quarterly 9(4) , 6-11.
Sapp, M. (1993). Test anxiety: applied research, assessment, and treatment interventions . Lanham, MD:University press of America (pp. 179-282).
Sarason, I. G. (1984). Stress, anxiety, and cognitive interference: reactions to tests. Journal of Personality
and Social Psychology, 46(4) 929-938.
Sarason, I. G. (1963). Test anxiety and intellectual performance. Journal of Abnormal and Social
Psychology, 66 73-75,
Sarason, I. G. & Stoops, R. (1978). Test anxiety and the passage of time. Journal of Consulting and
Clinical Psychology, 1 102-109.
Sarason, S. B., Davidson, K. S., Lighthall, F. F., Waite, R. R., & Ruebush, B. K, (1960). Anxiety in
elementary school children . New York: Wiley (pp. 1-83).
Schmitt, A. P., & Crocker, L. (1984). The relationship between test anxiety and person fit measures.
Paper presented at the annual meeting of the American Educational Research Association (68th,
New Orleans, LA, April 23-27, 1984). (Eric Document Reproduction Service No. ED 250 370)
Schonwetter, D. J., Struthers, C. W., & Perry, R. P. (1995). An empirical investigation of effective college
teaching behaviors and student differences: lecture organization and test anxiety. Paper presented
at the annual meeting of the American Educational Research Association (San Francisco, CA,
April 18-22, 1995). (Eric Document Reproduction Service No. ED 392 378)
Seiber, J. E. (1980). Defining test anxiety, problems and approaches. In Sarason I. G. (ed.). Test anxiety:
theory, research, and applications (pp. 15-39). Hillsdale, NJ: Erlbaum.
Sharma, S., Pamian, S., & Spielberger, C. D. (1983). A cross cultural study of test anxiety levels in Iranian
and Indian students. Personality and Individual differences 4(1) , 1 17-120.
Sharma, S., & Sud, A. (1990). Examination stress and test anxiety: a cross cultural perspective.
Psychology and Developing Societies 2(2) , 183-201.
Shelton, T. L., & Barkley, R. A. (1994). Critical issues in the assessment of attention deficit disorders in
children. Topics in Language Disorders, 14 , 26-41.
Sheriffs A. C, & Boomer, D. S. (1954). Who is penalized by the penalty for guessing? Journal of
Educational Psychology, 45 , 81-90.
Silver, P. (1995). Typical accommodations requested by college students with learning disabilities.
Unpublished manuscript. Amherst: University of Massachusetts.
162
Silver, P., Bourke, A., & Strehom, K. C. (1998). Universal instructional design in higher education- Anapproach for inclusion. Equity and Excellence in Education, 3 1(2) . 47-51.
Spielberger, C. (1972). Anxiety as an emotional state. In C, D. Spielberger (Ed.), Anxiety: Current trendsin theory and research (Vol. 1, pp. 23-49). New York: Academic Press.
Spielberger, C. D. & Vagg, P. R. (1995). Test anxiety: a transactional process model. In Spielberger, C.D. & Vagg, P. R. (eds.) Test Anxiety: Theory, Assessment, and Treatment (pp. 3-14).Washington, DC: Taylor and Francis.
Strom, B., Hocevar, D., & Zimmer, J. (1987). Preference for course difficulty and test anxiety: an analysisof classroom personality characteristics. Contemporary Educational Psychology 12(2) , 87-94.
Sud, A. (1991). Education level differences on test anxiety within Indian and US cultures. Journal ofPersonality and Clinical Studies, 7(2), 131-136.
Swanson, S., & Howell, C. (1996). Test anxiety in adolescents with learning disabilities and behaviordisorders. Exceptional Children, 62(5), 389-397.
Tobias, S. (1985). Test anxiety: interference, defective skills, and cognitive capacity. Educational
Psychologist, 20(3), 135-142.
Tobias, S., & Hedl, J. J. Jr. (1972). Test anxiety: situationally specific, or general? Florida State
University, Tallahassee. Computer Assisted Instruction Center. (Eric Document Reproduction
Service No. ED 068 853)
Trice, A. D. (1985). An academic locus of control scale for college students. Perceptual and Motor Skills,
6J_1043-1046.
Vogel, L. A. (1994). Explaining performance on P&P versus computer mode of administration for the
verbal section of the Graduate Record Exam. Journal of Educational Computing Research 1 1(4) ,
369-383.
Watts, F. N., & Dalgleish, T. ( 1 991 ). Memory for phobia related words in spider phobics. Cognition and
Emotion, 5(4), 313-329."
Weare, J. (1984). Test anxiety in adults. (Eric Document Reproduction Service No. ED 244 1 16)
Weber, L. J., Mcbee, J. K., & Krebs, J. E. (1983). Take home tests : an experimental study. Research in
Higher Education 18(4) , 473-483.
Wendell, A. S., & Tobias, S. (1983). Anxiety and the retrieval of information from long term memory.
Paper presented at the annual meeting of the Northeastern Educational Research Association
(14th, Ellenville, NY, October 26-28, 1983). (ERIC Document Reproduction Service No. ED 238
913)
Wine, J. D. (1980). Cognitive attentional theory of test anxiety. In I. G. Sarason (ed.). Test anxiety:
theory, research, and applications (pp. 349-385). Hillsdale, NJ: Erlbaum.
Wise, S. L., Plake, B. S., Johnson, P. L., & Roos, L. L. (1992). A comparison of self-adapted and
computerized adaptive tests. Journal of Educational Measurement 29(4) ,329-339.
163
Wise, S. I ... Roos. L. L., Plake. B. S., & Nebelsick-Gullett, L. J. (1993). The role of anxietv in examineeEretorence tor selt-adapted testinu. Paper presented at the annual meetin- of the AmericanEducational Research Association (Atlanta, GA, April 12-16, 109;,). ^Unc DocumentReproduction Service No. ED 358 154)
Wood, J. W.. Miederhoff J. W,, & Ulschmid, B, (1989), Adapting test construction for ma.nstreamedsocial studies students. Social Education 53(1) , 46-49.
Zatz. S.. & Chassin. L. (1985). Cognitions of test anxious children under naturalistic test taking conditions,Journal of Consuhing and Clinical Psychology 53(3) . 393-401.
Zohar, D. (1998). An additive model of test anxiety: Role of exam-specific expectations. Journal ofEducational Psychology, 90(2) , 330-340.
Zoller, IJ., & Ben Chaim, D. (1989). Interaction between examination type, anxiety state, and academicachievement in college science; an action oriented research. Journal of Research in ScienceTeaching 26(1) . 65-77.
164