Embed Size (px)
Citation preview
Test and Measurement Systems

Presentation
• Mattias Ericsson
– LabVIEW developer ~15years
– CLA
– LabVIEW Partner Program • QRM
• www.addq.se/qrm
• G# Framework
• Free, open source tool
• LabVIEW Add-On of the Year for Community 2011
• www.ni.com/labviewtools
• www.addq.se/gsharp
Agenda
• What is a Measurement System Analysis?
• AIAG Gage R&R Study
• Wheeler Honest Gage Study
• Comparision between studies
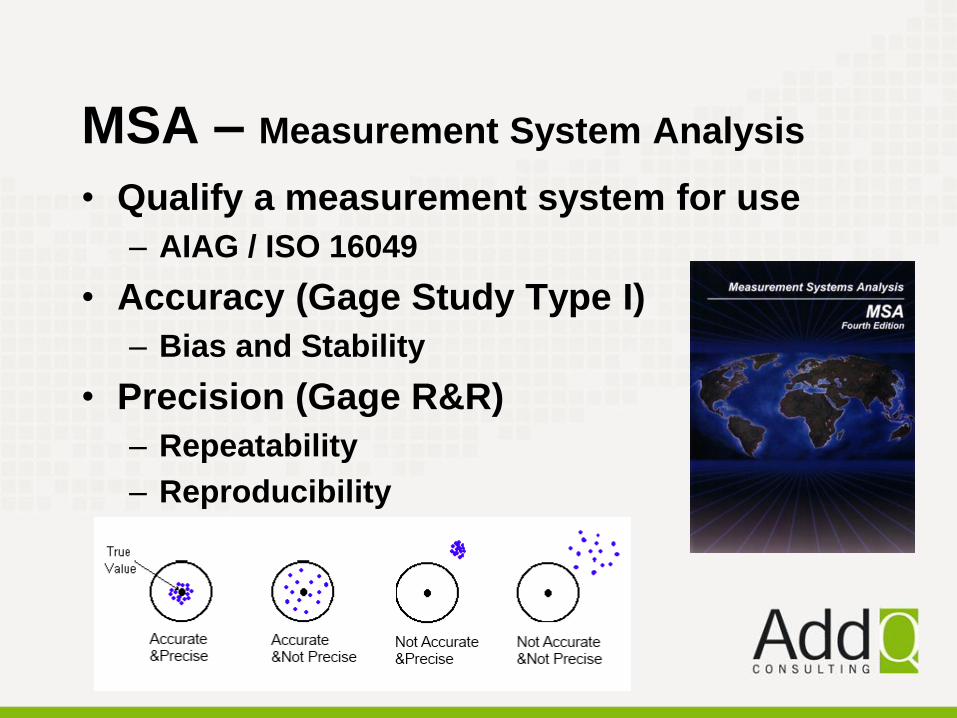
MSA – Measurement System Analysis
• Qualify a measurement system for use
– AIAG / ISO 16049
• Accuracy (Gage Study Type I)
– Bias and Stability
• Precision (Gage R&R)
– Repeatability
– Reproducibility
Gage R&R
• Precision
• Example: 10 UUTs are tested 3 times each
by 3 operators.
• Repeatability – Can an operator repeat the
measurement the same?
• Reproducibility – Is there a difference
between operators?
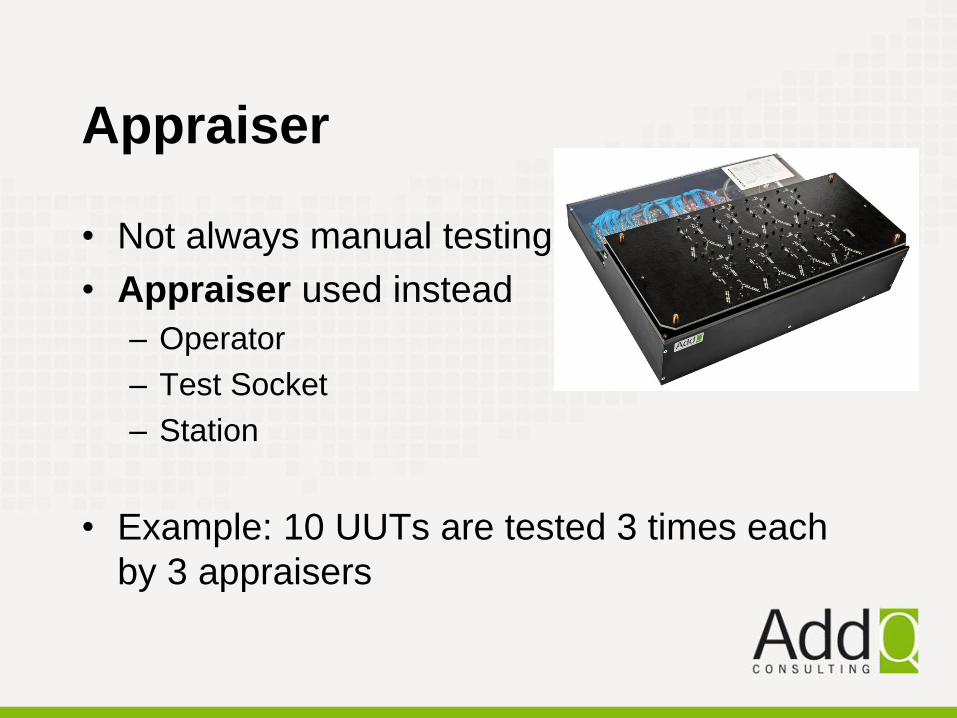
Appraiser
• Not always manual testing
• Appraiser used instead
– Operator
– Test Socket
– Station
• Example: 10 UUTs are tested 3 times each
by 3 appraisers
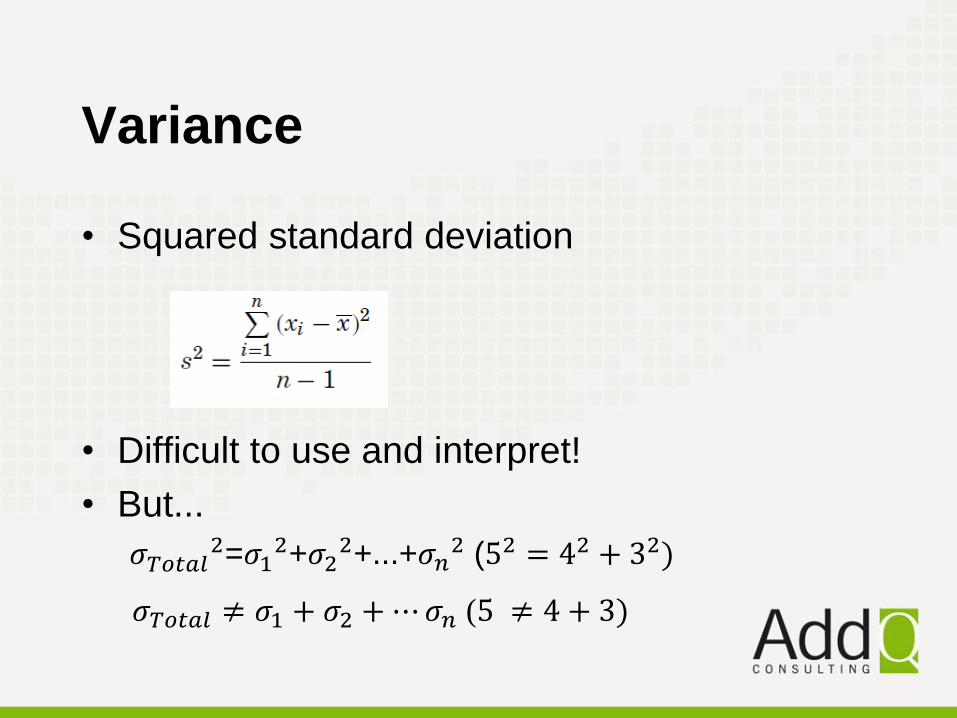
Variance
• Squared standard deviation
• Difficult to use and interpret!
• But...
𝜎𝑇𝑜𝑡𝑎𝑙2=𝜎1
2+𝜎22+...+𝜎𝑛
2 (52 = 42 + 32)
𝜎𝑇𝑜𝑡𝑎𝑙 ≠ 𝜎1 + 𝜎2 + ⋯ 𝜎𝑛 (5 ≠ 4 + 3)
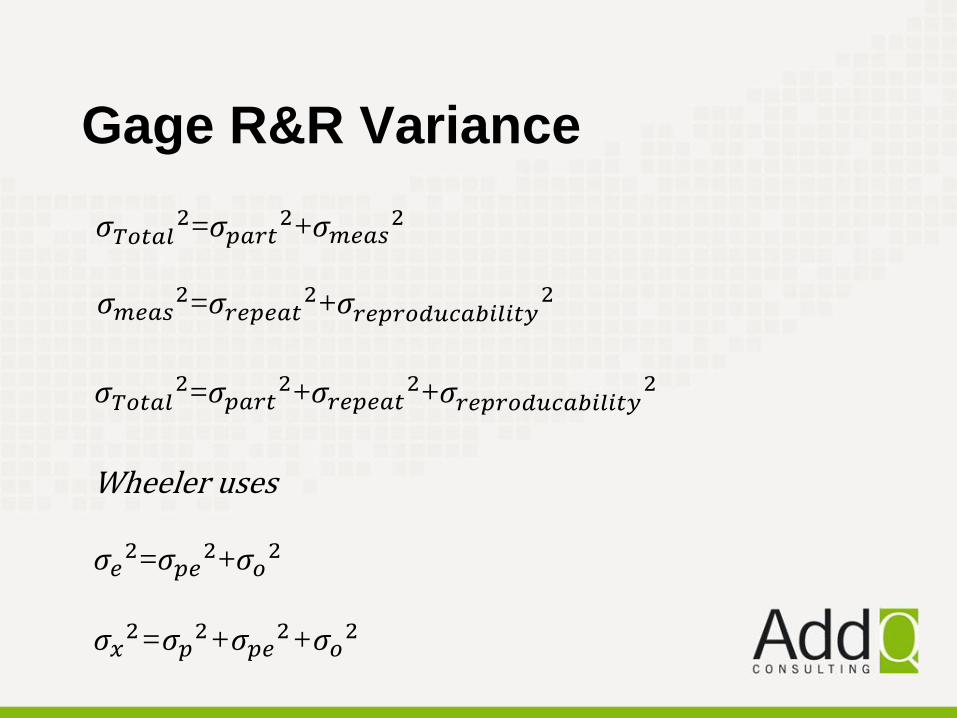
Gage R&R Variance
𝜎𝑇𝑜𝑡𝑎𝑙2=𝜎𝑝𝑎𝑟𝑡
2+𝜎𝑚𝑒𝑎𝑠2
𝜎𝑚𝑒𝑎𝑠2=𝜎𝑟𝑒𝑝𝑒𝑎𝑡
2+𝜎𝑟𝑒𝑝𝑟𝑜𝑑𝑢𝑐𝑎𝑏𝑖𝑙𝑖𝑡𝑦2
𝜎𝑇𝑜𝑡𝑎𝑙2=𝜎𝑝𝑎𝑟𝑡
2+𝜎𝑟𝑒𝑝𝑒𝑎𝑡2+𝜎𝑟𝑒𝑝𝑟𝑜𝑑𝑢𝑐𝑎𝑏𝑖𝑙𝑖𝑡𝑦
2
Wheeler uses 𝜎𝑒
2=𝜎𝑝𝑒2+𝜎𝑜
2 𝜎𝑥
2=𝜎𝑝2+𝜎𝑝𝑒
2+𝜎𝑜2
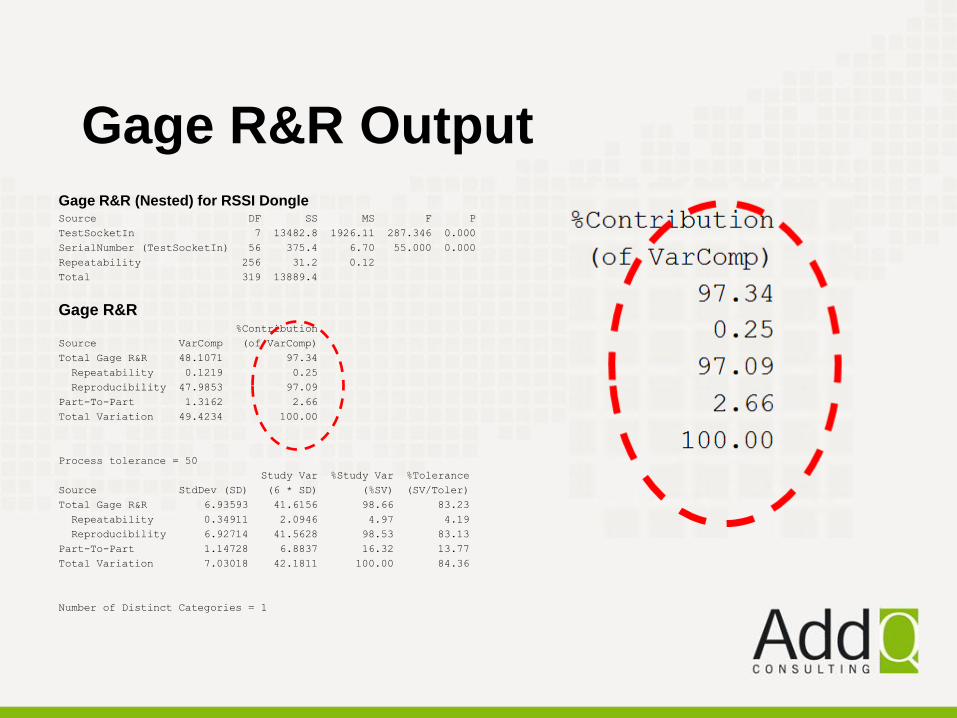
Gage R&R Output Gage R&R (Nested) for RSSI Dongle Source DF SS MS F P
TestSocketIn 7 13482.8 1926.11 287.346 0.000
SerialNumber (TestSocketIn) 56 375.4 6.70 55.000 0.000
Repeatability 256 31.2 0.12
Total 319 13889.4
Gage R&R %Contribution
Source VarComp (of VarComp)
Total Gage R&R 48.1071 97.34
Repeatability 0.1219 0.25
Reproducibility 47.9853 97.09
Part-To-Part 1.3162 2.66
Total Variation 49.4234 100.00
Process tolerance = 50
Study Var %Study Var %Tolerance
Source StdDev (SD) (6 * SD) (%SV) (SV/Toler)
Total Gage R&R 6.93593 41.6156 98.66 83.23
Repeatability 0.34911 2.0946 4.97 4.19
Reproducibility 6.92714 41.5628 98.53 83.13
Part-To-Part 1.14728 6.8837 16.32 13.77
Total Variation 7.03018 42.1811 100.00 84.36
Number of Distinct Categories = 1
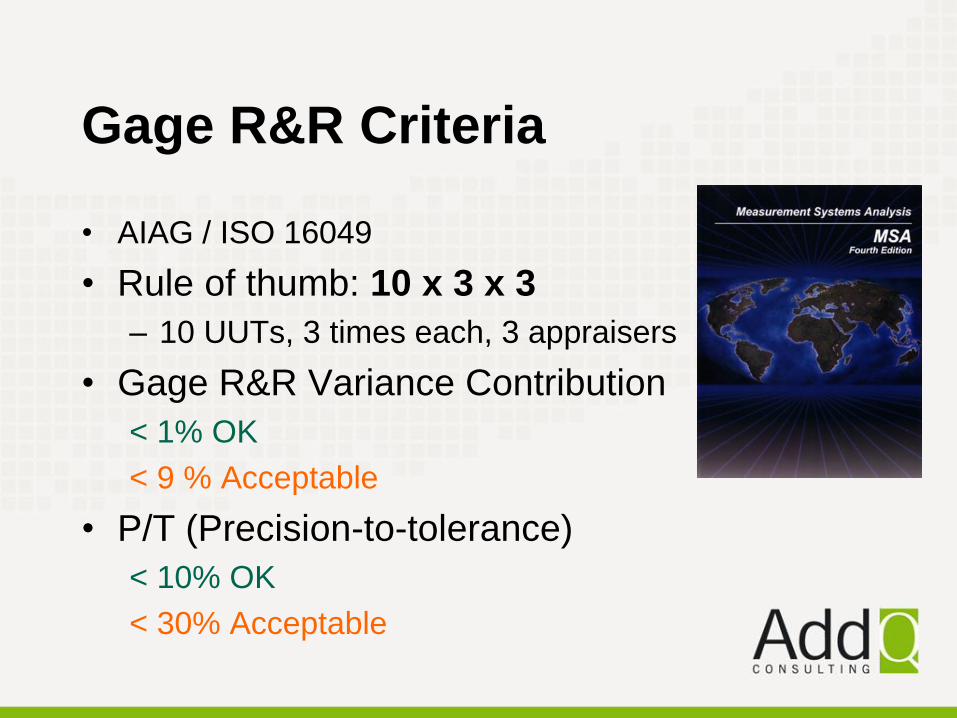
Gage R&R Criteria
• AIAG / ISO 16049
• Rule of thumb: 10 x 3 x 3
– 10 UUTs, 3 times each, 3 appraisers
• Gage R&R Variance Contribution
< 1% OK
< 9 % Acceptable
• P/T (Precision-to-tolerance)
< 10% OK
< 30% Acceptable
• StudyVar / Total StudyVar percentage
Ratio of standard deviations!
Sum >100%
• Number of Distinct Categories
– Very hard in practice to intepret
• Criteria very hard to fulfill!
𝜎𝑇𝑜𝑡𝑎𝑙2 < 1% OK (𝜎𝑇𝑜𝑡𝑎𝑙<10%)
𝜎𝑇𝑜𝑡𝑎𝑙2< 10% Acceptable (𝜎𝑇𝑜𝑡𝑎𝑙<30%)
Semiconductor batch variation
AIAG Gage R&R Problems
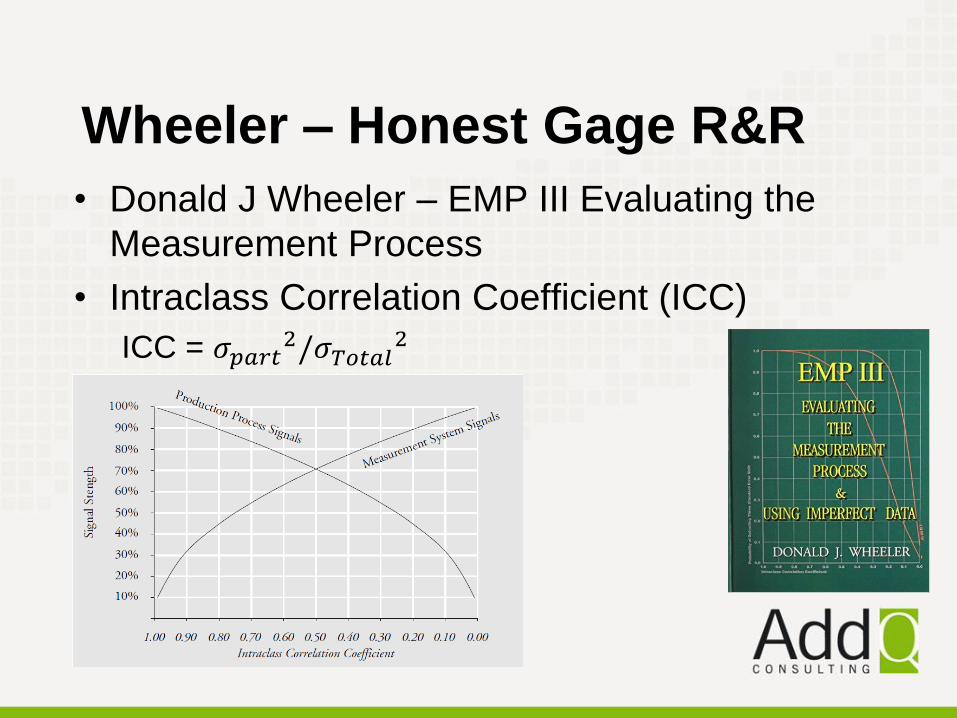
Wheeler – Honest Gage R&R
• Donald J Wheeler – EMP III Evaluating the
Measurement Process
• Intraclass Correlation Coefficient (ICC)
ICC = 𝜎𝑝𝑎𝑟𝑡2/𝜎𝑇𝑜𝑡𝑎𝑙
2
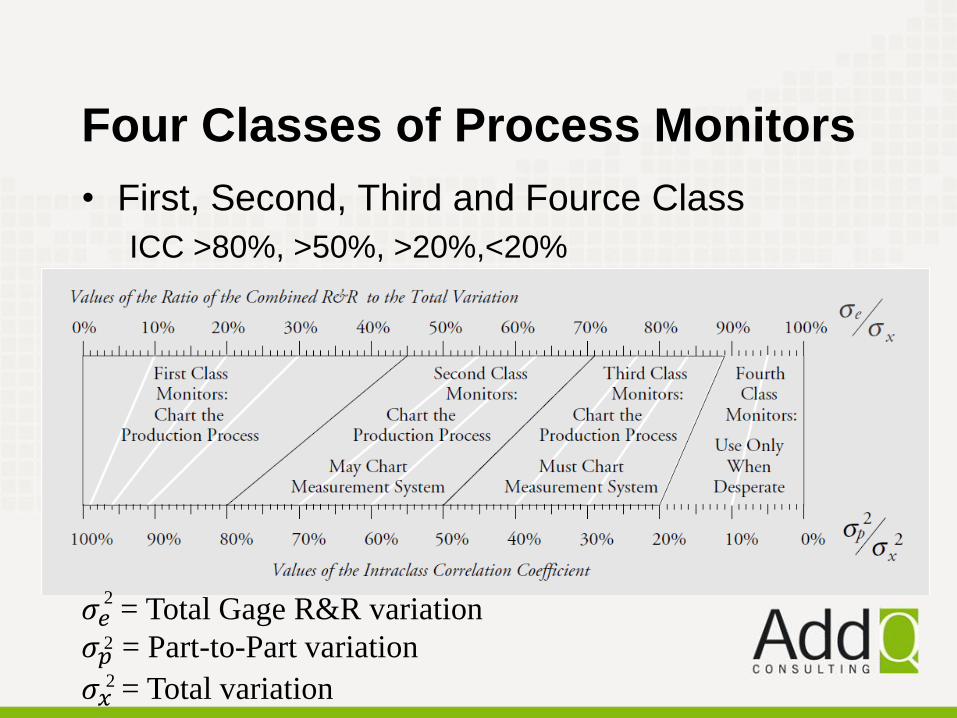
Four Classes of Process Monitors
• First, Second, Third and Fource Class
ICC >80%, >50%, >20%,<20%
𝜎𝑒 = Total Gage R&R variation
𝜎𝑝 = Part-to-Part variation
𝜎𝑥 = Total variation
2
2
2
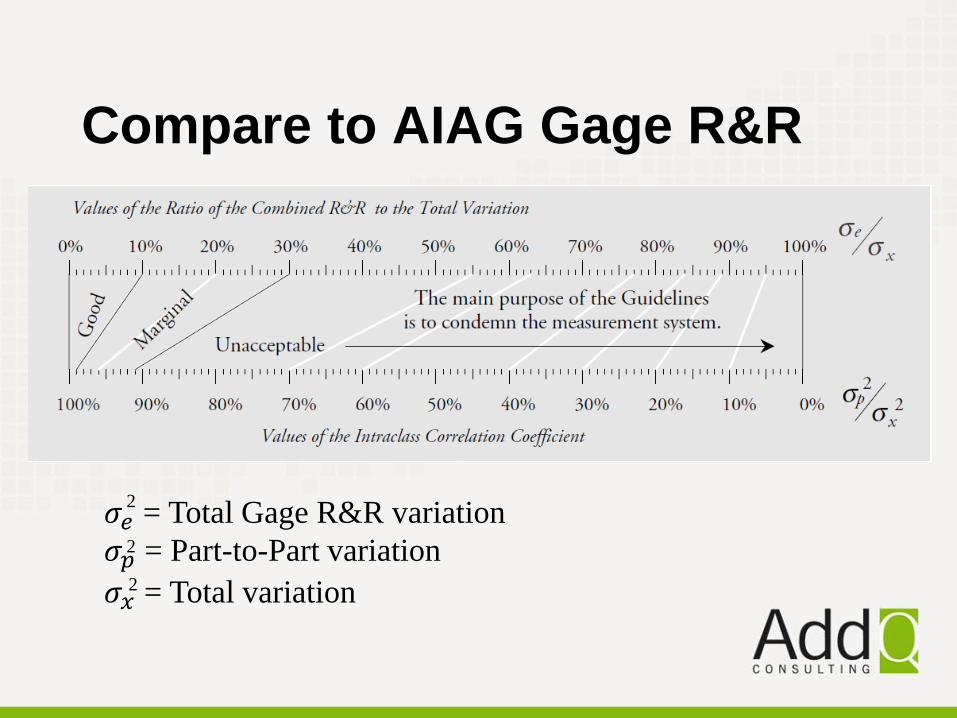
Compare to AIAG Gage R&R
𝜎𝑒 = Total Gage R&R variation
𝜎𝑝 = Part-to-Part variation
𝜎𝑥 = Total variation
2
2
2

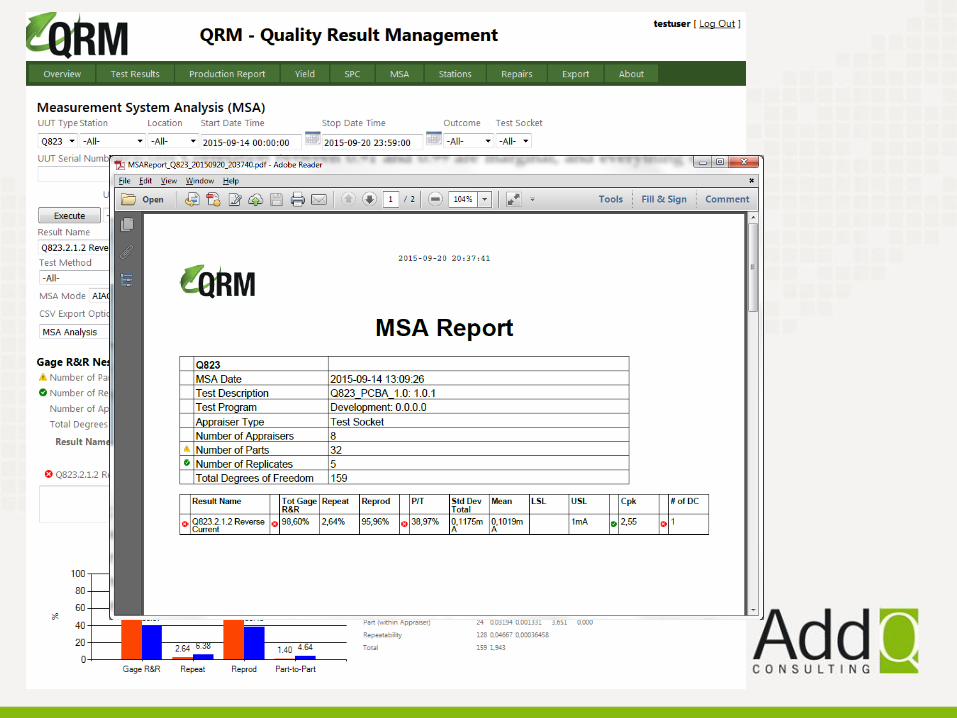
QRM – Quality Result Management
Improved yield, quality and better decision making!
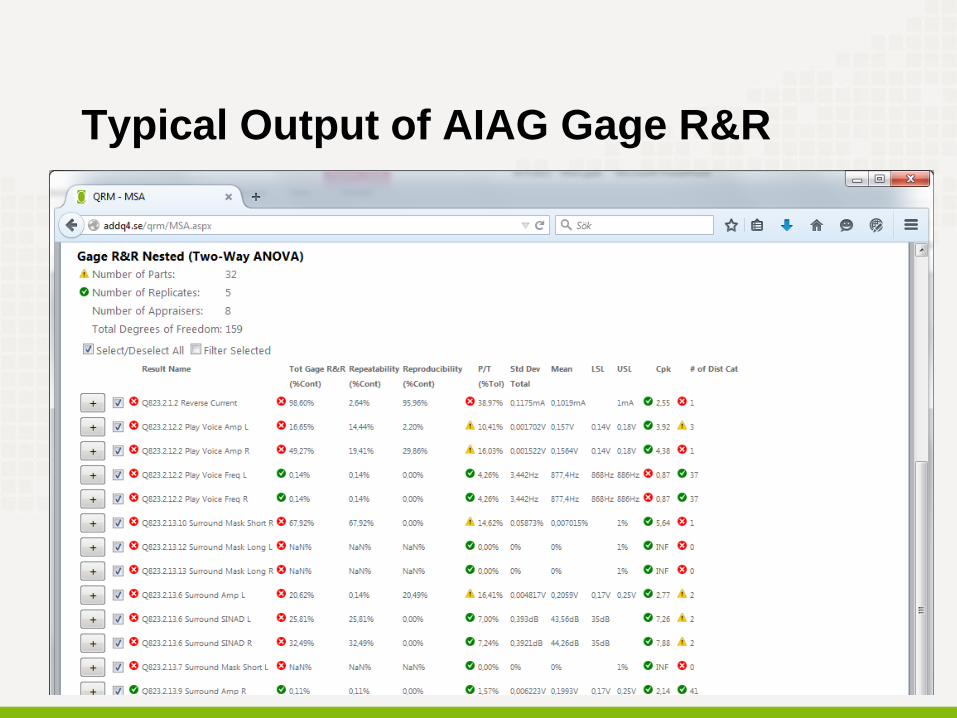
Typical Output of AIAG Gage R&R
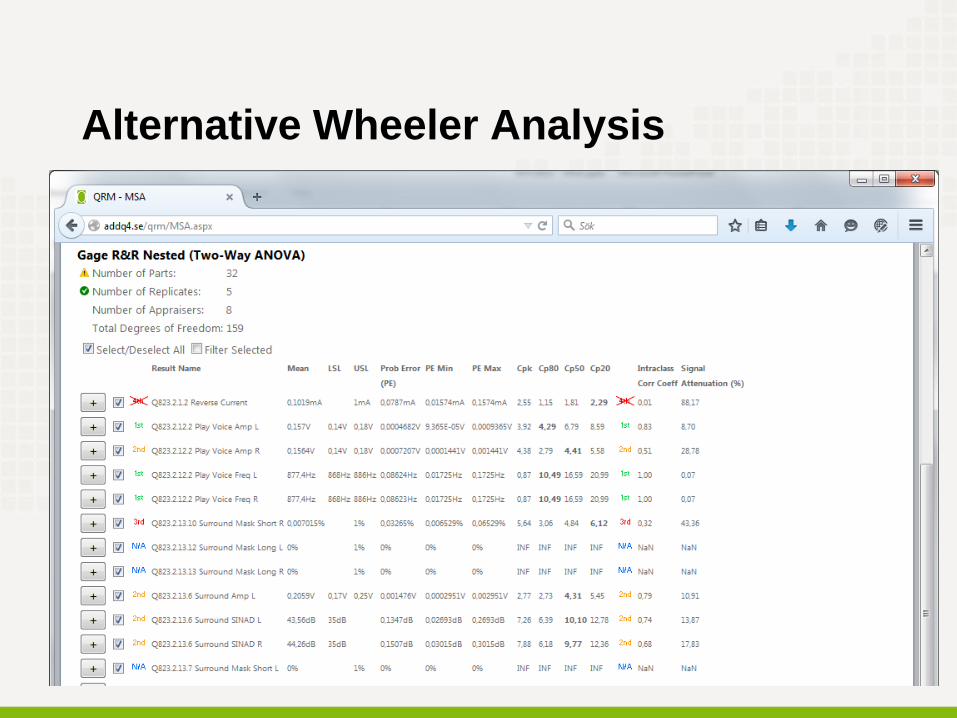
Alternative Wheeler Analysis
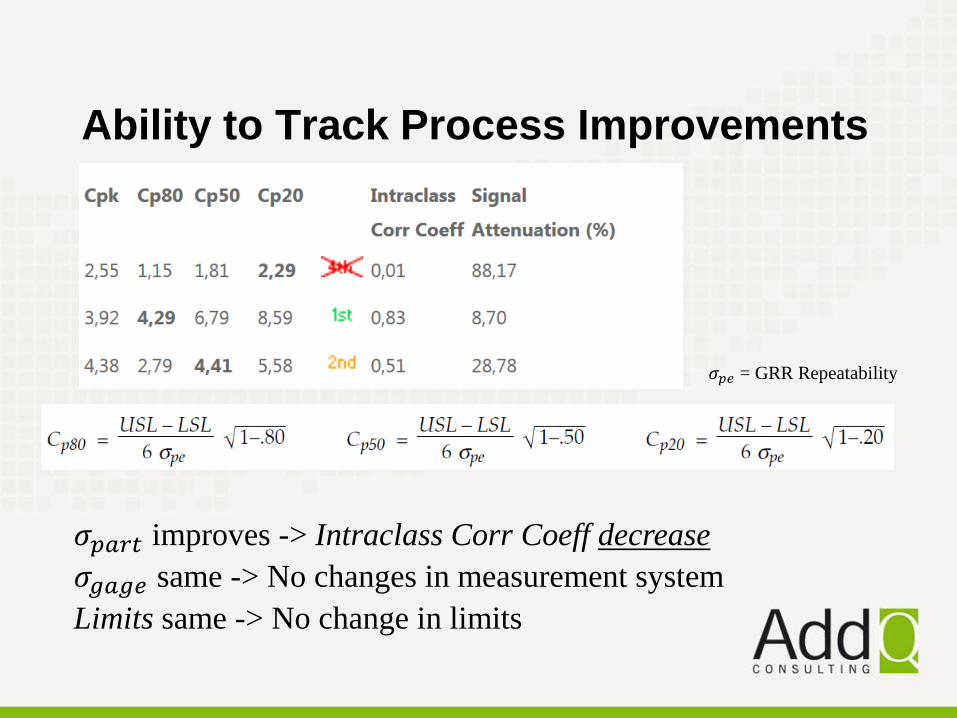
Ability to Track Process Improvements
𝜎𝑝𝑎𝑟𝑡 improves -> Intraclass Corr Coeff decrease
𝜎𝑔𝑎𝑔𝑒 same -> No changes in measurement system
Limits same -> No change in limits
𝜎𝑝𝑒 = GRR Repeatability
Conclusion
• AIAG Criteria very hard to fulfill
• Wheeler Analysis is a powerful alternative
– Focus on measured signal
– Four monitor classes
– Tracks improvement
• Lack of tool support!
– QRM
• AIAG is widely used
References Books
AIAG Manual Measurement System Analysis
Bass, Issa: Six Sigma Statistics with Excel and Minitab.
Wheeler, Donald J: Evaluating the Measurement Process EMP III
Articles
Wheeler, Donald J: An Honest Gauge R&R Study
(http://spcpress.com/pdf/DJW189.pdf)
Other
Minitab Knowledge base
Course
Mätsystemanalys Gage R&R, Sandholm
(http://sandholm.se/Utbildning/Matsystemanalys_gage.asp)