Embed Size (px)
Citation preview

D O C U M E N T O D E T R A B A J O
Instituto de EconomíaTESIS d
e MA
GÍSTER
I N S T I T U T O D E E C O N O M Í A
w w w . e c o n o m i a . p u c . c l
���� ��(�����( �� �������� �� � � ������� ���=��� �� �5��� �������������
��#� ������� ������ ��%�����
����

TESIS DE GRADO
MAGISTER EN ECONOMIA
Diciembre 2008

PONTIFICIA UNIVERSIDAD CATOLICA DE CHILE I N S T I T U T O D E E C O N O M I A MAGISTER EN ECONOMIA
Cost Asymmetry and Information in a Cournot market: an Experimental
Research
Ignacia Mercadal
Comisión
Rodrigo Harrison
Wieland Müller
Diciembre 2008

Cost Asymmetry and Information in a Cournot
market: an Experimental Research
Ignacia Mercadal
August 2008
Abstract
This paper studies how costs’ asymmetry, the number of players and feedback
on last period’s individual quantities affect the competitiveness of the market in
a Cournot game repeated during 10 periods. Analysis is done using data from
experiments run by Dr. Professor Wieland Mller and Professor Dr. Jan Potters.
Results show that information has a positive effect on produced quantities and that
this effect is higher in asymmetric markets, but it is not clear how information affects
individuals’ behavior and leads to more competition. In asymmetric markets the
most efficient firms produce a larger portion of the total output, as Cournot predicts.
Asymmetry does not produce significant deviations from the Cournot output. The
number of players increases production, but it does not seem to produce deviations
from the static Nash equilibrium.
Contents
1 Introduction 3
2 Theoretical framework 5
2.1 Number of players and cost asymmetry . . . . . . . . . . . . . . . . . . . . 5
2.2 Information . . . . . . . . . . . . . . . . . . . . . . . . . . . . . . . . . . . 6
3 Empirical literature review 8
3.1 Number of players . . . . . . . . . . . . . . . . . . . . . . . . . . . . . . . 9
3.2 Cost asymmetry . . . . . . . . . . . . . . . . . . . . . . . . . . . . . . . . . 10
3.3 Information . . . . . . . . . . . . . . . . . . . . . . . . . . . . . . . . . . . 11
4 Data and experiment description 16
5 Econometric analysis and results 25
5.1 Aggregate Quantities Analysis . . . . . . . . . . . . . . . . . . . . . . . . . 25
5.2 Individual quantities analysis . . . . . . . . . . . . . . . . . . . . . . . . . 29
Dynamic Analysis . . . . . . . . . . . . . . . . . . . . . . . . . . . . . . . . 32
6 Conclusion 35
Appendix A: Derivation of the Cournot equilibrium 37
Appendix B: Instructions 39
References 41

1 Introduction
Nowadays, economic policy is focused more on providing the conditions required to reach
an efficient result, leaving the market working on its own, than on intervening directly on
markets’ outcome. In order to do this, it is crucial to know how different factors affect
a market’s competitiveness. Either when antitrust authorities have to decide whether an
acussation holds or not, or when regulative agents have to set the conditions under which a
regulated market will work, knowledge of the relevant factors is needed to reach an efficient
result. This paper studies how the number of players, cost asymmetry and information
about competitors’ past quantities interact between them and affect the market’s outcome.
Experimental data is used because it allows to isolate the effect of the variables under study
and, thus, to draw general conclusions.
The effect of information is not theoretically clear and it seems to depend on its interaction
with other characteristics of the market structure and on the kind of information that
agents have. On the one hand, it can facilitate collusion because it allows firms to monitor
their partners and therefore, as the cost of breaking the agreement raises, it makes collusion
more sustainable (Stigler, 1976). On the other hand, feedback on individual profits allows
players to follow the ‘imitate the best’ dynamic, which consist in mimicking the firm with
the highest profits. As usually this is the firm with the largest quantity, the dynamic
converges to the Walrasian equilibrium, provided that individuals experiment or mutate
(Vega Redondo, 1997). Theoretically, then, information can lead both to collusion or to
the competitive outcome.
Empirical evidence about information is mixed as well. Experimental studies provide
different informational treatments expecting that players will follow a certain dynamic if
they have the informational requirements to do it. If they have their competitors’ past
quantities and profits, they will follow “imitate the best”; if they only know aggregate
past quantities they will play according to the best reply dynamic; and if they have less
information than that they will follow a different dynamic, which usually converges to
collusion. Although to a certain degree players behave as expected , they also follow
different dynamics and do not always converge to the expected equilibrium. Behavior
seems to depend on market conditions other than information and this is what needs to
3

be studied.
In this paper information is found to have a significant positive effect on firms’ output,
which is higher than Cournot’s prediction. Nevertheless, regressions show that they are
not following the ‘imitate the best’ dynamic and, thus, it is not known how information
is improving market’s competitiveness. The experiment length is too short to investigate
further on individuals’ dynamic behavior. Even though asymmetry does not have an effect
on deviations from the Nash equilibrium, information’s effect is greater in asymmetric
markets, showing that interaction is important even with variables that are not individually
significant.
Cournot’s model predicts that competition increases when the number of players does it,
but there is no argument by which quantities should be higher than Cournot’s prediction
when there are more players in the market. This paper shows that theoretical predictions
are correct and markets stay close to the Nash equilibrium in this short-run setting, in
spite of the fact that costs are private information.
The remain of this paper is organized in five sections. The second section describes the
theoretical prediction for the effect of the treatment variables on competition and the third
one shows the empirical findings from previous experiments studying the same variables.
The fourth section provides a description of the data and the experimental setting. In the
fifth section, the empirical models and the results are presented. Finally, the conclusion
is in the last section.
4

2 Theoretical framework
2.1 Number of players and cost asymmetry
Cournot’s prediction for cost asymmetries and the number of players is obtained solving
the well-known Cournot model with N firms and asymmetric costs (formal derivation
is in appendix A). Under Cournot competition firms choose their quantity and the
market-clearing price is determined by the demand. In the present case there is a single
homogeneous good and consumers do not behave strategically.
Demand is given by:
P = 140 −Q (1)
and firms have costs equal to:
C = ciqi (2)
where ci can differ between firms to allow for cost asymmetry. Costs are private: firms
only know their own cost.
Equilibrium is reached when firms play their best reply to their opponents’ strategy.
Cournot’s equilibrium output is higher than monopoly’s but lower than Walrasian
equilibrium’s output. This is the solution for the static game. Even though it is known
that in a repeated game the static equilibrium is not the only reachable one, there is no
theoretical reason to assume that cost asymmetries or the number of players may affect the
dynamic equilibrium. Consequently, dynamic issues will be discussed in the next section.
Equilibrium is given by:
qi =140 +
∑ci
1 + n− ci (3)
Q =140n− ∑
ci1 + n
(4)
5
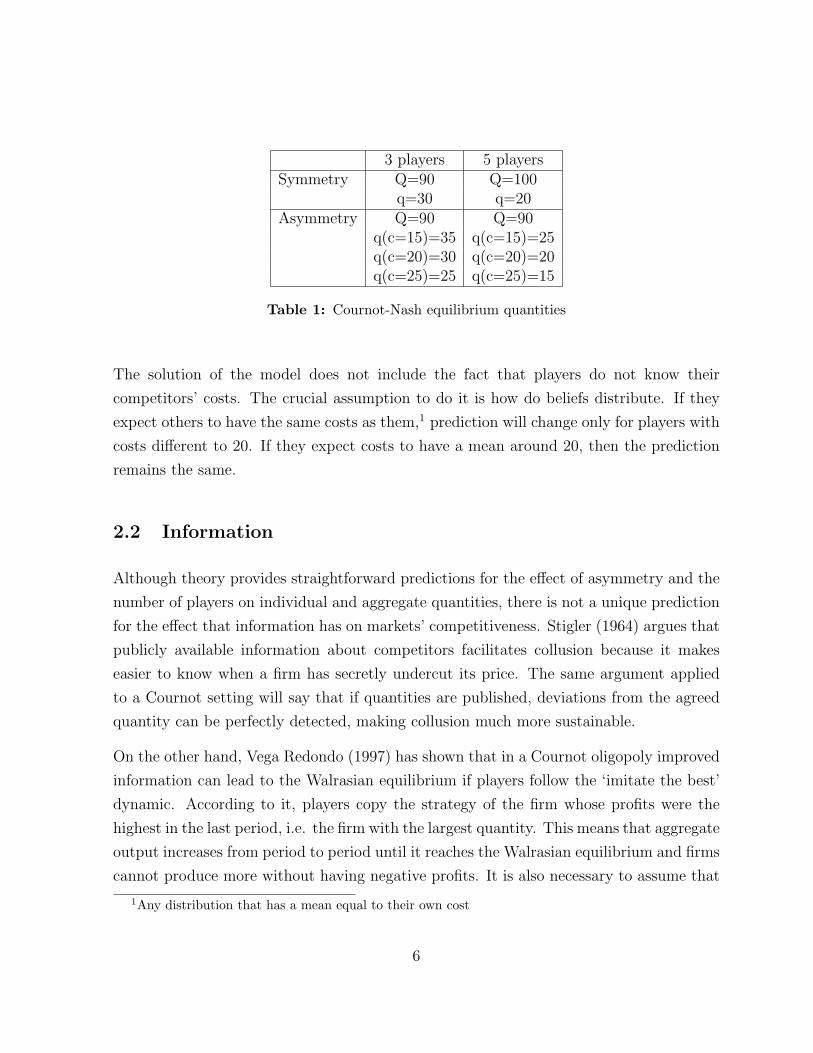
3 players 5 playersSymmetry Q=90 Q=100
q=30 q=20Asymmetry Q=90 Q=90
q(c=15)=35 q(c=15)=25q(c=20)=30 q(c=20)=20q(c=25)=25 q(c=25)=15
Table 1: Cournot-Nash equilibrium quantities
The solution of the model does not include the fact that players do not know their
competitors’ costs. The crucial assumption to do it is how do beliefs distribute. If they
expect others to have the same costs as them,1 prediction will change only for players with
costs different to 20. If they expect costs to have a mean around 20, then the prediction
remains the same.
2.2 Information
Although theory provides straightforward predictions for the effect of asymmetry and the
number of players on individual and aggregate quantities, there is not a unique prediction
for the effect that information has on markets’ competitiveness. Stigler (1964) argues that
publicly available information about competitors facilitates collusion because it makes
easier to know when a firm has secretly undercut its price. The same argument applied
to a Cournot setting will say that if quantities are published, deviations from the agreed
quantity can be perfectly detected, making collusion much more sustainable.
On the other hand, Vega Redondo (1997) has shown that in a Cournot oligopoly improved
information can lead to the Walrasian equilibrium if players follow the ‘imitate the best’
dynamic. According to it, players copy the strategy of the firm whose profits were the
highest in the last period, i.e. the firm with the largest quantity. This means that aggregate
output increases from period to period until it reaches the Walrasian equilibrium and firms
cannot produce more without having negative profits. It is also necessary to assume that
1Any distribution that has a mean equal to their own cost
6

players experiment or mutate with some positive probability in order to avoid the problem
of getting stuck in a suboptimal quantity.2 This may happen if the firm with the highest
profit is producing less than the Walrasian equilibrium’s output. If players follow the
imitation dynamic, no firm will increase its production over the largest one, and thus the
market will converge to an output that is smaller than the competitive one. This will not
happen if mutation is included because one of the players will then change its strategy,
increasing its production, and the market will converge to the Walrasian equilibrium. It is
important to remark that Vega-Redondo’s results were obtained for a symmetric market.
Huck et al. (1999) show that different dynamics can make a Cournot oligopoly converge
to different outcomes: Walrasian, Cournot-Nash or collusion. They propose that each
dynamic has different informational requirements and, thus, which dynamic is followed
depends on the kind of information that players have. They present three different
dynamics that converge to the competitive, Cournot and collusive outcome respectively.
The first one is the myopic best reply, according to which firms play their best reply to
other firms’ quantities in the last period. In order to do this, they need to know demand
and cost functions, their opponents’ aggregate quantity in the last period and how to
calculate their best reply. As it is known, best reply dynamic converges to the Cournot-
Nash equilibrium and authors show that if there is inertia it converges even with more than
3 firms. The second dynamic is the ‘imitate the best’ dynamic suggested by Vega Redondo
(1997), which only needs knowledge about last period’s individual quantities and profits.
Imitation will converge to the Walrasian equilibrium in the long run as the probability
of mutation, experimentation or mistake goes to zero. The third is called ’trial and error
learning’ by Huck et al.(1999) and according to it players do not repeat a mistake. This
means that if profits decrease after an increase in quantity, players will not increase it
the next period, and if profits increase after a decrease in quantity, they will not decrease
it the next period. Trial and error learning dynamic converges to the collusive outcome
(Huck et al., 2004b) and has no informational requirements.
2The variation needed to guarantee convergence can be explained in three ways: mutation,experimentation and mistake. The term mutation comes from the genetic language and refers to a geneticchange. For example, in this context it may mean that the owner of the firm changes because the father isreplaced by his son, who has different ideas about management. Experimentation means that with someprobability players deviate from the dynamic that they are following and choose a different quantity, justto try. Finally, firms not always have perfect control over their output and sometimes may produce aquantity that differs from what was intended to produce.
7

Offerman et al.(2002) present a different dynamic that converges to the collusive outcome
as well. It is called ’follow the exemplary firm’. According to it, players imitate the firm
whose quantity will lead them to the highest profits if it is produced by all the firms;
this firm is usually the one with the lowest output. They show that firms following this
dynamic end up in the collusive equilibrium. The exemplary firm may follow different
behavioral rules, but empirically the best fit is achieved when it chooses a quantity that
equals the average between its own past quantity and the quantity produced in the last
period by the other exemplary firm.
Theory provides a clear prediction for the effect that the number of players and cost
asymmetry has on individual and aggregate output. Nonetheless, information’s effect
still has to be found out. Although different dynamics have different informational
requierements, it is not clear whether changing agents’ information will induce them to
follow the dynamic associated with that informational level. Causality has to be stated
empirically because there is not a theoretical prediction for the dynamic that players will
follow when they have enough information to follow more than one. As different dynamics
converge to different outcomes, it is crucial to know what induces agents to follow a specific
dynamic. In the next section, it will be shown that information indeed has a role on how
agents behave dynamically, but their behaviour additionally seems to rely on other market
conditions and it is still not clear on which.
3 Empirical literature review
Many experiments have been done on oligopolies, studying the effect of quantity vs.
price competition, homogeneous vs. heterogeneous goods, partner vs. stranger design,
simultaneous vs. sequential interaction, etc. (see Engel (2007) for a complete survey of
oligopoly experiments). However here we will focus on what is relevant for this experiment
and we will only review literature concerning the number of players, cost asymmetry and
information.
8

3.1 Number of players
As the theoretical effect is clear, there are not many studies about the effect of the number
of players on the competitiveness of the market. Engel (2007) performs a meta-analysis
on oligopoly behaviour using data from all oligopoly experiments made before, intending
to find what we do know about the effect of different variables on Cournot’s outcome. He
runs one linear regression on the deviation from the Nash equilibrium and another on the
deviation from the Walrasian equilibrium. The effect of market size is highly significant for
deviations from the Walrasian equilibrium and not significant for deviations from the Nash
equilibrium, supporting the theoretical prediction. However, when studying the effect of
each number of competitors, results are puzzling and do not follow a pattern.
As Engels results show, although it is theoretically clear that more players increase total
quantity, it is not obvious how many players are needed to make collusion impossible or
to reach the competitive outcome. Selten (1973) stated theoretically that “four are few
and six are many”, but Huck et al. (2004) showed empirically that “two are few and four
are many”. Huck et al. first make a meta-analysis using results from previous studies and
conclude that collusion can occur sometimes in duopolies, but it is very rare in markets
with more than two firms. They confirm this conclusion with their own experiment, finding
that Cournot prediction is accurate for triopolies and that in markets with four or more
players aggregate quantities are around the Cournot equilibrium or larger, sometimes
getting close to the Walrasian equilibrium. Their experiment was 25 periods long and
the length was commonly known by players before the beginning of the game. As it is
hardly possible for firms to collude in markets with 3 or 5 firms, the relevant question
in this paper is whether quantities are closer to the Cournot-Nash equilibrium or to the
Walrasian equilibrium. Then, the effect of the number of players on aggregate quantity is
expected to be positive or not significant.
9
3.2 Cost asymmetry
Although some experiments on the effect of cost asymmetry have been done, all of them
have used a long time horizon and an unknown number of periods. That is closer to a
dynamic setting than the present experiment, with only 10 periods.
Mason et al. (1992) analyse asymmetric duopolies in an indefinite horizon setting with at
least 30 periods. They focus on aggregate quantities and find that asymmetric markets
are significantly less cooperative than symmetric duopolies. This is not due to difficulties
in making agreements because they seem to have all the information they need to collude:
payoffs were common knowledge and they knew their opponent’s output. It seems that it
is harder to collude in an asymmetric setting even if firms have the information they need
to do it. This result may not hold in an experiment with more players in which collusion
rarely occurs; consequently, it should be studied whether asymmetry fosters competition
or just decreases incentives to collude. They also find that asymmetric markets take longer
to reach an equilibrium than symmetric ones, which means that in shorter experiments
asymmetric markets may not converge.
Mason and Phillips (1997) add two different informational treatments to the experimental
study of cost asymmetries in duopolies: either they know their opponent’s payoff after each
period or they only know their own payoffs. They found that differences in information
have no effect on asymmetric markets output, while in symmetric markets total output is
lower when firms do not have information about their rivals’ payoffs. In asymmetric
markets with full information the low-cost firm produces a relatively larger share of
the product, which would mean that information increases efficiency by lowering costs.
Nonetheless, as they use individual or aggregate quantity as dependent variable and not
deviations from the Cournot equilibrium, the expected result is to have the most efficient
firm always producing more, as Cournot equilibrium predicts. The interesting point would
be to know whether low cost firms produce relatively more than Cournot’s prediction when
they have information about their competitors. The length of the experiment was not
known and the shortest session was 35 periods long. Costs were private information, as
in the present experiment, so they were not able to compute their competitors’ profits in
asymmetric markets.
10

Engel’s (2007) meta-analysis of Cournot experiments shows mixed evidence concerning the
effect of asymmetry. It seems that there are not significant deviations from the Walrasian
equilibrium, but there are with respect to the Nash equilibrium, supporting anti-trust
authorities idea that symmetry favours collusion. However, this result is not robust to the
use of different indicators to measure deviations. Concerning interaction effects with the
number of players, asymmetry appears to increase collusion in market of 2 or 3 players
and to decrease it for larger markets, although this may be a sample size effect. The
experimental setting is crucial in experimental studies and therefore Engel’s results maybe
not accurate because he uses data from experiments with different conditions in the same
regression.
The effect of cost asymmetries has been studied only in duopolies, so it is interesting to
know if conclusions drawn in these studies extend to larger markets and if results hold
when there are fewer periods and players know for how long they are going to play.
3.3 Information
Huck et al.(1999) show that different learning behaviors converge to different outcomes
and state that players will follow a specific dynamic depending on the information they
have. They test this hypothesis experimentally and show that an agent’s learning behavior
depends on his information. They work with a 40 periods long experiment and this was
common knowledge. In order to guarantee convergence, inertia is included: each period
players were able to revise their quantity with probability 2/3, otherwise they produced
the same that in the last period. They have 5 informational treatments that vary according
to the level of information that players had about others or about the market (demand
and cost functions). They do not find collusion in any treatment, as it is expected in a
market with four firms.
In the first treatment, players had all the relevant information about the market structure
and a profit calculator that allowed them both to compute and maximize profits; in the
second one they additionally knew last period’s individual quantities and profits. Only
players in these first two treatments had enough information to play myopic best replies,
i.e. they knew demand and cost functions, last period’s output for the remaining players
11

and how to calculate their best reply. In the third treatment, they only knew that they
were interacting with three other players, their decisions were represented by quantities
and they were informed about their own profits after each period; players in the fourth
treatment had no information about the market structure, but they had feedback on
their competitors’ quantities and profits. Finally, the last treatment was like the fourth
but players were additionally told that inverse demand is non-stochastic and downward
sloping. Treatments in the present experiment do not match exactly with any of the
treatments used by Huck et al. (1999). In the first treatment in this experiment, players
know market structure and aggregate past quantities, which coincides with the second
treatment in Huck et al.(1999); the second one has not an equivalent in their paper because
players know individual output in the last period, but they do not know profits and cannot
compute them because costs are private information.
They find that if players have enough information to play the best reply dynamic, most of
them do it. But if they know their opponents’ quantities and profits in the last period, they
follow the imitate the best dynamic even if they are able to play best reply3. Although
trial and error learning could be followed in any treatment and its predictions are correct
in 80% of the cases, it is supposed to converge to the collusive outcome and quantities
converged to Nash quantities or higher. The theoretical prediction holds only if everyone
plays trial and error, hence it is possible to end up in a different outcome if some players
deviate. Nonetheless, this result decreases this dynamic’s robustness. It has been shown
that collusion does not occur in markets with more than 3 firms, which may explain why
even though this dynamic converges to the collusive equilibrium players do not follow it.
Huck et al.(1999) show that information about the market structure decreases its
competitiveness, while information about competitors’ behavior and profits increase it.
Treatments in which players knew individual output in the last period and did not have a
profit calculator were the most competitive, but when they did not know that the demand
is downward sloping aggregate quantities were even larger than the Walrasian equilibrium,
leading some firms to have loses in most of the periods. When they did have information
about the demand, quantities were almost equal to the Walrasian quantity, showing that
at least some knowledge about demand is required. There was only one treatment in which
3Quantities are larger when they do not have enough information to play best reply, though.
12
players had enough information to play both best reply and imitate the best, therefore
other treatments have to be compared with this benchmark. Treatments that are not
nested are not comparable because players had different information and not more or less.
In the full information treatment, best reply accounted for 26% of players behavior while
imitate the best did it for less than 10%. This shows that when they can choose between
dynamics they play both, although more firms play their best reply and only some of
them choose to imitate the best. When they were not able to play best reply, imitate the
best explained 40% of firms behavior: and when they did could not imitate, the best reply
accounted for 37% of it. This shows that available information does influence the behavior
rule that players follow.
Offerman et al.(2002) use three different informational treatments to test whether different
dynamics converge to different outcomes in a symmetric Cournot triopoly with an
homogeneous good. The experiment lasted for 100 periods and participants were aware
of this. Treatments only differ in how much feedback information players have , they do
not include differences in ex-ante information like Huck et al. (1999). Inertia is included
to guarantee convergence. The difference with the former paper is that they do not use
’trial and error learning’ as the dynamic converging to the collusive outcome, but ’follow
the exemplary firm’. As explained before, under this dynamic players imitate the quantity
that, if produced by all firms, leads them to the highest profits. Informational treatments
are related to the dynamic that they are expected to trigger. Then, players who know only
aggregate quantities are expected to follow the best reply dynamic, those who additionally
receive feedback about individual quantities and profits are expected to imitate the best,
and players that know last period’s individual quantities but not profits should follow the
exemplary firm. Treatments are nested in the sense that in the one with more information
players know all what the less informed know. Therefore, everyone is able to play best
reply and all players with feedback on individual quantities are able to follow the exemplary
firm. Mimicking is possible always that players know their opponents’ output in the last
period, but if they do not know profits more cognitive effort is needed to mimic than to
follow because it is easier to evaluate profits at symmetric quantity choices. Information
about individual output makes easier to collude because they can easily control deviations
from the agreed quantity, although it is also possible to imitate the best and reach the
competitive outcome. Players did not have profit calculators or profit tables, but they had
13

regular calculators and all the information needed to compute their best responses.
Offerman et al.(2002) show that informational treatments correspond to its expected
learning dynamic in the sense that each dynamic has the best fit in its corresponding
treatment.4 Nevertheless, despite the fact that in treatments with information about past
individual quantities players frequently end up in the competitive and Nash outcome (when
they know profits and when they do not, respectively), in both treatments the collusive
equilibrium is achieved more often. Both the Walrasian and the collusive output are rest-
points in the full information treatment, but only the collusive output is stable. 5 Firms
seem to reach the Walrasian output, as the good fit of the imitation dynamic suggest, but
they soon realize that it is not convenient and start to choose smaller quantities. When
firms only have information about last period’s aggregate quantities, Cournot’s prediction
is accurate. This paper shows that even though it is theoretically clear that it is possible to
reach the Walrasian output in a Cournot setting and that players’ behavior respond to their
information levels, the Walrasian output may not be stable and, thus, not an equilibrium
for the market. If they can choose, they will prefer collusion or Cournot’s output because
their profits are higher. Best reply dynamic is the most cognitive demanding and it is
played in spite of that, showing that cognitive effort may not be so relevant.
Bosch-Domenesch et al.(2003) test the effect that information about opponents’ profits and
output has on the final outcome. They have only two treatments in quantity competition
and they differ in individual information feedback. Their players interact in a Cournot
oligopoly with four firms, symmetric costs and differentiated products. All subjects knew
their own costs and the demand function. The experiment lasted for 40 periods and this
was commonly known. They find that for markets with players who only have aggregate
information the Cournot-Nash equilibrium is a good prediction. In markets with individual
feedback information does not facilitate collusion. In fact, it increases competition in the
case of strategic substitutes and does not change it for strategic complements.
In his meta-analysis of oligopoly experiments, Engel (2007) distinguishes between full
information, which holds when agents are able to calculate their profits and their
4In the Q treatment though, the static Cournot-Nash model fits better than both best reply dynamicand fictitious play models, which suggests that players do not update their beliefs.
5Rest-points are allocations in which firms tend to repeat their output.
14

competitors; partial information, under which agents can calculate their own profits; and
reduced information, that includes all situations in which agents have less information
than in the former two. He studies separately the effect of ex-ante information (demand,
competitors’ cost structure) and the effect of feedback. According to his results, collusion
increases when players have more ex-ante information if compared to the Walrasian
equilibrium. The effect on deviations from the Nash equilibrium is not clear because
from reduced to full information, collusion is higher, but it is the lowest with partial ex-
ante information. The same problem arises with the interaction effect with the number of
firms. Collusion is the highest with reduced information and the lowest with partial, while
with full information collusion is a bit higher than with partial. These effects reverse for
markets with 3 or 4 firms. These results maybe due to the fact that he uses experiments
with different settings in the same regression, as stated before. This problem is specially
important when studying information’s effect because, as it has been shown, findings differ
substantially under different experimental settings.
Feedback’s effect is analogous to ex-ante information’s. Information favours collusion when
comparing to the Walrasian equilibrium, but again predictions are not clear for deviations
from the Nash equilibrium. Full information has a strong effect on collusion when players
can communicate between them or conclude an arrangement, but it is almost irrelevant
in a stranger design (when players do not know who are their opponents). From this,
Engel concludes that information is mainly used to collude and control deviations from
the agreed quantities.
Engel’s analysis shows that the effect of information depends strongly on what kind of
information is provided and on other market conditions, like the number of firms. The
sole ability to calculate own or competitors profits does not seem to have a unidirectional
effect. This is consistent with the theoretical analysis and with results from the other
papers already mentioned, because it means that information’s effect depend on how
agents behave and this can be influenced by the market structure.
Research on information’s effect has focused on learning dynamics and there are few papers
studying interaction effects. Mason et al. (1997) show that information has different effects
in symmetric and asymmetric markets. Under an indefinite horizon setting, they find that
in symmetric markets information increases total quantity and in asymmetric markets
15

total quantity does not change under different informational treatments.
Empirical literature shows that with improved individual information it is possible to reach
the competitive outcome in a Cournot setting. In spite of that, still it is not clear when
players will imitate the best firm instead of playing best reply or colluding. Information
seems to play an important role, but there are other market conditions determining which
dynamic will be followed and which equilibrium will be reached. Because of this reason, it
is necessary to study interaction effects between information and other market structure
variables, like cost asymmetry and the number of players. All these reviewed papers
study the effect of information on competition with long time horizons, so this 10 periods
experiment may shed some light on its effect in a market in which firms interact for a
short time. In fact, the only paper in which firms with individual information colluded
was 100 periods long, so maybe the time horizon does matter. Although Engel (2007) does
not find a significant effect for experiment’s duration on collusion in his meta-analysis on
oligopolies, he is not controlling by other experiment characteristics nor testing for the
specific question about the effect of information in experiments of different length. Mixed
evidence on information’s effect suggests that is interaction with other factors what makes
information foster or discourage competition. In the next section the experiment will be
described and it will be shown how the analysis of this data can contribute to a better
understanding of the effect of information and asymmetry in a Cournot oligopoly.
4 Data and experiment description
Data was obtained from experiments run in Tilburg University by Professor Dr. Wielland
Muller and Professor Dr. Jan Potters from year 2004 to 2007. Subjects were students
from the Tilburg University. Instructions given to participants are in Appendix B. There
were 10 treatments corresponding to different combinations of information, cost symmetry
or asymmetry and markets with 3 or 5 players (see Table 2). Informational treatments
differ only in how much they knew about their competitors. Players had either aggregate
information, i.e. they knew aggregate quantity in the last period but not their competitors’
cost or profits function, or individual information, in which they additionally knew their
16

opponents’ quantity in the last period. All players knew the demand function and their
own costs and had a profit calculator, hence they were able to play their best reply. Players
did not know other firms’ costs in any of the treatments, which means that in asymmetric
markets they were not able to compute their opponents’ profits and thus, to follow the
‘imitate the best’ dynamic. If they assume that others have the same costs as them, the
firm with the largest output would have the highest profit and, therefore, they may want
to imitate the firm with the largest production. When cost were asymmetric, the sum of
individual costs was the same that in the symmetric case for the same number of players
(see Table 3). This means that Cournot’s prediction for aggregate quantities is the same
for symmetric or asymmetric treatments.
Players interacted during 10 periods and they knew this from the beginning of the
experiment. Data was arranged in two 10 periods panels: one had 73 aggregate quantity
observations and the other 288 individual quantity observations. When the variable year
was included in the regressions it was not significant, showing that there was no bias
between sessions and that, in this sense, the experiment is reliable.6
Asymmetric markets take longer to converge (Mason et al. 1992) and in these markets it is
harder to infer competitors’ costs than in symmetric markets, which may make convergence
even slower. Figures 1 and 2 show that, in fact, there is more dispersion in asymmetric
markets, but it seems to decrease over time.7
Figures 3 to 6 show aggregate and individual quantities over time and their Cournot
benchmark. Variance seems to be higher in the first period in almost all graphics, after
which it tends to stabilize. This indicates that there is some degree of convergence in this
short experiment and that players learnt how to play in the first few periods; therefore,
reliable results can be obtained from this data.
6If it were significant it would mean that between years the experiment was done in a different way,e.g. because instructions were explained differently, and this influenced individuals’ behavior.
7There was only one asymmetric market with five players.
17
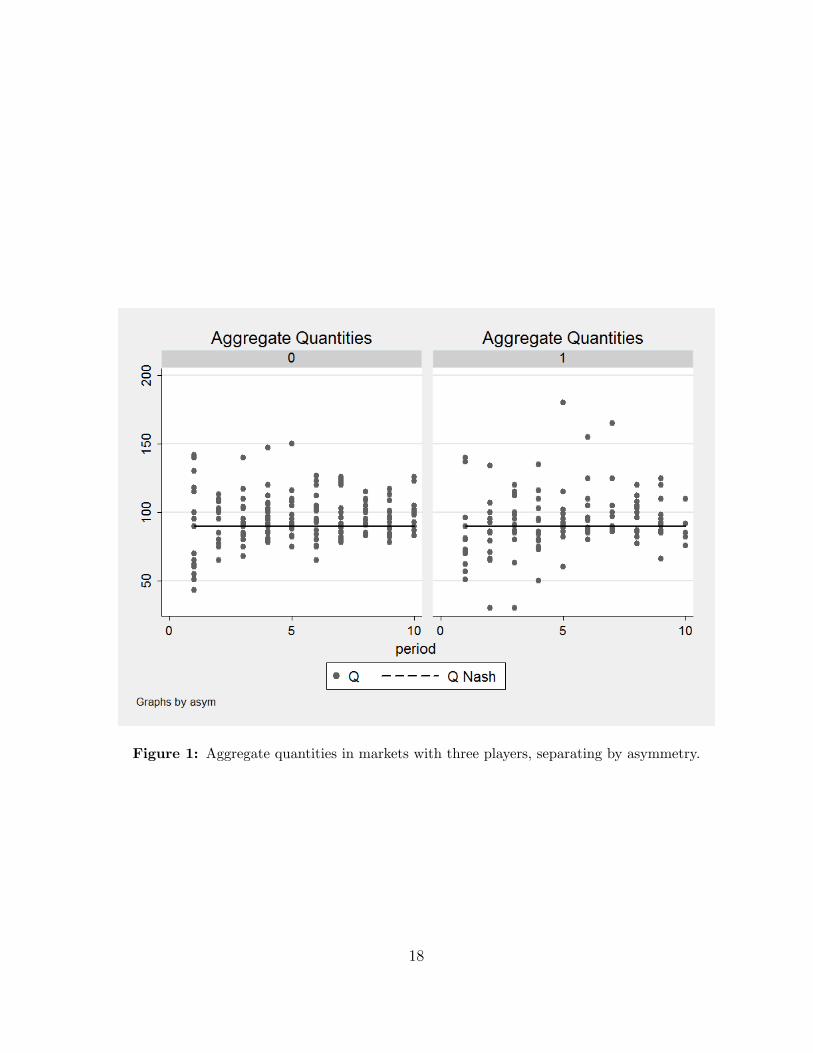
Figure 1: Aggregate quantities in markets with three players, separating by asymmetry.
18

Figure 2: Aggregate quantities in markets with five players, separating by asymmetry.
19
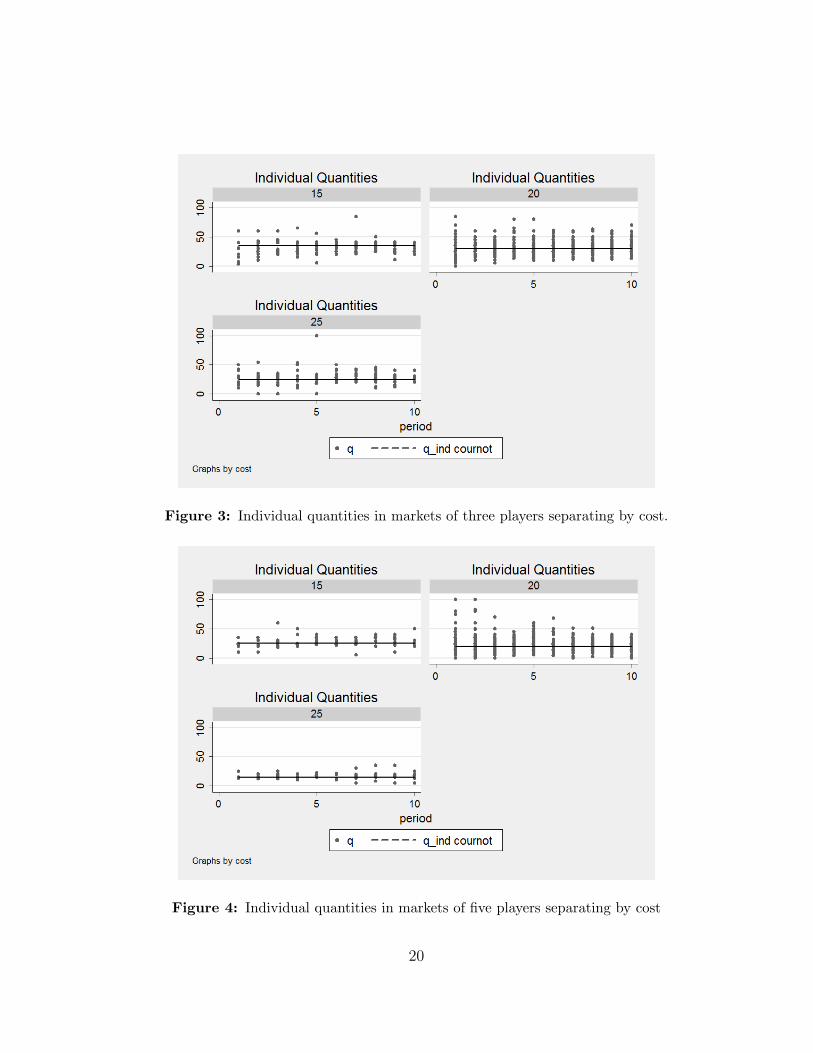
Figure 3: Individual quantities in markets of three players separating by cost.
Figure 4: Individual quantities in markets of five players separating by cost
20

Figure 5: Individual quantities in symmetric markets, separating by the number of players.
21

Figure 6: The left graphic shows aggregate quantities in markets with three players and thegraphic to the left in markets with five players.
22
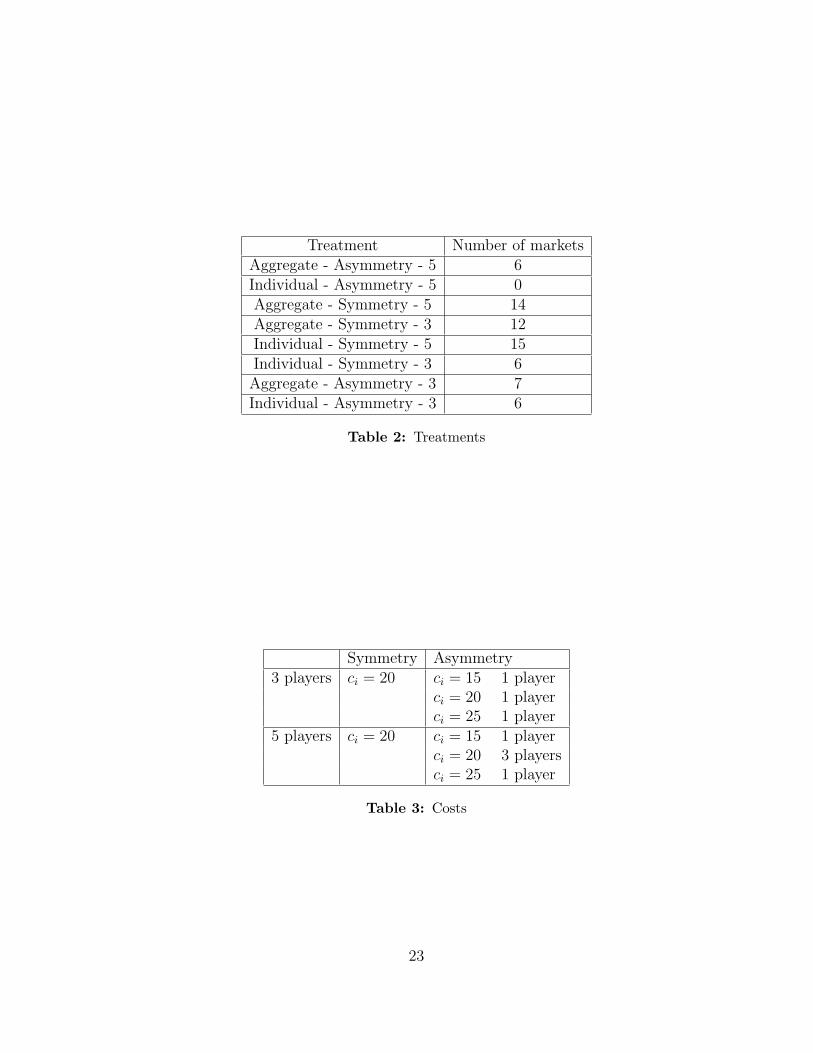
Treatment Number of marketsAggregate - Asymmetry - 5 6Individual - Asymmetry - 5 0Aggregate - Symmetry - 5 14Aggregate - Symmetry - 3 12Individual - Symmetry - 5 15Individual - Symmetry - 3 6
Aggregate - Asymmetry - 3 7Individual - Asymmetry - 3 6
Table 2: Treatments
Symmetry Asymmetry3 players ci = 20 ci = 15 1 player
ci = 20 1 playerci = 25 1 player
5 players ci = 20 ci = 15 1 playerci = 20 3 playersci = 25 1 player
Table 3: Costs
23

Before regression analysis, average quantities under the different treatments were com-
puted in order to have a general idea of what happened in this experiment. A first look on
the data shows that average aggregate quantities are larger than Cournot’s prediction. In
markets with 3 players the average aggregate quantity is 95.03 with a standard deviation
of 1.12, which means that it is three standard deviations over the Nash quantity (90). In
markets with 5 players, aggregate quantity has a mean equal to 104.69 and a standard
deviation of 1.05, four standard deviations over its Cournot benchmark of 100. This means
that, on average, players are choosing quantities larger than the Nash equilibrium for the
market.
Information seems to have a positive effect on competition: average aggregate quantities
are at least four standard deviations above Cournot’s prediction when players have
individual feedback (see Table 4). Table 5 shows average quantities in symmetric and
asymmetric markets; this treatment does not seem to produce differences in output. Table
6 shows that in markets with 3 firms asymmetry lowers competition only when there is
aggregate feedback and that in asymmetric markets individual feedback has a stronger
effect on production.8 In the next section it will be studied whether this observations are
supported by the data.
Aggregate information Individual informationn=3 91.85 (1.25) 100.11 (2.04)n=5 103.34 (1.48) 106.5 (1.45)
Table 4: Mean aggregate quantities by informational treatment. Courtnot’s predicion is Q = 90for n = 3 and Q = 100 for n = 5. Standard deviation in parenthesis.
8Table 6 could not be constructed for markets with 5 players because there is only one market with 5firms, individual feedback and asymmetric costs. Nevertheless, average quantities were similar with andwithout individual feedback in symmetric markets of 5 firms.
24
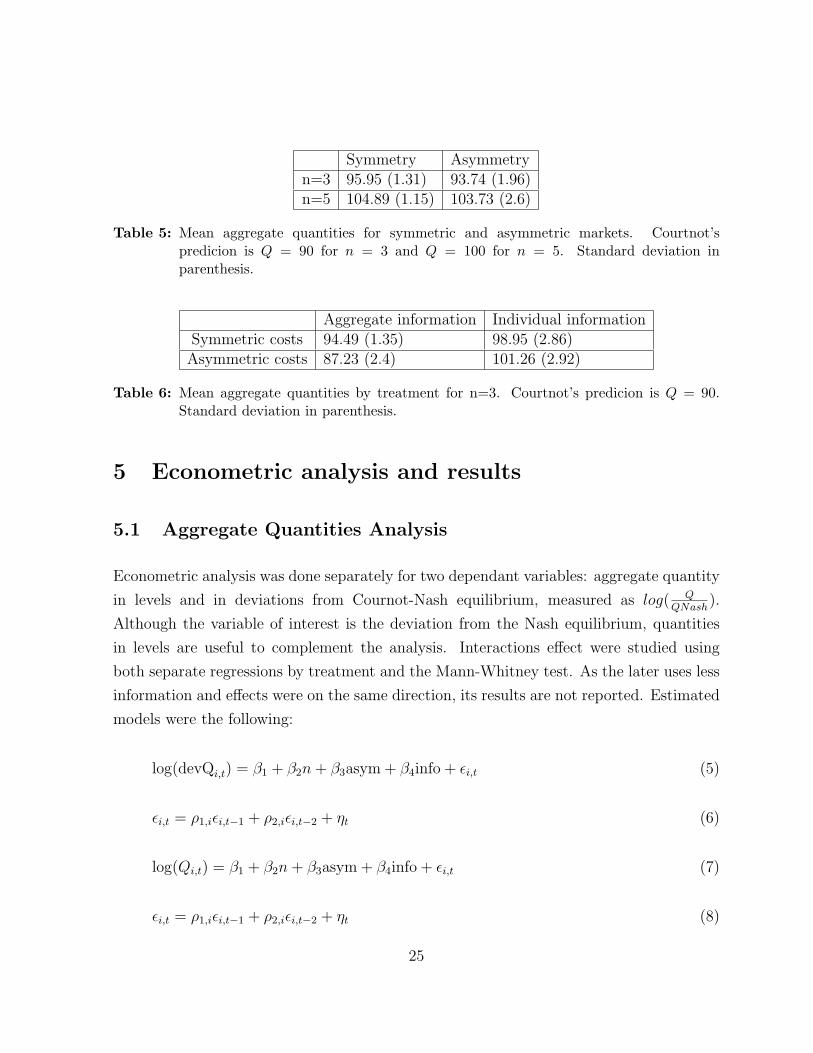
Symmetry Asymmetryn=3 95.95 (1.31) 93.74 (1.96)n=5 104.89 (1.15) 103.73 (2.6)
Table 5: Mean aggregate quantities for symmetric and asymmetric markets. Courtnot’spredicion is Q = 90 for n = 3 and Q = 100 for n = 5. Standard deviation inparenthesis.
Aggregate information Individual informationSymmetric costs 94.49 (1.35) 98.95 (2.86)
Asymmetric costs 87.23 (2.4) 101.26 (2.92)
Table 6: Mean aggregate quantities by treatment for n=3. Courtnot’s predicion is Q = 90.Standard deviation in parenthesis.
5 Econometric analysis and results
5.1 Aggregate Quantities Analysis
Econometric analysis was done separately for two dependant variables: aggregate quantity
in levels and in deviations from Cournot-Nash equilibrium, measured as log( QQNash
).
Although the variable of interest is the deviation from the Nash equilibrium, quantities
in levels are useful to complement the analysis. Interactions effect were studied using
both separate regressions by treatment and the Mann-Whitney test. As the later uses less
information and effects were on the same direction, its results are not reported. Estimated
models were the following:
log(devQi,t) = β1 + β2n+ β3asym + β4info + εi,t (5)
εi,t = ρ1,iεi,t−1 + ρ2,iεi,t−2 + ηt (6)
log(Qi,t) = β1 + β2n+ β3asym + β4info + εi,t (7)
εi,t = ρ1,iεi,t−1 + ρ2,iεi,t−2 + ηt (8)
25
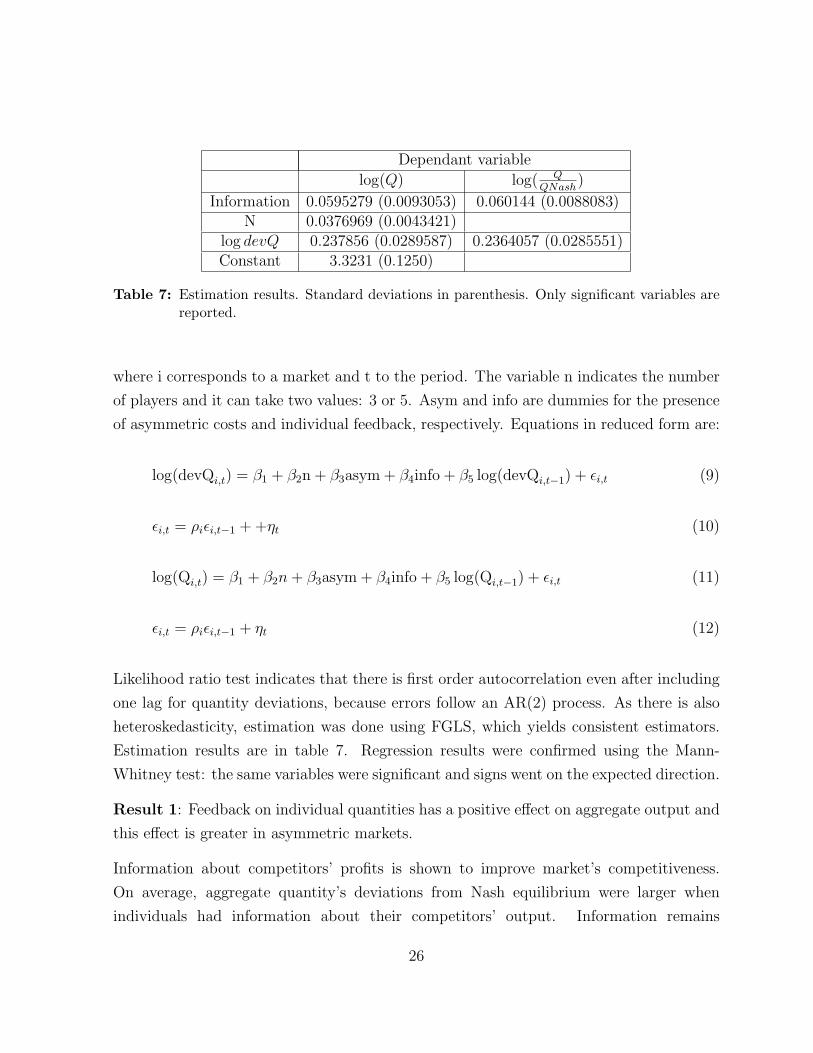
Dependant variable
log(Q) log( QQNash
)
Information 0.0595279 (0.0093053) 0.060144 (0.0088083)N 0.0376969 (0.0043421)
log devQ 0.237856 (0.0289587) 0.2364057 (0.0285551)Constant 3.3231 (0.1250)
Table 7: Estimation results. Standard deviations in parenthesis. Only significant variables arereported.
where i corresponds to a market and t to the period. The variable n indicates the number
of players and it can take two values: 3 or 5. Asym and info are dummies for the presence
of asymmetric costs and individual feedback, respectively. Equations in reduced form are:
log(devQi,t) = β1 + β2n + β3asym + β4info + β5 log(devQi,t−1) + εi,t (9)
εi,t = ρiεi,t−1 + +ηt (10)
log(Qi,t) = β1 + β2n+ β3asym + β4info + β5 log(Qi,t−1) + εi,t (11)
εi,t = ρiεi,t−1 + ηt (12)
Likelihood ratio test indicates that there is first order autocorrelation even after including
one lag for quantity deviations, because errors follow an AR(2) process. As there is also
heteroskedasticity, estimation was done using FGLS, which yields consistent estimators.
Estimation results are in table 7. Regression results were confirmed using the Mann-
Whitney test: the same variables were significant and signs went on the expected direction.
Result 1: Feedback on individual quantities has a positive effect on aggregate output and
this effect is greater in asymmetric markets.
Information about competitors’ profits is shown to improve market’s competitiveness.
On average, aggregate quantity’s deviations from Nash equilibrium were larger when
individuals had information about their competitors’ output. Information remains
26
significant when regressions are run excluding the first 3 and 4 periods, which was done
in order to confirm that this was a strong result and not due to players’ experimentation
while they are learning the game.
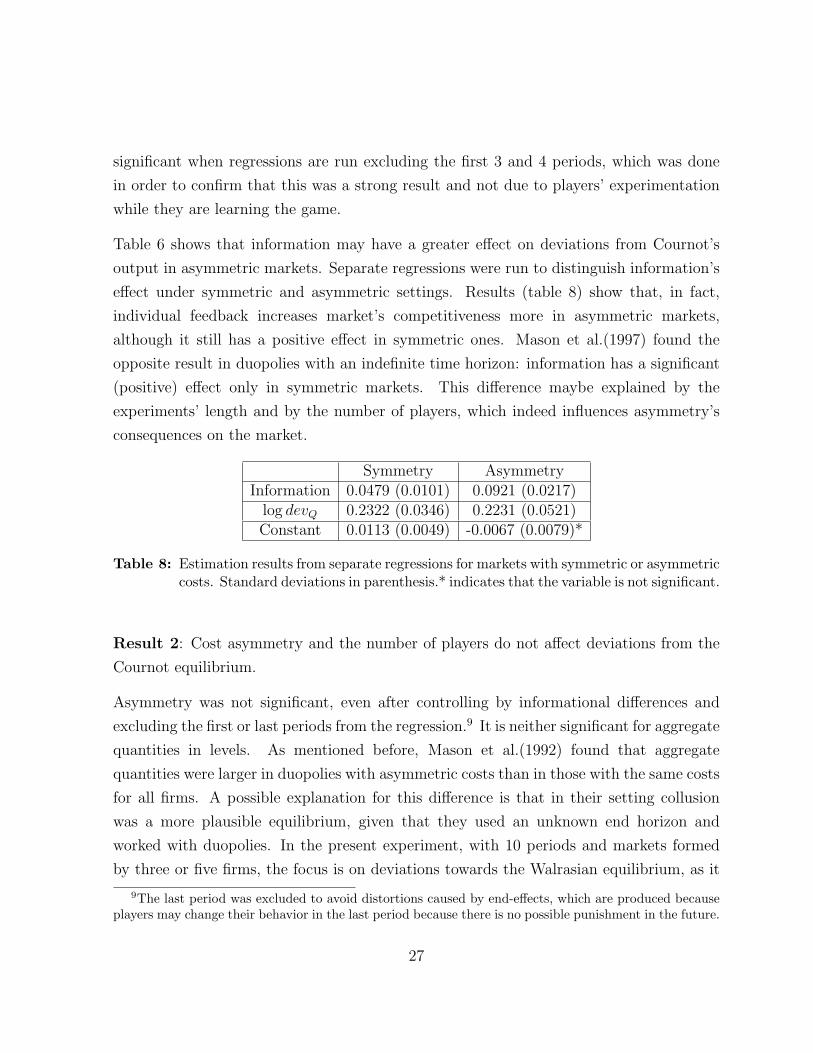
Table 6 shows that information may have a greater effect on deviations from Cournot’s
output in asymmetric markets. Separate regressions were run to distinguish information’s
effect under symmetric and asymmetric settings. Results (table 8) show that, in fact,
individual feedback increases market’s competitiveness more in asymmetric markets,
although it still has a positive effect in symmetric ones. Mason et al.(1997) found the
opposite result in duopolies with an indefinite time horizon: information has a significant
(positive) effect only in symmetric markets. This difference maybe explained by the
experiments’ length and by the number of players, which indeed influences asymmetry’s
consequences on the market.
Symmetry AsymmetryInformation 0.0479 (0.0101) 0.0921 (0.0217)
log devQ 0.2322 (0.0346) 0.2231 (0.0521)Constant 0.0113 (0.0049) -0.0067 (0.0079)*
Table 8: Estimation results from separate regressions for markets with symmetric or asymmetriccosts. Standard deviations in parenthesis.* indicates that the variable is not significant.
Result 2: Cost asymmetry and the number of players do not affect deviations from the
Cournot equilibrium.
Asymmetry was not significant, even after controlling by informational differences and
excluding the first or last periods from the regression.9 It is neither significant for aggregate
quantities in levels. As mentioned before, Mason et al.(1992) found that aggregate
quantities were larger in duopolies with asymmetric costs than in those with the same costs
for all firms. A possible explanation for this difference is that in their setting collusion
was a more plausible equilibrium, given that they used an unknown end horizon and
worked with duopolies. In the present experiment, with 10 periods and markets formed
by three or five firms, the focus is on deviations towards the Walrasian equilibrium, as it
9The last period was excluded to avoid distortions caused by end-effects, which are produced becauseplayers may change their behavior in the last period because there is no possible punishment in the future.
27

is confirmed by the fact that on average production was higher than Cournot’s output.
Thus, asymmetry may affect incentives to collude but not incentives to deviate from the
Nash quantity.
Although according to table 6 symmetric markets appear to produce larger quantities
than asymmetric ones when players have aggregate information, this observation is not
supported by the data. When regressions using the full sample were performed separately
by information treatment, asymmetry was significant in markets without individual
feedback, but its significance disappears when the first periods are excluded. Therefore,
the observation in table 5 seems to be a product of players’ learning of the game. The
same happens when regressions are run separately for markets with three and five players:
asymmetry is significant in three players markets when the full sample is included, but
this effect ceases to be significant after the first periods are excluded.
The number of players was not found significant for deviations from the Nash equilibrium
with aggregate feedback, which means that in markets with 3 or 5 firms Cournot’s is a good
prediction for produced quantities. Collusion is not observed, but neither are deviations
towards Walrasian equilibrium. This result is not robust and it depends strongly on how
many periods are included in the regression. When the same regression is run for aggregate
quantities in levels, results show that aggregate quantity increases when the number of
players does it, as Cournot predicts.
Result 3: There is a dynamic component in this experiment.
The lag of the dependent variable was also significant and positive, which means that
players were, on average, increasing their quantities from period to period and that there
is a dynamic component working even in this 10 periods setting. This result presumably
shows that information is affecting market’s outcome through some behavior dynamic, but
this needs to be analyzed at individual level.
28
5.2 Individual quantities analysis
Both regression analysis and the non-parametric Mann-Whitney test were used in order
to understand how treatments affect individuals’ behavior. They were consistent with
each other, so only regressions are reported. As with aggregate quantities, individual data
was analyzed both in levels and in deviations from the Cournot equilibrium (log(q) and
devq = log( qqNash
), respectively). Instead of the dummy for asymmetric or symmetric
costs, individual costs were included in the regression for quantities in levels. When the
dummy was used as a regressor, it was not significant. This makes sense, given that
firms in the asymmetric treatment have may have cost higher or lower than firms in the
symmetric setting.
The estimated models were the following:
devqi,t = β1 + β2n + β3asym + β4info + εi,t (13)
εi,t = ρ1,iεi,t−1 + ρ2,iεi,t−2 + ηt (14)
qi,t = β1 + β2n + β3Ci + β4info + εi,t (15)
εi,t = ρ1,iεi,t−1 + ρ2,iεi,t−2 + ηt (16)
where i indicates an individual player and t the period. Equations in their reduced form
are:
devqi,t = β1 + β2n + β3asym + β4info + β5devqi,t−1 + εi,t (17)
εi,t = ρiεi,t−1 + ηt (18)
qi,t = β1 + β2n + β3Ci + β4info + β5qi,t−1 + εi,t (19)
εi,t = ρiεi,t−1 + η (20)
29

Dependant variablelog(q) log( q
qNash) log( q
qNash) log( q
qNash)
Information 0.0519 (0.0068) 0.0525 (0.0068) 0.0517 (0.0068) 0.0481 (0.0074)N -0.1430 (0.0044) -0.0220 (0.0035) -0.0207 (0.0035) -0.0195 (0.0038)
log( qqNash
)t−1 0.3924 (0.0131) 0.3962 (0.0131) 0.3938 (0.0131) 0.3975 (0.0131)
Cost -0.0146 (0.0020) 0.0086 (0.0020)Asym · Info 0.0243 (0.1648)*
Constant 2.7837 (0.0735) 0.0656 (0.0152) -0.1116 (0.0447) 0.0552 (0.0167)
Table 9: Estimation results for individual quantities. Standard deviations in parenthesis.
There was first order autocorrelation and heteroskedasticity, so FGLS was used to obtain
consistent estimates. Again, errors follow an AR(2) process and an AR(1) in the reduced
form. Autocorrelation parameters were allowed to differ between players, as was indicated
by the likelihood ratio test. Estimation results are in table 9.
Result 4: Feedback about competitors’ last period output has a positive effect on
individual deviations from the Cournot quantity.10
Information is significant and has a positive sign, confirming aggregate quantities’ results
about its positive effect on production. Coefficients in the regression on levels are positive
as well. On average, firms choose higher outputs when they know their opponent’s
production in the last period. This result contrasts with Offerman et al. (2002) finding,
according to which when firms have feedback about their competitors’ quantities, but not
profits, they tend to collude. This difference is probably explained by the fact that in
their experiment firms interacted in duopolies during 100 periods and, thus, collusion was
a plausible outcome.
As with aggregate quantities, the effect of information is stronger in asymmetric markets
(See table 10). A possible explanation for this is that firms with the highest costs imitate
firms with lower costs and thus deviate more from the Cournot benchmark. As on average
production is over Cournot’s prediction and it is increasing over time, if firms are following
an imitation dynamic they have to be imitating firms with a higher output. This would
be the case if they think that they all have the same costs, because in that situation the
10These result is robust to the exclusion of the first and last periods from the regression.
30

Symmetry AsymmetryInformation 0.0472 (0.0076) 0.0909 (0.0193)
log devQ 0.4193 (0.0152) 0.3498 (0.0255)n -0.0231 (0.0041) -0.0058 (0.0087)*
Constant 0.0745 (0.0179) -0.0096 (0.0371)*
Table 10: Estimation results from separate regressions for markets with symmetric orasymmetric costs. Standard deviations in parenthesis. * indicates that the variableis not significant
firm with the largest output is the firm with the highest profits. Firms with lower costs
will be willing to choose larger quantities because they do not need prices as high as larger
costs’ firms to get profits. In fact, firms with the lowest cost produced the largest output
45% of the periods and firms with the second lowest costs did it 44% of them. High
costs firms almost never produced the largest quantity; they may have imitated firms
with larger quantities and, hence, deviated more from Cournot’s prediction. Cost has a
positive coefficient in the regression for individual deviations, meaning that indeed firms
with higher costs deviate more from the Nash prediction. When regressions are performed
separately for each informational treatment, asymmetry is never significant, which implies
that it has no effect on deviations but on the effect that information has on them. This
result is confirmed by the inclusion of an interaction term in the regression (see table 11).
Its positive sign implies that information’s effect is larger in asymmetric markets11.
Result 5: In the presence of cost asymmetry, the most efficient firms produce a larger
share of the total output. Although costs are private information, cost asymmetry does
not induce significant deviations from the Cournot benchmark.
Asymmetry is not significant explaining deviations from the Nash output. As Cournot
predicts, the most efficient firms produce a relatively larger part of the output, which is
confirmed by the positive sign and significance of the cost’s coefficient in the regression
for individual quantities in levels.
11Although the interaction term is not individually significant, this is due to collinearity with theinformation dummy. When a joint significance test is performed, it rejects the null hypothesis of nosignificance.
31
Result (not robust): Firms in markets with more players produce lower quantities and
deviate less from the Cournot benchmark.
The number of players has a negative effect both on deviations from Cournot output and
on individual quantities in levels, which means that when there are more firms in the
market, individual quantities are lower and deviate less from the Cournot equilibrium.
Given that this variable was not significant for aggregate quantities, this result does not
make much sense. As last period’s deviation is included among the regressors and it is
correlated to n, this result may be due to collinearity between variables. Nonetheless,
in the analysis of aggregate quantities the significance of this variable depends on which
periods are included, which may imply that there is not a clear effect and it is not possible
to draw robust conclusions about the number of players form this data. The negative sign
of the number of players in the regression for individual quantities in levels is easier to
understand. With more firms in the market each of them produces a smaller quantity,
because the increase in aggregate output is lower than the increase in the number of firms.
Dynamic Analysis
The positive sign of the lagged individual deviation indicates that players are increasing
their quantities from period to period, as predicted by the imitate the best dynamic.
Following Huck et al.(1999), a new regression was run to test whether firms were following
the imitate the best dynamic and to explicitly test the relative weight of best reply dynamic
and imitation in this game. The reduced model is the following:
qt − qt−q = β0 + β1(bri,t−1 − qi,t−1) + β2(ibt−1 − qi,t−1) + εi,t (21)
εt = γiεt−1 + ηt (22)
where brt−1 is the best reply to other players’ quantity in the last period and ibt−1 is the
largest quantity produced. Although players cannot know who is the best, i.e. who has
the highest profits, if firms assume that their competitors have the same costs as them,
they will think that the firm with the highest output has the highest profits. For this
32

reason, ibt−1 was included as a regressor instead of the quantity produced by the firm with
the highest profits. If a firm follows a behavior rule exactly, then the coefficient for its
deviation from it should be one and the others zero. Regressions were run separately for
individual and aggregate feedback, as was required to know if behavior differs when the
information that players have does it. Results from both regressions are in Table 11.
Individual feedback Aggregate feedbackbrt−1 − qt−1 0.2072(0.0091) 0.2115 (0.0071)ibt−1 − qt−1 0.2844 (0.0163) 0.2361 (0.0098)Constant -5.4743 (0.2787) -7.1116 (0.2570)
Table 11: Estimation results for separate regressions according to the information that playershave. Dependent variable is qt − qt−1. Standard deviations in parenthesis
Following Huck et al.(1999) a third behavior variable was added to the regression, namely
the ‘imitate the average’ rule. It assumes that players imitate the average quantity in
the last period, so it can be followed by all players in this experiment. Results from this
estimation are in table 12.
qt − qt−1 = β0 + β1(bri,t−1 − qi,t−1) + β2(ibt−1 − qi,t−1) + β3(iai,t−1 − qi,t−1)εi,t (23)
εt = γiεt−1 + ηt (24)
Individual feedback Aggregate feedbackbrt−1 − qt−1 0.1638 (0.0066) 0.1844 (0.0074)ibt−1 − qt−1 0.0062 (0.0125)* -0.0213 (0.0164)*iai,t−1 − qi,t−1 0.5010 (0.0259) 0.6595 (0.0255)
Constant -3.7896 (0.2318) -2.7065 (0.2457)
Table 12: Estimation results for separate regressions according to the information that playershave. Dependent variable is qt − qt−q. Standard deviations in parenthesis. * meansthat coefficients are not significant at 5%.
Result 6: Players mainly imitate the average output in the last period. Best reply is
present, but the ‘imitate the best’ dynamic is not significant.
33

Results from table 11 show that both behavior rules are followed, but only partially because
coefficients are smaller than one.12 Although imitation seems to be followed more than the
best reply dynamic -even in the aggregate treatment in which agents do not have enough
information to do it-, its coefficient is absolutely and relatively larger in the individual
feedback treatment, which would mean that information has a role on agents’ dynamic
behavior.
Problems arises when the ‘imitate the average’ variable is included in the regression. When
it is added, the “imitate the best” variable ceases to be significant in both informational
treatments. 50% of the adjustment is explained by this new variable in the case of
aggregate feedback and 66% in the case of individual feedback (see table 12). This would
mean that most players were producing last period’s average quantity and some of them
were playing their best reply. Nevertheless, as the experiment is only 10 periods long,
it is more plausible to think that this lenght is not enough to draw conclusions about
dynamics.13
The experiment is too short to obtain strong conclusions about individuals’ behavior, but
information indeed has a positive effect on produced quantities. Even if they were imitating
the average, output was higher than Cournot’s quantity and even higher when firms have
information about their opponents’ last period’s output. Although the experiment length
does not allow to understand how information is working, it is enough to conclude that
under this conditions information improves markets’ competitiveness.
12Moreover, coefficients fall when the first periods are excluded from the sample, but never below 15%.13Shortness is a problem because there is not enough time for individuals or markets to converge and,
hence, it is hard to distinguish experimentation and learning to play from strategic behavior.
34
6 Conclusion
Cournot’s oligopoly model has been widely studied and many experiments have been done
in order to get a better understanding of how different variables affect market outcome.
Nonetheless, there are still many things to learn: the effect of some variables is not
theoretically nor empirically clear and we do not know how interaction between variables
influences its effect on the market’s outcome. In this paper, experimental data was used to
test the effect of cost asymmetry, the number of players and feedback about competitors’
production on market’s competitiveness in a 10 periods long Cournot setting.
It was found that information about last period’s individual production does foster
competition , but it was not possible to understand how information is affecting behavior.
Vega Redondo (1997) showed that if players follow the “imitate the best” dynamic, the
market converges to the competitive outcome. Nevertheless, although indeed there was
a dynamic component in individuals’ behavior, findings pointed that they were probably
not following a specific dynamic and, if any, they were imitating the average output in
the last period. This dynamic may converge to any equilibrium and, thus, it is not an
explanation for the positive effect of information on competition. Further investigation
should aim to explain how can information improve competition in a setting in which firms
interact during a few periods.
As Cournot equilibrium predicts, the most efficient firms produce a relatively larger share
of the output, even if costs are private information. Although cost asymmetry is not
significant explaining deviations from Cournot’s equilibrium, information has a greater
effect in asymmetric markets. This factor needs to be considered in the explanation for
the effect of information because it may help to understand how information is affecting
output. Further study on individuals’ hypothesis about their competitors’ costs may
contribute to this. As very different effects have been found for asymmetry in former
studies with duopolies in long time horizons (Mason et al., 1992 and 1997), interaction
between variables seems to be crucial to assess how a single variable will affect competition.
The number of players affects production in the expected direction: more players
increase total output and competition. Even though the effect of this single variable
is straightforward, different numbers of players may significantly change other variable’s
35
effect. As in duopolies collusion is a possible outcome more than in larger markets, it
would be interesting to know if differences with other experimental papers are due to this
fact. Consequently, it is necessary to study how the number of firms interacts with other
characteristics of the market increasing or decreasing competition.
This paper shows that individual feedback has a positive effect on competition in Cournot
markets with more than three firms, even though the “imitate the best” dynamic was not
followed and the experiment’s length does not allow to draw strong conclusions about
dynamics and convergence. This means that information has a role even in a short
time horizon, although we do not have a theoretical explanation for this fact. A second
important conclusion is that interaction effects are of main importance when assessing the
effect of single variables on market’s competitiveness. This has to be taken into account
both by antitrust and regulation authorities and by researchers designing experiments that
seek to isolate the effect of a single variable.
36
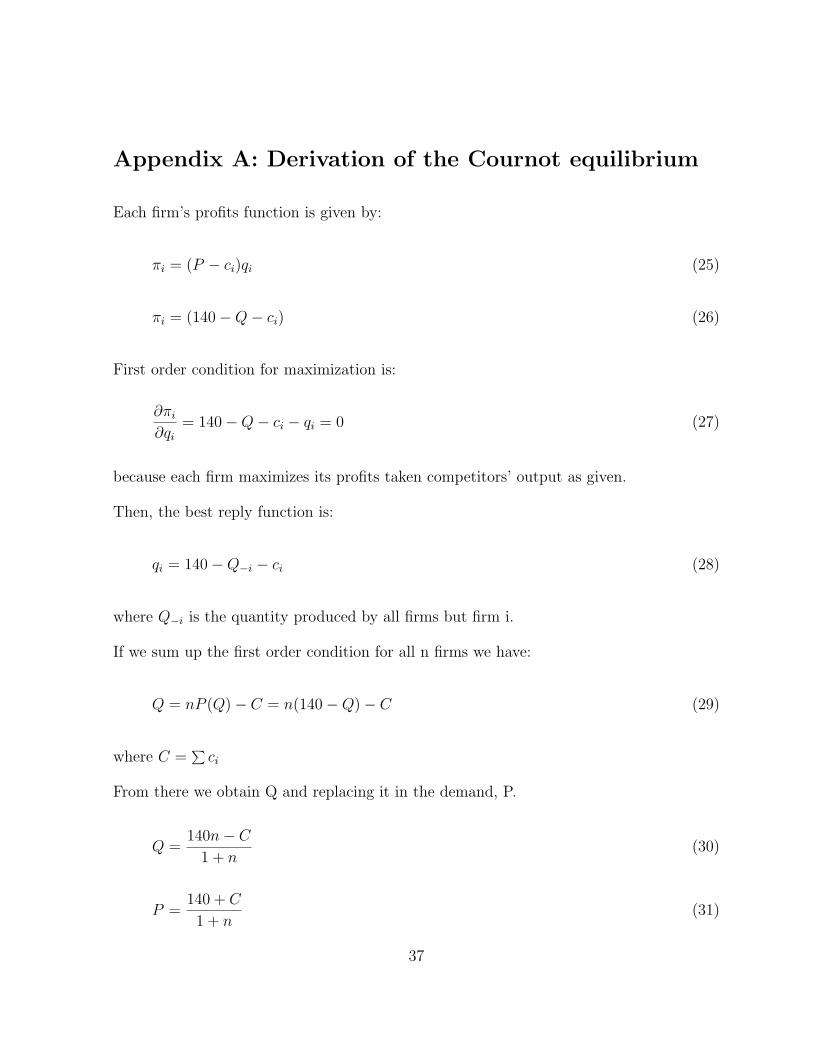
Appendix A: Derivation of the Cournot equilibrium
Each firm’s profits function is given by:
πi = (P − ci)qi (25)
πi = (140 −Q− ci) (26)
First order condition for maximization is:
∂πi
∂qi= 140 −Q− ci − qi = 0 (27)
because each firm maximizes its profits taken competitors’ output as given.
Then, the best reply function is:
qi = 140 −Q−i − ci (28)
where Q−i is the quantity produced by all firms but firm i.
If we sum up the first order condition for all n firms we have:
Q = nP (Q) − C = n(140 −Q) − C (29)
where C =∑ci
From there we obtain Q and replacing it in the demand, P.
Q =140n− C
1 + n(30)
P =140 + C
1 + n(31)
37

The reaction function can be written in terms of the total aggregate quantity and from
there we obtain equilibrium individual quantities.
qi = 140 −Q− ci (32)
qi =140 + C
1 + n− ci (33)
As equation (30) shows, individual quantities decrease when the number of players or
individual cost increases.
38
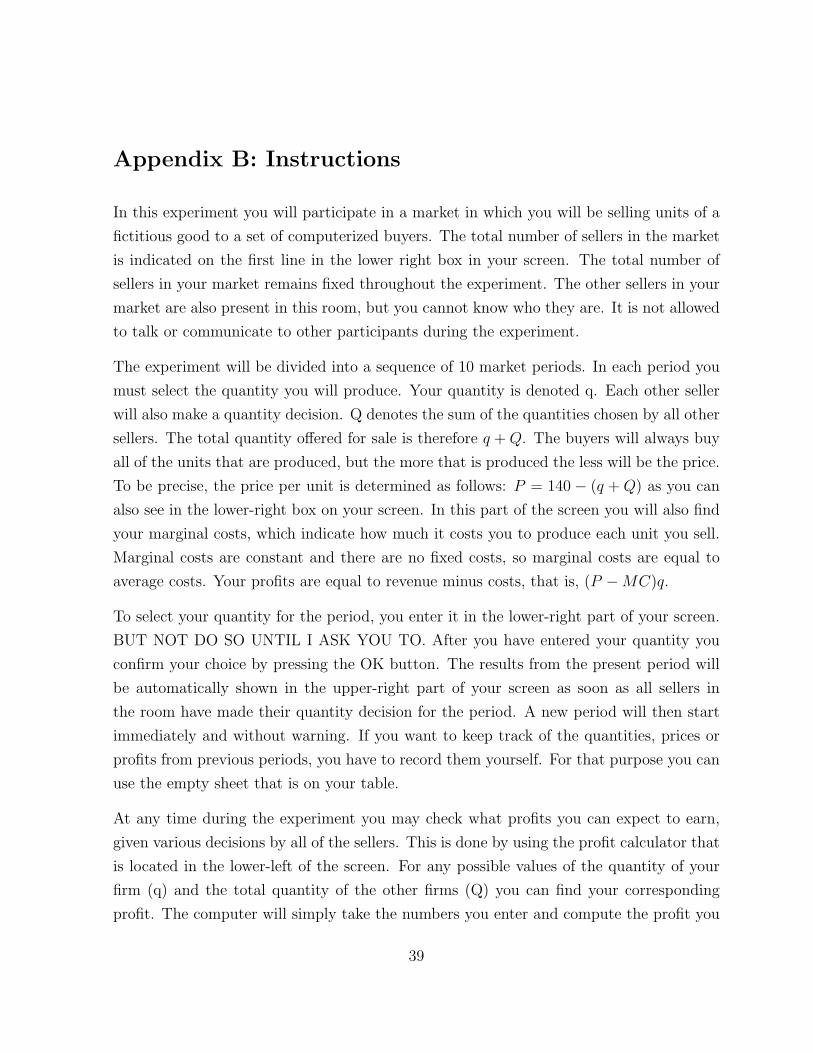
Appendix B: Instructions
In this experiment you will participate in a market in which you will be selling units of a
fictitious good to a set of computerized buyers. The total number of sellers in the market
is indicated on the first line in the lower right box in your screen. The total number of
sellers in your market remains fixed throughout the experiment. The other sellers in your
market are also present in this room, but you cannot know who they are. It is not allowed
to talk or communicate to other participants during the experiment.
The experiment will be divided into a sequence of 10 market periods. In each period you
must select the quantity you will produce. Your quantity is denoted q. Each other seller
will also make a quantity decision. Q denotes the sum of the quantities chosen by all other
sellers. The total quantity offered for sale is therefore q +Q. The buyers will always buy
all of the units that are produced, but the more that is produced the less will be the price.
To be precise, the price per unit is determined as follows: P = 140 − (q + Q) as you can
also see in the lower-right box on your screen. In this part of the screen you will also find
your marginal costs, which indicate how much it costs you to produce each unit you sell.
Marginal costs are constant and there are no fixed costs, so marginal costs are equal to
average costs. Your profits are equal to revenue minus costs, that is, (P −MC)q.
To select your quantity for the period, you enter it in the lower-right part of your screen.
BUT NOT DO SO UNTIL I ASK YOU TO. After you have entered your quantity you
confirm your choice by pressing the OK button. The results from the present period will
be automatically shown in the upper-right part of your screen as soon as all sellers in
the room have made their quantity decision for the period. A new period will then start
immediately and without warning. If you want to keep track of the quantities, prices or
profits from previous periods, you have to record them yourself. For that purpose you can
use the empty sheet that is on your table.
At any time during the experiment you may check what profits you can expect to earn,
given various decisions by all of the sellers. This is done by using the profit calculator that
is located in the lower-left of the screen. For any possible values of the quantity of your
firm (q) and the total quantity of the other firms (Q) you can find your corresponding
profit. The computer will simply take the numbers you enter and compute the profit you
39

would make in that case. The result is shown in the upper-left of your screen. If you
change the number in either of the boxes, the computer will calculate a new profit. This
is the end of the instructions.
Some final remarks:
In order to give you an incentive at the end of the experiment, one of you will be selected
at random and paid a cash amount in accordance with the profits he or she has made,
where the reward will be 10 Euro if your profit are in line with those of the corresponding
Nash equilibrium.
40

References
Bosch-Domenesch, A. and Vriend, N. (2003). ‘Imitation of Succesful Behavior in Cournot
Markets’. Economic Journal, Vol. 113, pp.495-524
Engel (2007). ‘How Much Collusion? A Meta-analysis of Oligopoly Experiments’. Journal
of Competition Law and Economics, 3(4) pp.491-549
Huck,S., Normann, H. and Oechssler, J. (1999). ‘Learning in Cournot Oligopoly. An
Experiment’ Economic Journal, Vol. 109, C80-C95
Huck,S., Normann, H. and Oechssler, J. (2004a). ‘Two are few and four are many: number
effects in experimental economics’ Journal of Economic Behavior & Organization, Vol. 53,
pp.435-446
Huck,S., Normann, H. and Oechssler, J. (2004b). ‘Through Trial and Error to Collusion’
International Economic Review, Vol. 45, No.1
Mason, C. and Phillips, O. (1997). ‘Information and Cost Asymmetry in Experimental
Duopoly Markets’ Review of Economics and Statistics, 74, pp.290-299
Mason, C., Phillips, O. and Nowell, C.(1992) ‘Duopoly Behavior in Asymmetric Markets.
An Experimental Evaluation. Review of Economics and Statistics, vol.74, pp. 662-670
Offerman, T., Potters, J. and Sonnemans, J. (2002). ‘Imitation and Belief Learning in an
Oligopoly Experiment’. Review of Economic Studies, vol. 69, pp. 973.997
Selten, R. (1973). ‘A simple model of imperfect competition, where 4 are few and 6 are
many’. International Journal of Game Theory, Vol.2, No.1
41

Stigler G. (1964). ‘A Theory of Oligopoly’ The Journal of Political Economy, Vol.72 No.1
pp.44-61
Vega-Redondo, F. (1997). ‘The Evolution of Walrasian Behavior’. Econometrica, vol.65
No.2 pp. 375-384
42