Embed Size (px)
Citation preview
HAL Id: hal-01687662https://hal.archives-ouvertes.fr/hal-01687662
Preprint submitted on 18 Jan 2018
HAL is a multi-disciplinary open accessarchive for the deposit and dissemination of sci-entific research documents, whether they are pub-lished or not. The documents may come fromteaching and research institutions in France orabroad, or from public or private research centers.
L’archive ouverte pluridisciplinaire HAL, estdestinée au dépôt et à la diffusion de documentsscientifiques de niveau recherche, publiés ou non,émanant des établissements d’enseignement et derecherche français ou étrangers, des laboratoirespublics ou privés.
Terrorism, Colonialism and Voter Psychology: Evidencefrom the United Kingdom
Jamal Bouoiyour, Refk Selmi
To cite this version:Jamal Bouoiyour, Refk Selmi. Terrorism, Colonialism and Voter Psychology: Evidence from theUnited Kingdom. 2018. �hal-01687662�
1
Terrorism, Colonialism and Voter Psychology: Evidence from the
United Kingdom
Jamal BOUOIYOUR
CATT, University of Pau, France.
Email: [email protected]
Refk SELMI
ERNA, University of Tunis El Manar, Tunisia;
University of Pau, France.
Email: [email protected]
Abstract: Extant theory suggests that terrorist groups strategically plan their attacks around
elections. This study investigates the impact of terrorism on voting behavior in the United
Kingdom (UK). To address endogeneity concerns related to the possibility that terrorism may
be a response to the elections results, we have conducted an instrumental variables approach
that relies on the political participation of Commonwealth-origin migrant voters, taking into
account the fact that the strength of the Commonwealth’s commitment to its principles and
values - including the promotion of human and political rights, tolerance, respect for diversity,
coexistence, equity and fairness- may affect terror dynamics. In other words, we have
connected terrorism to colonial policies and practices. In fact, the colonial rulers had
established effective application of economic, social and cultural rights, as well as civil and
political rights which would contribute to the success of counter-terrorism strategies. The
results indicate that terrorism significantly affects the electorate’s preferences. We have also
found that the vote of the right-wing party is likely to be higher in localities near the home
base of a terror incident and in localities adjacent to international borders, and lower in cities
with a noticeable percentage of Muslims. The current UK economic conditions do not work to
the advantage of the right-wing party. The results are statistically significant and robust across
a multitude of model specifications and differing measures of terrorism.
Keywords: Terrorism; Colonialism; Voter behavior; Elections; the United Kingdom.
JEL Classification: H56; D74.
2
1. Introduction
According to the last edition of The Global Terrorism Index from the Institute for
Economics & Peace (IEP), the world has witnessed a rise by 69 percent in terrorist attacks
within a single year. Terrorism is viewed as the curse of our times, and researchers are
probing this common evil in several ways to find a remedy. After the attacks of September 11,
2001, a particular attention has been devoted to the historical and institutional causes, forms,
and strategies of terrorism, offering valuable insights into the link between terrorism and the
economy, the government policy, and the democratic freedoms; also into the determinants of
terrorism and the issues faced by governments in their efforts to counteract terrorism (see, for
example, Krueger and Laitin 2003; Krueger and Maleckova 2003; Berrebi 2007). So far, the
empirical research on the effects of terrorism on people’s evaluation of their political leaders’
performances remains rather limited (Davis and Silver 2004, Shambaugh and Josiger 2004,
Guilmartin 2004, Ludvigsen 2005). Several questions on this issue still need answers. In
particular, is terrorism a tactic to achieve political goals? How does the phantom threat of
terrorism influence voters’ preferences? Are voters more likely to support parties that favor
expanding heavier concessions to terrorists to prevent further violence? or are they more
likely to vote for parties that oppose concessions and that favor more aggressive policy
towards the perpetrators? Addressing these questions may have relevant implications for
conflict resolution and to understand better the role that plays terrorism as a political tool (in
particular, electoral terrorism). Research that concentrates on the exposure to terrorism and
political preferences has been mixed with some researches showing that terrorism leads voters
to accommodate terrorists’ demands more, and others revealing a hardening of attitudes in the
electorate. Various works documented a significant correlation between terrorism and the
voting behavior and the electoral opinions (Pape 2005; Berrebi and Klor 2008; Kibris 2011;
Montalvo 2011; Holmes and Gutiérrez de Pineres 2012; Robbins et al. 2013). These analyses
were concentrated on the cases of Israel (Ludvigsen 2005; Berrebi and Klor 2006; Fielding
and Penny 2006), Spain (Bali 2007), the U.S. (Guilmartin 2004; Shambaugh and Josiger
2004), and some European countries such as Spain (Bali 2007). Some of these researchers
found that right-wing incumbent parties receive more votes following terrorism (Berrebi and
Klor 2006; Berrebi and Klor 2008; Getmansky and Zeitzoff 2014). This also ties with Kbris
(2011) and Onreat et al. (2013); they deduced that to deal with terror threats there is a turn
toward right-wing attitudes. On the contrary, the terror attacks played a significant role on the
win of the Socialist Party over the Spanish 2004 elections (Bali 2007). Although the Israeli
case showed that the right-wing is likely to see its votes raise in the face of terrorist incidents,
3
according to Bali (2007) the Spanish case underscored that this support is still sensitive to
public approval of potential policy areas. This outcome was confirmed by Koch and Cranmer
(2007) and Williams et al. (2013) demonstrating that left-wing governments are less likely to
survive transnational terrorist attacks.
The aim of this essay is to investigate this claim and test whether terrorism is an effective
way to sway elections by delving into the last UK elections. The United Kingdom is one of
the unfortunate countries for which dealing with terrorism has long become the top priority
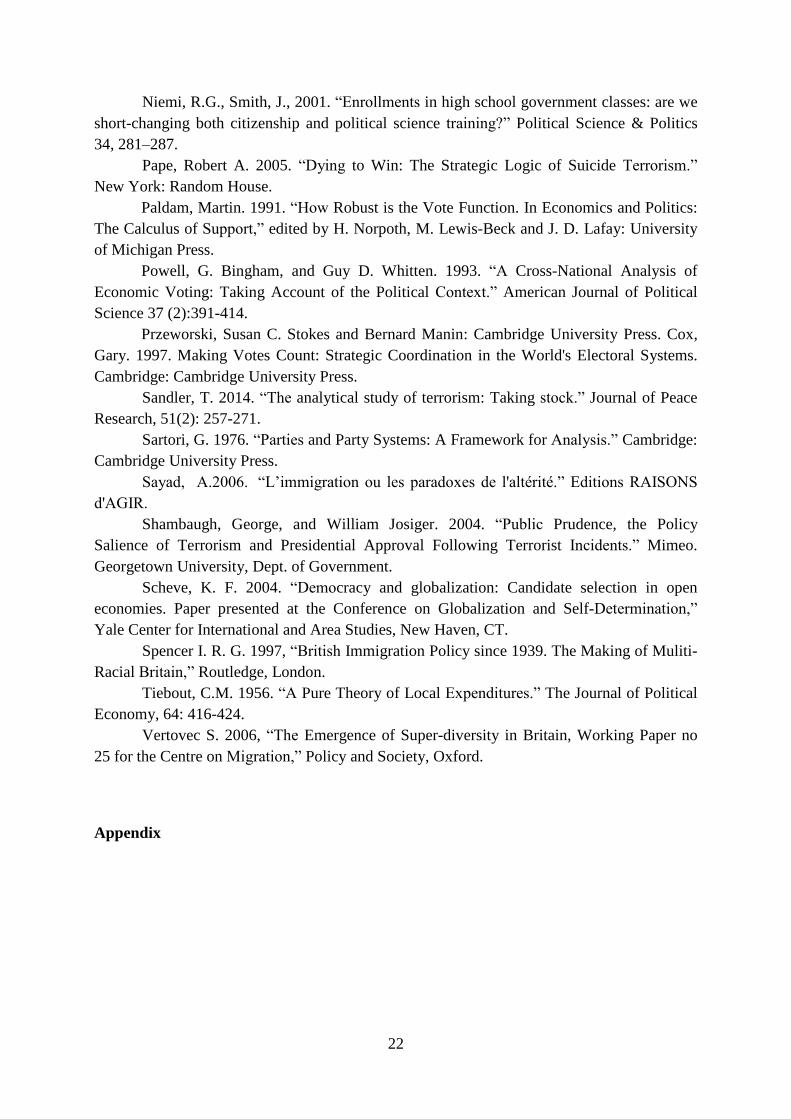
issue. Since 1970, the UK has faced the most deaths as a result of terrorism in Western
Europe totaling 3,395, followed by Spain with 1,261 deaths since 1970 according to data from
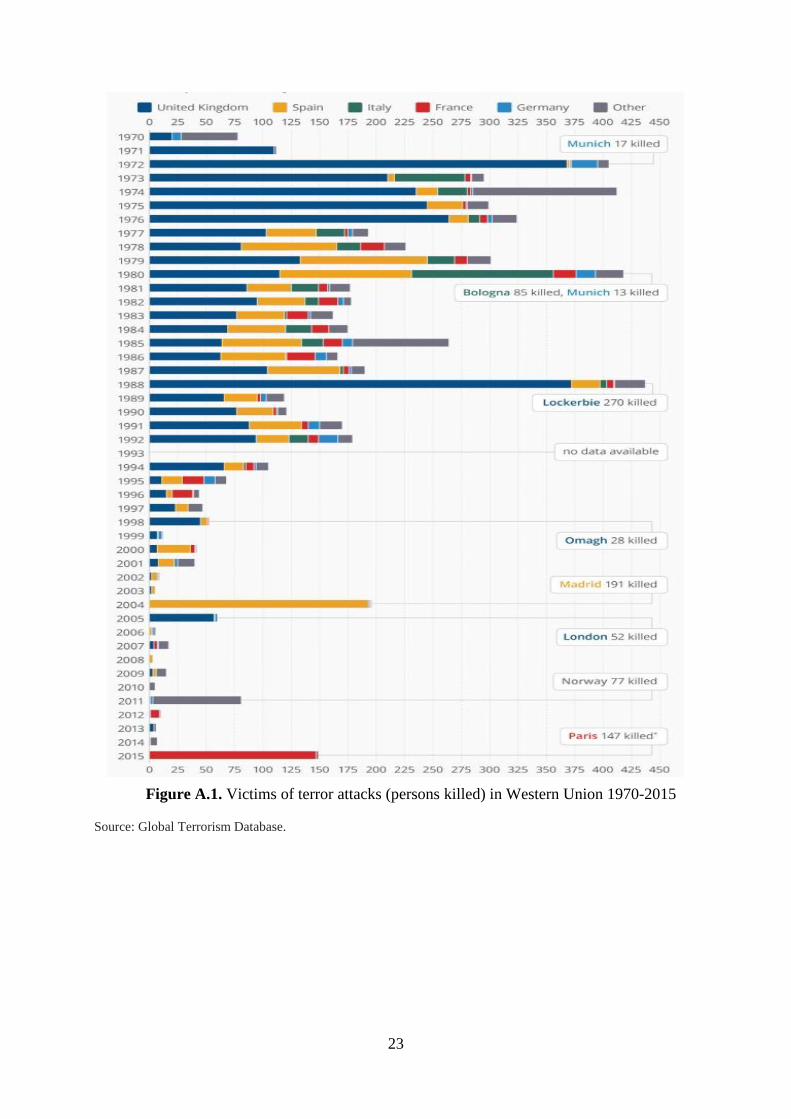
the Global Terrorism Database (see Figure A.1, Appendix). In 2017 and in particular after the
Manchester attack (22 May), the UK’s intelligence agency, increased its threat level from
severe to critical1. It is in this country that warnings about terrorism, nowadays, find the most
resonance with politicians, journalists and public alike. Following the terrorist incident at
Ariana Grande’s concert in Manchester and at London Bridge a few days later, it is clearer the
target is the general elections of June 8. Terrorism was and continues to be on the minds of
the UK public even before these last attacks. Based on a recent poll, many voters have
suggested that security and terrorism are the principal issue determining how they will vote.
Nevertheless, the voters had differing opinions on which party would deal with the issue
better and more seriously, with some saying they felt the Conservatives were stronger on
security and counter-terrorism strategy, and others asserting that Theresa May had failed as
Prime Minister. The present research utilizes the variation of terror attacks across time and
space to estimate the magnitude of the impact of terrorism on the electorate’s preferences
while focusing on the UK case. To causally identify the relationship between terrorism and
voting behavior, we have applied an instrumental variables approach using the number of
Commonwealth2 migrants eligible to vote as an instrument for terrorism. The organization
has continually emphasized its focus on adaptability, hence the idea is whether the
Commonwealth has adapted sufficiently to deal with terrorism predominant in the world
today. Our results provide strong empirical support for the hypothesis that the electorate
shows a sensitive response to terrorism. In particular, terrorism causes an important increase
1 For more details, Figure A.2 (Appendix) shows the history of the U.K.’s threat level since the warning system
was first introduced in 2006 to the last Bridge attack in June 3, 2017. 2 The Commonwealth of nations is an intergovernmental organization of 52 member states that are mostly
former territories of the British Empire, including (1) 16 members of the Commonwealth with Queen Elisabeth
II as the Head of State, known as “Commonwealth realms”, and (2) 31 republics with distinct heads of state and
(3) five monarchies with a dissimilar monarch.
4
on the support for the right wing of political parties. Furthermore, we have documented that
the right-wing party’s vote-share is 2 percentage points greater in localities near to the home
base of a terror incident, 9 to 11 percentage greater in localities with an international border,
and 7 to 10 percentage lesser in cities with wider Muslim share of the population. We have
also found that the electorate’s voting behavior depends on the socio-economic conditions,
while it seems insensitive to the education level.
We have structured the remainder of this research as follows. In Section 2, we describe the
methodology and the data. In Section 3, we summarize and discuss our findings and check
their robustness. In Section 4, we control for possible endogeneity problem. Section 5
provides some concluding remarks.
2. Methodology and data
2.1. The model
The present work empirically analyzes the strength of the effect of terrorism on the voting
behavior or the electorate’s preferences with special references to the case of United
Kingdom. A potential problem that emerges in any essay to investigate the impact of
terrorism on the voting behavior is that the estimates may be biased owing to the dynamic
interactions among the two variables: terrorist incidents may exert a significant impact on the
electorate’s preferences, but terrorism may also be a response to those political preferences.
This interaction precludes academics from effectively determining the effect of terrorism from
other shocks to the voters’ behaviors and beliefs by focusing only on time variation.
Specifically, the correlation between terrorism and the electorate’s preferences cannot be
interpreted as a measure of the magnitude of the electoral effects of terrorism. Adding to our
investigation the variation across space allows us to avoid the intrinsic difficulty of the task at
hand. Indeed, following Berrebi and Klor (2006), we use the variation of terror attacks across
time and space as an instrument to analyze the electoral impacts of terror incidents, even if we
control for possible time and location specific effects. The model we estimate for the
identification of the effect of terrorism on electoral outcomes is denoted as:
(Right Bloc Share)i,t = α(Terror Fatalities)i,t + β(Total Fatalities)t + γXi,t + ε i,t (1)
where (Right Bloc Share)i,t is the right-bloc share of the two-blocs vote in locality i in
elections t; (Terror Fatalities)i,t is the number of fatalities in locality i prior to the elections in
t; (Total Fatalities)t is the total number of terror fatalities in UK before elections t. Xi,t is a
vector of political, socio-economic and demographic control variables that vary across
5
localities and time. These variables include the net migration as percentage of voters, the
geographical distribution of terror fatalities (localities near to the home base of attacks,
localities with international border, regional capitals), and the attention to Brexit.
Based on related literature, α is expected to be significantly positive if localities within the
range have a higher right-wing vote-share than localities outside the range (in particular,
Berrebi and Klor 2006; Getmansky and Thomas Zeitzoff 2008). A terrorist incident triggers
residents of a locality to change their daily routine as a result of insecurity and change in their
behavior toward peace. Terror attacks may also exert a significant influence on the locality’s
economy and its residents’ future income (Gordon and Arian 2001). However, a negative and
statistically significant α would imply that localities within the range of terror attacks are less
supportive of right-wing bloc, and more supporting of left-wing parties. An α coefficient that
is not significant means that being in the range of terrorist incidents does not impact voting
behavior. β measures the local electoral impact of terror attacks committed in other localities.
A positive coefficient may be explained even partially by the policies proposed by parties in
the right bloc won it new supporters after terrorist incidents. If the coefficient is negative, it
may be due to the fact that national casualties from terrorism and voters’ disapproval of the
policies proposed by the right bloc prompted an erosion of its support (Berrebi and Klor
2008). The net migration share of the population is incorporated to control for Tiebout’s
(1956) hypothesis. Based on this hypothesis, voters sort themselves out between the different
localities according to their preferences. Adding the net migration share of each locality’s
population enables us to differentiate migration of voters to localities that do not suffer terror
attacks from the hypothesis assuming that voters change their preferences. Further, Berrebi
and Klor (2008) argued that the electoral support for the right bloc drops with the distance of
the locality to the home base of a terror attack and in localities with an international border.
However, the support for the right-wing party rises in regional capitals and with population
density. It is very important to assess the response of electorate’s preferences to the
geographical distribution of terrorist incidents. For instance, if localities that are near to the
home base of terrorist attack are similar to those out of the range of attacks, then any
differences in voting can be attributed to living in the range of terror attacks. Assessing
similarity between within and out of the terror range localities is also prominent to avoid
possible extrapolation bias (King and Zeng 2006). As mentioned above, many factors shape
elections including migration, terrorism as well as healthcare but the UK general election was
also dominated by the Brexit vote. The left wing party (Labour) has no clear policy on Brexit
and offers a far-left, highly interventionist economic platform. However, the victory of the
6
right-wing party or Conservative constituency could raise the risk of a hard Brexit (Berenberg
2017). A positive Brexit’s coefficient means that the electorate supports the right bloc win
which is in favour of hard Brexit, while a negative coefficient would raise the possibility of
softer Brexit strategy.
2.2. Data
Our focal variable of interest is the vote share for the different political parties during the
last national parliamentary elections in UK. The available electoral data provided by the
Office of National Statistics contain the total number of eligible voters and the support for
each political party in the parliamentary elections of 2017. This information is available at the
level of the polling station, thus offering a very detailed data set. To determine the electoral
preferences of each locality, we have divided the political parties with representatives in the
parliament into the Conservative Party on the right and the Labour on the left (i.e., the two
main parties of UK). Statistics on terrorism are collected from the Office of the National
Coordinator of Terrorist Investigations. The available data set on terror attacks contain daily
information on every terrorist incident that caused the death of at least one non-combatant that
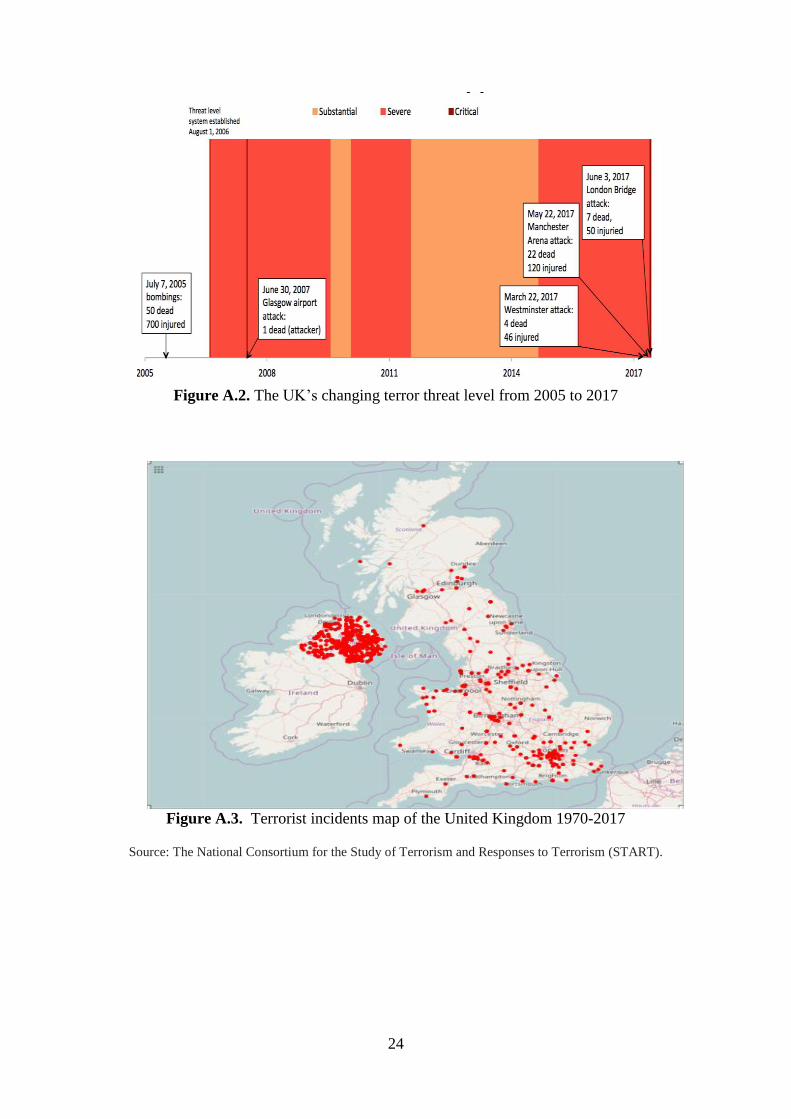
occurred in the UK between January 1, 2017 and June 8, 2017. We have assigned each terror
incident in the database to one of the localities, according to the geographic location of the
attack, by employing Geographic Information System (GIS) and information from the
National Consortium for the Study of Terrorism and Responses to Terrorism. The
geographical distribution of terrorist fatalities during the time period of interest appears in
Figure A.3 (Appendix). Thereafter, we have determined for each locality its mean relative
support for the right bloc of parties (we focus here on conservatives’ party) over the last
parliamentary elections at issue. This measure offers information about the localities’
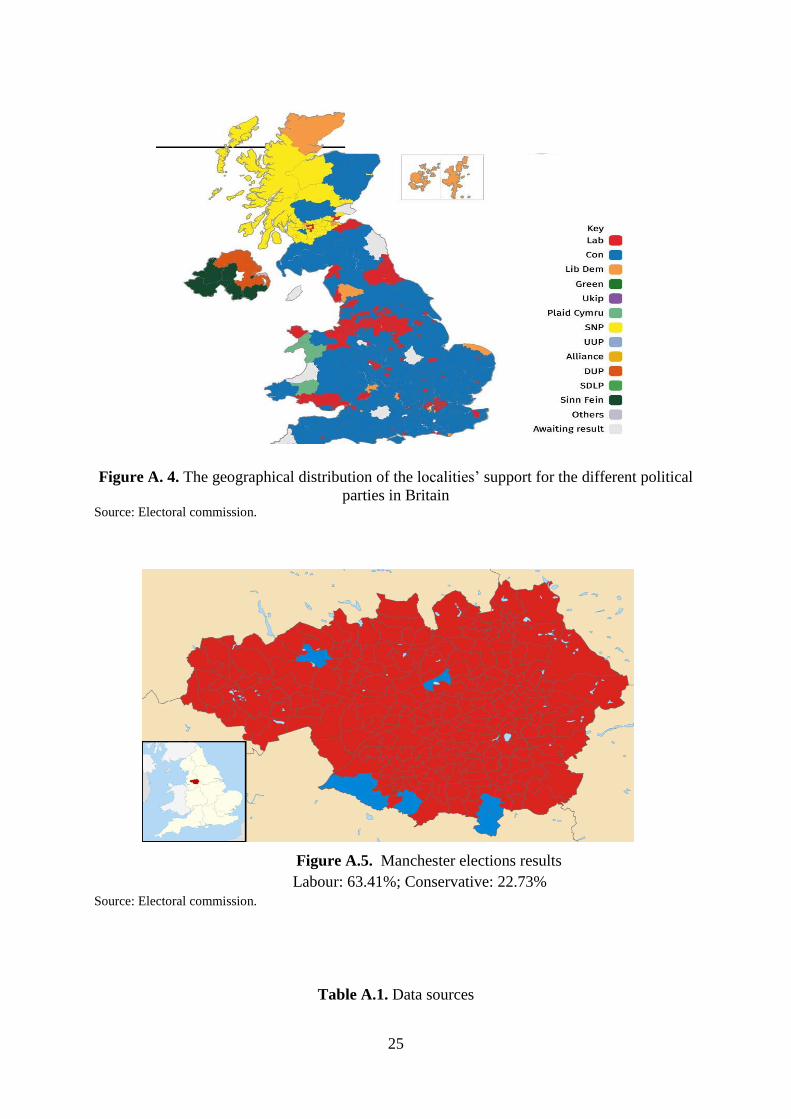
electorate preferences. The map in Figure A.4 describes the distribution of the localities’
support for the different UK political parties. We can note from the map that there is a sharp
difference with respect the support for the right wing parties among cities that were attacked
and the rest. The detailed data are available at Electoral commission and Data for UK 2017
General Election Results (Economist Infographic). What is surprising is that the localities
which suffered most from terrorist incidents, just prior to the elections (for example,
Manchester), show a larger support for the left wing (Labour), inconsistently with the
literature suggesting that terrorism can raise the support for the right wing(see Figure A.5,
Appendix). We have also incorporated further potential political, socio-economic and
demographic variables into the investigation. Specifically, the analysis includes the distance
7
of locality to the terrorist home base during the period under study, and dummy variables for
localities considered as regional capitals and localities that have an international border.
Besides, we have integrated the net migration for each locality. We define the net migration as
the total number of citizens that moved into a locality (including new immigrants) minus the
total number of citizens that left the locality in a given year. The migration data are collected
from the Office of National Statistics (ONS). Also, we have included the size of
the population who is entitled to vote. Electoral statistics are gathered by ONS and represent
the most accurate count possible of the number of people on electoral registers each year. Due
to the great criticism for lacking clarity on Brexit negotiating strategy under Theresa May’s
government, the way in which Brexit has received interest in web is incorporated in this
study, i.e., the search queries index for keyword “Brexit” has been retrieved from Google
Trends. The data on electoral results and terror fatalities as well as the demographic,
economic and geographic indicators are available at the locality level for the UK. Time series
are expressed in natural logarithm to lessen fluctuations in the data set and to correct for
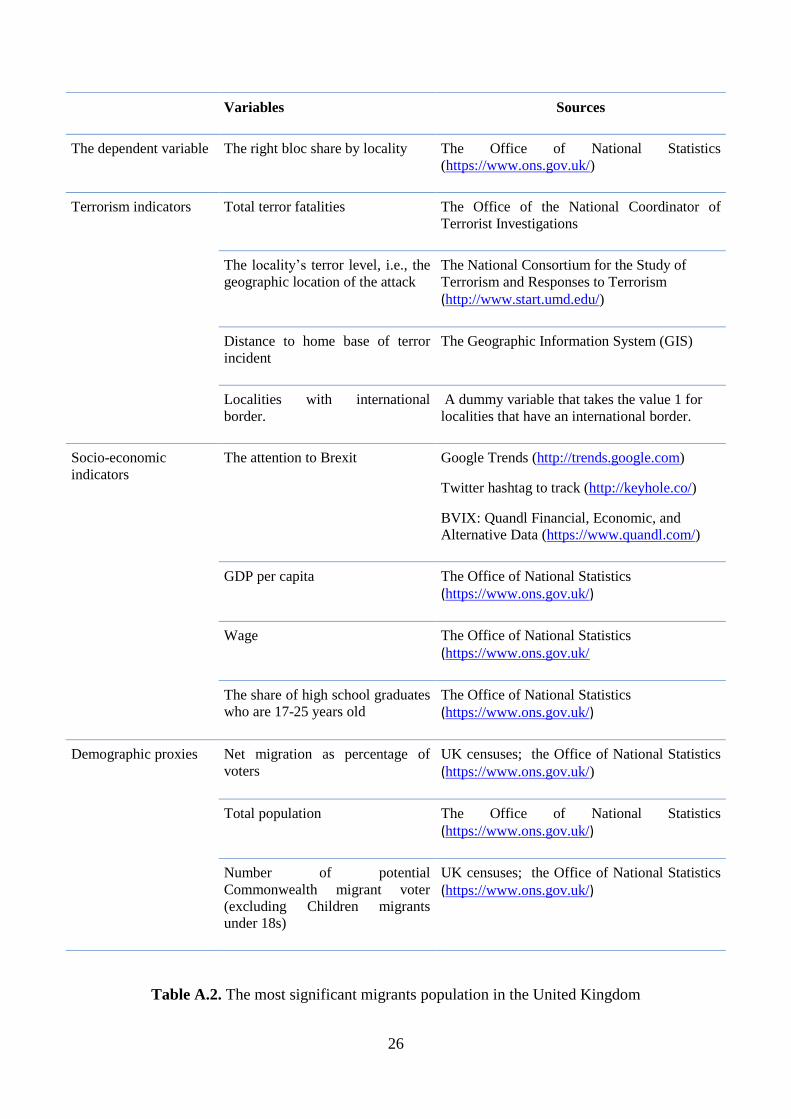
potential heteroskedasticity and dimensional differences among variables. Table A.1
(Appendix) reports all the data used and their source links.
3. Results
3.1. Baseline model
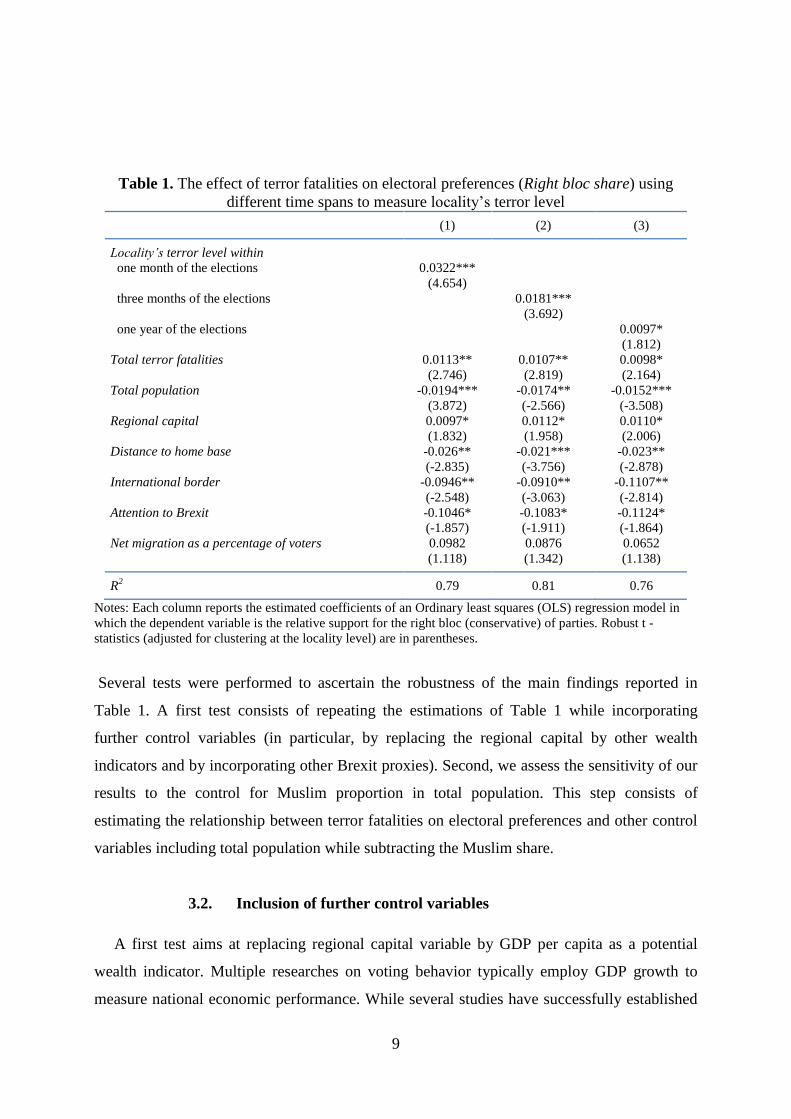
To empirically assess the effects of terrorism on voting behavior, our strategy consists of
regressing the political preferences (proxied by the right bloc share for each locality) on the
locality’s terror level and the total terror fatalities, even if we account for socio-economic
indicators. To establish our empirical framework, we combined the necessary data on
electoral outcomes and terror fatalities with data on economic, geographic and demographic
indicators that are available at the locality level in UK (see Table A.1, Appendix). Table 1
displays the estimation of the effects of terror fatalities on the preferences of the electorate as
specified in the equation (1). Column 1 reports the results of a specification accounting for the
terror level within one month of the elections. Column 2 offers the outcomes of the
specification considering the terror attacks occurred within 3 months of the elections, while
column 3 reports the findings of the regression of electorate’s preferences on the locality’s
terror level within one year of the elections. We show that the occurrence of a terror fatality
within one month of the elections is associated with a 0.32 percentage points increase in the
locality’s relative electoral support for the right bloc of political parties. This effect appears
8
stronger compared to the elections within three months and one year of the elections. Three
attacks happened in the UK during the time period at issue. Thus, one terror attack contributes
roughly to an increase of 0.96 percentage points in the relative support for the right wing.
Given that the UK electorate is mainly split between the right and left wings (conservative
and labour, respectively), the aftermath of a terrorist incident just prior to the election
significantly determine the electoral results.
By assessing the effect of total terror fatalities on voting behavior, we have noticed that a
terror fatality has significant electorate effects beyond the locality where it is perpetrated.
Moreover, we have found that the electoral support for the right wing drops with locality’s
population, the distance of the locality to the home base of a terror incident and in localities
with an international border. However, the support for the right wing rises in regional capitals
and depending to the net migration as a percentage of voters. Our results reveal that the net
migration does not significantly influence the political preferences of the electorate after a
terror incident. This implies that the local electoral impact of terror fatalities is not
significantly determined by the voters changing their localities of residence- consistently with
Tiebout hypothesis. The findings also reveal that Brexit is dominating the election or more
accurately Brexit is likely to decide the election outcome rather than security concern. The
obtained findings reveal that the particular attention toward Brexit is associated with a sharp
decrease on the support for the right wing in favor of the left-wing party. The victory of left
wing in the elections means that the Brexit would still go ahead. The labour party supported
that the UK may attempt to go back to the negotiating table to discuss a better deal concerning
Brexit. It must be mentioned that unlike the conservative party, the labour party has a
tendency toward an open, business-friendly, low-regulated economy, and then they are
against a “hard Brexit” and then a second referendum on the terms of any deal is possible if
they win.
9
Table 1. The effect of terror fatalities on electoral preferences (Right bloc share) using
different time spans to measure locality’s terror level
(1) (2) (3)
Locality’s terror level within
one month of the elections
three months of the elections
one year of the elections
Total terror fatalities
Total population
Regional capital
Distance to home base
International border
Attention to Brexit
Net migration as a percentage of voters
0.0322***
(4.654)
0.0113**
(2.746)
-0.0194***
(3.872)
0.0097*
(1.832)
-0.026**
(-2.835)
-0.0946**
(-2.548)
-0.1046*
(-1.857)
0.0982
(1.118)
0.0181***
(3.692)
0.0107**
(2.819)
-0.0174**
(-2.566)
0.0112*
(1.958)
-0.021***
(-3.756)
-0.0910**
(-3.063)
-0.1083*
(-1.911)
0.0876
(1.342)
0.0097*
(1.812)
0.0098*
(2.164)
-0.0152***
(-3.508)
0.0110*
(2.006)
-0.023**
(-2.878)
-0.1107**
(-2.814)
-0.1124*
(-1.864)
0.0652
(1.138)
R2 0.79 0.81 0.76
Notes: Each column reports the estimated coefficients of an Ordinary least squares (OLS) regression model in
which the dependent variable is the relative support for the right bloc (conservative) of parties. Robust t -
statistics (adjusted for clustering at the locality level) are in parentheses.
Several tests were performed to ascertain the robustness of the main findings reported in
Table 1. A first test consists of repeating the estimations of Table 1 while incorporating
further control variables (in particular, by replacing the regional capital by other wealth
indicators and by incorporating other Brexit proxies). Second, we assess the sensitivity of our
results to the control for Muslim proportion in total population. This step consists of
estimating the relationship between terror fatalities on electoral preferences and other control
variables including total population while subtracting the Muslim share.
3.2. Inclusion of further control variables
A first test aims at replacing regional capital variable by GDP per capita as a potential
wealth indicator. Multiple researches on voting behavior typically employ GDP growth to
measure national economic performance. While several studies have successfully established
10
a significant linkage between economic performance and voter intent, some researchers have
failed to find a solid relationship between electoral preferences and economic outcomes
(for instance, Paldam 1991; Cheibub and Przeworski 1999). Others do not dispute the linkage
among voting behavior and the economy, but they disagree on how voters judge the economy.
Some perceive voters as completely myopic (Kramer 1971; Paldam 1991), whereas some
other academics suggest that voters are more sophisticated and base their voting decision by
accounting for long periods of information (see for example, Peltzman 1990). And another
economic approach based on Bayesian framework remains, suggesting that voters’ vision is
vulnerable on how much “noisiness” or economic instability they witnessed in the past. This
implies that voters will be short-sighted if they underwent great economic instability in the
past, and longer sighted if the economic changes were low (see for instance, Magaloni 1997).
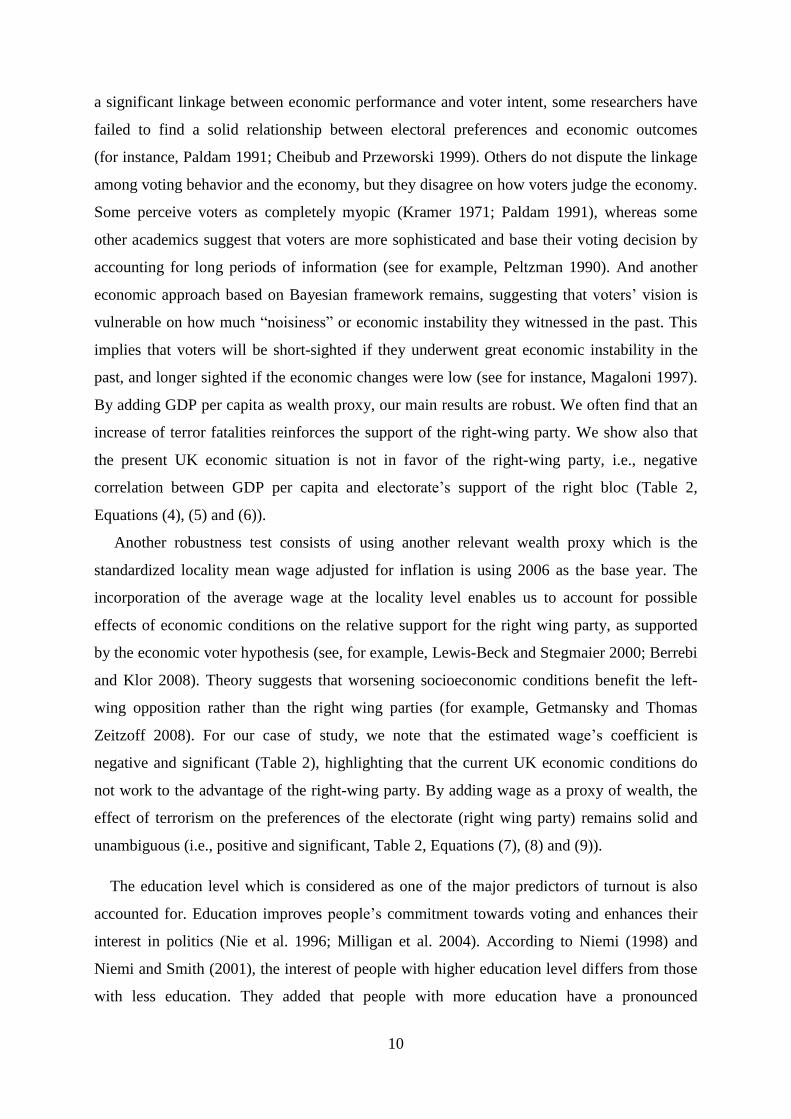
By adding GDP per capita as wealth proxy, our main results are robust. We often find that an
increase of terror fatalities reinforces the support of the right-wing party. We show also that
the present UK economic situation is not in favor of the right-wing party, i.e., negative
correlation between GDP per capita and electorate’s support of the right bloc (Table 2,
Equations (4), (5) and (6)).
Another robustness test consists of using another relevant wealth proxy which is the
standardized locality mean wage adjusted for inflation is using 2006 as the base year. The
incorporation of the average wage at the locality level enables us to account for possible
effects of economic conditions on the relative support for the right wing party, as supported
by the economic voter hypothesis (see, for example, Lewis-Beck and Stegmaier 2000; Berrebi
and Klor 2008). Theory suggests that worsening socioeconomic conditions benefit the left-
wing opposition rather than the right wing parties (for example, Getmansky and Thomas
Zeitzoff 2008). For our case of study, we note that the estimated wage’s coefficient is
negative and significant (Table 2), highlighting that the current UK economic conditions do
not work to the advantage of the right-wing party. By adding wage as a proxy of wealth, the
effect of terrorism on the preferences of the electorate (right wing party) remains solid and
unambiguous (i.e., positive and significant, Table 2, Equations (7), (8) and (9)).
The education level which is considered as one of the major predictors of turnout is also
accounted for. Education improves people’s commitment towards voting and enhances their
interest in politics (Nie et al. 1996; Milligan et al. 2004). According to Niemi (1998) and
Niemi and Smith (2001), the interest of people with higher education level differs from those
with less education. They added that people with more education have a pronounced
11
allegiance to the political system and to affirm this allegiance vote participation is crucial. In
the same context, Nesbitt-Larking (1992) showed that for the case of the United States, people
with a college degree are twice more likely to vote than people with only a grammar school
degree or less. We have tried to test this evidence for the case of the UK by controlling for the
share of high school graduates who are 17-25 years old in each locality-year. In doing so, we
have found that there is no significant effect of education on electorate preferences in the UK
(Table 2), inconsistently with the results for other countries like the United States. This may
be attributed to the fact that Britain has a socialist party with mechanism to mobilize the vote
of working class, compensating thus for low education levels (Nesbitt-Larking 1992). But
what is important from our results is that the impact of terrorism on the preferences of the
electorate is fairly robust to the inclusion of these variables. Specifically, we confirm that
terror fatalities exert a positive influence on the voting behavior favoring therefore the right-
wing party, especially within one month of terror incident (Table 2, Equations (10), (11) and
(12)).
Table 2. The effect of terror fatalities on electoral preferences (Right bloc share) after
including further control variables
(4) (5) (6) (7) (8) (9) (10) (11) (12)
Locality’s terror level within
one month of the elections
three months of the elections
one year of the elections
Total terror fatalities
Total population
GDP per capita
Wage
Education
Distance to home base
International border
Attention to Brexit
Net migration as a percentage
of voters
0.0411***
(3.9124)
0.01092**
(2.3891)
-0.00871
(-1.1158)
-0.0071**
(-2.6193)
-0.00100*
(-1.6999)
-0.0233**
(-2.3456)
-0.091***
(-3.1789)
0.01256
(1.0875)
0.0192***
(3.6124)
0.01045*
(1.9762)
-0.0096**
(-2.4983)
-0.00855*
(-1.9643)
-0.00087*
(-1.7541)
-0.0231**
(-2.5539)
-0.1153*
(-1.9246)
0.00853
(1.2210)
0.011672**
(2.8134)
0.01015**
(2.43561)
-0.0084*
(-1.9436)
-0.00866**
(-2.5928)
-0.00063*
(-1.8054)
-0.02456**
(-2.4097)
-0.11678**
(-2.8134)
0.00817
(1.0095)
0.03215**
(2.4567)
0.01019**
(2.5634)
-0.01034*
(-1.8324)
-0.01668*
(-1.8732)
-0.00042*
(-1.7652)
-0.04693*
(-1.9542)
-0.1195**
(-2.7183)
0.00131*
(1.9564)
0.02456**
(2.6029)
0.01045*
(1.9762)
-0.01106*
(-1.7693)
-0.01654*
(-1.95432)
-0.00049*
(-1.8041)
-0.04128*
(-1.9163)
-0.1153*
(-1.9246)
0.00221*
(1.8356)
0.01368*
(1.9654)
0.01015**
(2.43561)
-0.0101**
(-2.5326)
-0.01573*
(-1.77321)
-0.0003**
(-2.3145)
-0.03628*
(-1.8745)
-0.1167**
(-2.8134)
0.00186**
(2.4394)
0.02861*
(1.9355)
0.0124*
(1.7128)
-0.01034*
(-1.8324)
0.05214
(1.2368)
-0.0032**
(-2.5075)
-0.07113*
(-1.7715)
-0.12142*
(-1.9013)
0.01345
(1.4246)
0.01308*
(1.8769)
0.0098*
(1.8655)
-0.01106*
(-1.7693)
0.03456
(1.3782)
-0.0028*
(-1.9235)
-0.06821*
(-1.8954)
-0.11462*
(-1.7385)
0.0361
(1.4368)
0.0046**
(2.3861)
0.01131*
(1.7692)
-0.01015**
(-2.4056)
0.026571
(1.4765)
-0.0021*
(-1.769)
-0.07214*
(-1.7658)
-0.11345**
(-2.5110)
0.00121*
(1.7732)
R2 0.81 0.80 0.80 0.86 0.82 0.80 0.89 0.87 0.88
Notes: Each column reports the estimated coefficients of an Ordinary least squares (OLS) regression model in which the
dependent variable is the relative support for the right bloc (conservative) of parties. Robust t -statistics (adjusted for
clustering at the locality level) are in parentheses.
12
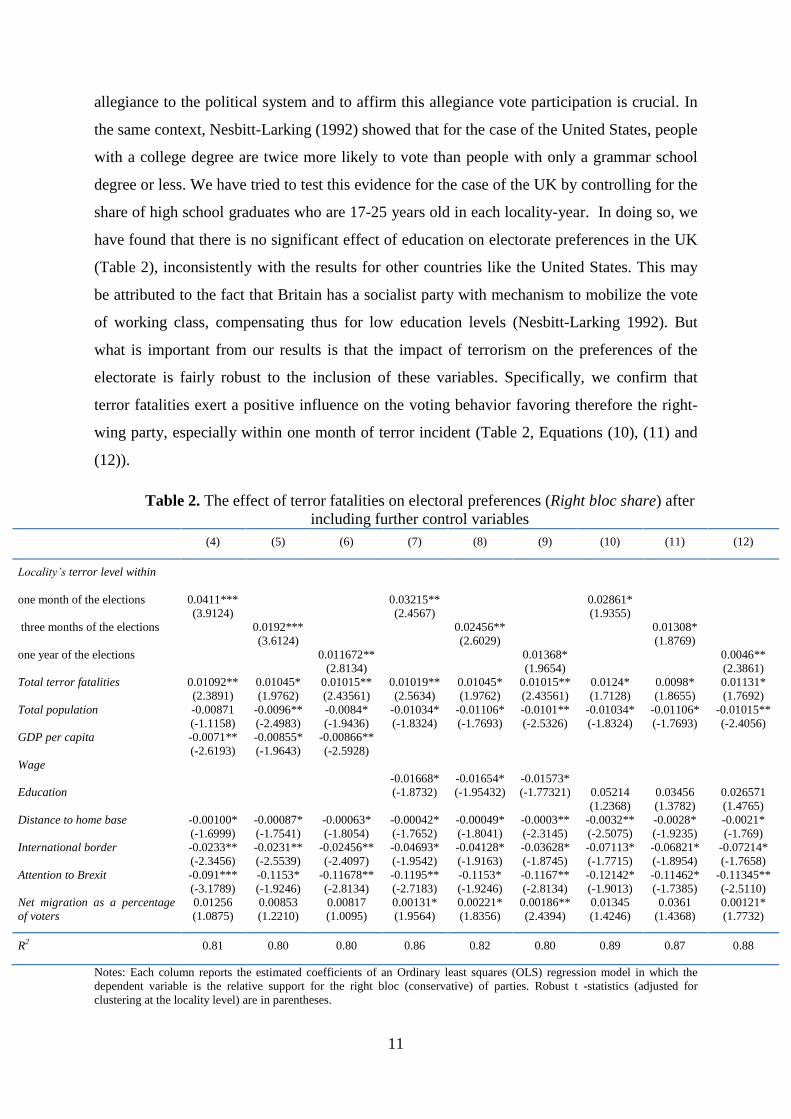
Furthermore, we have re-examined the correlation between terrorism and electorate’s
preferences while replacing the uncertainty surrounding the Brexit vote by other proxies
(twitter search). In addition to Twitter, we have used another indicator which is the British
Volatility Index (BVIX). The interest here is to use a more appropriate index that reflects
more adequately the Brexit fears. It must be stressed at this stage that the volatility index is a
sentiment indicator that allows determining when there is too much optimism or great anxiety
in the market. Also, we should point out that VIX responds sensitively to all events (reflecting
both economic and geopolitical issues) that may cause uncertainty, and the Brexit is no
exception. Our results displayed in Table 3 confirm that the great anxiety over Brexit is linked
to a drop of the support for the right-wing party and then towards “hard Brexit”. Our findings
also indicate sharp distinguishability among Googlers (Table 1, Equations (1), (2) and (3)),
Twitter users (Table 3, Equations (13), (14), (15)) and volatility traders (Table 5, Equations
(16), (17), (18)). Despite considerable support for the claim that computing indicators of the
public’s sentiment from large-scale online data may be useful and meaningful to reflect public
sentiment and mood and to predict a variety of phenomena, the British VIX index can explain
better the voting behavior, since it may reflect more largely the existing news and even the
hidden information driving the British market (Mao et al. 2011).
Table 3. The effect of terror fatalities on electoral preferences (Right bloc share) after
including other Brexit proxies
(13) (14) (15) (16) (17) (18)
Locality’s terror level within
one month of the elections
three months of the elections
one year of the elections
Total terror fatalities
Total population
Regional capital
Distance to home base
International border
Attention to Brexit (Twitter)
Attention to Brexit (BVIX)
Net migration as a percentage of
voters
0.03456*
(1.87652)
0.01125**
(2.8314)
-0.00923*
(-1.7653)
-0.0415**
(-2.5421)
-0.0009*
(-1.8934)
-0.0651**
(-2.4789)
-0.09978*
(-1.7695)
0.15689
(1.1768)
0.01532**
(2.4578)
0.01452**
(2.8132)
-0.01045*
(-1.9123)
-0.03246*
(-1.9432)
-0.0018**
(-2.9235)
-0.0432**
(-2.3144)
-0.0812**
(-2.6511)
0.10152
(1.2861)
0.011232**
(2.3418)
0.01239*
(1.8854)
-0.01092**
(-2.5098)
-0.01135***
(-3.4672)
-0.001246*
(-1.8124)
-0.04157*
(-1.9123)
-0.06235**
(-2.4122)
0.09324
(1.6513)
0.041562*
(1.8754)
0.00982*
(1.7145)
-0.01034*
(-1.8324)
-0.01157*
(-1.8832)
-0.001***
(-3.8762)
-0.04167*
(-1.8011)
-0.1098**
(-2.7410)
-0.05124
(-1.3986)
0.01269**
(1.9143)
0.00913*
(1.7735)
-0.01106*
(-1.7693)
-0.0196**
(-2.3892)
-0.0013**
(-2.6144)
-0.0513**
(-2.4419)
-0.1013**
(-2.3946)
0.0361
(1.4368)
0.02131**
(2.4193)
0.00981**
(2.2456)
-0.01157*
(-1.9432)
-0.19884*
(-1.9145)
-0.00116**
(-2.6134)
-0.04981*
(-1.9473)
-0.10621**
(-2.7189)
0.02456
(1.6189)
R2 0.85 0.81 0.83 0.79 0.77 0.81
13
Notes: Each column reports the estimated coefficients of an Ordinary least squares (OLS) regression model in which the
dependent variable is the relative support for the right bloc (conservative) of parties. Robust t -statistics (adjusted for
clustering at the locality level) are in parentheses.
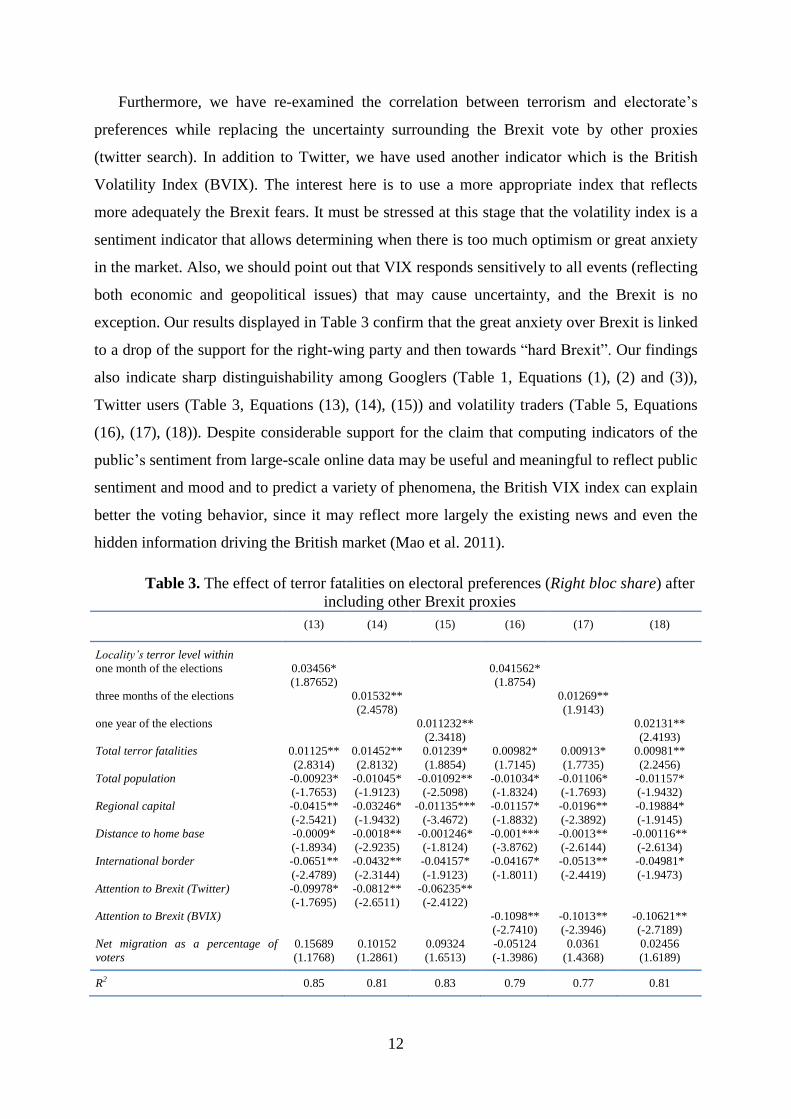
3.3. Control for the Muslim proportion in total population
Due to the surge of Islamophobia in Britain, it is important to assess the Muslim
participation in the last UK elections. In general, the relationship between the left wing party
(in particular, the Labour party) and Muslim communities in the UK has always been very
strong. The majority of Muslims who are members of political parties are likely to be related
to the Labour party. The major parties often attempt to appeal to a Muslim electorate via their
policies and candidates. Nonetheless, the Muslim vote is inaccurate with respect a
homogenous voting bloc. British Muslim voters are always split depending to various
cleavages whether regarding family ties, theological affiliations or other kinds of socio-
economic cleavages that separate Muslim voters (Timothy 2012). The results displayed in
Table 4 (Equations (19), (20) and (21)) indicate that localities with more pronounced
percentage of Muslims are less likely to increase their support for the right bloc of parties in
the onset of a terror attack. These results can be a reflect of the lack of trust between the
rightist government and Muslim community in Britain. Notably, the British Muslim
community was alienated by the main political parties over the last elections. Several analysts
asserted that holding the general elections during Ramadan implies that there could be a
disproportionate influence on voter turnout in constituencies with large Muslim population.
Table 4. The effect of terror fatalities on electoral preferences (Right bloc share) after
excluding Muslims from the total population
(19) (20) (21)
Locality’s terror level within
one month of the elections
three months of the elections
one year of the elections
Total terror fatalities
Total population excluding Muslims
Regional capital
Distance to home base
International border
Attention to Brexit
Net migration as a percentage of voters
0.0456**
(2.897)
0.0125***
(3.634)
-0.0095**
(-2.819)
0.0068**
(2.751)
-0.0195***
(-3.610)
-0.0819***
(-3.726)
-0.1156**
(-2.594)
0.1345
0.0283**
(2.765)
0.0113***
(4.109)
-0.00942***
(-3.558)
0.0091**
(2.314)
-0.0211**
(-2.793)
-0.0765**
(-2.634)
-0.1132*
(-1.886)
0.1024
0.0172***
(3.458)
0.0111***
(3.518)
-0.00873**
(-2.915)
0.0084**
(2.523)
-0.0204**
(-2.881)
-0.0883**
(-2.711)
-0.1108**
(-2.449)
0.1125
14
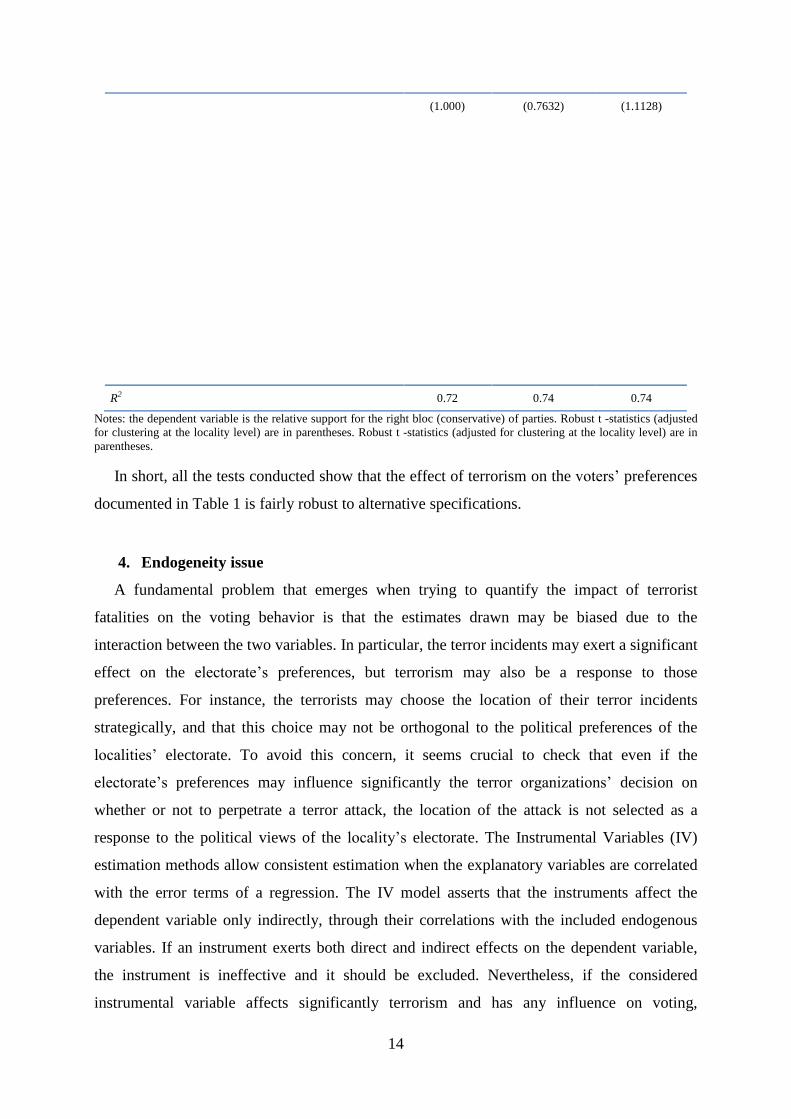
(1.000) (0.7632) (1.1128)
R2 0.72 0.74 0.74
Notes: the dependent variable is the relative support for the right bloc (conservative) of parties. Robust t -statistics (adjusted
for clustering at the locality level) are in parentheses. Robust t -statistics (adjusted for clustering at the locality level) are in
parentheses.
In short, all the tests conducted show that the effect of terrorism on the voters’ preferences
documented in Table 1 is fairly robust to alternative specifications.
4. Endogeneity issue
A fundamental problem that emerges when trying to quantify the impact of terrorist
fatalities on the voting behavior is that the estimates drawn may be biased due to the
interaction between the two variables. In particular, the terror incidents may exert a significant
effect on the electorate’s preferences, but terrorism may also be a response to those
preferences. For instance, the terrorists may choose the location of their terror incidents
strategically, and that this choice may not be orthogonal to the political preferences of the
localities’ electorate. To avoid this concern, it seems crucial to check that even if the
electorate’s preferences may influence significantly the terror organizations’ decision on
whether or not to perpetrate a terror attack, the location of the attack is not selected as a
response to the political views of the locality’s electorate. The Instrumental Variables (IV)
estimation methods allow consistent estimation when the explanatory variables are correlated
with the error terms of a regression. The IV model asserts that the instruments affect the
dependent variable only indirectly, through their correlations with the included endogenous
variables. If an instrument exerts both direct and indirect effects on the dependent variable,
the instrument is ineffective and it should be excluded. Nevertheless, if the considered
instrumental variable affects significantly terrorism and has any influence on voting,
15
consistent results may be obtained. For our case of study, to account for possible reverse
causality between terrorism and voting behavior, we have used an IV approach that relies on
the participation of Commonwealth-origin migrant voters in the elections, considering the fact
that terrorism does not comply with multicultural model based on the respect of human and
political rights of migrants, tolerance and diversity.
The changing size and composition of the migrant population across the UK during the
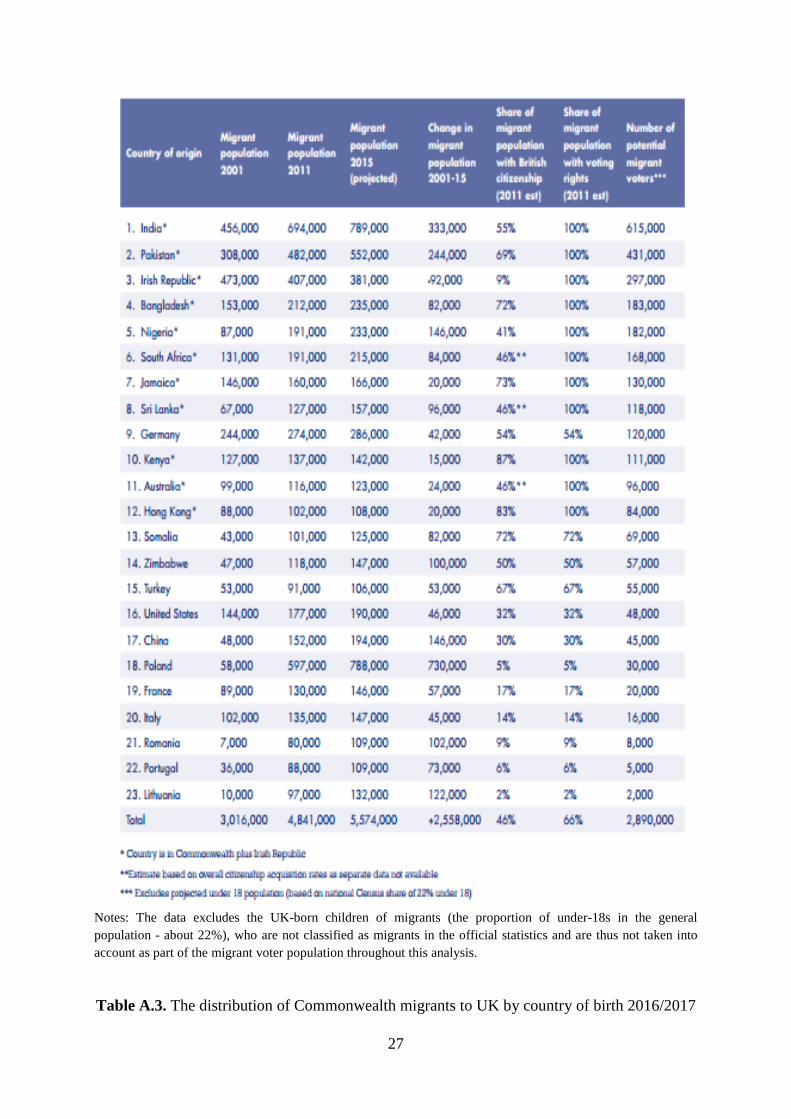
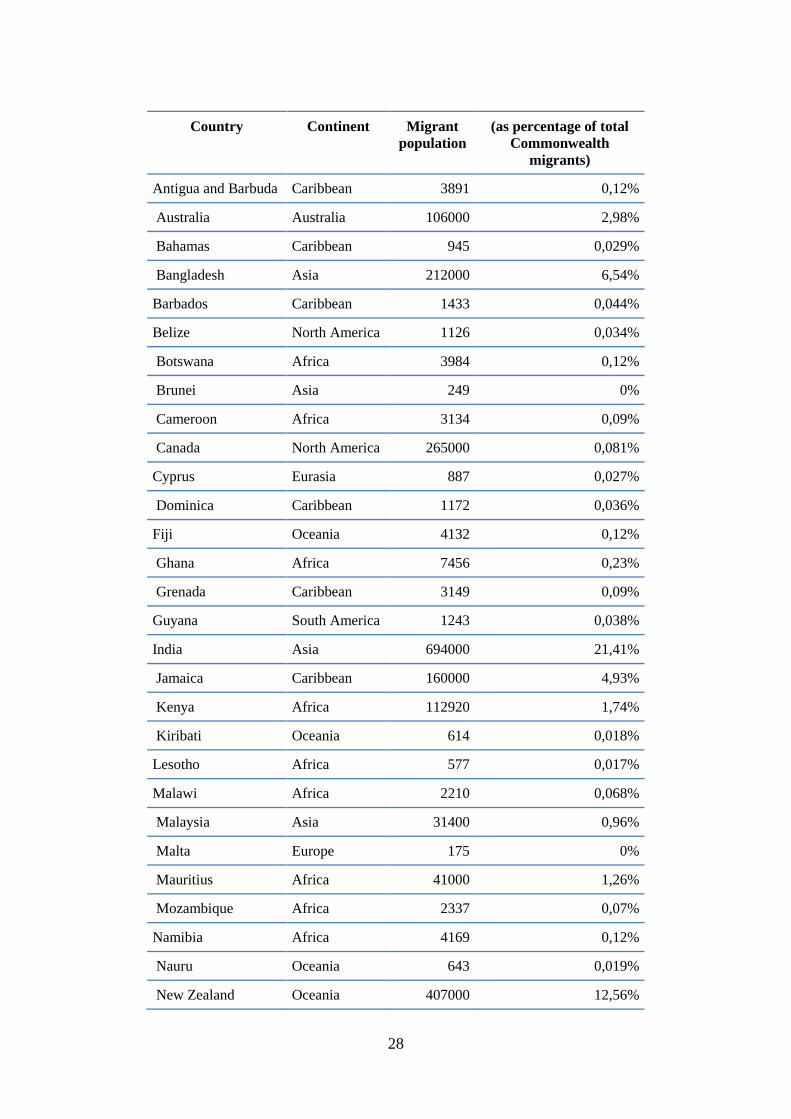
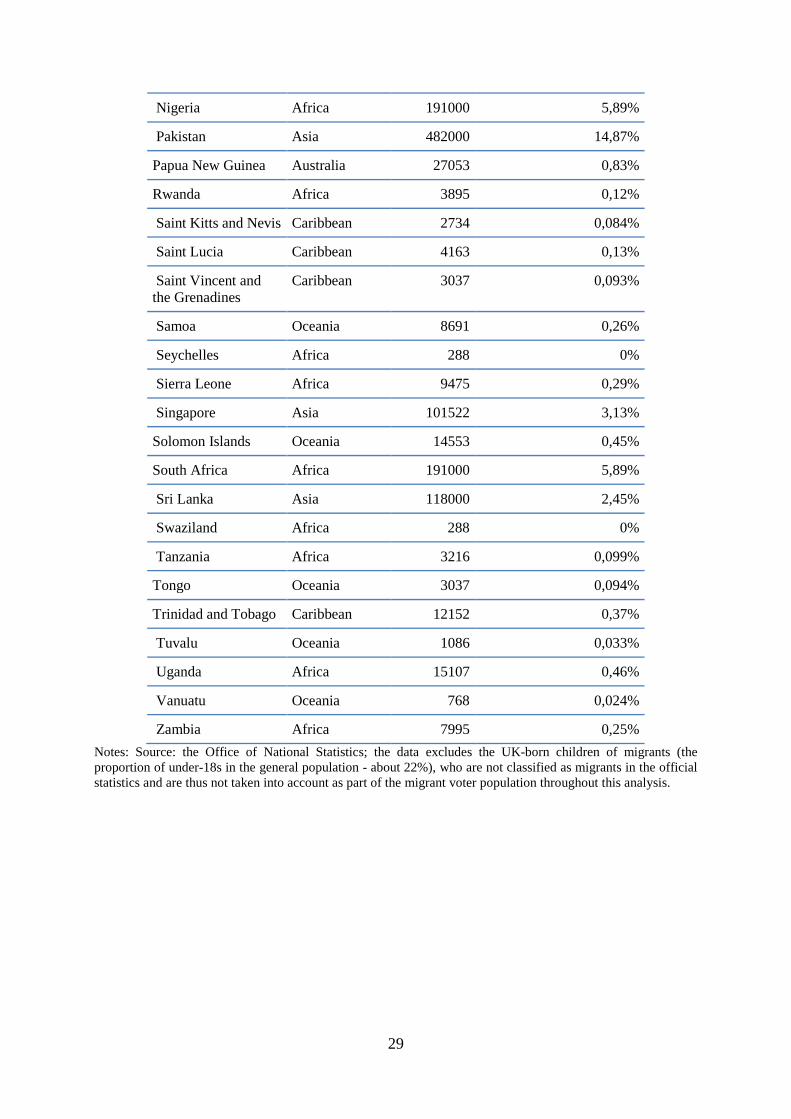
past years has had potential effects on the migrant voter base. The data presented in Table A.2
(Appendix) presents the major migrant communities in UK based on the size of the eligible
electorate from each country. It indicates that although migrant voters in the UK originate
from a large range of countries across the world, those born in the Commonwealth are the
most dominant. Indeed, five of the top six countries from which migrant voters in UK general
elections originate are all Commonwealth members: India, Pakistan, Bangladesh, Nigeria, and
South Africa (in this order). We should mention that the number of migrants voters from these
Commonwealth countries increased sharply in the year 2016/2017 (see Table A.3, Appendix).
The Commonwealth migrants and the UK citizens have a shared history, cultural links,
common legal systems, business practices and much more. Commonwealth citizens who
reside in Britain have held such voting rights for nearly seventy years. These rights were first
granted in the British Nationality Act 1948 and have been retained through all subsequent
rounds of reform to British citizenship rules. Add to this that rates of citizenship acquisition
by Commonwealth migrants are higher.
This implies that wide majority of Commonwealth migrants participating in British
elections will do so as naturalized British citizens (Vertovec 2006). The historical relations
between Britain and the Commonwealth, and patterns of migration to Britain tracing back
decades, mean that most of Britain’s largest and well-established migrant communities hail
from Commonwealth countries (Spencer 1997; Vertovec 2006; Ford and Goodwin 2014). The
steady rise in population size among key Commonwealth communities in the UK has thus
been accompanied by an increase in their effect within the UK general elections. From 1949,
the word “British” was omitted from the Commonwealth name. The latter was symbolic of
the abandonment of British ambitions of dominance in favour of equal rights for all members
of the Commonwealth. This highlights the role of the development of the multicultural model
and the advancement of human rights for the integration of immigrants from the former
British Empire (Lee 1967). It must be stressed at this stage that the Commonwealth
immigrants have less of a problem with culture shock than other arriving immigrants, as they
16
share a common history, language, and culture. In other words, the Commonwealth-origin
migrants had been educated in the language and values Britain. They were therefore not
foreign to British ways and values. Violent extremists generally do not comply with this
model (Heggins 1997; Marks and Clapham 2005; Ford and Goodwin 2014). Whatever their
ideology, these groups glorify the supremacy of a particular group, whether based on religion,
race, citizenship, class or conviction, and oppose the idea of open and inclusive society. In
brief, the idea here is that combating and ultimately overcoming terrorism will not succeed if
the means to secure that society are not consistent with human rights standards. Interestingly,
a huge body of literature has focused on the differences in the orientation of the European
colonial powers and have shown that the identity of the colonizing nation explains the
variation in postcolonial development (for example, Grier 1999; Bertocchi and Canova 2002)
and democratic survival (for instance, Bernhard et al. 2004). While British, French and
Spanish colonialism mainly aimed at reversing the fortunes of precolonial regions, they did so
in dissimilar ways (Lange et al. 2006). The British attempted to utilize indirect rule and
respected the traditional customs and leaders, whereas the French and the Spanish tried to use
assimilation policies that never had such features, i.e., with the purpose to destroy traditional
cultural identities. Unlike areas that were colonized by France and Spain, countries that were
highly colonized by Britain saw the introduction of substantial liberal institutions that tend to
be characterized by tolerance and pluralism. The British colonialism ensured a rule of law and
effective administration showing respect for customs and traditions. Certainly, the single
rationale of colonies was to serve the interests of the mother country. Throughout this study,
we have hypothesized that there are differences between the colonizing countries. In our
opinion, this difference may explain the behavior of the colonized countries in their
relationship with the former colonial powers. Indeed, the relations between the old-style
colonized and the colonizers can be appeased, strengthening today’s cooperation. Regardless
of several years after independence, these relations can be vivid and often complicated. Hence
the potential impact on migration. The latter is a vestige of the colonial dispute not yet settled.
The migrant, like the colonized, carries within it its history, a system of values and two-sided
and contradictory references. In this sense, the situation of the migrant is reminiscent of that
of the colonized. According to Sayad (2006), migration is a kind of colonization that survives.
With a double-faced reference system (country of origin, host country), the migration
experience can prompt contradictory results. Indeed, migrants from former colonial countries
can in some cases easily integrate into the host country because they eventually mastered the
customs, and are predisposed to integrate into their new country. In other cases, their
17
integration seems more difficult because of the negative attitudes (hatred) they may have
towards their host country, because they considered that their economic difficulties come
from countries that formerly were colonizers. This may partly explain, and only partially, and
in extreme cases why people resort to terrorism.
For empirical purpose, we have used a dummy variable each locality in the study to code
whether (scored 1) or not (scored 0) the migrants are from the Commonwealth. With this
coding, a positively Information on the immigrant population by country of origin is obtained
from the Population Censuses and from various issues of the Control of Immigration Statistics
published by the U.K government. To be more effective in our analysis, we have replaced the
dummy variable that account for the whole Commonwealth by a dummy variable that
considers the old Commonwealth which was formed in 1931 when the Statute of
Westminster gave legal recognition to the sovereignty of dominions. This dummy variable
takes the value 1 if the electorate is a migrant from the original Commonwealth members
including the United Kingdom, Canada, Australia, New Zealand, South Africa
and Newfoundland. Britain, Australia, Canada and New Zealand have many common
interests and a longest shared history. Compared to the rest of Commonwealth states, the
alliances between the UK and the old Commonwealth members in several areas had been and
continue to be strongest and enduring (Roberston and Singleton 2000).
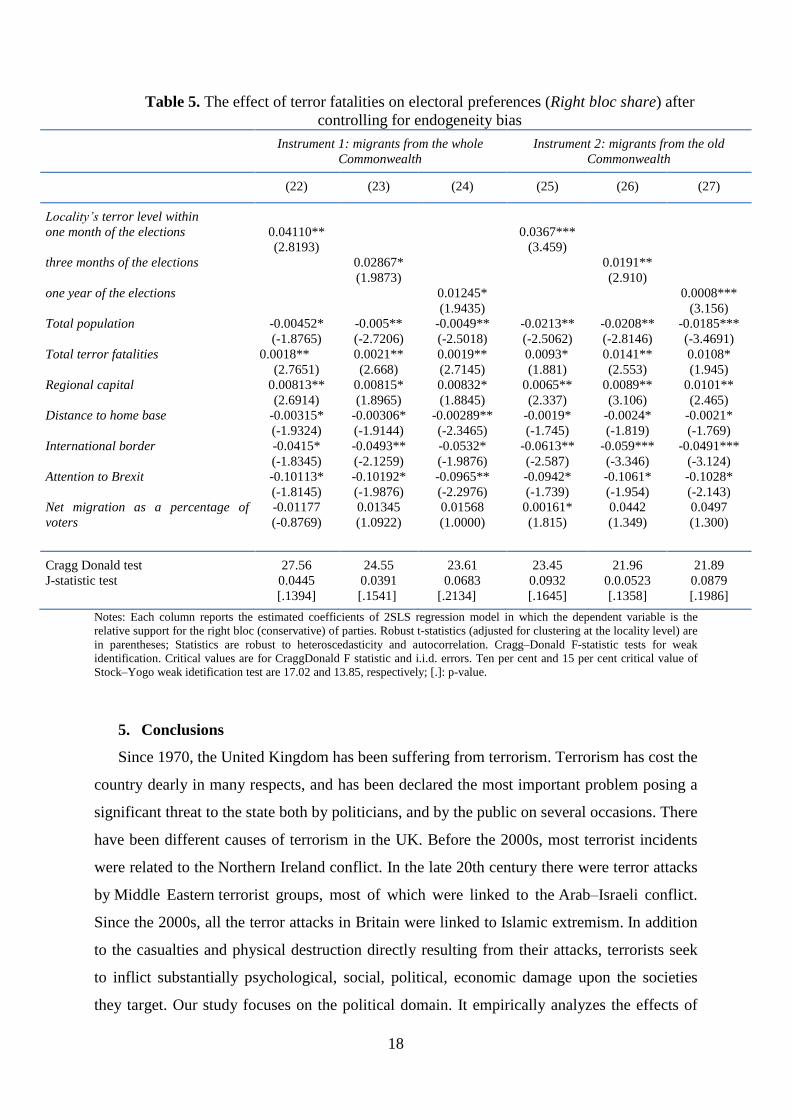
In doing so, we confirm that the occurrence of terror attack before the elections play a
significant role on the voting behavior and then on the election outcomes (Table 5, Equations
(22), (23), (24), (25), (26) and (27)). Using different diagnostic tests, we show that the
migrants from the Commonwealth may be considered as a valid instrument for terrorism3. We
initially conduct the Sargan– Hansen J-statistic test to verify the validity of our instrument. By
carrying out this test, the joint null hypothesis is not rejected for almost all cases. Then, we
have performed a test suggested by Stock and Yogo (2005) to identify if there exist a problem
of weak instruments4. According to Chit et al. (2010), if the instruments appear weak, the IV
estimators would be biased. To verify this evidence, we have applied Cragg–Donald F-
statistic test5. For all the considered cases, we show that migrants from Commonwealth (both
cases; whole Commonwealth and old commonwealth) is an effective instrument for terrorism.
3 The joint null hypothesis of the test is that the concerned instrument is valid when it is uncorrelated with the
error term and when the instrument is correctly excluded from the regressions. 4 If this F-statistic value is greater than the critical value provided by Stock and Yogo (2005), the null hypothesis
of weak instruments can be rejected.
18
Table 5. The effect of terror fatalities on electoral preferences (Right bloc share) after
controlling for endogeneity bias
Instrument 1: migrants from the whole
Commonwealth Instrument 2: migrants from the old
Commonwealth
(22) (23) (24) (25) (26) (27)
Locality’s terror level within
one month of the elections
three months of the elections
one year of the elections
Total population
Total terror fatalities
Regional capital
Distance to home base
International border
Attention to Brexit
Net migration as a percentage of
voters
0.04110**
(2.8193)
-0.00452*
(-1.8765)
0.0018**
(2.7651)
0.00813**
(2.6914)
-0.00315*
(-1.9324)
-0.0415*
(-1.8345)
-0.10113*
(-1.8145)
-0.01177
(-0.8769)
0.02867*
(1.9873)
-0.005**
(-2.7206)
0.0021**
(2.668)
0.00815*
(1.8965)
-0.00306*
(-1.9144)
-0.0493**
(-2.1259)
-0.10192*
(-1.9876)
0.01345
(1.0922)
0.01245*
(1.9435)
-0.0049**
(-2.5018)
0.0019**
(2.7145)
0.00832*
(1.8845)
-0.00289**
(-2.3465)
-0.0532*
(-1.9876)
-0.0965**
(-2.2976)
0.01568
(1.0000)
0.0367***
(3.459)
-0.0213**
(-2.5062)
0.0093*
(1.881)
0.0065**
(2.337)
-0.0019*
(-1.745)
-0.0613**
(-2.587)
-0.0942*
(-1.739)
0.00161*
(1.815)
0.0191**
(2.910)
-0.0208**
(-2.8146)
0.0141**
(2.553)
0.0089**
(3.106)
-0.0024*
(-1.819)
-0.059***
(-3.346)
-0.1061*
(-1.954)
0.0442
(1.349)
0.0008***
(3.156)
-0.0185***
(-3.4691)
0.0108*
(1.945)
0.0101**
(2.465)
-0.0021*
(-1.769)
-0.0491***
(-3.124)
-0.1028*
(-2.143)
0.0497
(1.300)
Cragg Donald test
J-statistic test 27.56
0.0445
[.1394]
24.55
0.0391
[.1541]
23.61
0.0683
[.2134]
23.45
0.0932
[.1645]
21.96
0.0.0523
[.1358]
21.89
0.0879
[.1986]
Notes: Each column reports the estimated coefficients of 2SLS regression model in which the dependent variable is the
relative support for the right bloc (conservative) of parties. Robust t-statistics (adjusted for clustering at the locality level) are
in parentheses; Statistics are robust to heteroscedasticity and autocorrelation. Cragg–Donald F-statistic tests for weak
identification. Critical values are for CraggDonald F statistic and i.i.d. errors. Ten per cent and 15 per cent critical value of
Stock–Yogo weak idetification test are 17.02 and 13.85, respectively; [.]: p-value.
5. Conclusions
Since 1970, the United Kingdom has been suffering from terrorism. Terrorism has cost the
country dearly in many respects, and has been declared the most important problem posing a
significant threat to the state both by politicians, and by the public on several occasions. There
have been different causes of terrorism in the UK. Before the 2000s, most terrorist incidents
were related to the Northern Ireland conflict. In the late 20th century there were terror attacks
by Middle Eastern terrorist groups, most of which were linked to the Arab–Israeli conflict.
Since the 2000s, all the terror attacks in Britain were linked to Islamic extremism. In addition
to the casualties and physical destruction directly resulting from their attacks, terrorists seek
to inflict substantially psychological, social, political, economic damage upon the societies
they target. Our study focuses on the political domain. It empirically analyzes the effects of
19
terrorism on the electoral choices of the British voters in the 2017 elections. To our best
knowledge, this study is a first in many ways. The study contributes to the existing literature
on the determinants of voting behavior in UK. It is the first essay at measuring the political
impacts of terrorism in UK. This is a significant contribution considering that terrorism has
been declared as one of the most important problems facing the country, both by candidates
and voters over 2017 elections.
This analysis performs a designed econometric framework allowing analyzing the effect of
terrorism on the electorate’s preferences across time and location. Another contribution of this
study relies on addressing possible endogeneity bias by using the Commonwealth migrant
voters as an instrument for terrorism. The idea here is to account for the role that may play the
British colonialism heavily characterized by the respect of customs, traditions, culture and
laws in the war on terror (Higgins 1997; Marks and Clapham 2005). In doing so, we show that
terrorism exerts a positive and significant effect on voting behavior. In this setup, a terrorist
incident brings information to the electorate; that is, terror attacks tend to persuade the
electorate that the moderate faction seems unable to effectively deal with terrorism and
security concern and hence cannot be trusted. Indeed, our results reveal that terror fatalities
lead to a rise on the support for the right bloc. This finding substantiates the hypothesis that
democracies are highly susceptible to be targeted by terror organizations. In this way, the
United Kingdom and more generally democratic governments should consider the political
implications of terrorism that we uncover throughout this research when they implement
counter-terrorism policies. Normally, the conduct of counter-terrorism policies is
accompanied by a rise on the salience of terrorism, partially attributed to public declarations
made by policy makers. We also show that more is the Muslims proportion in total
population, less is the support for the right-wing party.
Last but not least, the results reveal that Brexit decides the elections outcome rather than
concerns about terrorism and security. This result seems highly expected. As much as Brexit
event revolves around tangible economic consequences, it is also heavily linked to an
increased national sentiment among the British people. A year has passed after the
announcement of the UK’s EU membership referendum and the details of exit and its
economic repercussions remain unknown to the British people, thus their increased suspicions
and concerns.
20
References
Bali, Valentina A. 2007. “Terror and Elections: Lessons from Spain.” Electoral
Studies.
Berrebi, Claude, and Esteban F. Klor. 2006. “On Terrorism and Electoral Outcomes:
Theory and Evidence from the Israeli-Palestinian Conflict.” The Journal of Conflict
Resolution 50 (December): 899-925.
Berrebi, Claude. 2007. “Evidence about the Link between Education, Poverty and
Terrorism among Palestinians.” Peace Economics, Peace Science and Public Policy.
Berrebi, Claude, and Esteban F. Klor. 2008. “Are Voters Sensitive to Terrorism?
Direct Evidence from the Israeli Electorate.” The RAND Labor and Population working paper
series n°477-1.
Bernhard, Michael, Christopher Reenock, and Timothy Nordstrom. 2004. “The
Legacy of Western Overseas Colonialism on Democratic Survival.” International Studies
Quarterly 48:225–250.
Bertocchi, Graziella, and Fabio Canova. 2002. “Did Colonization Matter for Growth?
An Empirical Exploration into the Historical Causes of Africa’s Underdevelopment.”
European Economic Review 46:1851–1871.
21
Cheibub, Jose Antonio, and A. Przeworski. 1999. “Accountability for Economic
Outcomes. In Democracy, Accountability and Representation,” edited by A. Przeworski,
Susan C. Stokes and Bernard Manin: Cambridge University Press.
Fielding, David and Madeline Penny. 2006. “What Causes Changes in Opinion about
the Israeli-Palestinian Peace Process?” Economics Discussion Papers No. 0601, University of
Otago.
Gordon, Carol, and Asher Arian. 2001. “Threat and Decision Making.” The Journal of
Conflict Resolution 45 (April): 196-215.
Grier, Robin M. 1999. “Colonial Legacies and Economic Growth.” Public Choice 98:
317–35.
Guilmartin, Eugenia. 2004. “Terrorist Attacks and Presidential Approval from 1949-
2002.” Mimeo. United States Military Academy.
Higgins, R. 1997. “The general international law of terrorism,” in R Higgins, M.
Flory, (Eds.), Terrorism and international law (London).
Hellwig, T. T. 2001. “Interdependence, government constraints, and economic
voting.” Journal of Politics, 63(4), 1141-1162.
Krueger, Alan B., and David D. Laitin. 2003. “Kto Kogo?: A Cross-Country Study of
the Origins and Targets of Terrorism.” Mimeo. Princeton University, Dept. of Economics.
Krueger, Alan B., and Jitka Malečková. 2003. “Education, Poverty, and Terrorism: Is
There a Causal Connection?” Journal of Economic Perspectives 17: 119-144.
Lange, M., Mahoney, J., and vom Hau, M. 2006. “Colonialism and Development: A
Comparative Analysis of Spanish and British Colonies.” AJS Volume 111 Number 5
(March): 1412–1462
Lee J. M. 1967, “Colonial Development and Good Government. A study of the ideas
expressed by the British official classes in planning decolonization 1939–1964,” Oxford
University Press, Oxford.
Lewis-Beck, Michael S., and Mary Stegmaier. 2000. “Economics Determinants of
Electoral Outcomes.” Annual Review of Political Science 3, 183-219.
Ludvigsen, Stian Skar. 2005. “The Cost of Ruling Israel: Measuring the Political Cost
of Terrorism.” Mimeo. University of Bergen, Dept. of Political Science.
Mao, H., Counts, S., and Bollen, J., 2011. Predicting Financial Markets: Comparing
Survey, News, Twitter and Search Engine Data.
Marks, S and Clapham, A., 2005. “International Human Rights Lexicon.” (Oxford,
2005).
Mayda, A. M., and Rodrik, D. 2005. “Why are some people (and countries) more
protectionist than others?” European Economic Review, 49(6), 1393-1430.Milligan, K.,
Moretti, E., Oreopoulos, P., 2004. “Does education improve citizenship? Evidence from the
United States and the United Kingdom. Journal of Public Economics 88, 1667–1695.
Nie, N.H., Junn, J., Stehlik-Barry, K., 1996. “Education and Democratic Citizenship in
America. The University of Chicago Press, Chicago, IL.
Niemi, R.G., Junn, J., 1998. “Civic Education: What Makes Students Learn.” Yale
University Press, New Haven, CT.
22
Niemi, R.G., Smith, J., 2001. “Enrollments in high school government classes: are we
short-changing both citizenship and political science training?” Political Science & Politics
34, 281–287.
Pape, Robert A. 2005. “Dying to Win: The Strategic Logic of Suicide Terrorism.”
New York: Random House.
Paldam, Martin. 1991. “How Robust is the Vote Function. In Economics and Politics:
The Calculus of Support,” edited by H. Norpoth, M. Lewis-Beck and J. D. Lafay: University
of Michigan Press.
Powell, G. Bingham, and Guy D. Whitten. 1993. “A Cross-National Analysis of
Economic Voting: Taking Account of the Political Context.” American Journal of Political
Science 37 (2):391-414.
Przeworski, Susan C. Stokes and Bernard Manin: Cambridge University Press. Cox,
Gary. 1997. Making Votes Count: Strategic Coordination in the World's Electoral Systems.
Cambridge: Cambridge University Press.
Sandler, T. 2014. “The analytical study of terrorism: Taking stock.” Journal of Peace
Research, 51(2): 257-271.
Sartori, G. 1976. “Parties and Party Systems: A Framework for Analysis.” Cambridge:
Cambridge University Press.
Sayad, A.2006. “L’immigration ou les paradoxes de l'altérité.” Editions RAISONS
d'AGIR.
Shambaugh, George, and William Josiger. 2004. “Public Prudence, the Policy
Salience of Terrorism and Presidential Approval Following Terrorist Incidents.” Mimeo.
Georgetown University, Dept. of Government.
Scheve, K. F. 2004. “Democracy and globalization: Candidate selection in open
economies. Paper presented at the Conference on Globalization and Self-Determination,”
Yale Center for International and Area Studies, New Haven, CT.
Spencer I. R. G. 1997, “British Immigration Policy since 1939. The Making of Muliti-
Racial Britain,” Routledge, London.
Tiebout, C.M. 1956. “A Pure Theory of Local Expenditures.” The Journal of Political
Economy, 64: 416-424.
Vertovec S. 2006, “The Emergence of Super-diversity in Britain, Working Paper no
25 for the Centre on Migration,” Policy and Society, Oxford.
Appendix
23
Figure A.1. Victims of terror attacks (persons killed) in Western Union 1970-2015
Source: Global Terrorism Database.
24
Figure A.2. The UK’s changing terror threat level from 2005 to 2017
Figure A.3. Terrorist incidents map of the United Kingdom 1970-2017
Source: The National Consortium for the Study of Terrorism and Responses to Terrorism (START).
25
Figure A. 4. The geographical distribution of the localities’ support for the different political
parties in Britain Source: Electoral commission.
Figure A.5. Manchester elections results
Labour: 63.41%; Conservative: 22.73%
Source: Electoral commission.
Table A.1. Data sources
26
Variables Sources
The dependent variable The right bloc share by locality The Office of National Statistics
(https://www.ons.gov.uk/)
Terrorism indicators Total terror fatalities The Office of the National Coordinator of
Terrorist Investigations
The locality’s terror level, i.e., the
geographic location of the attack The National Consortium for the Study of
Terrorism and Responses to Terrorism (http://www.start.umd.edu/)
Distance to home base of terror
incident The Geographic Information System (GIS)
Localities with international
border. A dummy variable that takes the value 1 for
localities that have an international border.
Socio-economic
indicators The attention to Brexit Google Trends (http://trends.google.com)
Twitter hashtag to track (http://keyhole.co/)
BVIX: Quandl Financial, Economic, and
Alternative Data (https://www.quandl.com/)
GDP per capita The Office of National Statistics (https://www.ons.gov.uk/)
Wage The Office of National Statistics (https://www.ons.gov.uk/
The share of high school graduates
who are 17-25 years old The Office of National Statistics (https://www.ons.gov.uk/)
Demographic proxies Net migration as percentage of
voters UK censuses; the Office of National Statistics (https://www.ons.gov.uk/)
Total population The Office of National Statistics (https://www.ons.gov.uk/)
Number of potential
Commonwealth migrant voter
(excluding Children migrants
under 18s)
UK censuses; the Office of National Statistics (https://www.ons.gov.uk/)
Table A.2. The most significant migrants population in the United Kingdom
27
Notes: The data excludes the UK-born children of migrants (the proportion of under-18s in the general
population - about 22%), who are not classified as migrants in the official statistics and are thus not taken into
account as part of the migrant voter population throughout this analysis.
Table A.3. The distribution of Commonwealth migrants to UK by country of birth 2016/2017
28
Country Continent Migrant
population (as percentage of total
Commonwealth
migrants)
Antigua and Barbuda Caribbean 3891 0,12%
Australia Australia 106000 2,98%
Bahamas Caribbean 945 0,029%
Bangladesh Asia 212000 6,54%
Barbados Caribbean 1433 0,044%
Belize North America 1126 0,034%
Botswana Africa 3984 0,12%
Brunei Asia 249 0%
Cameroon Africa 3134 0,09%
Canada North America 265000 0,081%
Cyprus Eurasia 887 0,027%
Dominica Caribbean 1172 0,036%
Fiji Oceania 4132 0,12%
Ghana Africa 7456 0,23%
Grenada Caribbean 3149 0,09%
Guyana South America 1243 0,038%
India Asia 694000 21,41%
Jamaica Caribbean 160000 4,93%
Kenya Africa 112920 1,74%
Kiribati Oceania 614 0,018%
Lesotho Africa 577 0,017%
Malawi Africa 2210 0,068%
Malaysia Asia 31400 0,96%
Malta Europe 175 0%
Mauritius Africa 41000 1,26%
Mozambique Africa 2337 0,07%
Namibia Africa 4169 0,12%
Nauru Oceania 643 0,019%
New Zealand Oceania 407000 12,56%
29
Nigeria Africa 191000 5,89%
Pakistan Asia 482000 14,87%
Papua New Guinea Australia 27053 0,83%
Rwanda Africa 3895 0,12%
Saint Kitts and Nevis Caribbean 2734 0,084%
Saint Lucia Caribbean 4163 0,13%
Saint Vincent and
the Grenadines Caribbean 3037 0,093%
Samoa Oceania 8691 0,26%
Seychelles Africa 288 0%
Sierra Leone Africa 9475 0,29%
Singapore Asia 101522 3,13%
Solomon Islands Oceania 14553 0,45%
South Africa Africa 191000 5,89%
Sri Lanka Asia 118000 2,45%
Swaziland Africa 288 0%
Tanzania Africa 3216 0,099%
Tongo Oceania 3037 0,094%
Trinidad and Tobago Caribbean 12152 0,37%
Tuvalu Oceania 1086 0,033%
Uganda Africa 15107 0,46%
Vanuatu Oceania 768 0,024%
Zambia Africa 7995 0,25%
Notes: Source: the Office of National Statistics; the data excludes the UK-born children of migrants (the
proportion of under-18s in the general population - about 22%), who are not classified as migrants in the official
statistics and are thus not taken into account as part of the migrant voter population throughout this analysis.