Embed Size (px)
Citation preview

Phase Diagrams—Understanding the BasicsF.C. Campbell, editor
Copyright © 2012 ASM International®
All rights reservedwww.asminternational.org
Chapter 10Ternary Phase Diagrams
TernAry SySTeMS are those having three components. It is not pos-sible to describe the composition of a ternary alloy with a single number or fraction, as was done with binary alloys, but the statement of two inde-pendent values is sufficient. For example, the composition of an Fe-Cr-Ni alloy may be described fully by stating that it contains 18% Cr and 8% ni. There is no need to say that the iron content is 74%. But the requirement that two parameters must be stated to describe ternary composition means that two dimensions must be used to represent composition on a complete phase diagram. The external variables that must be considered in ternary constitution are temperature, pressure, composition X, and composition Y. To construct a complete diagram representing all these variables would require the use of a four-dimensional space. This being out of the question, it is customary to assume pressure constant (atmospheric pressure) and to construct a three-dimensional (3-D) diagram representing, as variables, the temperature and two concentration parameters. Therefore, in any applica-tion of the phase rule, it should be recalled that one degree of freedom has been exercised in the initial construction of the 3-D diagram by electing to draw it at one atmosphere of pressure.
10.1 Space Model of Ternary Systems
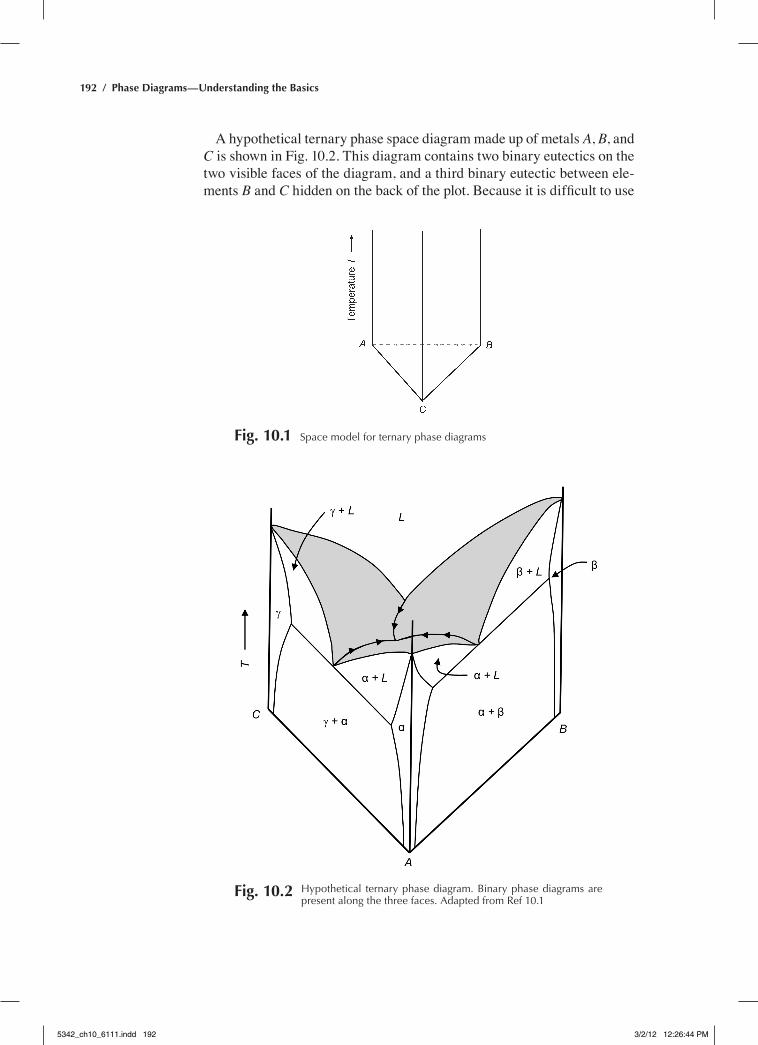
To represent completely the phase equilibria at constant pressure in a ternary system, a 3-D model, commonly termed a space model, is required; the representation of composition requires two dimensions, and that of temperature, a third dimension. The model used is a triangular prism (Fig. 10.1), in which the temperature is plotted on the vertical axis, and the com-position is represented on the base of the prism, which may be conveniently taken as an equilateral triangle. Thus, in Fig. 10.1, the vertical sides of the prism represent the three binary systems, AB, BC, and AC, that make up the ternary system, ABC.
5342_ch10_6111.indd 191 3/2/12 12:26:43 PM
192 / Phase Diagrams—Understanding the Basics
A hypothetical ternary phase space diagram made up of metals A, B, and C is shown in Fig. 10.2. This diagram contains two binary eutectics on the two visible faces of the diagram, and a third binary eutectic between ele-ments B and C hidden on the back of the plot. Because it is difficult to use
Fig. 10.1 Space model for ternary phase diagrams
Fig. 10.2 hypothetical ternary phase diagram. Binary phase diagrams are present along the three faces. adapted from ref 10.1
5342_ch10_6111.indd 192 3/2/12 12:26:44 PM
Chapter 10: Ternary Phase Diagrams / 193
the 3-D ternary plot, the information from the diagrams can be plotted in two dimensions by any of several methods, including the liquidus plot, the isothermal plot, and a vertical section called an isopleth.
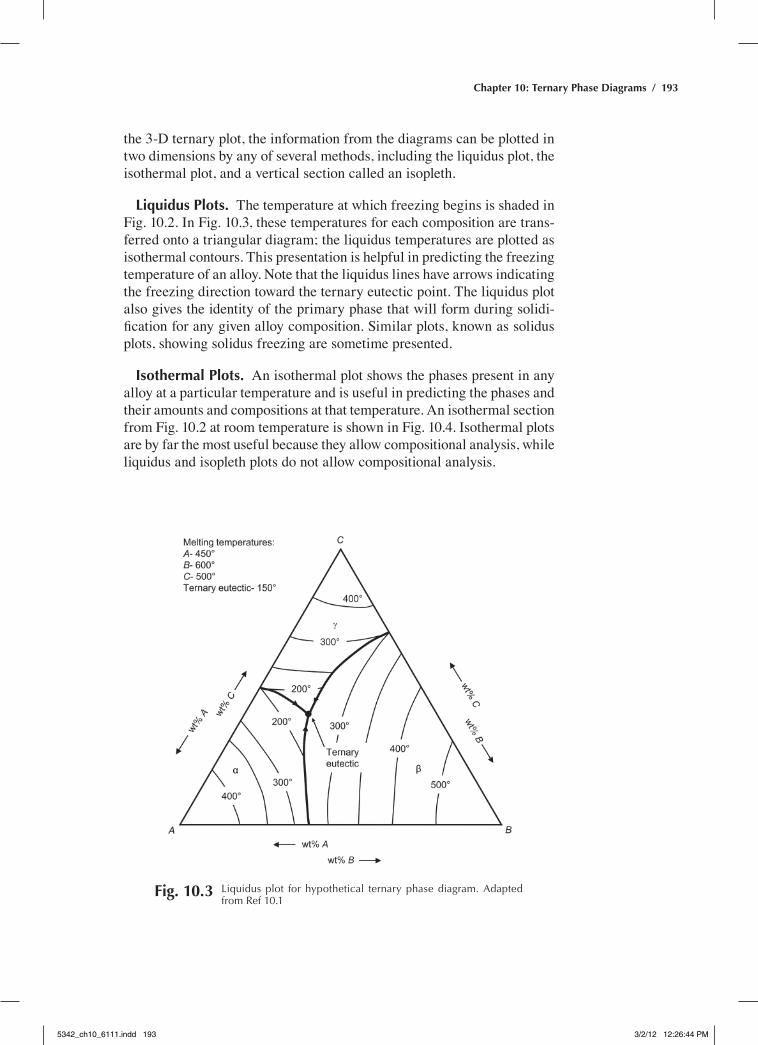
Liquidus Plots. The temperature at which freezing begins is shaded in Fig. 10.2. In Fig. 10.3, these temperatures for each composition are trans-ferred onto a triangular diagram; the liquidus temperatures are plotted as isothermal contours. This presentation is helpful in predicting the freezing temperature of an alloy. note that the liquidus lines have arrows indicating the freezing direction toward the ternary eutectic point. The liquidus plot also gives the identity of the primary phase that will form during solidi-fication for any given alloy composition. Similar plots, known as solidus plots, showing solidus freezing are sometime presented.
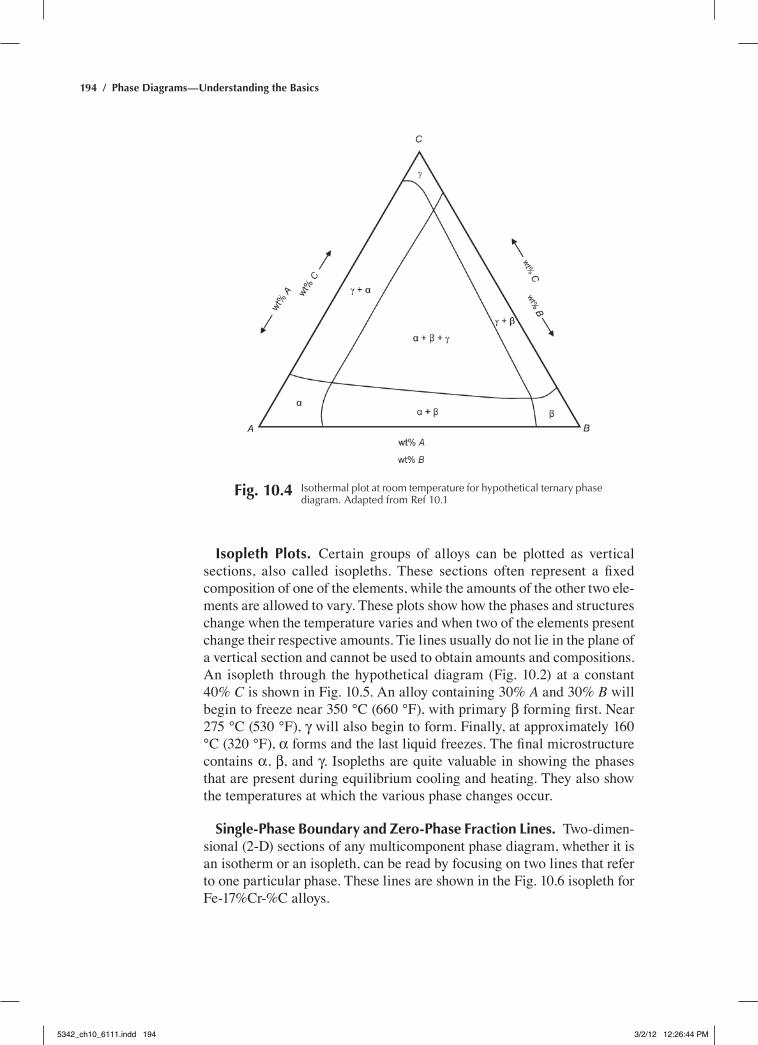
Isothermal Plots. An isothermal plot shows the phases present in any alloy at a particular temperature and is useful in predicting the phases and their amounts and compositions at that temperature. An isothermal section from Fig. 10.2 at room temperature is shown in Fig. 10.4. Isothermal plots are by far the most useful because they allow compositional analysis, while liquidus and isopleth plots do not allow compositional analysis.
Fig. 10.3 Liquidus plot for hypothetical ternary phase diagram. adapted from ref 10.1
5342_ch10_6111.indd 193 3/2/12 12:26:44 PM
194 / Phase Diagrams—Understanding the Basics
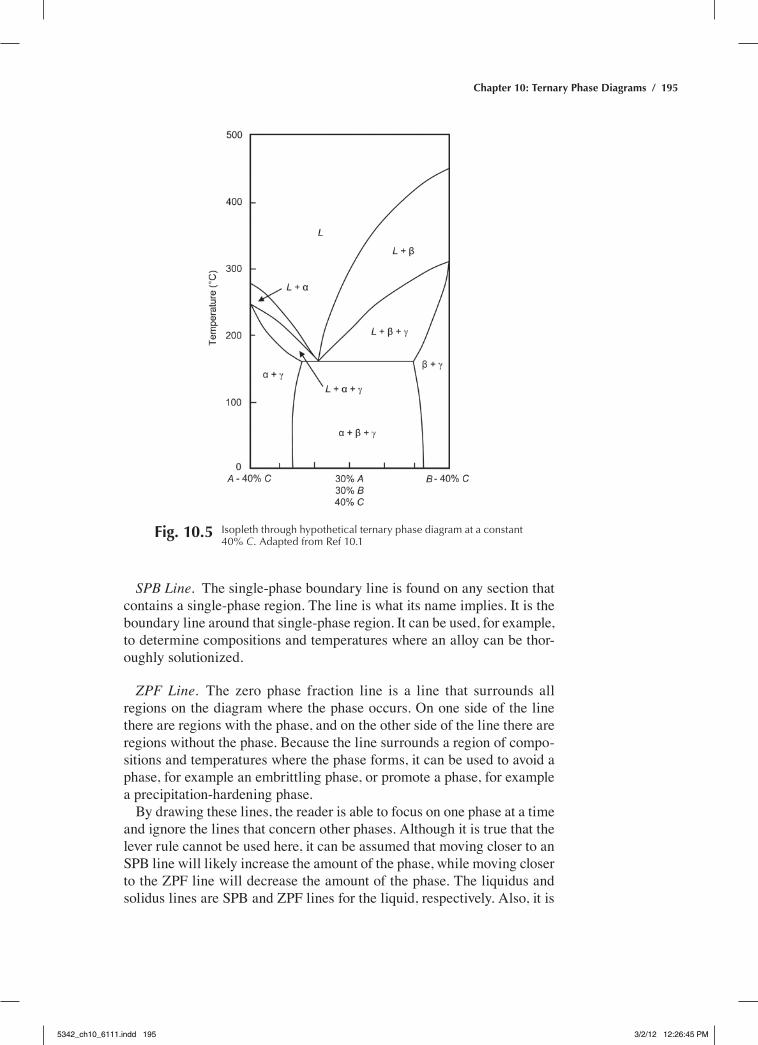
Isopleth Plots. Certain groups of alloys can be plotted as vertical sections, also called isopleths. These sections often represent a fixed composition of one of the elements, while the amounts of the other two ele-ments are allowed to vary. These plots show how the phases and structures change when the temperature varies and when two of the elements present change their respective amounts. Tie lines usually do not lie in the plane of a vertical section and cannot be used to obtain amounts and compositions. An isopleth through the hypothetical diagram (Fig. 10.2) at a constant 40% C is shown in Fig. 10.5. An alloy containing 30% A and 30% B will begin to freeze near 350 °C (660 °F), with primary β forming first. Near 275 °C (530 °F), γ will also begin to form. Finally, at approximately 160 °C (320 °F), α forms and the last liquid freezes. The final microstructure contains α, β, and γ. Isopleths are quite valuable in showing the phases that are present during equilibrium cooling and heating. They also show the temperatures at which the various phase changes occur.
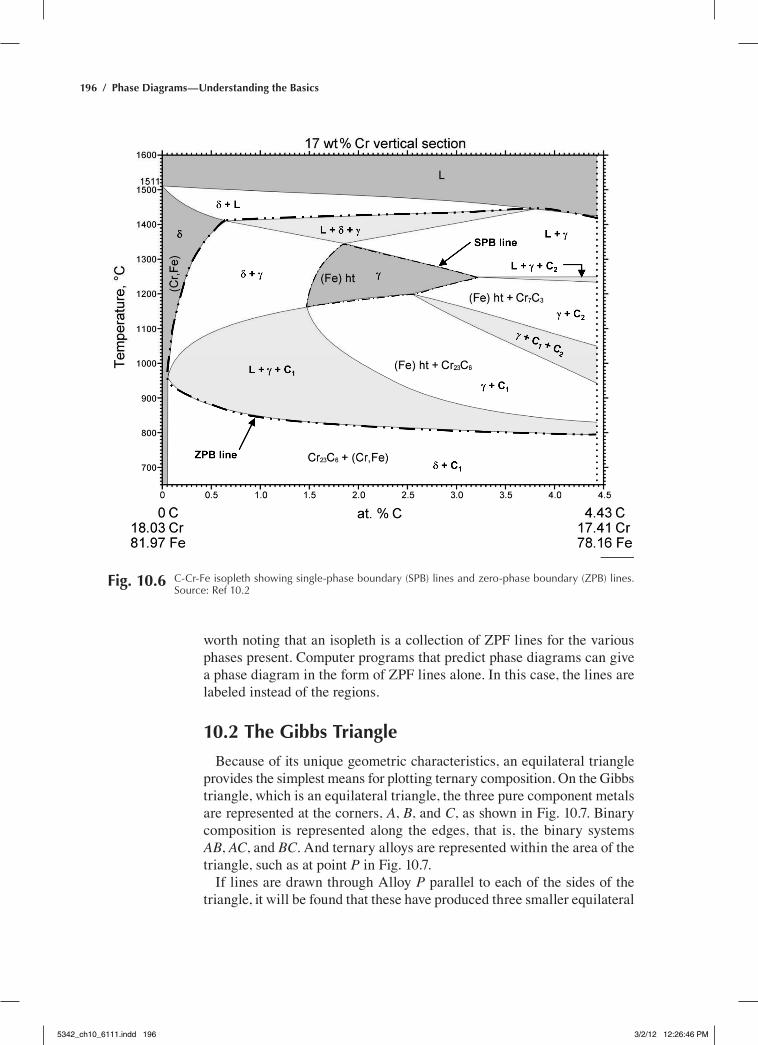
Single-Phase Boundary and Zero-Phase Fraction Lines. Two-dimen-sional (2-D) sections of any multicomponent phase diagram, whether it is an isotherm or an isopleth, can be read by focusing on two lines that refer to one particular phase. These lines are shown in the Fig. 10.6 isopleth for Fe-17%Cr-%C alloys.
Fig. 10.4 Isothermal plot at room temperature for hypothetical ternary phase diagram. adapted from ref 10.1
5342_ch10_6111.indd 194 3/2/12 12:26:44 PM
Chapter 10: Ternary Phase Diagrams / 195
Fig. 10.5 Isopleth through hypothetical ternary phase diagram at a constant 40% C. adapted from ref 10.1
SPB Line. The single-phase boundary line is found on any section that contains a single-phase region. The line is what its name implies. It is the boundary line around that single-phase region. It can be used, for example, to determine compositions and temperatures where an alloy can be thor-oughly solutionized.
ZPF Line. The zero phase fraction line is a line that surrounds all regions on the diagram where the phase occurs. On one side of the line there are regions with the phase, and on the other side of the line there are regions without the phase. Because the line surrounds a region of compo-sitions and temperatures where the phase forms, it can be used to avoid a phase, for example an embrittling phase, or promote a phase, for example a precipitation-hardening phase.
By drawing these lines, the reader is able to focus on one phase at a time and ignore the lines that concern other phases. Although it is true that the lever rule cannot be used here, it can be assumed that moving closer to an SPB line will likely increase the amount of the phase, while moving closer to the ZPF line will decrease the amount of the phase. The liquidus and solidus lines are SPB and ZPF lines for the liquid, respectively. Also, it is
5342_ch10_6111.indd 195 3/2/12 12:26:45 PM
196 / Phase Diagrams—Understanding the Basics
worth noting that an isopleth is a collection of ZPF lines for the various phases present. Computer programs that predict phase diagrams can give a phase diagram in the form of ZPF lines alone. In this case, the lines are labeled instead of the regions.
10.2 The Gibbs Triangle
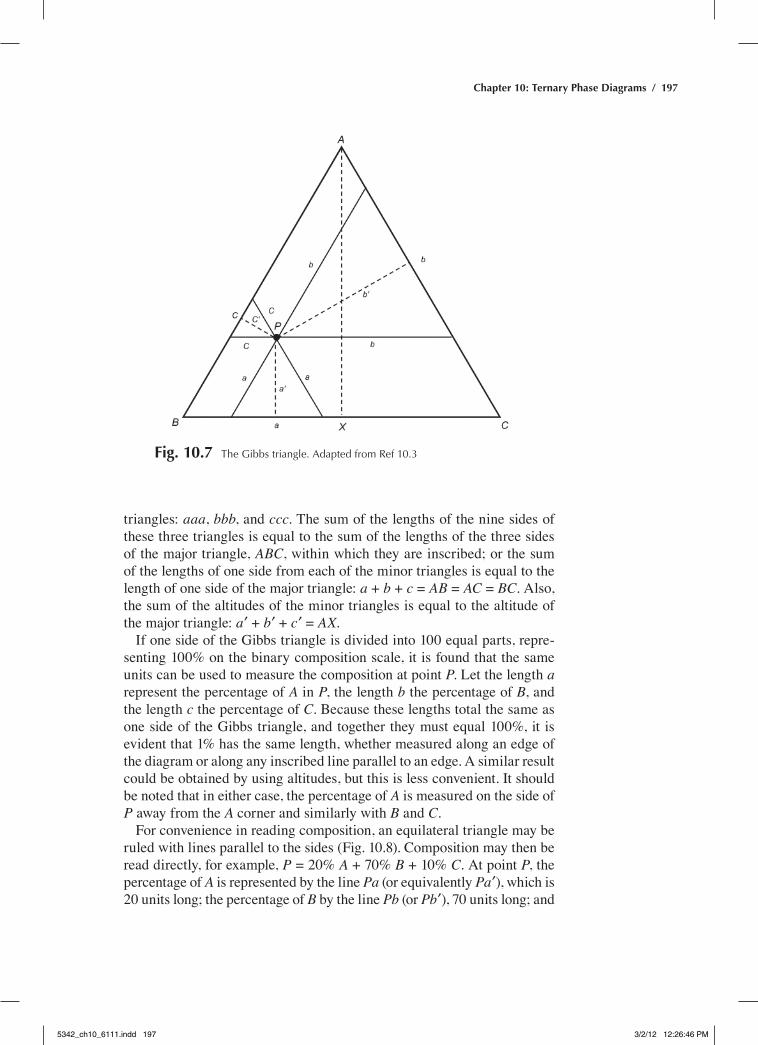
Because of its unique geometric characteristics, an equilateral triangle provides the simplest means for plotting ternary composition. On the Gibbs triangle, which is an equilateral triangle, the three pure component metals are represented at the corners, A, B, and C, as shown in Fig. 10.7. Binary composition is represented along the edges, that is, the binary systems AB, AC, and BC. And ternary alloys are represented within the area of the triangle, such as at point P in Fig. 10.7.
If lines are drawn through Alloy P parallel to each of the sides of the triangle, it will be found that these have produced three smaller equilateral
Fig. 10.6 C-Cr-Fe isopleth showing single-phase boundary (SpB) lines and zero-phase boundary (ZpB) lines. Source: ref 10.2
5342_ch10_6111.indd 196 3/2/12 12:26:46 PM
Chapter 10: Ternary Phase Diagrams / 197
triangles: aaa, bbb, and ccc. The sum of the lengths of the nine sides of these three triangles is equal to the sum of the lengths of the three sides of the major triangle, ABC, within which they are inscribed; or the sum of the lengths of one side from each of the minor triangles is equal to the length of one side of the major triangle: a + b + c = AB = AC = BC. Also, the sum of the altitudes of the minor triangles is equal to the altitude of the major triangle: a¢ + b¢ + c¢ = AX.
If one side of the Gibbs triangle is divided into 100 equal parts, repre-senting 100% on the binary composition scale, it is found that the same units can be used to measure the composition at point P. Let the length a represent the percentage of A in P, the length b the percentage of B, and the length c the percentage of C. Because these lengths total the same as one side of the Gibbs triangle, and together they must equal 100%, it is evident that 1% has the same length, whether measured along an edge of the diagram or along any inscribed line parallel to an edge. A similar result could be obtained by using altitudes, but this is less convenient. It should be noted that in either case, the percentage of A is measured on the side of P away from the A corner and similarly with B and C.
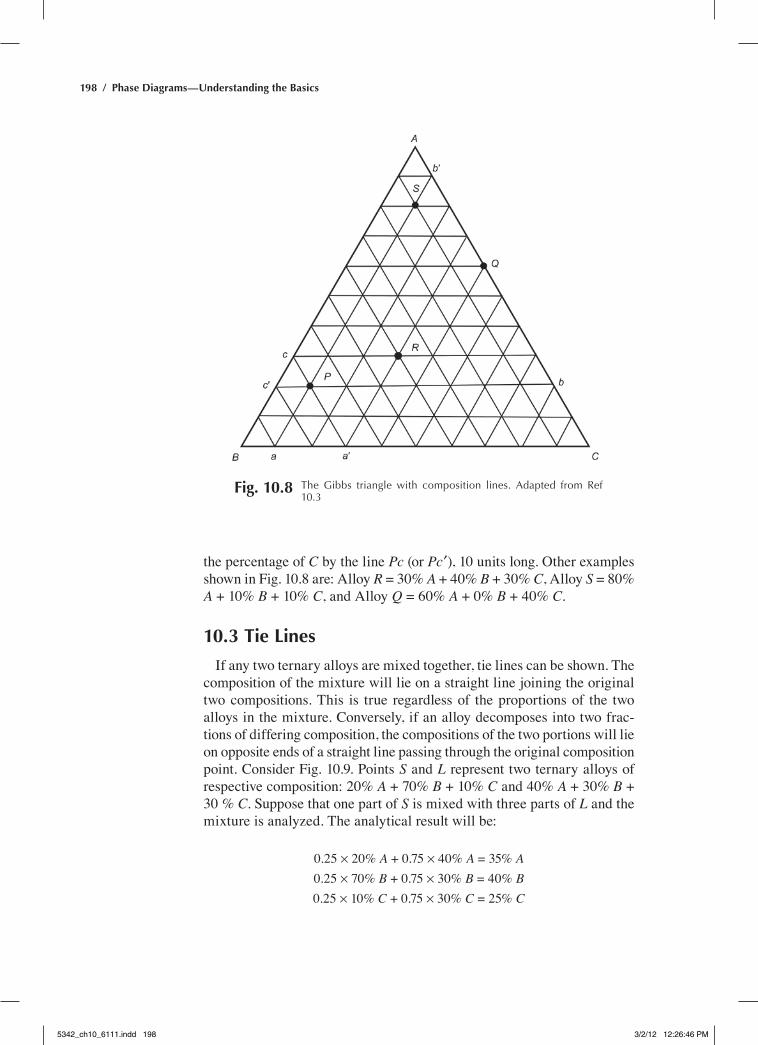
For convenience in reading composition, an equilateral triangle may be ruled with lines parallel to the sides (Fig. 10.8). Composition may then be read directly, for example, P = 20% A + 70% B + 10% C. At point P, the percentage of A is represented by the line Pa (or equivalently Pa¢), which is 20 units long; the percentage of B by the line Pb (or Pb¢), 70 units long; and
Fig. 10.7 the Gibbs triangle. adapted from ref 10.3
5342_ch10_6111.indd 197 3/2/12 12:26:46 PM
198 / Phase Diagrams—Understanding the Basics
the percentage of C by the line Pc (or Pc¢), 10 units long. Other examples shown in Fig. 10.8 are: Alloy R = 30% A + 40% B + 30% C, Alloy S = 80% A + 10% B + 10% C, and Alloy Q = 60% A + 0% B + 40% C.
10.3 Tie Lines
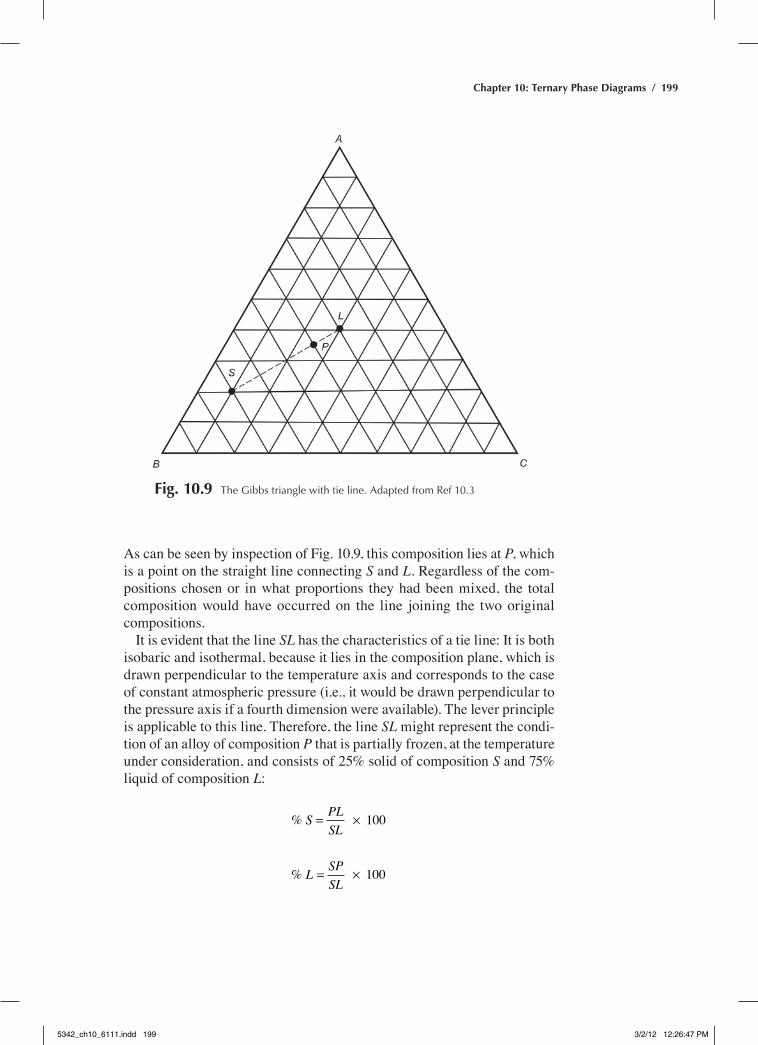
If any two ternary alloys are mixed together, tie lines can be shown. The composition of the mixture will lie on a straight line joining the original two compositions. This is true regardless of the proportions of the two alloys in the mixture. Conversely, if an alloy decomposes into two frac-tions of differing composition, the compositions of the two portions will lie on opposite ends of a straight line passing through the original composition point. Consider Fig. 10.9. Points S and L represent two ternary alloys of respective composition: 20% A + 70% B + 10% C and 40% A + 30% B + 30 % C. Suppose that one part of S is mixed with three parts of L and the mixture is analyzed. The analytical result will be:
0.25 ¥ 20% A + 0.75 ¥ 40% A = 35% A0.25 ¥ 70% B + 0.75 ¥ 30% B = 40% B0.25 ¥ 10% C + 0.75 ¥ 30% C = 25% C
Fig. 10.8 the Gibbs triangle with composition lines. adapted from ref 10.3
5342_ch10_6111.indd 198 3/2/12 12:26:46 PM
Chapter 10: Ternary Phase Diagrams / 199
As can be seen by inspection of Fig. 10.9, this composition lies at P, which is a point on the straight line connecting S and L. regardless of the com-positions chosen or in what proportions they had been mixed, the total composition would have occurred on the line joining the two original compositions.
It is evident that the line SL has the characteristics of a tie line: It is both isobaric and isothermal, because it lies in the composition plane, which is drawn perpendicular to the temperature axis and corresponds to the case of constant atmospheric pressure (i.e., it would be drawn perpendicular to the pressure axis if a fourth dimension were available). The lever principle is applicable to this line. Therefore, the line SL might represent the condi-tion of an alloy of composition P that is partially frozen, at the temperature under consideration, and consists of 25% solid of composition S and 75% liquid of composition L:
% S PLSL
= × 100
% L SPSL
= × 100
Fig. 10.9 the Gibbs triangle with tie line. adapted from ref 10.3
5342_ch10_6111.indd 199 3/2/12 12:26:47 PM
200 / Phase Diagrams—Understanding the Basics
10.4 Ternary Isomorphous Systems
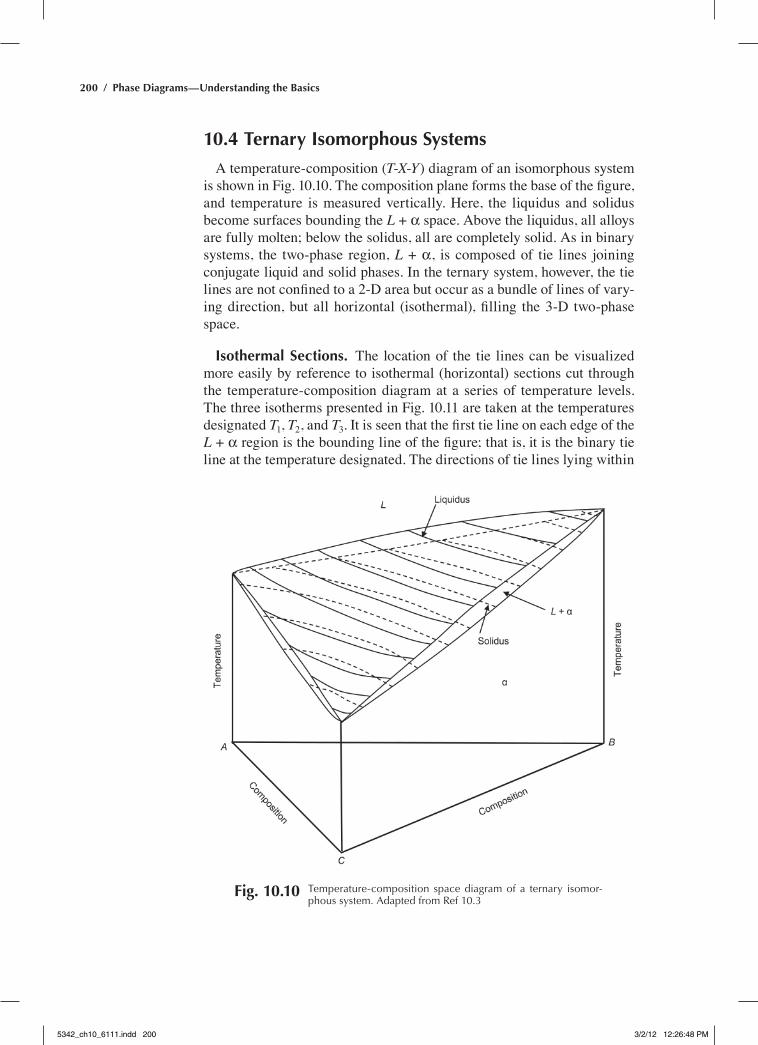
A temperature-composition (T-X-Y) diagram of an isomorphous system is shown in Fig. 10.10. The composition plane forms the base of the figure, and temperature is measured vertically. Here, the liquidus and solidus become surfaces bounding the L + α space. Above the liquidus, all alloys are fully molten; below the solidus, all are completely solid. As in binary systems, the two-phase region, L + α, is composed of tie lines joining conjugate liquid and solid phases. In the ternary system, however, the tie lines are not confined to a 2-D area but occur as a bundle of lines of vary-ing direction, but all horizontal (isothermal), filling the 3-D two-phase space.
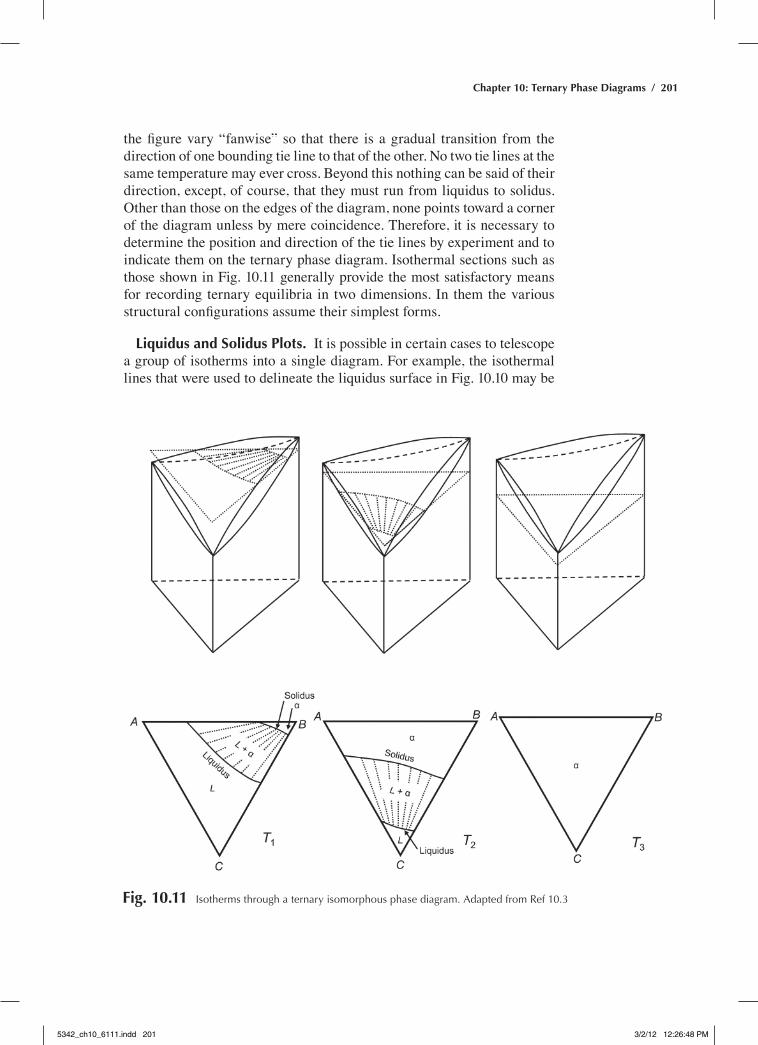
Isothermal Sections. The location of the tie lines can be visualized more easily by reference to isothermal (horizontal) sections cut through the temperature-composition diagram at a series of temperature levels. The three isotherms presented in Fig. 10.11 are taken at the temperatures designated T1, T2, and T3. It is seen that the first tie line on each edge of the L + α region is the bounding line of the figure; that is, it is the binary tie line at the temperature designated. The directions of tie lines lying within
Fig. 10.10 temperature-composition space diagram of a ternary isomor-phous system. adapted from ref 10.3
5342_ch10_6111.indd 200 3/2/12 12:26:48 PM
Chapter 10: Ternary Phase Diagrams / 201
the figure vary “fanwise” so that there is a gradual transition from the direction of one bounding tie line to that of the other. no two tie lines at the same temperature may ever cross. Beyond this nothing can be said of their direction, except, of course, that they must run from liquidus to solidus. Other than those on the edges of the diagram, none points toward a corner of the diagram unless by mere coincidence. Therefore, it is necessary to determine the position and direction of the tie lines by experiment and to indicate them on the ternary phase diagram. Isothermal sections such as those shown in Fig. 10.11 generally provide the most satisfactory means for recording ternary equilibria in two dimensions. In them the various structural configurations assume their simplest forms.
Liquidus and Solidus Plots. It is possible in certain cases to telescope a group of isotherms into a single diagram. For example, the isothermal lines that were used to delineate the liquidus surface in Fig. 10.10 may be
Fig. 10.11 Isotherms through a ternary isomorphous phase diagram. adapted from ref 10.3
5342_ch10_6111.indd 201 3/2/12 12:26:48 PM
202 / Phase Diagrams—Understanding the Basics
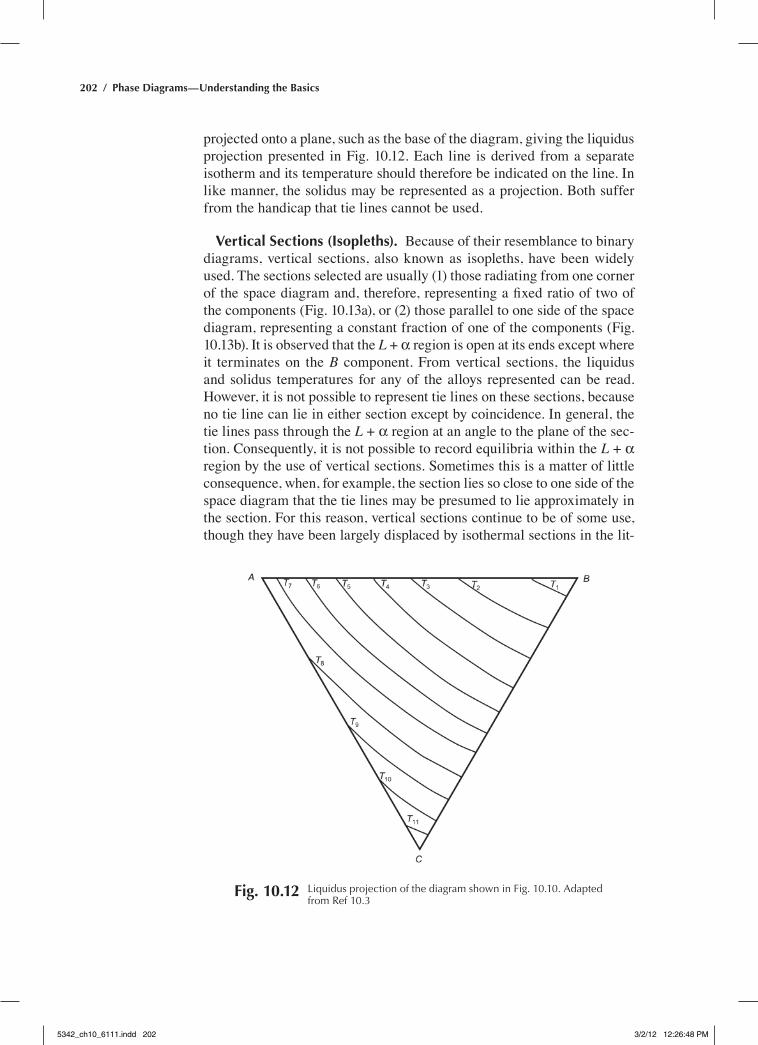
projected onto a plane, such as the base of the diagram, giving the liquidus projection presented in Fig. 10.12. each line is derived from a separate isotherm and its temperature should therefore be indicated on the line. In like manner, the solidus may be represented as a projection. Both suffer from the handicap that tie lines cannot be used.
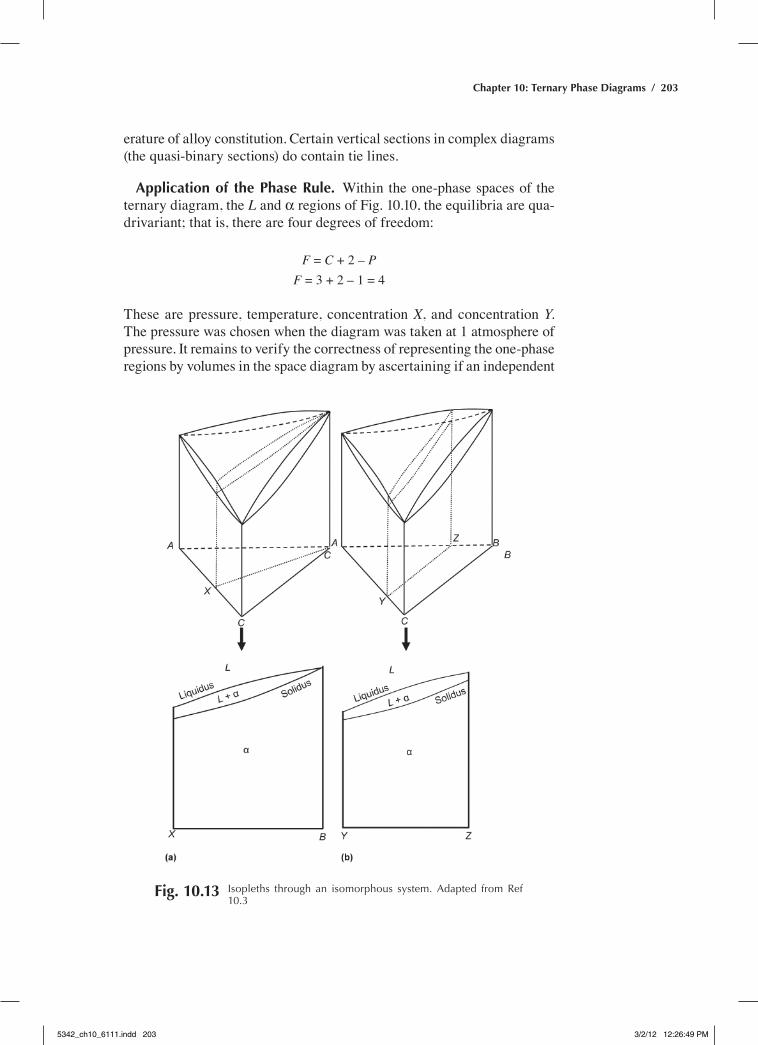
Vertical Sections (Isopleths). Because of their resemblance to binary diagrams, vertical sections, also known as isopleths, have been widely used. The sections selected are usually (1) those radiating from one corner of the space diagram and, therefore, representing a fixed ratio of two of the components (Fig. 10.13a), or (2) those parallel to one side of the space diagram, representing a constant fraction of one of the components (Fig. 10.13b). It is observed that the L + α region is open at its ends except where it terminates on the B component. From vertical sections, the liquidus and solidus temperatures for any of the alloys represented can be read. However, it is not possible to represent tie lines on these sections, because no tie line can lie in either section except by coincidence. In general, the tie lines pass through the L + α region at an angle to the plane of the sec-tion. Consequently, it is not possible to record equilibria within the L + α region by the use of vertical sections. Sometimes this is a matter of little consequence, when, for example, the section lies so close to one side of the space diagram that the tie lines may be presumed to lie approximately in the section. For this reason, vertical sections continue to be of some use, though they have been largely displaced by isothermal sections in the lit-
Fig. 10.12 Liquidus projection of the diagram shown in Fig. 10.10. adapted from ref 10.3
5342_ch10_6111.indd 202 3/2/12 12:26:48 PM
Chapter 10: Ternary Phase Diagrams / 203
erature of alloy constitution. Certain vertical sections in complex diagrams (the quasi-binary sections) do contain tie lines.
Application of the Phase Rule. Within the one-phase spaces of the ternary diagram, the L and α regions of Fig. 10.10, the equilibria are qua-drivariant; that is, there are four degrees of freedom:
F = C + 2 – PF = 3 + 2 – 1 = 4
These are pressure, temperature, concentration X, and concentration Y. The pressure was chosen when the diagram was taken at 1 atmosphere of pressure. It remains to verify the correctness of representing the one-phase regions by volumes in the space diagram by ascertaining if an independent
Fig. 10.13 Isopleths through an isomorphous system. adapted from ref 10.3
5342_ch10_6111.indd 203 3/2/12 12:26:49 PM
204 / Phase Diagrams—Understanding the Basics
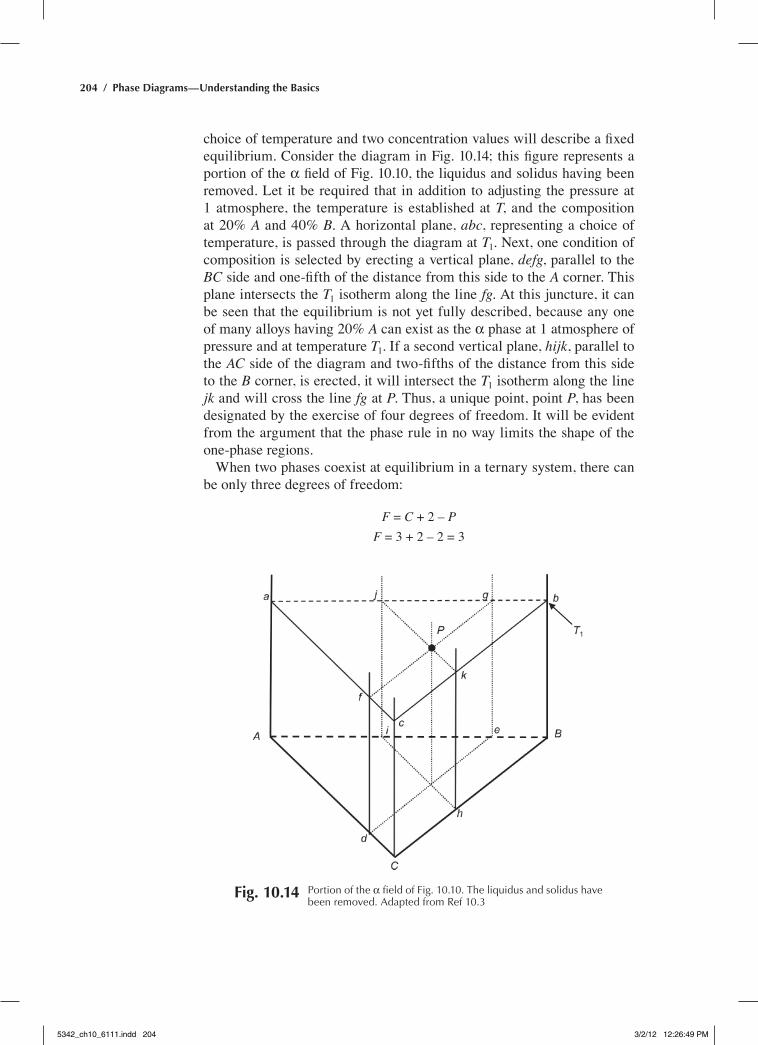
choice of temperature and two concentration values will describe a fixed equilibrium. Consider the diagram in Fig. 10.14; this figure represents a portion of the α field of Fig. 10.10, the liquidus and solidus having been removed. Let it be required that in addition to adjusting the pressure at 1 atmosphere, the temperature is established at T, and the composition at 20% A and 40% B. A horizontal plane, abc, representing a choice of temperature, is passed through the diagram at T1. Next, one condition of composition is selected by erecting a vertical plane, defg, parallel to the BC side and one-fifth of the distance from this side to the A corner. This plane intersects the T1 isotherm along the line fg. At this juncture, it can be seen that the equilibrium is not yet fully described, because any one of many alloys having 20% A can exist as the α phase at 1 atmosphere of pressure and at temperature T1. If a second vertical plane, hijk, parallel to the AC side of the diagram and two-fifths of the distance from this side to the B corner, is erected, it will intersect the T1 isotherm along the line jk and will cross the line fg at P. Thus, a unique point, point P, has been designated by the exercise of four degrees of freedom. It will be evident from the argument that the phase rule in no way limits the shape of the one-phase regions.
When two phases coexist at equilibrium in a ternary system, there can be only three degrees of freedom:
F = C + 2 – PF = 3 + 2 – 2 = 3
Fig. 10.14 portion of the α field of Fig. 10.10. the liquidus and solidus have been removed. adapted from ref 10.3
5342_ch10_6111.indd 204 3/2/12 12:26:49 PM
Chapter 10: Ternary Phase Diagrams / 205
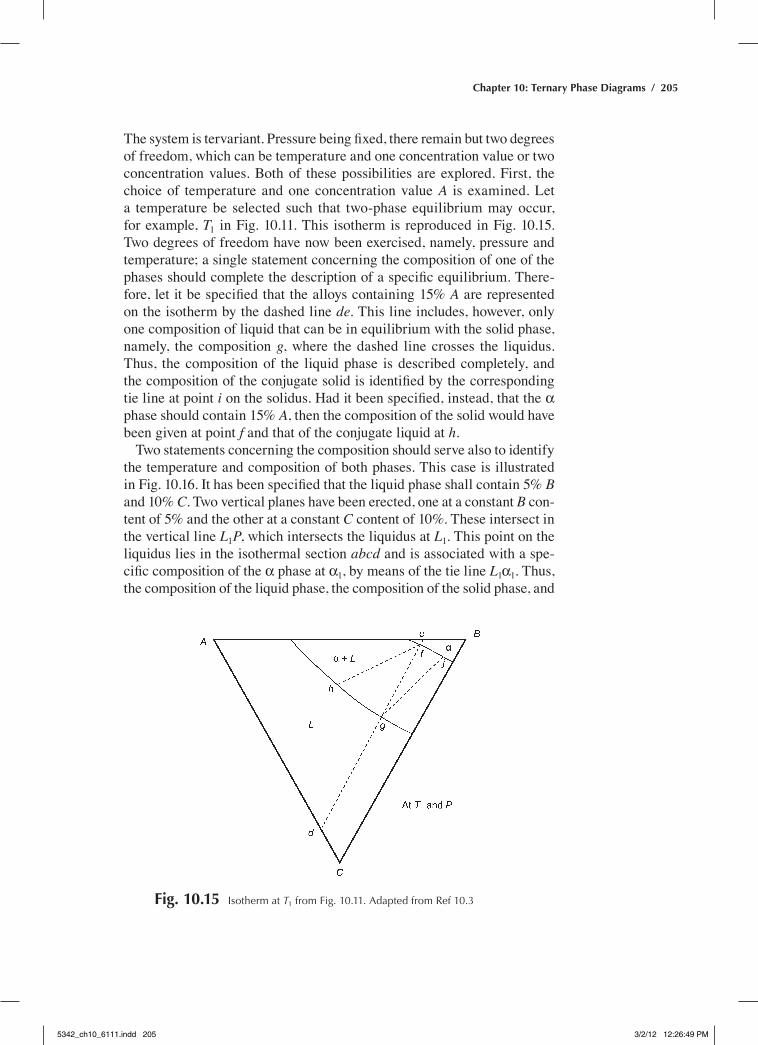
The system is tervariant. Pressure being fixed, there remain but two degrees of freedom, which can be temperature and one concentration value or two concentration values. Both of these possibilities are explored. First, the choice of temperature and one concentration value A is examined. Let a temperature be selected such that two-phase equilibrium may occur, for example, T1 in Fig. 10.11. This isotherm is reproduced in Fig. 10.15. Two degrees of freedom have now been exercised, namely, pressure and temperature; a single statement concerning the composition of one of the phases should complete the description of a specific equilibrium. There-fore, let it be specified that the alloys containing 15% A are represented on the isotherm by the dashed line de. This line includes, however, only one composition of liquid that can be in equilibrium with the solid phase, namely, the composition g, where the dashed line crosses the liquidus. Thus, the composition of the liquid phase is described completely, and the composition of the conjugate solid is identified by the corresponding tie line at point i on the solidus. Had it been specified, instead, that the α phase should contain 15% A, then the composition of the solid would have been given at point f and that of the conjugate liquid at h.
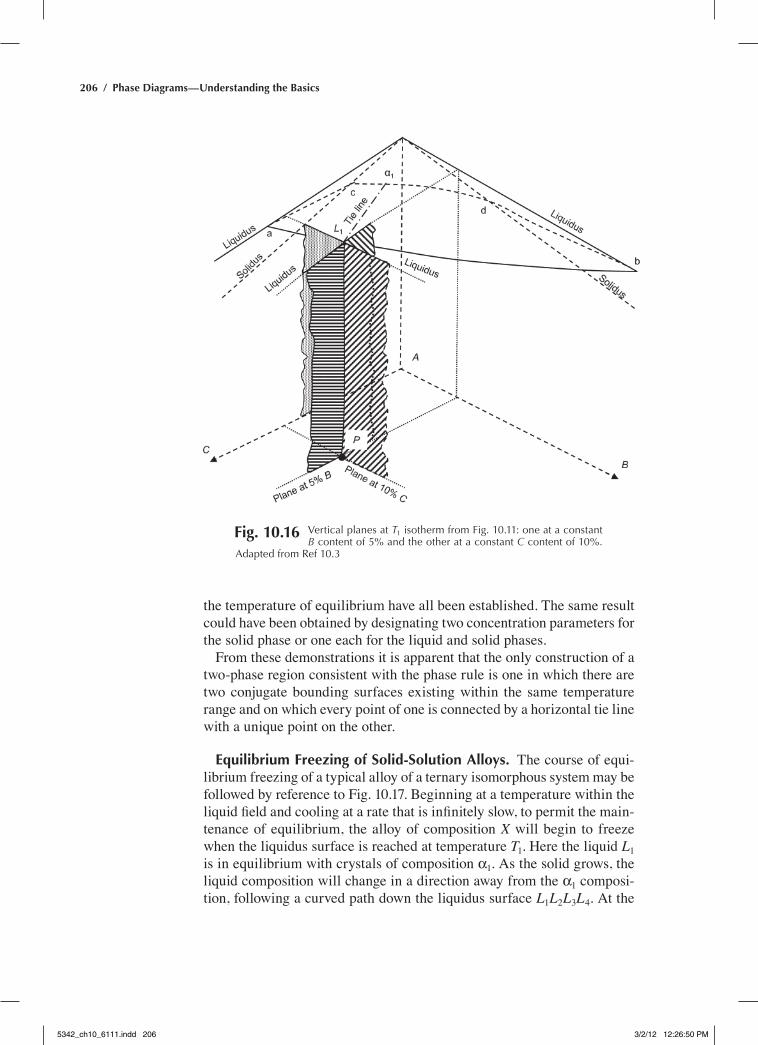
Two statements concerning the composition should serve also to identify the temperature and composition of both phases. This case is illustrated in Fig. 10.16. It has been specified that the liquid phase shall contain 5% B and 10% C. Two vertical planes have been erected, one at a constant B con-tent of 5% and the other at a constant C content of 10%. These intersect in the vertical line L1P, which intersects the liquidus at L1. This point on the liquidus lies in the isothermal section abcd and is associated with a spe-cific composition of the α phase at α1, by means of the tie line L1α1. Thus, the composition of the liquid phase, the composition of the solid phase, and
Fig. 10.15 Isotherm at T1 from Fig. 10.11. adapted from ref 10.3
5342_ch10_6111.indd 205 3/2/12 12:26:49 PM
206 / Phase Diagrams—Understanding the Basics
the temperature of equilibrium have all been established. The same result could have been obtained by designating two concentration parameters for the solid phase or one each for the liquid and solid phases.
From these demonstrations it is apparent that the only construction of a two-phase region consistent with the phase rule is one in which there are two conjugate bounding surfaces existing within the same temperature range and on which every point of one is connected by a horizontal tie line with a unique point on the other.
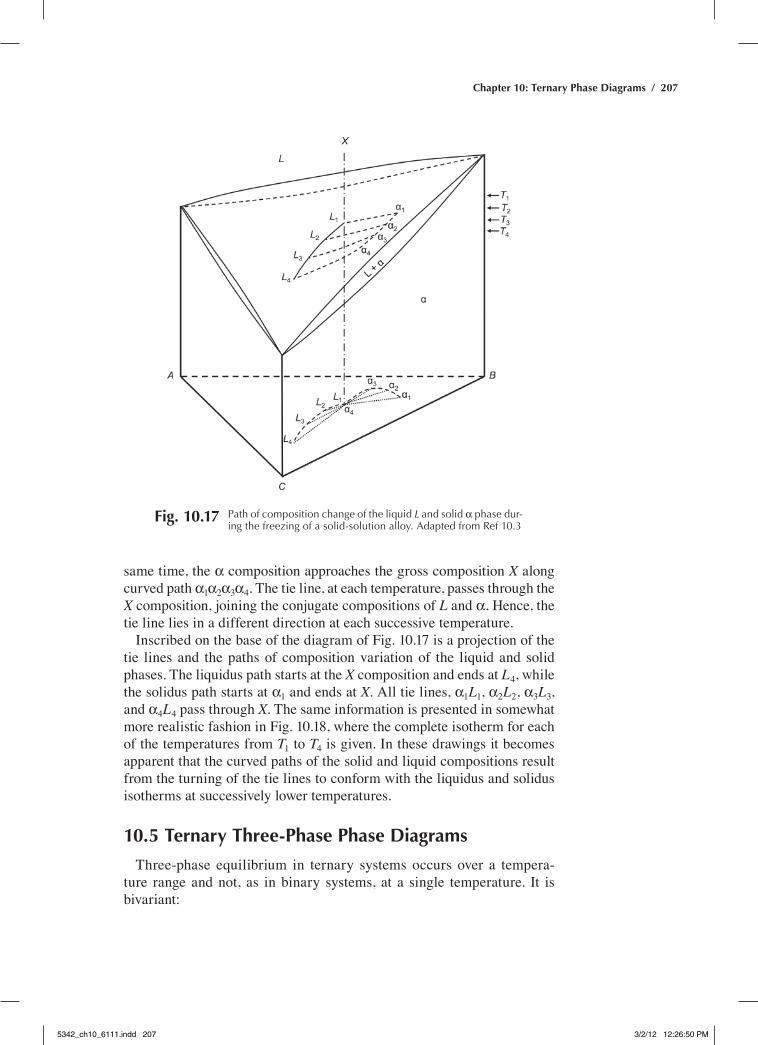
Equilibrium Freezing of Solid-Solution Alloys. The course of equi-librium freezing of a typical alloy of a ternary isomorphous system may be followed by reference to Fig. 10.17. Beginning at a temperature within the liquid field and cooling at a rate that is infinitely slow, to permit the main-tenance of equilibrium, the alloy of composition X will begin to freeze when the liquidus surface is reached at temperature T1. Here the liquid L1 is in equilibrium with crystals of composition α1. As the solid grows, the liquid composition will change in a direction away from the α1 composi-tion, following a curved path down the liquidus surface L1L2L3L4. At the
Fig. 10.16 Vertical planes at T1 isotherm from Fig. 10.11: one at a constant B content of 5% and the other at a constant C content of 10%.
adapted from ref 10.3
5342_ch10_6111.indd 206 3/2/12 12:26:50 PM
Chapter 10: Ternary Phase Diagrams / 207
same time, the α composition approaches the gross composition X along curved path α1α2α3α4. The tie line, at each temperature, passes through the X composition, joining the conjugate compositions of L and α. Hence, the tie line lies in a different direction at each successive temperature.
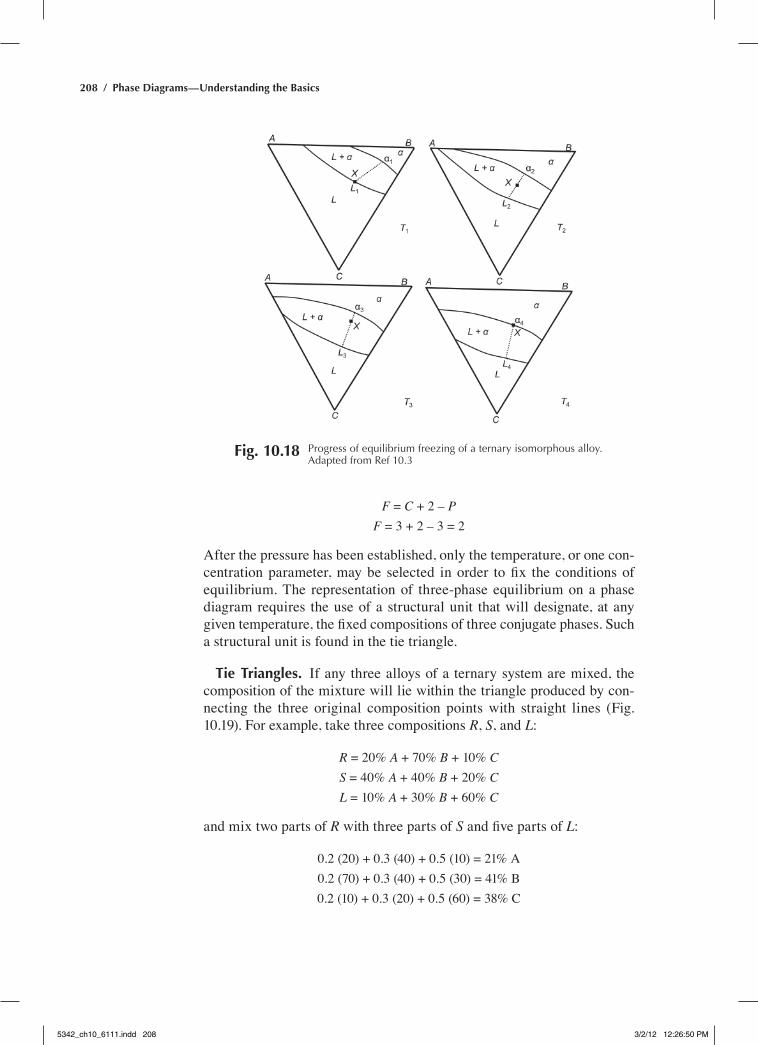
Inscribed on the base of the diagram of Fig. 10.17 is a projection of the tie lines and the paths of composition variation of the liquid and solid phases. The liquidus path starts at the X composition and ends at L4, while the solidus path starts at α1 and ends at X. All tie lines, α1L1, α2L2, α3L3, and α4L4 pass through X. The same information is presented in somewhat more realistic fashion in Fig. 10.18, where the complete isotherm for each of the temperatures from T1 to T4 is given. In these drawings it becomes apparent that the curved paths of the solid and liquid compositions result from the turning of the tie lines to conform with the liquidus and solidus isotherms at successively lower temperatures.
10.5 Ternary Three-Phase Phase Diagrams
Three-phase equilibrium in ternary systems occurs over a tempera-ture range and not, as in binary systems, at a single temperature. It is bivariant:
Fig. 10.17 path of composition change of the liquid L and solid α phase dur-ing the freezing of a solid-solution alloy. adapted from ref 10.3
5342_ch10_6111.indd 207 3/2/12 12:26:50 PM
208 / Phase Diagrams—Understanding the Basics
F = C + 2 – PF = 3 + 2 – 3 = 2
After the pressure has been established, only the temperature, or one con-centration parameter, may be selected in order to fix the conditions of equilibrium. The representation of three-phase equilibrium on a phase diagram requires the use of a structural unit that will designate, at any given temperature, the fixed compositions of three conjugate phases. Such a structural unit is found in the tie triangle.
Tie Triangles. If any three alloys of a ternary system are mixed, the composition of the mixture will lie within the triangle produced by con-necting the three original composition points with straight lines (Fig. 10.19). For example, take three compositions R, S, and L:
R = 20% A + 70% B + 10% CS = 40% A + 40% B + 20% CL = 10% A + 30% B + 60% C
and mix two parts of R with three parts of S and five parts of L:
0.2 (20) + 0.3 (40) + 0.5 (10) = 21% A0.2 (70) + 0.3 (40) + 0.5 (30) = 41% B0.2 (10) + 0.3 (20) + 0.5 (60) = 38% C
Fig. 10.18 progress of equilibrium freezing of a ternary isomorphous alloy. adapted from ref 10.3
5342_ch10_6111.indd 208 3/2/12 12:26:50 PM
Chapter 10: Ternary Phase Diagrams / 209
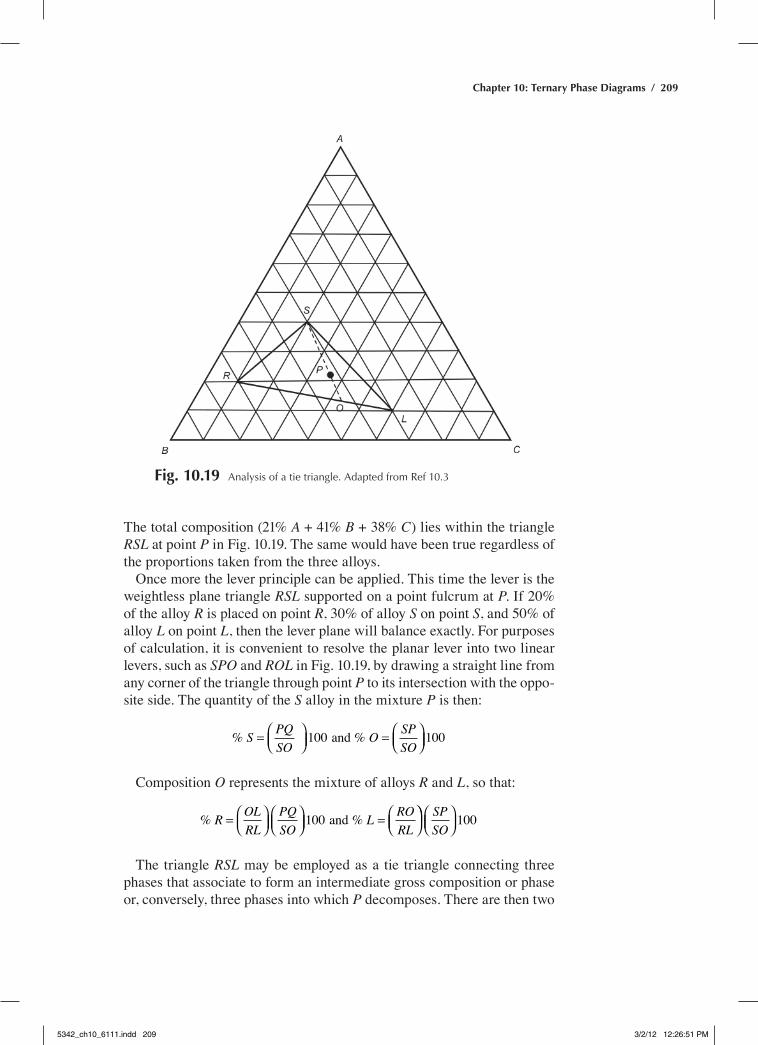
The total composition (21% A + 41% B + 38% C) lies within the triangle RSL at point P in Fig. 10.19. The same would have been true regardless of the proportions taken from the three alloys.
Once more the lever principle can be applied. This time the lever is the weightless plane triangle RSL supported on a point fulcrum at P. If 20% of the alloy R is placed on point R, 30% of alloy S on point S, and 50% of alloy L on point L, then the lever plane will balance exactly. For purposes of calculation, it is convenient to resolve the planar lever into two linear levers, such as SPO and ROL in Fig. 10.19, by drawing a straight line from any corner of the triangle through point P to its intersection with the oppo-site side. The quantity of the S alloy in the mixture P is then:
% % and S PQSO
O SPSO
=
=
100 100
Composition O represents the mixture of alloys R and L, so that:
% % and R OLRL
PQSO
L RORL
=
=
100
SPSO
100
The triangle RSL may be employed as a tie triangle connecting three phases that associate to form an intermediate gross composition or phase or, conversely, three phases into which P decomposes. There are then two
Fig. 10.19 analysis of a tie triangle. adapted from ref 10.3
5342_ch10_6111.indd 209 3/2/12 12:26:51 PM
210 / Phase Diagrams—Understanding the Basics
kinds of “tie elements” that appear in ternary diagrams, namely, the tie line and the tie triangle.
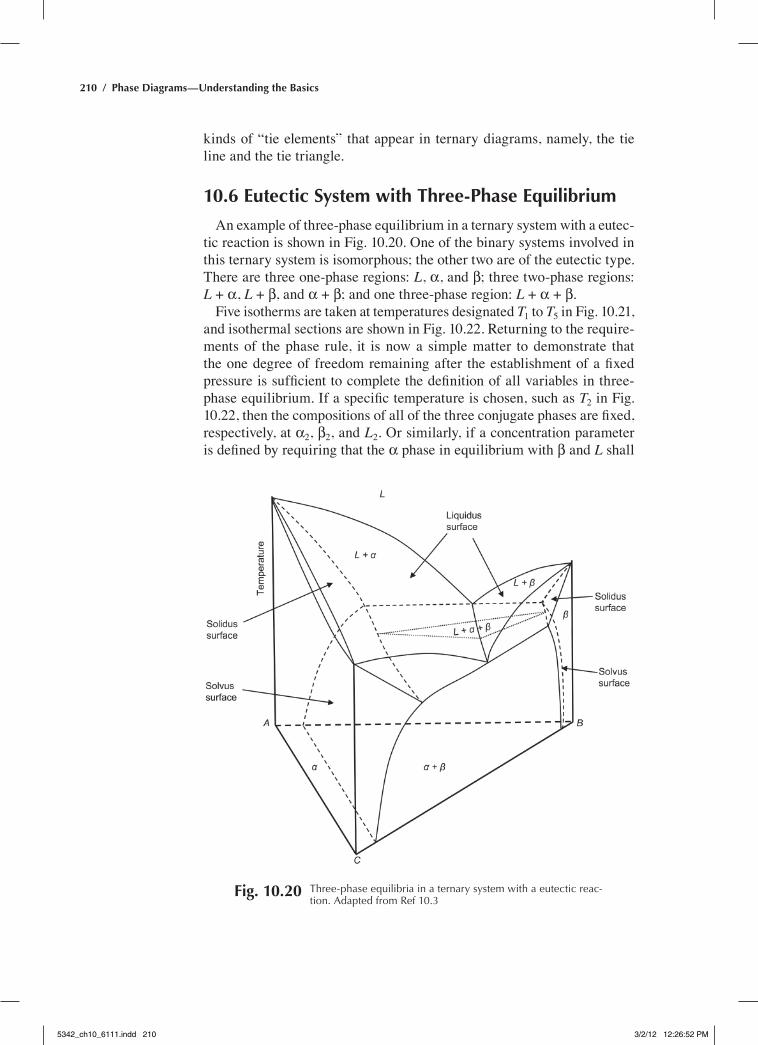
10.6 Eutectic System with Three-Phase Equilibrium
An example of three-phase equilibrium in a ternary system with a eutec-tic reaction is shown in Fig. 10.20. One of the binary systems involved in this ternary system is isomorphous; the other two are of the eutectic type. There are three one-phase regions: L, α, and β; three two-phase regions: L + α, L + β, and α + β; and one three-phase region: L + α + β.
Five isotherms are taken at temperatures designated T1 to T5 in Fig. 10.21, and isothermal sections are shown in Fig. 10.22. returning to the require-ments of the phase rule, it is now a simple matter to demonstrate that the one degree of freedom remaining after the establishment of a fixed pressure is sufficient to complete the definition of all variables in three-phase equilibrium. If a specific temperature is chosen, such as T2 in Fig. 10.22, then the compositions of all of the three conjugate phases are fixed, respectively, at α2, β2, and L2. Or similarly, if a concentration parameter is defined by requiring that the α phase in equilibrium with β and L shall
Fig. 10.20 three-phase equilibria in a ternary system with a eutectic reac-tion. adapted from ref 10.3
5342_ch10_6111.indd 210 3/2/12 12:26:52 PM
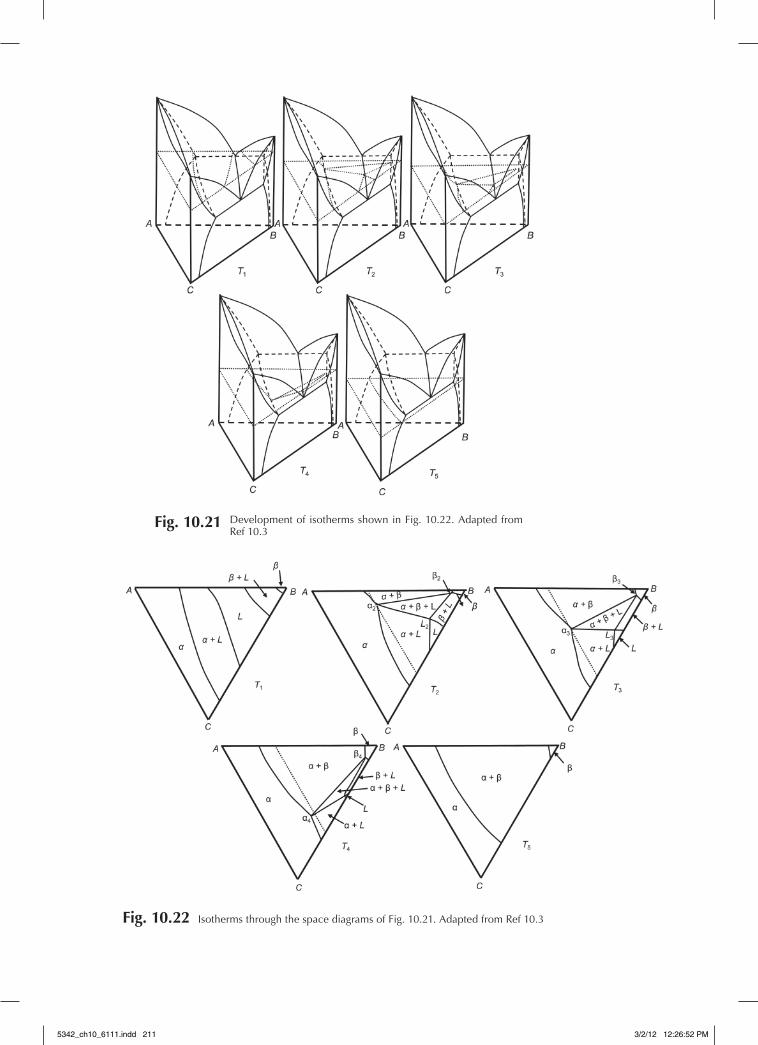
Fig. 10.21 Development of isotherms shown in Fig. 10.22. adapted from ref 10.3
Fig. 10.22 Isotherms through the space diagrams of Fig. 10.21. adapted from ref 10.3
5342_ch10_6111.indd 211 3/2/12 12:26:52 PM
212 / Phase Diagrams—Understanding the Basics
contain 35% B (indicated by the dotted line in isotherms T2, T3, and T4), there will be only one isotherm (T3) in which this condition is realized. The temperature and the compositions of the conjugate β3 and L3 phases are fixed by establishing one concentration parameter of α.
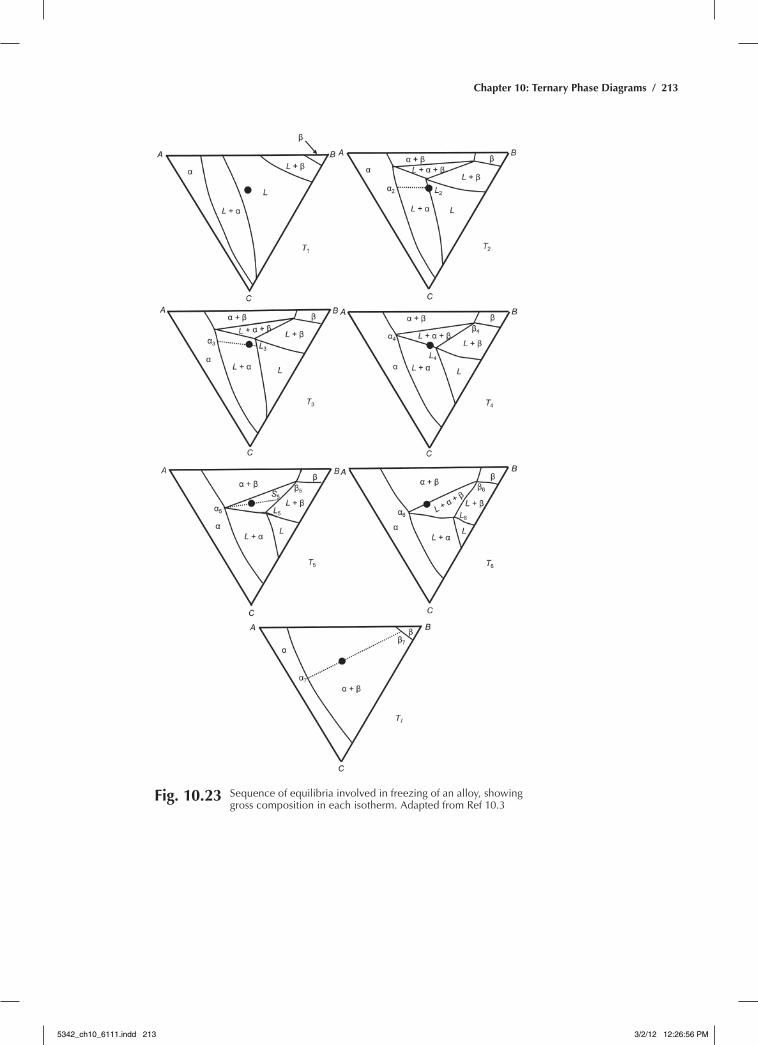
Freezing of an Alloy. The equilibrium freezing of any alloy can be considered by reference to the series of isotherms shown in Fig. 10.23. The black dot designates in each isotherm the gross composition X of the alloy under observation. At temperature T1 (the first isotherm), the X composition lies in the liquid field and the alloy is fully molten.
At T2, the next lower temperature represented, freezing is just begin-ning. Composition X lies on the liquidus and is joined with the first solid to appear by the tie line L2α2.
At T3, a substantial quantity of α is present:
% %αα3
3
=
( ) ≈XLL
3
3
100 20
and
% %L XL3
3
3 3
100 80=
( ) ≈αα
At T4, as the gross composition passes into the L + α + β field, the first particles of the β phase begin to appear; the α and β now crystallize simul-taneously from the liquid.
At T5, all three phases are present in substantial quantity:
% %αα5 =
( ) ≈XSS
5
5 5
100 60
% %αβ
αα5
X=
( ) ≈L SL S
5 5
5 5
5
5 5
100 20
% %L SL
XS5
5 5
5 5
5
5 5
100 20=
( ) ≈ββ
αα
At T6 the last of the liquid disappears and there remains only:
% %α βα β6
6 6
=
( ) ≈X 6 100 75
% %β αα β6
6
6 6
=
( ) ≈X 100 25
5342_ch10_6111.indd 212 3/2/12 12:26:55 PM
Chapter 10: Ternary Phase Diagrams / 213
Fig. 10.23 Sequence of equilibria involved in freezing of an alloy, showing gross composition in each isotherm. adapted from ref 10.3
5342_ch10_6111.indd 213 3/2/12 12:26:56 PM
214 / Phase Diagrams—Understanding the Basics
At T7 the compositions of the two solid phases have changed slightly in response to the curvature of the α and β solvus surfaces, and their relative proportions will again be given by the tie line α7β7.
Freezing has proceeded in two steps, neither of which is isothermal; pri-mary freezing of the α phase has been followed by a secondary separation of α + β over the temperature range T4 to T6.
Wherever transformation occurs over a temperature range at a finite rate (i.e., natural freezing), it is anticipated that the products of that transfor-mation will exhibit a coring effect. Thus, both the primary and secondary constituents should be cored. When α and β are crystallizing together, both phases should be cored.
10.7 Peritectic System with Three-Phase Equilibrium
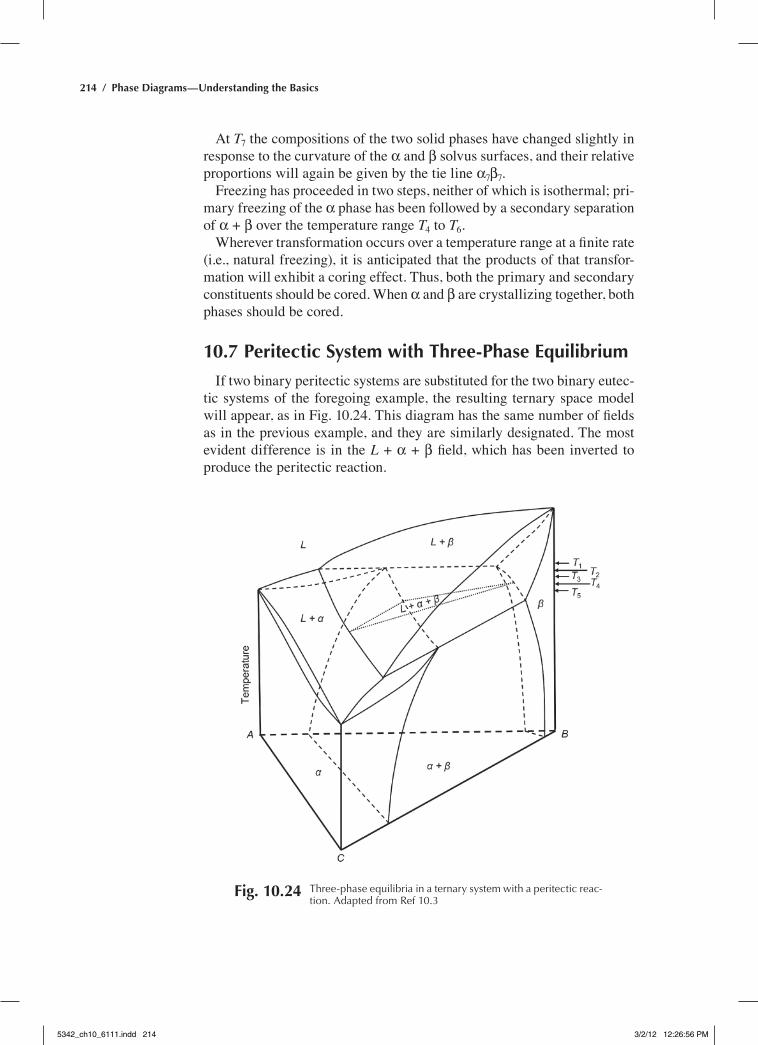
If two binary peritectic systems are substituted for the two binary eutec-tic systems of the foregoing example, the resulting ternary space model will appear, as in Fig. 10.24. This diagram has the same number of fields as in the previous example, and they are similarly designated. The most evident difference is in the L + α + β field, which has been inverted to produce the peritectic reaction.
Fig. 10.24 three-phase equilibria in a ternary system with a peritectic reac-tion. adapted from ref 10.3
5342_ch10_6111.indd 214 3/2/12 12:26:56 PM
Chapter 10: Ternary Phase Diagrams / 215
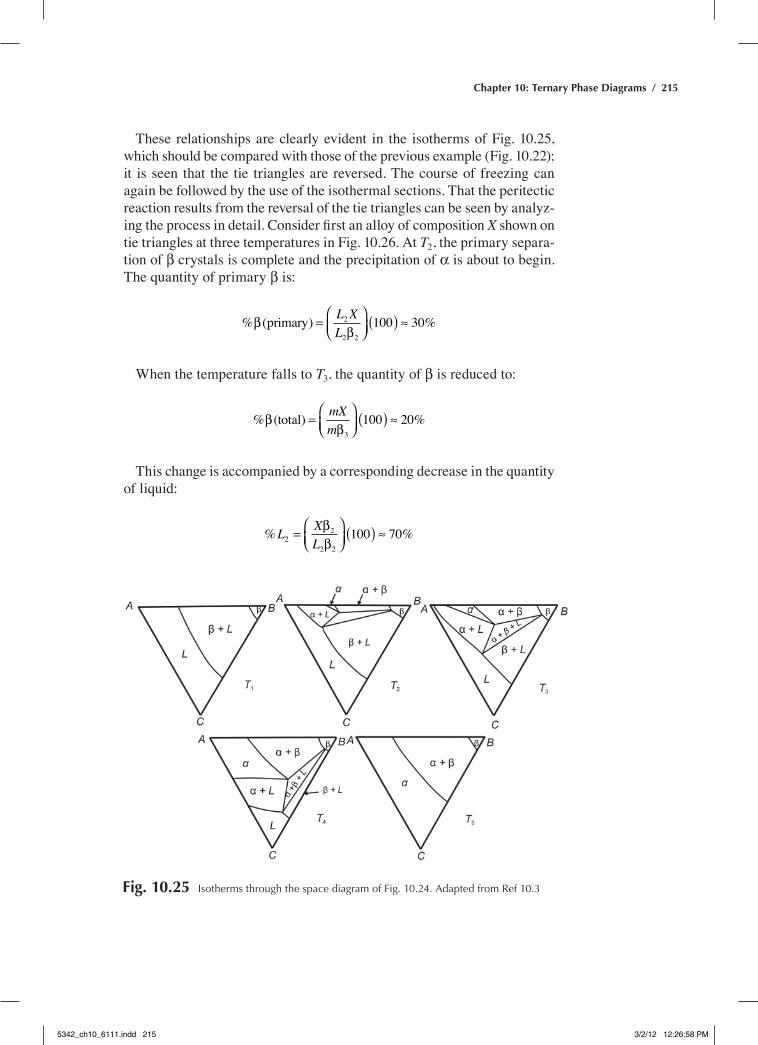
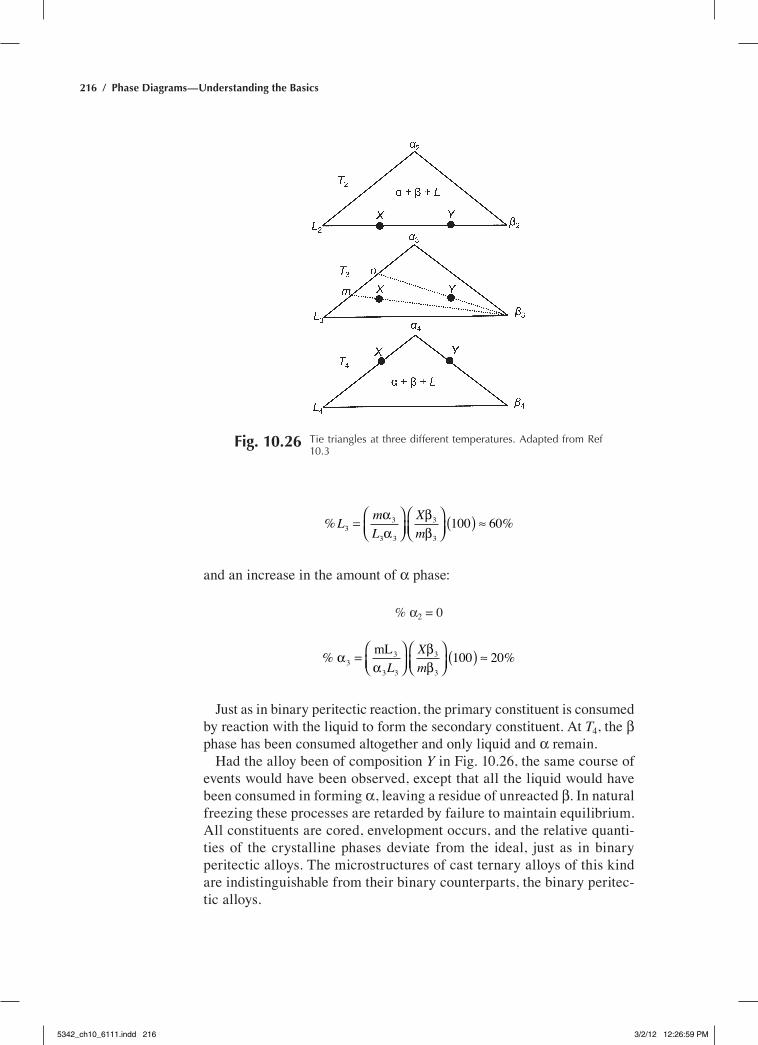
These relationships are clearly evident in the isotherms of Fig. 10.25, which should be compared with those of the previous example (Fig. 10.22); it is seen that the tie triangles are reversed. The course of freezing can again be followed by the use of the isothermal sections. That the peritectic reaction results from the reversal of the tie triangles can be seen by analyz-ing the process in detail. Consider first an alloy of composition X shown on tie triangles at three temperatures in Fig. 10.26. At T2, the primary separa-tion of β crystals is complete and the precipitation of α is about to begin. The quantity of primary β is:
% ( ) %ββ
primary2
=
( ) ≈L XL
2
2
100 30
When the temperature falls to T3, the quantity of β is reduced to:
% ) %ββ
(total3
=
( ) ≈mXm
100 20
This change is accompanied by a corresponding decrease in the quantity of liquid:
% %L XL2
2
=
( ) ≈ββ
2
2
100 70
Fig. 10.25 Isotherms through the space diagram of Fig. 10.24. adapted from ref 10.3
5342_ch10_6111.indd 215 3/2/12 12:26:58 PM
216 / Phase Diagrams—Understanding the Basics
% %L mL
Xm3
3
3
3
3
=
( ) ≈αα
ββ3
100 60
and an increase in the amount of α phase:
% α2 = 0
% mL %αα
ββ3 =
( ) ≈3
3 3
3
3
100 20L
Xm
Just as in binary peritectic reaction, the primary constituent is consumed by reaction with the liquid to form the secondary constituent. At T4, the β phase has been consumed altogether and only liquid and α remain.
Had the alloy been of composition Y in Fig. 10.26, the same course of events would have been observed, except that all the liquid would have been consumed in forming α, leaving a residue of unreacted β. In natural freezing these processes are retarded by failure to maintain equilibrium. All constituents are cored, envelopment occurs, and the relative quanti-ties of the crystalline phases deviate from the ideal, just as in binary peritectic alloys. The microstructures of cast ternary alloys of this kind are indistinguishable from their binary counterparts, the binary peritec-tic alloys.
Fig. 10.26 tie triangles at three different temperatures. adapted from ref 10.3
5342_ch10_6111.indd 216 3/2/12 12:26:59 PM
Chapter 10: Ternary Phase Diagrams / 217
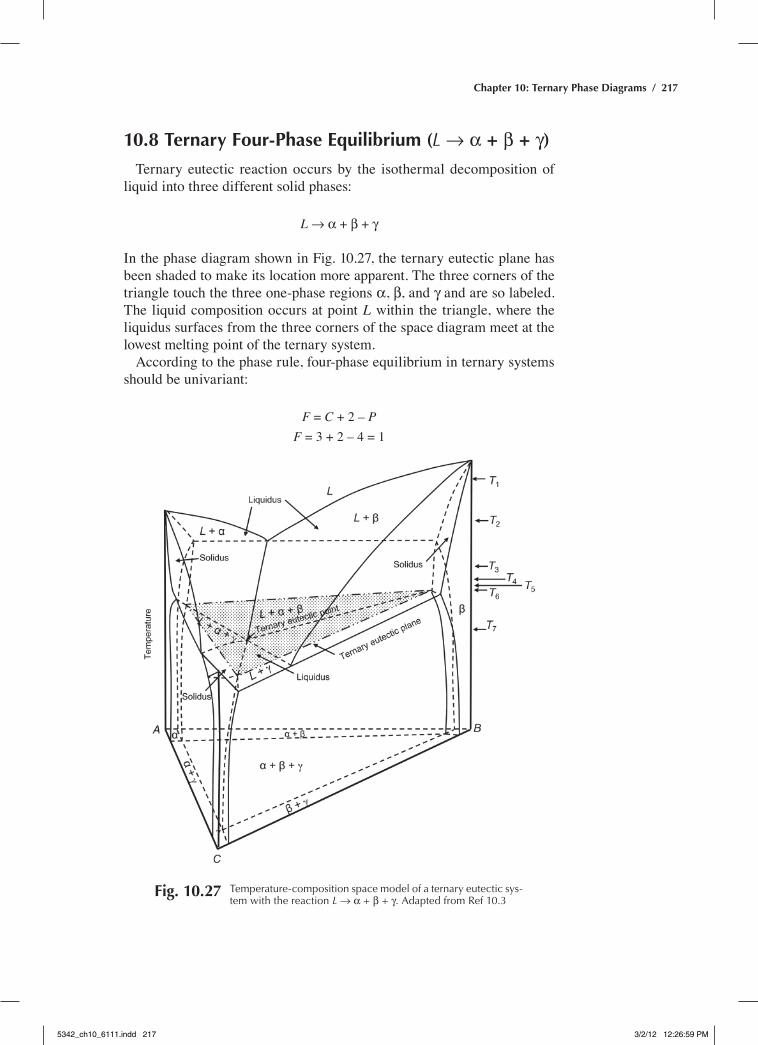
10.8 Ternary Four-Phase Equilibrium (L Æ α + β + γ)
Ternary eutectic reaction occurs by the isothermal decomposition of liquid into three different solid phases:
L Æ α + β + γ
In the phase diagram shown in Fig. 10.27, the ternary eutectic plane has been shaded to make its location more apparent. The three corners of the triangle touch the three one-phase regions α, β, and γ and are so labeled. The liquid composition occurs at point L within the triangle, where the liquidus surfaces from the three corners of the space diagram meet at the lowest melting point of the ternary system.
According to the phase rule, four-phase equilibrium in ternary systems should be univariant:
F = C + 2 – PF = 3 + 2 – 4 = 1
Fig. 10.27 temperature-composition space model of a ternary eutectic sys-tem with the reaction L Æ α + β + γ. adapted from ref 10.3
5342_ch10_6111.indd 217 3/2/12 12:26:59 PM
218 / Phase Diagrams—Understanding the Basics
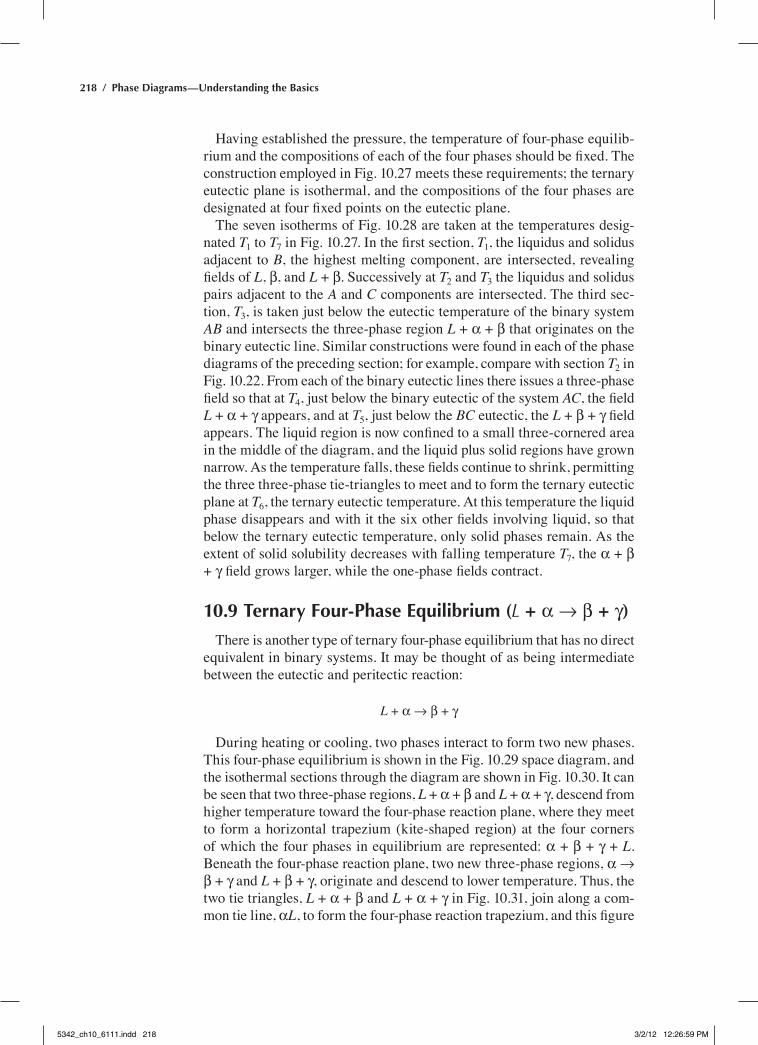
Having established the pressure, the temperature of four-phase equilib-rium and the compositions of each of the four phases should be fixed. The construction employed in Fig. 10.27 meets these requirements; the ternary eutectic plane is isothermal, and the compositions of the four phases are designated at four fixed points on the eutectic plane.
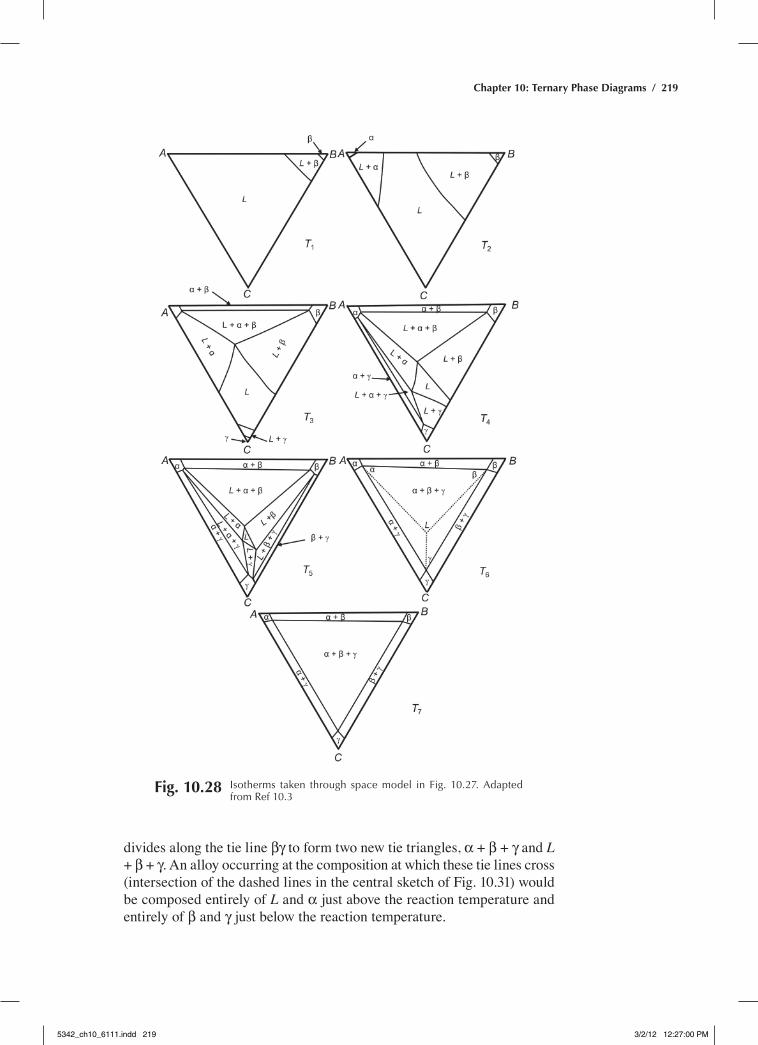
The seven isotherms of Fig. 10.28 are taken at the temperatures desig-nated T1 to T7 in Fig. 10.27. In the first section, T1, the liquidus and solidus adjacent to B, the highest melting component, are intersected, revealing fields of L, β, and L + β. Successively at T2 and T3 the liquidus and solidus pairs adjacent to the A and C components are intersected. The third sec-tion, T3, is taken just below the eutectic temperature of the binary system AB and intersects the three-phase region L + α + β that originates on the binary eutectic line. Similar constructions were found in each of the phase diagrams of the preceding section; for example, compare with section T2 in Fig. 10.22. From each of the binary eutectic lines there issues a three-phase field so that at T4, just below the binary eutectic of the system AC, the field L + α + γ appears, and at T5, just below the BC eutectic, the L + β + γ field appears. The liquid region is now confined to a small three-cornered area in the middle of the diagram, and the liquid plus solid regions have grown narrow. As the temperature falls, these fields continue to shrink, permitting the three three-phase tie-triangles to meet and to form the ternary eutectic plane at T6, the ternary eutectic temperature. At this temperature the liquid phase disappears and with it the six other fields involving liquid, so that below the ternary eutectic temperature, only solid phases remain. As the extent of solid solubility decreases with falling temperature T7, the α + β + γ field grows larger, while the one-phase fields contract.
10.9 Ternary Four-Phase Equilibrium (L + α Æ β + γ)
There is another type of ternary four-phase equilibrium that has no direct equivalent in binary systems. It may be thought of as being intermediate between the eutectic and peritectic reaction:
L + α Æ β + γ
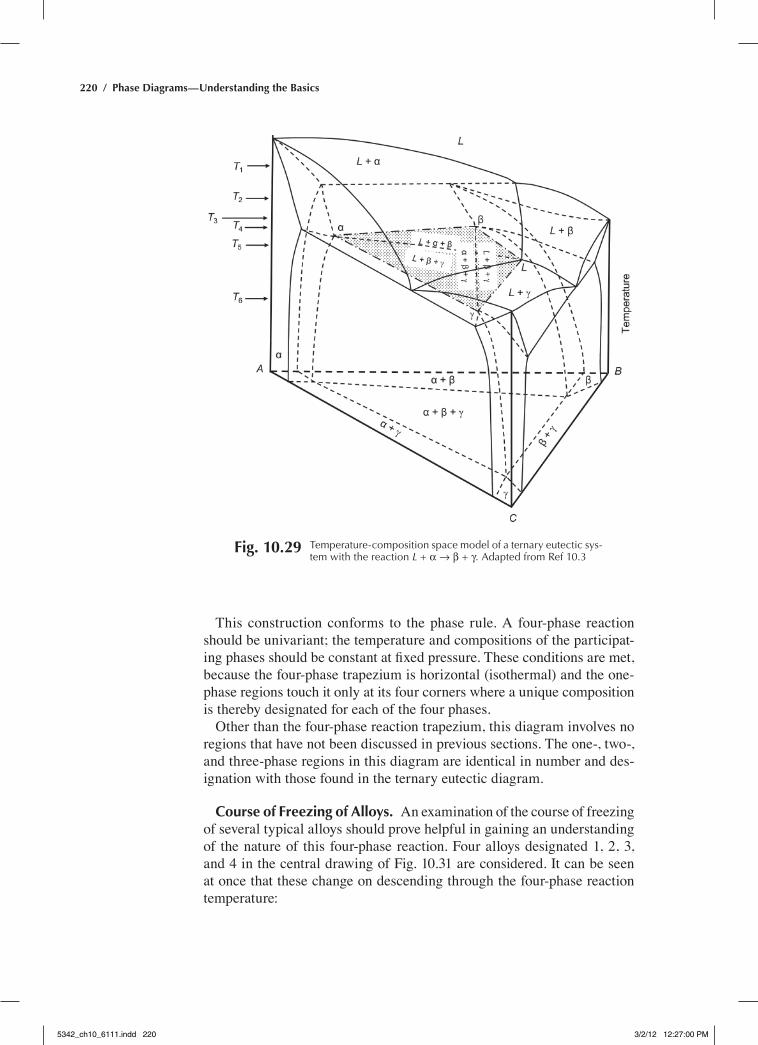
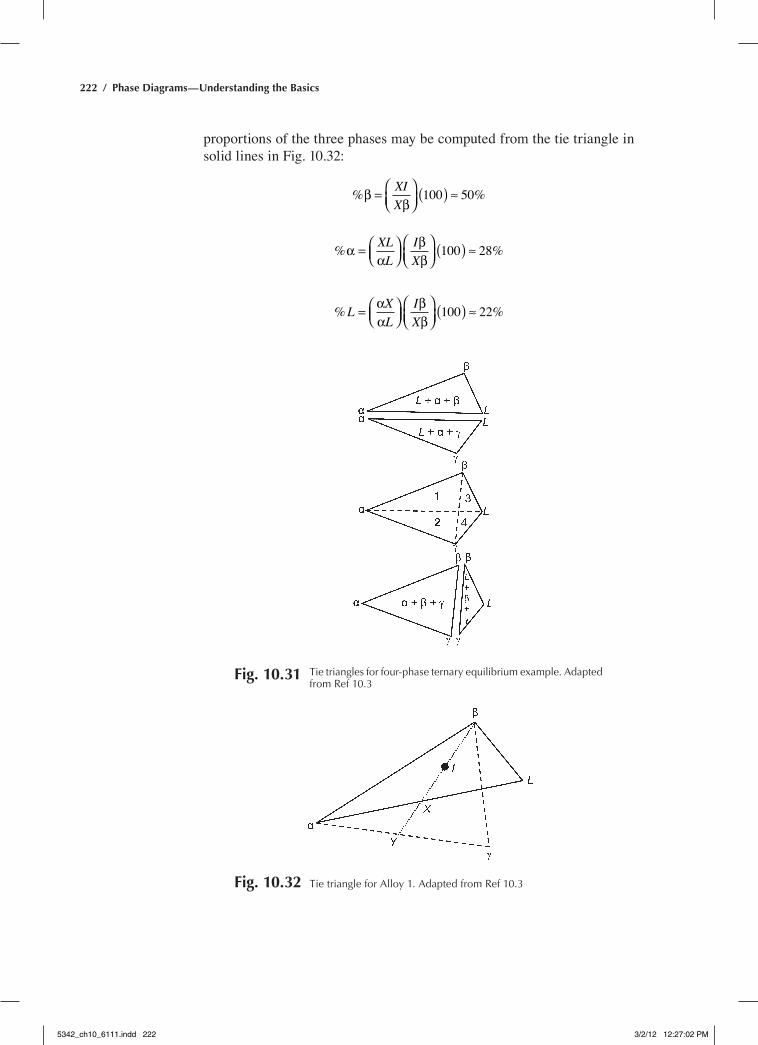
During heating or cooling, two phases interact to form two new phases. This four-phase equilibrium is shown in the Fig. 10.29 space diagram, and the isothermal sections through the diagram are shown in Fig. 10.30. It can be seen that two three-phase regions, L + α + β and L + α + γ, descend from higher temperature toward the four-phase reaction plane, where they meet to form a horizontal trapezium (kite-shaped region) at the four corners of which the four phases in equilibrium are represented: α + β + γ + L. Beneath the four-phase reaction plane, two new three-phase regions, α Æ β + γ and L + β + γ, originate and descend to lower temperature. Thus, the two tie triangles, L + α + β and L + α + γ in Fig. 10.31, join along a com-mon tie line, αL, to form the four-phase reaction trapezium, and this figure
5342_ch10_6111.indd 218 3/2/12 12:26:59 PM
Chapter 10: Ternary Phase Diagrams / 219
Fig. 10.28 Isotherms taken through space model in Fig. 10.27. adapted from ref 10.3
divides along the tie line βγ to form two new tie triangles, α + β + γ and L + β + γ. An alloy occurring at the composition at which these tie lines cross (intersection of the dashed lines in the central sketch of Fig. 10.31) would be composed entirely of L and α just above the reaction temperature and entirely of β and γ just below the reaction temperature.
5342_ch10_6111.indd 219 3/2/12 12:27:00 PM
220 / Phase Diagrams—Understanding the Basics
Fig. 10.29 temperature-composition space model of a ternary eutectic sys-tem with the reaction L + α Æ β + γ. adapted from ref 10.3
This construction conforms to the phase rule. A four-phase reaction should be univariant; the temperature and compositions of the participat-ing phases should be constant at fixed pressure. These conditions are met, because the four-phase trapezium is horizontal (isothermal) and the one-phase regions touch it only at its four corners where a unique composition is thereby designated for each of the four phases.
Other than the four-phase reaction trapezium, this diagram involves no regions that have not been discussed in previous sections. The one-, two-, and three-phase regions in this diagram are identical in number and des-ignation with those found in the ternary eutectic diagram.
Course of Freezing of Alloys. An examination of the course of freezing of several typical alloys should prove helpful in gaining an understanding of the nature of this four-phase reaction. Four alloys designated 1, 2, 3, and 4 in the central drawing of Fig. 10.31 are considered. It can be seen at once that these change on descending through the four-phase reaction temperature:
5342_ch10_6111.indd 220 3/2/12 12:27:00 PM
Chapter 10: Ternary Phase Diagrams / 221
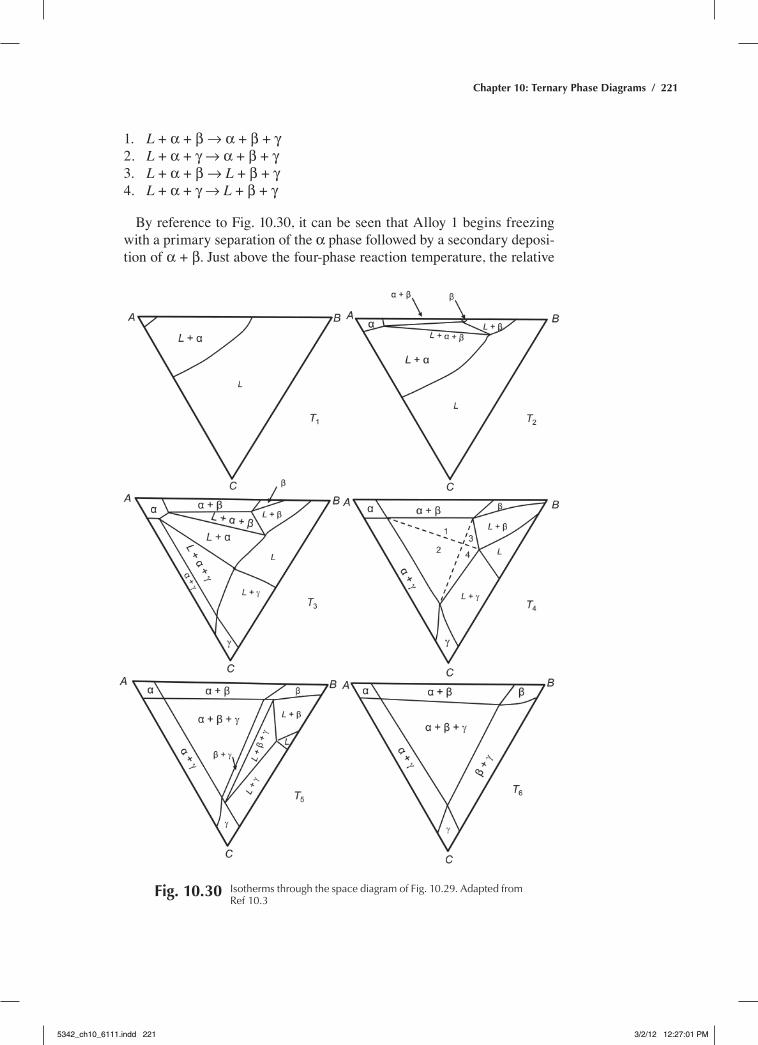
Fig. 10.30 Isotherms through the space diagram of Fig. 10.29. adapted from ref 10.3
L1. + α + β Æ α + β + γL2. + α + γ Æ α + β + γL3. + α + β Æ L + β + γL4. + α + γ Æ L + β + γ
By reference to Fig. 10.30, it can be seen that Alloy 1 begins freezing with a primary separation of the α phase followed by a secondary deposi-tion of α + β. Just above the four-phase reaction temperature, the relative
5342_ch10_6111.indd 221 3/2/12 12:27:01 PM
222 / Phase Diagrams—Understanding the Basics
proportions of the three phases may be computed from the tie triangle in solid lines in Fig. 10.32:
% %ββ
=
( ) ≈XIX
100 50
% %αα
ββ
=
( ) ≈XLL
IX
100 28
% %L XL
IX
=
( ) ≈αα
ββ
100 22
Fig. 10.31 tie triangles for four-phase ternary equilibrium example. adapted from ref 10.3
Fig. 10.32 tie triangle for alloy 1. adapted from ref 10.3
5342_ch10_6111.indd 222 3/2/12 12:27:02 PM
Chapter 10: Ternary Phase Diagrams / 223
Just below the four-phase reaction temperature:
% %ββ
=
( ) ≈YIY
100 66
% %α γαγ
ββ
=
( ) ≈Y IX
100 18
% %γ ααγ
ββ
=
( ) ≈Y IY
100 16
The percentage of α has decreased sharply, and the liquid has disap-peared altogether, while the quantity of β has increased, and a substantial quantity of γ has appeared as a new phase. Some of the previously exist-ing α has been consumed by reaction with liquid, as in peritectic reaction. The increase in the quantity of β, coincident with the appearance of γ, more nearly resembles a eutectic reaction. This is what was meant by the opening statement to the effect that this four-phase equilibrium occupies a position midway between the eutectic and peritectic types. Alloy 2 (Fig. 10.31) also begins freezing with a primary separation of the α phase, but the secondary crystallization will be of α + γ in this case, instead of α + β. If the tie triangles were analyzed for this example, it would be found that at the four-phase reaction temperature, the liquid phase is wholly consumed and the α phase is partly redissolved to form a tertiary precipitation of β + γ.
The two alloys that lie closer to the liquid corner of the four-phase tra-pezium, Alloys 3 and 4, differ from the foregoing pair of alloys in that the primary and secondary α crystals should be totally consumed if four-phase reaction goes to completion, while some of the liquid phase should remain to freeze as β + γ at a lower temperature. In both alloys the pri-mary constituent is α, although its quantity may be small because these compositions are close to the lower edge of the L + α field. The secondary constituent in Alloy 3 will be α + β, while that in Alloy 4 will be α + γ. Both will suffer a loss of α and of some liquid to form β + γ in four-phase reaction, and the simultaneous crystallization of β and γ will continue at lower temperature until the supply of liquid is exhausted.
As with peritectic alloys, the formation of reaction layers (envelopment) on the α phase may be expected to interfere with the completion of reaction by hindering the diffusion that must take place to establish equilibrium. Consequently, an excess of the α phase is likely to persist, and some liq-uid is likely to survive through four-phase reaction in all the alloys of this system. This will have the effect of minimizing the differences in structure among the several alloys.
5342_ch10_6111.indd 223 3/2/12 12:27:03 PM
224 / Phase Diagrams—Understanding the Basics
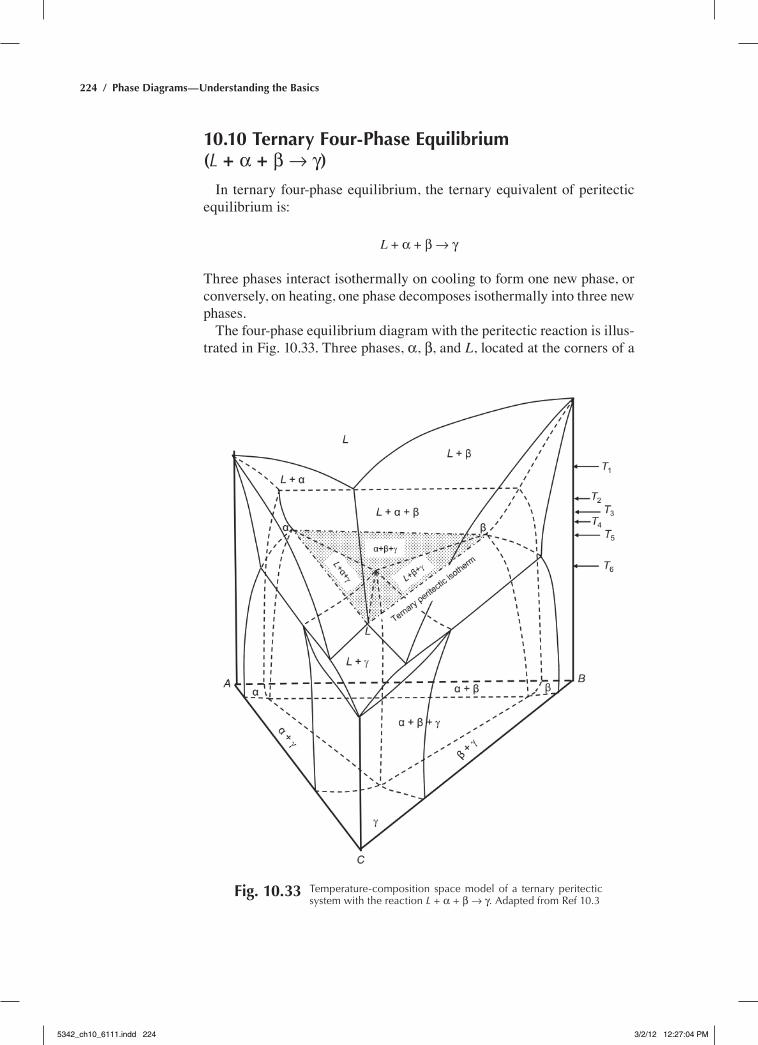
10.10 Ternary Four-Phase Equilibrium (L + α + β Æ γ)
In ternary four-phase equilibrium, the ternary equivalent of peritectic equilibrium is:
L + α + β Æ γ
Three phases interact isothermally on cooling to form one new phase, or conversely, on heating, one phase decomposes isothermally into three new phases.
The four-phase equilibrium diagram with the peritectic reaction is illus-trated in Fig. 10.33. Three phases, α, β, and L, located at the corners of a
Fig. 10.33 temperature-composition space model of a ternary peritectic system with the reaction L + α + β Æ γ. adapted from ref 10.3
5342_ch10_6111.indd 224 3/2/12 12:27:04 PM
Chapter 10: Ternary Phase Diagrams / 225
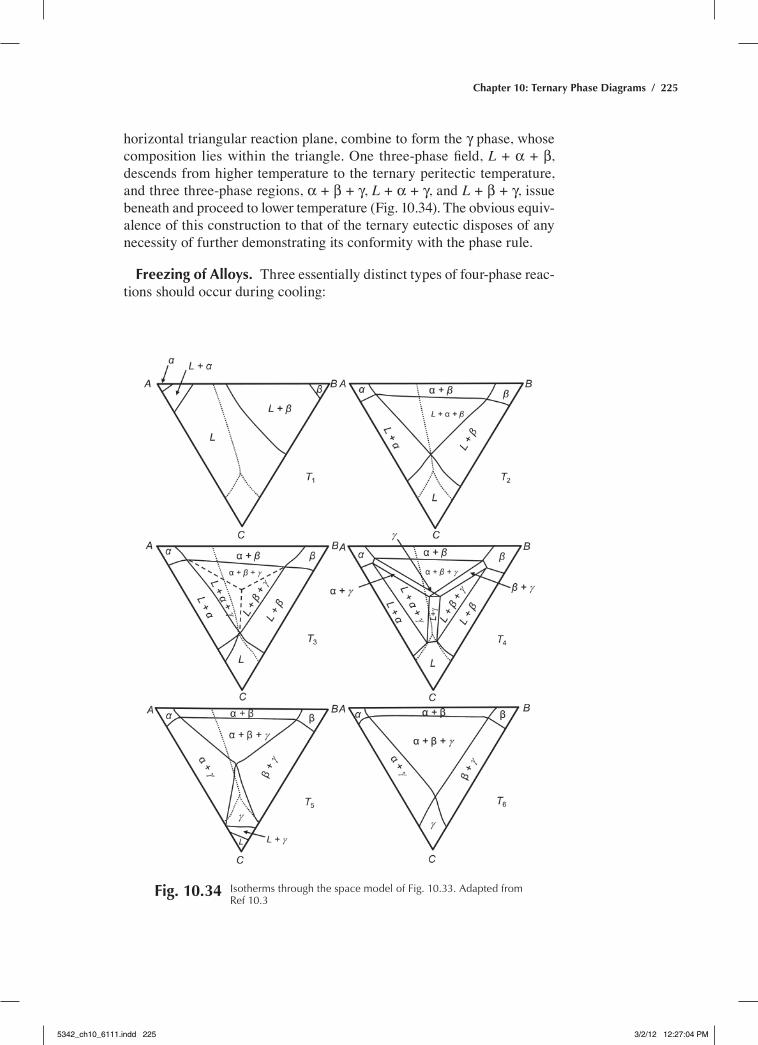
horizontal triangular reaction plane, combine to form the γ phase, whose composition lies within the triangle. One three-phase field, L + α + β, descends from higher temperature to the ternary peritectic temperature, and three three-phase regions, α + β + γ, L + α + γ, and L + β + γ, issue beneath and proceed to lower temperature (Fig. 10.34). The obvious equiv-alence of this construction to that of the ternary eutectic disposes of any necessity of further demonstrating its conformity with the phase rule.
Freezing of Alloys. Three essentially distinct types of four-phase reac-tions should occur during cooling:
Fig. 10.34 Isotherms through the space model of Fig. 10.33. adapted from ref 10.3
5342_ch10_6111.indd 225 3/2/12 12:27:04 PM
226 / Phase Diagrams—Understanding the Basics
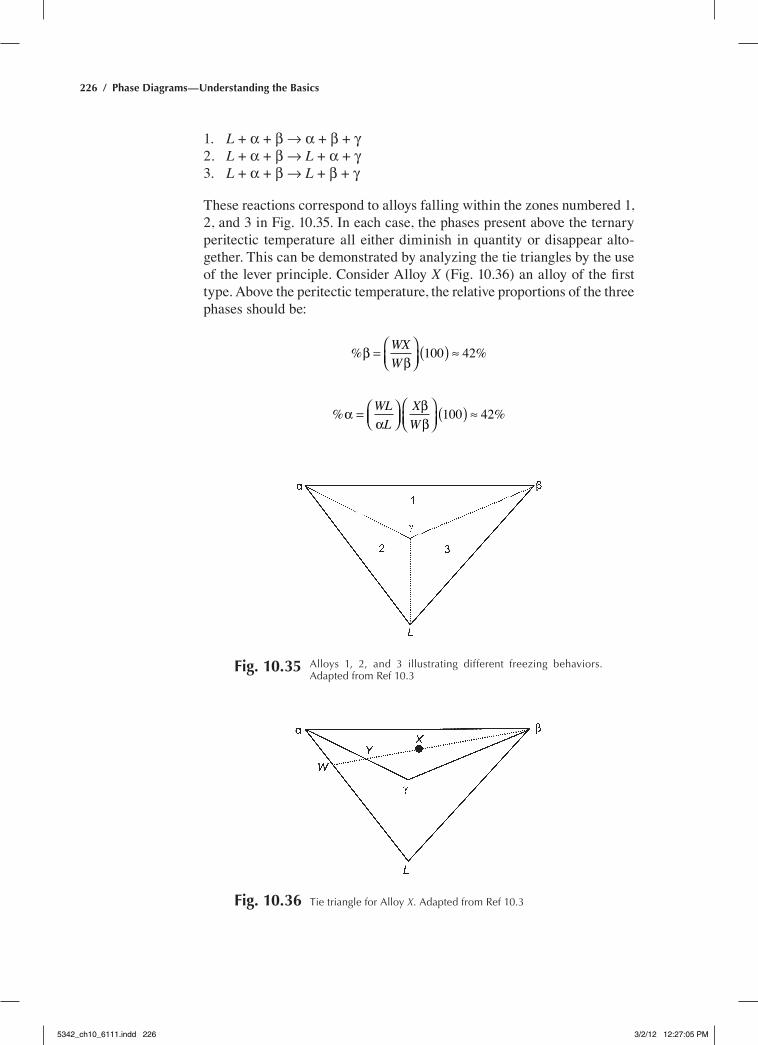
L1. + α + β Æ α + β + γL2. + α + β Æ L + α + γL3. + α + β Æ L + β + γ
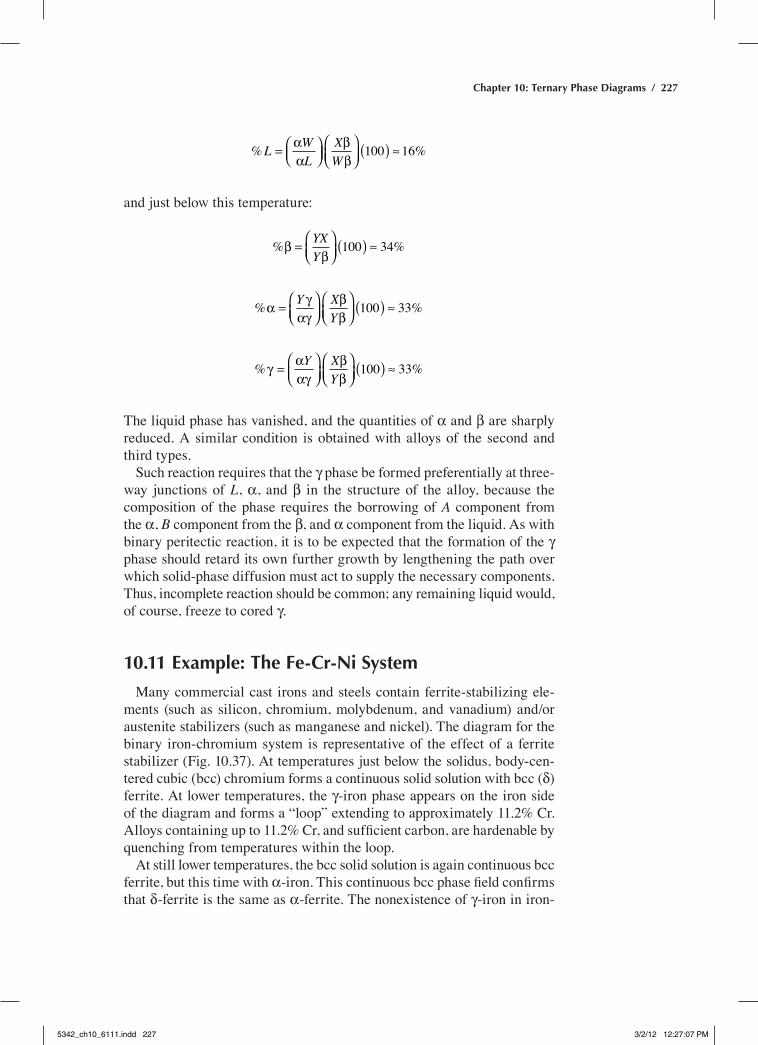
These reactions correspond to alloys falling within the zones numbered 1, 2, and 3 in Fig. 10.35. In each case, the phases present above the ternary peritectic temperature all either diminish in quantity or disappear alto-gether. This can be demonstrated by analyzing the tie triangles by the use of the lever principle. Consider Alloy X (Fig. 10.36) an alloy of the first type. Above the peritectic temperature, the relative proportions of the three phases should be:
% %ββ
=
( ) ≈WXW
100 42
% %αα
ββ
=
( ) ≈WLL
XW
100 42
Fig. 10.35 alloys 1, 2, and 3 illustrating different freezing behaviors. adapted from ref 10.3
Fig. 10.36 tie triangle for alloy X. adapted from ref 10.3
5342_ch10_6111.indd 226 3/2/12 12:27:05 PM
Chapter 10: Ternary Phase Diagrams / 227
% %L WL
XW
=
( ) ≈αα
ββ
100 16
and just below this temperature:
% %ββ
=
( ) ≈YXY
100 34
% %α γαγ
ββ
=
( ) ≈Y XY
100 33
% %γ ααγ
ββ
=
( ) ≈Y XY
100 33
The liquid phase has vanished, and the quantities of α and β are sharply reduced. A similar condition is obtained with alloys of the second and third types.
Such reaction requires that the γ phase be formed preferentially at three-way junctions of L, α, and β in the structure of the alloy, because the composition of the phase requires the borrowing of A component from the α, B component from the β, and α component from the liquid. As with binary peritectic reaction, it is to be expected that the formation of the γ phase should retard its own further growth by lengthening the path over which solid-phase diffusion must act to supply the necessary components. Thus, incomplete reaction should be common; any remaining liquid would, of course, freeze to cored γ.
10.11 Example: The Fe-Cr-Ni System
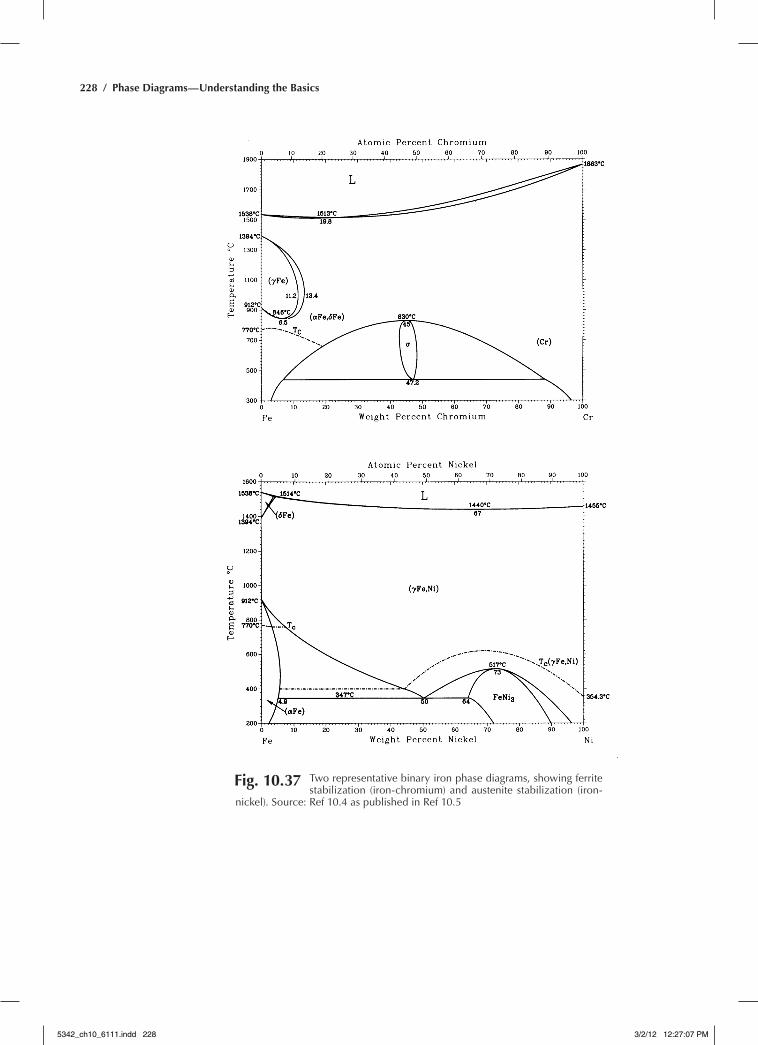
Many commercial cast irons and steels contain ferrite-stabilizing ele-ments (such as silicon, chromium, molybdenum, and vanadium) and/or austenite stabilizers (such as manganese and nickel). The diagram for the binary iron-chromium system is representative of the effect of a ferrite stabilizer (Fig. 10.37). At temperatures just below the solidus, body-cen-tered cubic (bcc) chromium forms a continuous solid solution with bcc (δ) ferrite. At lower temperatures, the γ-iron phase appears on the iron side of the diagram and forms a “loop” extending to approximately 11.2% Cr. Alloys containing up to 11.2% Cr, and sufficient carbon, are hardenable by quenching from temperatures within the loop.
At still lower temperatures, the bcc solid solution is again continuous bcc ferrite, but this time with α-iron. This continuous bcc phase field confirms that δ-ferrite is the same as α-ferrite. The nonexistence of γ-iron in iron-
5342_ch10_6111.indd 227 3/2/12 12:27:07 PM
228 / Phase Diagrams—Understanding the Basics
Fig. 10.37 two representative binary iron phase diagrams, showing ferrite stabilization (iron-chromium) and austenite stabilization (iron-
nickel). Source: ref 10.4 as published in ref 10.5
5342_ch10_6111.indd 228 3/2/12 12:27:07 PM
Chapter 10: Ternary Phase Diagrams / 229
chromium alloys having more than approximately 13% Cr, in the absence of carbon, is an important factor in both the hardenable and nonhardenable grades of iron-chromium stainless steels. At these lower temperatures, a material known as σ phase also appears in different amounts from approx-imately 14 to 90% Cr. This is a hard, brittle phase and usually should be avoided in commercial stainless steels. Formation of σ, however, is time dependent; long periods at elevated temperatures are usually required.
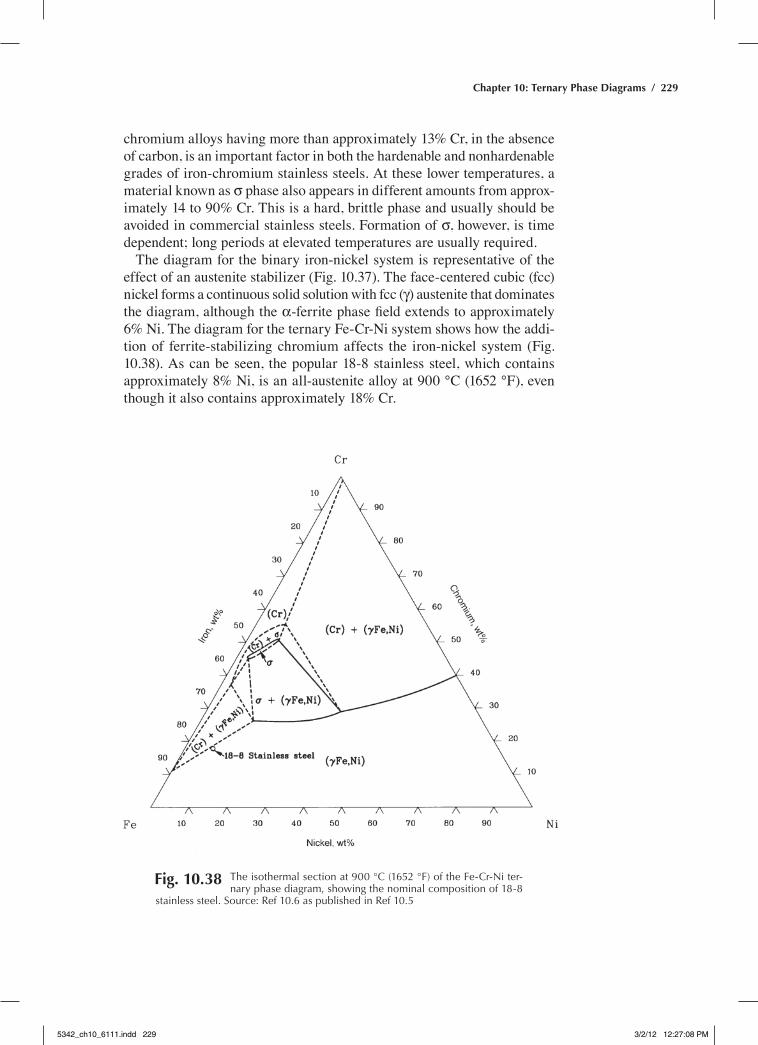
The diagram for the binary iron-nickel system is representative of the effect of an austenite stabilizer (Fig. 10.37). The face-centered cubic (fcc) nickel forms a continuous solid solution with fcc (γ) austenite that dominates the diagram, although the α-ferrite phase field extends to approximately 6% ni. The diagram for the ternary Fe-Cr-ni system shows how the addi-tion of ferrite-stabilizing chromium affects the iron-nickel system (Fig. 10.38). As can be seen, the popular 18-8 stainless steel, which contains approximately 8% Ni, is an all-austenite alloy at 900 °C (1652 °F), even though it also contains approximately 18% Cr.
Fig. 10.38 the isothermal section at 900 °C (1652 °F) of the Fe-Cr-Ni ter-nary phase diagram, showing the nominal composition of 18-8
stainless steel. Source: ref 10.6 as published in ref 10.5
5342_ch10_6111.indd 229 3/2/12 12:27:08 PM
230 / Phase Diagrams—Understanding the Basics
ACKNOWLEDGMENT
The majority of the material in this chapter was adapted from Phase Dia-grams in Metallurgy by F.n. rhines, McGraw-Hill, 1956.
REFERENCES
10.1 D.r. Askeland, The Science and Engineering of Materials, 2nd ed., PWS-KenT, 1989
10.2 C-Cr-Fe Phase Diagram (1966 Tricot r.), ASM Alloy Phase Diagrams Center, P. Villars, editor-in-chief; H. Okamoto and K. Cenzual, section editors, ASM International
10.3 F.n. rhines, Phase Diagrams in Metallurgy, McGraw-Hill, 1956 10.4 T.B. Massalski, ed., Binary Alloy. Phase Diagrams, 2nd ed., ASM
International, 1990 10.5 H. Baker, Introduction to Alloy Phase Diagrams, Alloy Phase Dia-
grams, Vol 3, ASM Handbook, ASM International, 1992 10.6 G.V. raynor and V.G. rivlin, Phase Equilibria in Iron Ternary
Alloys, Vol 4, The Institute of Metals, London, 1988
SELECTED REFERENCES
H. Baker, Introduction to Alloy Phase Diagrams, • Alloy Phase Dia-grams, Vol 3, ASM Handbook, ASM International, 1992; reprinted in Desk Handbook: Phase Diagrams for Binary Alloys, 2nd ed., H. Okamoto, ed., 2010D.r.e. West, • Ternary Equilibrium Diagrams, 2nd ed., Chapman & Hall, 1982
5342_ch10_6111.indd 230 3/2/12 12:27:08 PM