Embed Size (px)
Citation preview
Terminal Decision Support Tool
Systems Engineering Graduate Capstone Course
Aiman Al Gingihy
Danielle MurraySara Ataya
Fall 2013Federal Aviation Administration
Table of Contents
Table of Contents........................................................................................................................................2
Table of Figures...........................................................................................................................................3
Table of Tables............................................................................................................................................3
Introduction.................................................................................................................................................5
Background..............................................................................................................................................5
Scope.......................................................................................................................................................5
Performance Gap/Shortfall......................................................................................................................5
Stakeholders............................................................................................................................................7
Objectives................................................................................................................................................8
Deliverables.............................................................................................................................................9
Gap Analysis..............................................................................................................................................10
Scope.....................................................................................................................................................10
Methodology.........................................................................................................................................11
Current State.........................................................................................................................................13
Future State...........................................................................................................................................19
Gap Description.....................................................................................................................................20
Factors and Remedies............................................................................................................................22
Relative Position Indicator.....................................................................................................................27
Lingering Gaps.......................................................................................................................................30
Alternatives Analysis..................................................................................................................................31
Description of Alternatives....................................................................................................................31
Description of Criteria............................................................................................................................33
Hierarchy Value Computations..............................................................................................................35
Alternatives to Criteria Comparison......................................................................................................37
Methods of Analysis..............................................................................................................................38
Group 2......................................................................................................................................................38
Group 3......................................................................................................................................................38
Results...................................................................................................................................................49
2
Conclusions/Recommendation..............................................................................................................49
Schedule....................................................................................................................................................50
References.................................................................................................................................................52
Acronyms...................................................................................................................................................54
Table of Figures
Figure 1: Example of Complex Merge..........................................................................................................6
Figure 2: Project Work Flow for TDST..........................................................................................................9
Figure 3: Airline Aircraft in NAS [24]..........................................................................................................11
Figure 4: Comparison between conventional, RVAN & RNP routes [22]...................................................15
Figure 5: Phases of Terminal Airspace.......................................................................................................16
Figure 6: Aircraft Sequencing Procedure [21]............................................................................................17
Figure 7: Comparison between different curved path approaches...........................................................18
Figure 8: US Airline RNAV/RNP Equipage as of Q2 FY13 [24]....................................................................19
Figure 9: Example of a Complex Merge.....................................................................................................21
Figure 10: Traffic with and without TSS.....................................................................................................23
Figure 11: TSS Toolset................................................................................................................................24
Figure 12: Arrival traffic without TSS.........................................................................................................26
Figure 13: Arrival Traffic with TSS..............................................................................................................27
Figure 14: RPI Application..........................................................................................................................28
Figure 15: RPI in multiple merge situation.................................................................................................28
Figure 16: RPI on the Controller's scope....................................................................................................29
Figure 17: RPI Benefits [26].......................................................................................................................30
Figure 18: Technology readiness level [27]................................................................................................34
Figure 19: Utility vs Cost Graph.................................................................................................................46
Table of Tables
Table 1: List of Subject Matter Experts........................................................................................................7
3
Table 2: Stakeholders..................................................................................................................................8
Table 3: Shortfalls......................................................................................................................................22
Table 4: Comparison of Alternatives..........................................................................................................33
Table 5: Attributes Hierarchy.....................................................................................................................36
Table 6: Alternatives with Scores..............................................................................................................38
Table 7: Swing Weights for Level 2 Attributes...........................................................................................38
Table 8: Level 1 Criteria Swing Weight......................................................................................................39
Table 9: Results of weights elicitation using swing weights.......................................................................40
Table 10: Calculated Value Function..........................................................................................................41
Table 11 Fixed Cost of Alternatives...........................................................................................................45
Table 12 Reoccurring Cost of Alternatives.................................................................................................45
Table 13 Sensitivity Analysis Scenarios......................................................................................................47
Table 14: Priority vs Capability Table.........................................................................................................50
4
Introduction
Background
With the United States currently in the process of transforming its National Airspace System (NAS) to
meet the challenges of the 21st century through Next Generation Air Transportation System (NextGen),
airspace users are calling for a tool that is designed to help improve air traffic efficiency in some of the
nation’s most congested airspace. A decision support tool is needed that allows controllers to maximize
utilization of Performance Based Navigation (PBN) procedures which allow aircraft to fly from the
Terminal Radar Approach Control Facilities (TRACON) arrival fix in a consistent, efficient, and predictable
arrival path to the runway. A “gap” analysis is required to evaluate if current activities associated with
the building of the PBN procedures will satisfy the needs of all stakeholders to include airline.
Scope
This proposal will evaluate the current gap in the National Airspace System within the terminal
environment by utilizing two key methods for analysis; i.e., a gap analysis and an alternatives analysis. A
gap analysis involves determining, documenting, and approving the differences between business
requirements and current capabilities and is a key analysis at a strategic level [in support of operational
and tactical objectives]. An alternatives analysis looks at multiple alternatives so an agency can have a
basis to fund the best project in a rational, defensible manner considering both risk and uncertainty.
These analyses will then serve to inform an appropriate recommendation of what decision support tool
may help fulfill this gap in the NAS. [1]
Performance Gap/Shortfall
The shortfall for this project has originated due to the mission of the Federal Aviation Administration to
move towards NextGen; the Next Generation Air Transportation System. “NextGen's promise is founded
on shifting from ground-based to satellite-based operation. [23]
5
A key component of NextGen is Performance Based Navigation. PBN requires a certain level of
performance from the aircraft and the air crew to fly a certain type of air traffic procedure. It used to be
that aircraft could navigate primarily by ground-based navigational aids. These ground based navigation
aids limited flexibility and are expensive to install and maintain. Using ground-based navaids, aircraft
are forced to fly from one specific fixed location to another specific fixed location.
With the advent of satellite-based navigation (via NextGen), procedures are now developed using point
in space rather than being tied to ground-based navaids. Advanced procedures such as Area Navigation
(RNAV) and Required Navigation Performance (RNP) take advantage of this satellite-based technology.
NAV and RNP gives greater aircraft flexibility in flight paths and profiles, and it enables them to fly more
precise and efficient routes. This has the potential for flights to reduce the miles flown, save fuel, and
improve efficiency. [23]
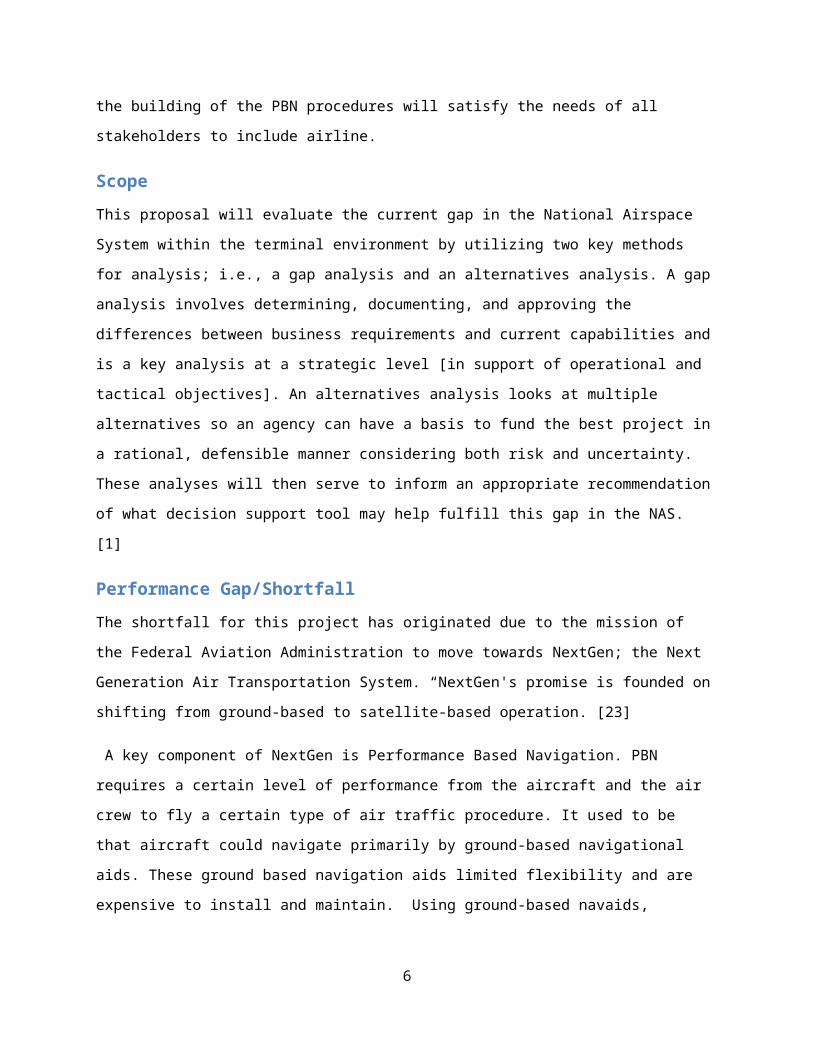
The use of a decision support tool in the terminal environment when coupled with RNAV and RNP
procedures, will improve capacity, enhance efficiency, and lessen environmental impact. Below is an
example of these types of satellite based arrival procedures. Both tracks (in red and blue) depict arrival
paths for aircraft to fly to the runway. The blue shows a straight in RNAV approach while the red is a
complex merge of both RNAV and RNP approaches.
6
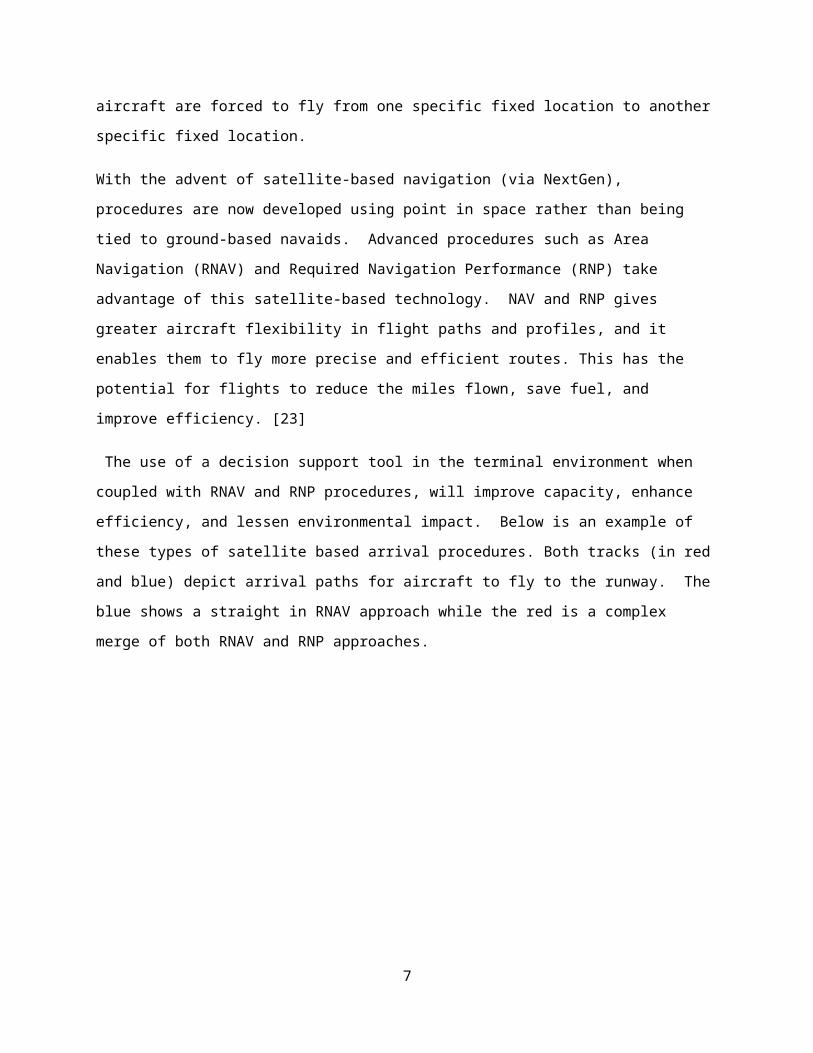
Figure 1: Example of Complex Merge
Stakeholders
In order to address the shortfall, a number of stakeholders are identified and their direct role in is
investigated throughout the report to ensure their needs are being met. The team also identified a list
of Subject Matter Experts (a team of five individuals) and the team has been regularly engaged with
these people. The respective areas of expertise and place of work are listed below.
Subject Matter Expert Organization
En Route Controller/TBFM SME Federal Aviation Administration
Former Airline Pilot/Current FAA Manager Federal Aviation Administration
Terminal Automation SME MITRE Corporation
7
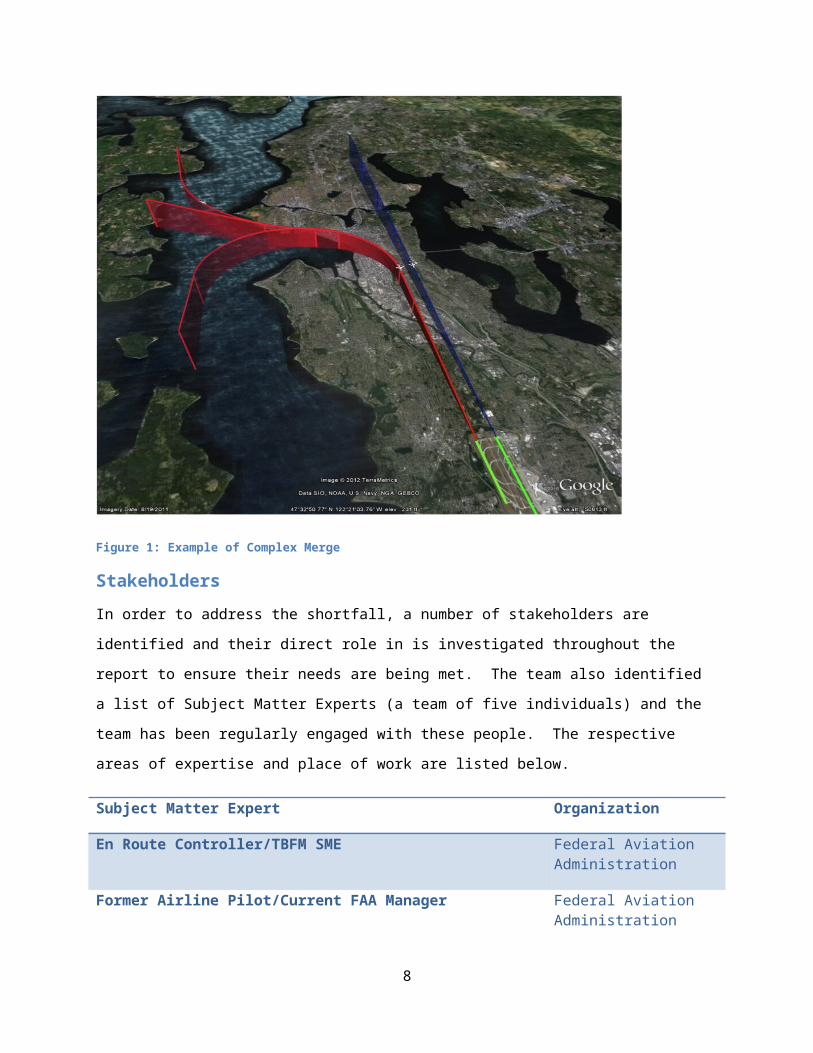
Terminal/PBN Automation SME Federal Aviation Administration
Dr Lance Sherry, Executive Director of the Center for Air Transportation Systems Research
George Mason University
Paula Lewis, PA FAA - Assistant Administrator for Regions and Center Operations
George Mason University
Dr. Andrew Loerch, Associate Professor/Associate ChairSEOR Department
George Mason University
Table 1: List of Subject Matter Experts
The list of TDST’s identified stakeholders are in the table below.
Stakeholder Role in this Problem SpaceAirline Operators Roughly 65% of airline operators have equipped their aircraft to be
able to fly more efficient procedures but controllers do not have the ability to keep aircraft on these procedures Their goal is to save money by flying more efficient procedures.
FAA Controllers The controller is the stakeholder who uses a decision support tool in order to keep aircraft on procedures. This tool will allow them to navigate complex merges in high density airports.
NATCA NATCA is the FAA controller union and they must buy into any activity and subsequent implementation at facilities throughout the NAS.
FAA Headquarters Headquarters is the party responsible for prototyping, developing, implementing, and sustaining the tool.
US Taxpayer Tax dollars pay for lifecycle cost of decision support tool
Airline Passengers Any savings that the airline realizes is normally passed onto the airline passenger. More efficient arrivals also mean streamlined travel for passengers.
8
Table 2: Stakeholders
Objectives
The primary objectives for the execution of the project are listed below. These bullets represent all
areas the team will investigate towards meeting the end goal of this effort. The body of this proposal
goes into more detail on each objective listed below.
Identify Sponsor/Stakeholders/Subject Matter Experts
Perform gap analysis to determine unmet need
Identify potential decision tool(s) to evaluate based on the gap analysis
Identify metrics and weigh them to perform alternative analysis
Present results of all analyses
Based on results, recommend and suggest implementation strategy
Present recommendation to key subject matter experts for inputs and possible incorporation
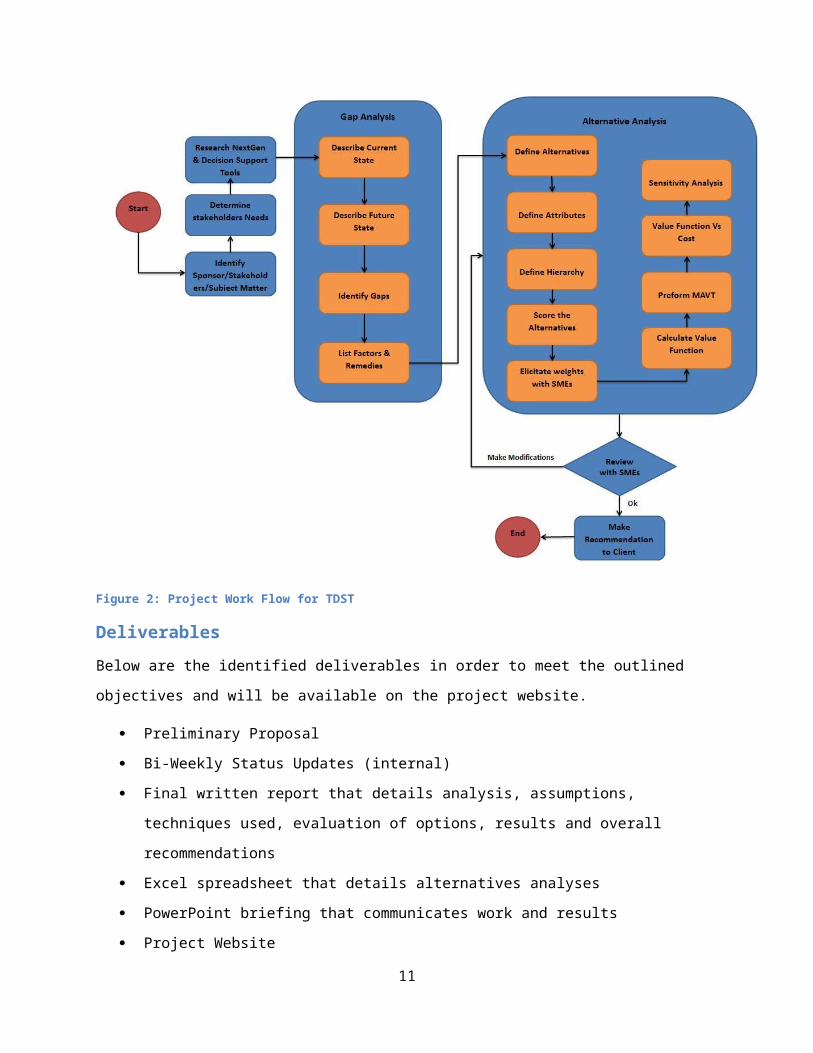
The diagram below depicts the project work flow for TDST.
9
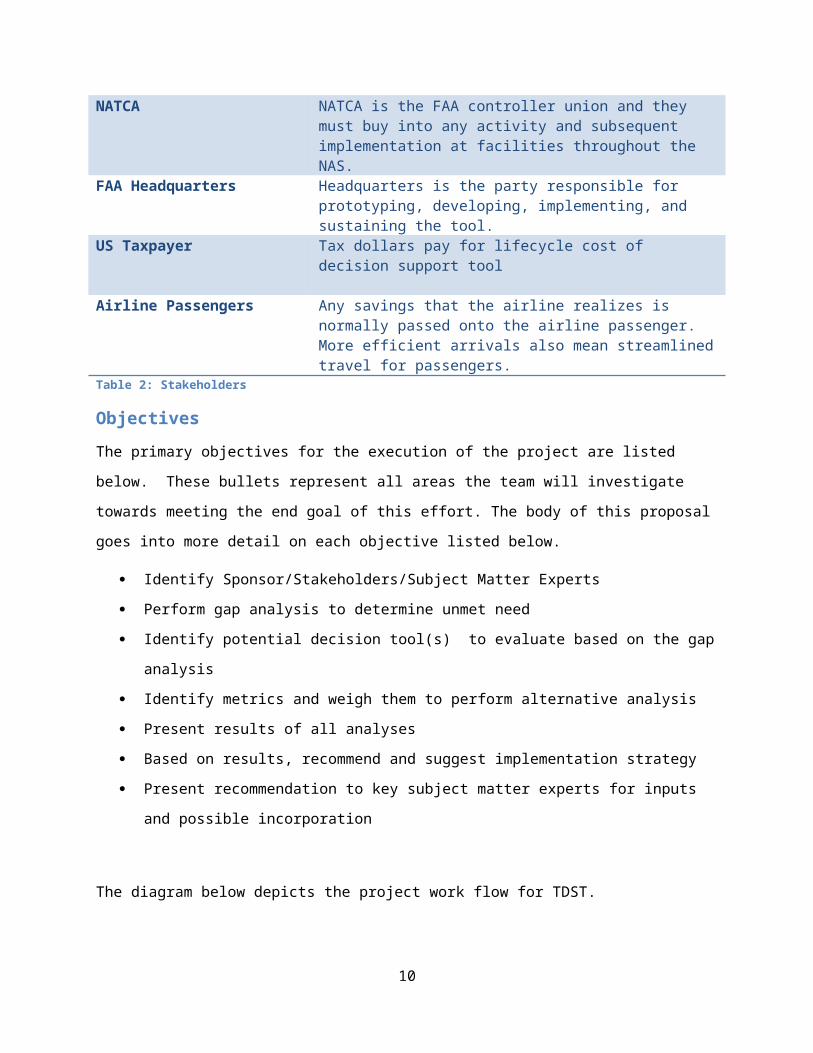
Figure 2: Project Work Flow for TDST
Deliverables
Below are the identified deliverables in order to meet the outlined objectives and will be available on
the project website.
Preliminary Proposal
Bi-Weekly Status Updates (internal)
Final written report that details analysis, assumptions, techniques used, evaluation of options,
results and overall recommendations
Excel spreadsheet that details alternatives analyses
PowerPoint briefing that communicates work and results
Project Website
10
Gap Analysis
Scope
To scope this activity, the team is focusing on mixed equipage, complex operations at high density
locations. This is due to the fact that merges are much more complex (difficult) for controllers at these
types of locations. The following table lists the Core 30 airports identified by the FAA directly from their
website. These Core Airports are the 29 large hub airports and Memphis International Airport.
ATL - Hartsfield-Jackson Atlanta Intl
BOS - Boston Logan Intl
BWI - Baltimore/Washington Intl
CLT - Charlotte Douglas Intl
DCA - Ronald Reagan Washington National
DEN - Denver Intl
DFW - Dallas/Fort Worth Intl
DTW - Detroit Metropolitan Wayne County
EWR - Newark Liberty Intl
FLL - Fort Lauderdale/Hollywood Intl
HNL - Honolulu Intl
IAD - Washington Dulles Intl
IAH - George Bush Houston Intercontinental
JFK - New York John F. Kennedy Intl
LAS - Las Vegas McCarran Intl
LAX - Los Angeles Intl
LGA - New York LaGuardia
MCO - Orlando Intl
MDW - Chicago Midway
MEM - Memphis Intl
MIA - Miami Intl
MSP - Minneapolis/St. Paul Intl
ORD - Chicago O`Hare Intl
PHL - Philadelphia Intl
PHX - Phoenix Sky Harbor Intl
11
SAN - San Diego Intl
SEA - Seattle/Tacoma Intl
SFO - San Francisco Intl
SLC - Salt Lake City Intl
TPA - Tampa Intl
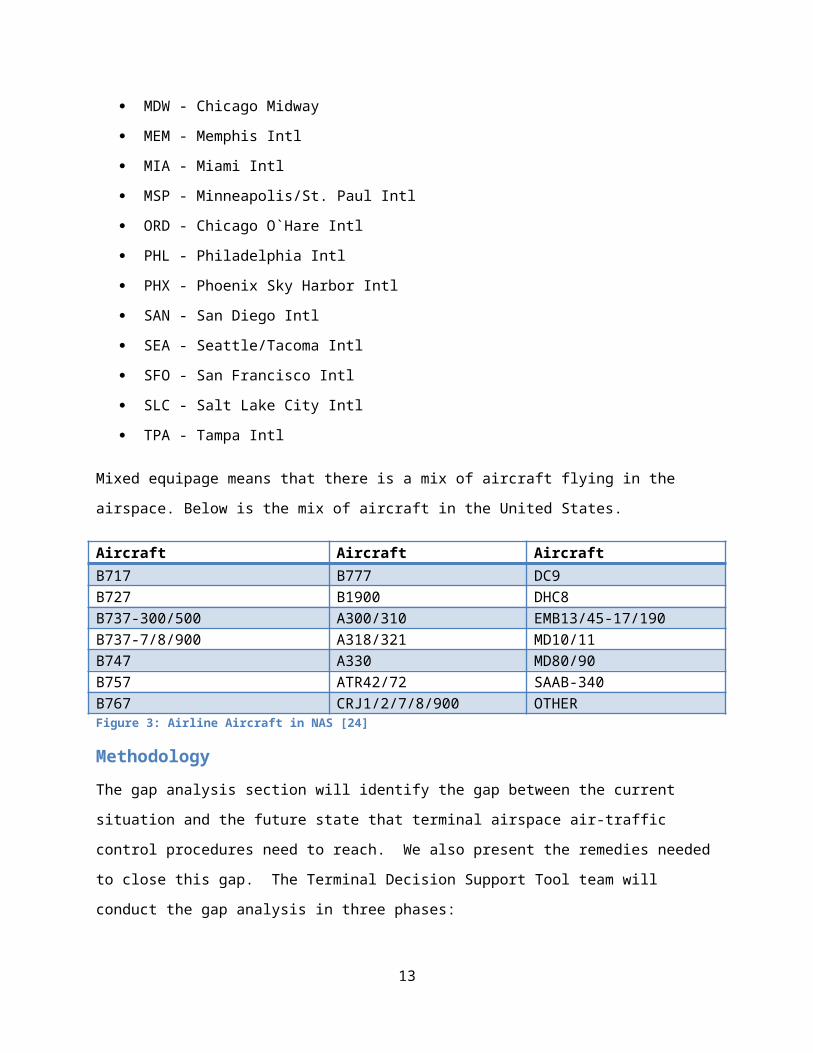
Mixed equipage means that there is a mix of aircraft flying in the airspace. Below is the mix of aircraft in
the United States.
Aircraft Aircraft AircraftB717 B777 DC9B727 B1900 DHC8B737-300/500 A300/310 EMB13/45-17/190B737-7/8/900 A318/321 MD10/11B747 A330 MD80/90B757 ATR42/72 SAAB-340B767 CRJ1/2/7/8/900 OTHERFigure 3: Airline Aircraft in NAS [24]
Methodology
The gap analysis section will identify the gap between the current situation and the future state that
terminal airspace air-traffic control procedures need to reach. We also present the remedies needed to
close this gap. The Terminal Decision Support Tool team will conduct the gap analysis in three phases:
State Description
Gap Identification
Remedies
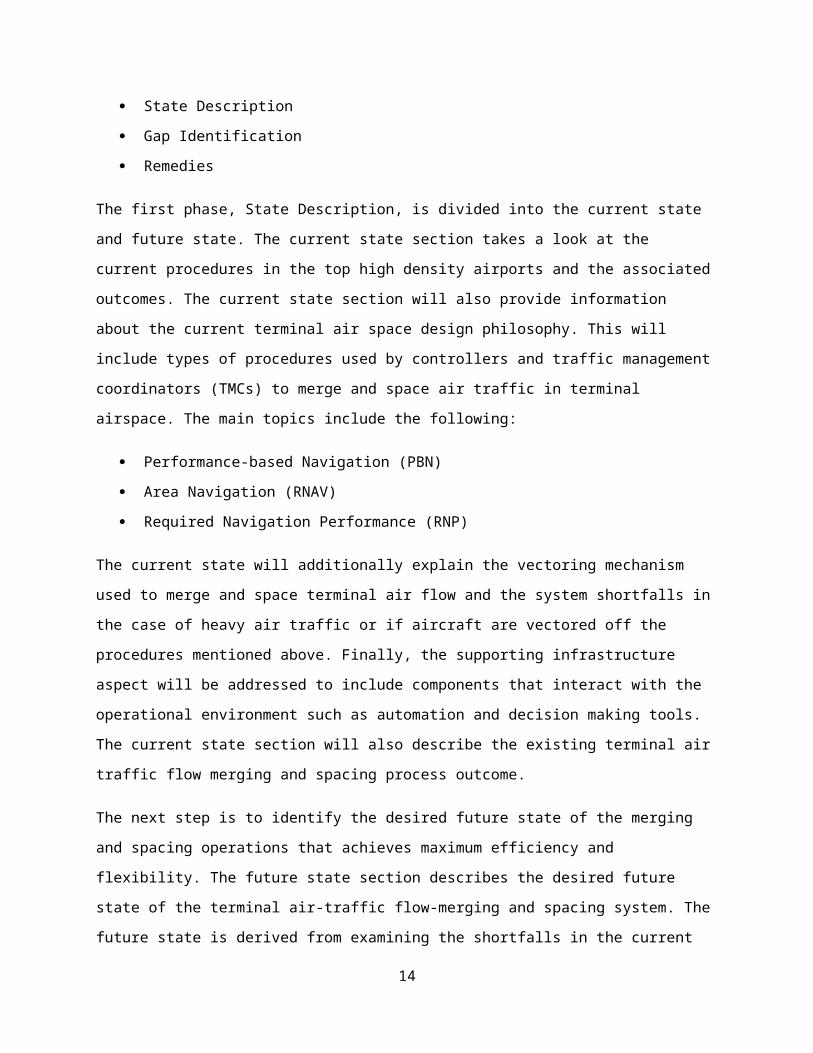
The first phase, State Description, is divided into the current state and future state. The current state
section takes a look at the current procedures in the top high density airports and the associated
outcomes. The current state section will also provide information about the current terminal air space
design philosophy. This will include types of procedures used by controllers and traffic management
coordinators (TMCs) to merge and space air traffic in terminal airspace. The main topics include the
following:
Performance-based Navigation (PBN)
Area Navigation (RNAV)
Required Navigation Performance (RNP)
12
The current state will additionally explain the vectoring mechanism used to merge and space terminal
air flow and the system shortfalls in the case of heavy air traffic or if aircraft are vectored off the
procedures mentioned above. Finally, the supporting infrastructure aspect will be addressed to include
components that interact with the operational environment such as automation and decision making
tools. The current state section will also describe the existing terminal air traffic flow merging and
spacing process outcome.
The next step is to identify the desired future state of the merging and spacing operations that achieves
maximum efficiency and flexibility. The future state section describes the desired future state of the
terminal air-traffic flow-merging and spacing system. The future state is derived from examining the
shortfalls in the current state and the procedures that would be needed to alleviate the shortcomings.
An evaluation of the costs and benefits of doing so are included in this report. The future state section
will also include the outcome of the desired terminal air traffic flow merging and spacing system. The
shortfalls in the current state will be the main driver for these outcomes. Some of the outcomes
addressed include aircraft fuel burn, aircraft emissions, merging and spacing predictability and ability of
controllers to leave aircraft on RNP curved path approaches.
Once the gap between the currents and future state is identified, factors responsible for such gap will be
listed. Finally, in the remedies section we determine if the proposed tools (Relative Position Indicator,
Terminal Sequencing and Spacing and a hybrid of the two) overcome the gap identified between the
current and future state. If the proposed tools did not overcome any of the identified gap aspects, a list
of these aspects will be identified.
Following the gap analysis, a full-on recommendation will be delivered to determine which courses of
action(s) need to be taken to fulfill unmet need(s). Taking a look at the overarching enterprise
architecture and based on TDSP research knowledge, TDST will verify that no glaring gaps are left
unnoticed based on the needs of stakeholders and desired outcome.
Current State
“Our current ATC system is outdated. It is a very large sky, but we don't use very much of it, and what
we do use, we use pretty inefficiently. The airways we fly today are 8 nautical miles wide because they
have to be.”[23]
13
The aviation industry strives to meet the continually changing needs for air travel. This is due to the fact
that air travel continues to be a fundamental part of the transportation system in the US and air space is
expected to get even busier over the next two decades. The FAA is revolutionizing the way aircraft are
navigating the crowded national airspace (NAS) by creating a new vision called The Next Generation Air
Transportation System (NextGen). FAA is proposing new navigation standards in order to transform the
national airspace. The main component of this new vision is called Performance Based Navigation;
which is a navigation framework designed to increase efficiency, capacity and safety of modern aviation.
PBN framework will be explained in further detail in the next section. In keeping with the scope of TDST,
the primary focus of this section will be on the terminal airspace procedures developed in support of
NextGen (RNAV/RNP). The current state of the terminal environment will also be discussed.
Performance Based Navigation
PBN is a framework for defining performance requirements in “navigation specifications.” The PBN
framework applies to air traffic routes, instrument procedures and terminal airspace. It provides a basis
for the design and implementation of automated flight paths as well as for airspace design and obstacle
clearance. It also offers a straightforward means to communicate the performance and operational
capabilities necessary for the utilization of such paths and airspace. Once the performance level is
established on the basis of operational needs the aircraft's own capability determines whether the
aircraft can safely achieve the specified performance and thus qualify for the operation. With PBN,
aircraft use advanced flight management flight systems, on board inertial systems, heads up display
systems and other satellite and ground systems to compute position, speed and other vital navigation
information. The new approach automates the aircrafts entire navigation function from departure to
landing
There are two key elements associated with PBN. The first is area navigation, better known as RNAV and
the second is required navigation performance, known as RNP. Together, RNAV and RNP are the basic
building block for PBN resulting in advancing the nation air traffic management system in the future as
aircrafts are no longer mainly relaying on on-ground navigation equipment [17]
Area Navigation (RNAV)
RNAV is the current method of navigation that permits an aircraft to fly a specified flight path within the
coverage of space based navigation aids using the concept of “way points”. RNAV paths are used in lieu
of routes defined by ground-based navigation aids. With RNAV, pilots are no longer flying zigzag paths
14
from one ground navigation station to the other, instead they fly a direct path to their final destination
which results in reduced flight distances and fuel cost. [18]
RNAV paths are implemented through a point-to-point navigation method provided by modem avionics
that enables aircraft routing independent of the location of ground-based navigational aids. RNAV
procedures are in use today by commercial, military, and general aviation aircraft throughout the world.
RNAV avionics allow aircraft to fly a pre-programmed lateral profile stored in the aircraft's navigation
database defined by a series of waypoints and path types between those waypoints (e.g., straight to the
waypoint, curved along a fixed radius to the waypoint, etc). In today's commercial aviation fleet, almost
all aircrafts are equipped with the capability to support advanced RNAV procedures -that is, procedures
defined with required vertical and speed constraints associated with some or all of the waypoints. [18]
[19]
RNAV departure procedures implemented at Atlanta in 2006 have shown a measured capacity gain of 9
to 12 departures per hour. RNAV procedures also result in reducing the workload associated with the
routine voice communications between pilot and air traffic controllers. Atlanta RNAV departure
procedures show a decrease of about 50 percent in voice communications required between the pilots
and controllers. [23]
Required Navigation Performance (RNP)
RNP is the second fundamental element of PBN navigation. RNAV and RNP systems are fundamentally
similar. The key difference between them is the requirement for on-board performance monitoring and
alerting. A navigation specification that includes a requirement for on-board navigation performance
monitoring and alerting is referred to as an RNP specification. RNP allows airplanes to fly even more
precise and accurate paths. Through a concept called containment, aircraft can use onboard avionics
and flight management systems to fly through a high way in the sky, traversing the airspace more
efficiently. Pilots are able to fly this highway with pin point accuracy and repeatability. With RNP, more
accurate paths can be placed within the limited terminal airspace, creating more lanes, more capacity
and efficient terminal approaches. RNP provides the aircrafts with both lateral and vertical guidance
which can be flown by the autopilot. This significantly reduces pilots work load while flying the complex
curved path approaches in terminal airspace. In essence, RNP attempts to make the cleanest straight
line as well as constant radius turns which allows aircrafts to efficiently handle cure-path approaches in
the terminal airspace In addition to the safety benefits, these approaches provide several other
significant advantages, a cast and 3-degree decent path had replaced what used to be dive and drive
15
approach. Descending with a stable approach power setting can significantly improve the environmental
impacts by reducing noise since aircrafts are no longer required to fly at low latitudes for long distances
while approaching the airport. It also saves fuel and reduces emissions by minimizing changes in thrust.
With its accuracy and reliability, RNP enable simultaneous approaches to closely spaced parallel run
ways in reduced visibility conditions results in increase airport capacity. [18] [20]
It is estimated that RNP has the potential to cut global CO-2 emissions by 13 million metric tons. That is
1.2 billion gallons of fuel. RNP procedures at Portland have resulted in fuel savings of 150,000 gallons
and a reduction of 7,500 tons of carbon emissions since implementation in 2006.[23]
The figure below articulates the differences between the different routing structure which span
conventional routes, RNAV routes, and RNP routes. From the image, it is clear that the advanced routing
demonstrates a clear gain in flexibility.
Figure 4: Comparison between conventional, RVAN & RNP routes [22]
Current Transition of Aircraft into Terminal Airspace
The focus of this topic is how to enable PBN procedures in the Terminal Environment. Currently, a
technology exists in the En Route environment, Time Based follow management (TBFM). This system is
the technology and method used for adjusting capacity/ demand imbalances at select airports and
arrival fixes. It establishes a schedule with an assumed runway assignment and runway sequence for
each arriving flight. The TBFM schedule reflects a big picture view of Terminal Radar Approach Control
16
Facilities (TRACON) operations in that it considers arrival demand, available airport capacity, and
International Civil Aviation Organization (ICAO) flight plan information. It then identifies the need for
flight-specific delay and distributes that delay along the flights path using speed control or modifying the
RNAV and RNP paths. When aircraft crosses an adapted location in En Route airspace, the schedule for
that aircraft is frozen (that is, it will not change automatically). Once a meter fix is reached along the
navigation path, the aircraft enters the terminal airspace. At this point, the schedule is handled off to the
terminal airspace controllers (figure below). Within the terminal air space, RNAV and RNP terminal
procedures, including standard terminal arrivals (STARs) and curved path approaches, are followed by
the aircrafts under controllers’ guidance. [3] [15]
The figure below shows the different phases aircraft go through as they approach the terminal airspace
as discussed above. [13]
Figure 5: Phases of Terminal Airspace
Controllers take responsibility to sequence, space and merge aircrafts as they approach the merge
points in the terminal airspace. The first ATC method used by controllers to manage this process is speed
control since speed directives do not add distance to a path, and can be used easily on an RNAV
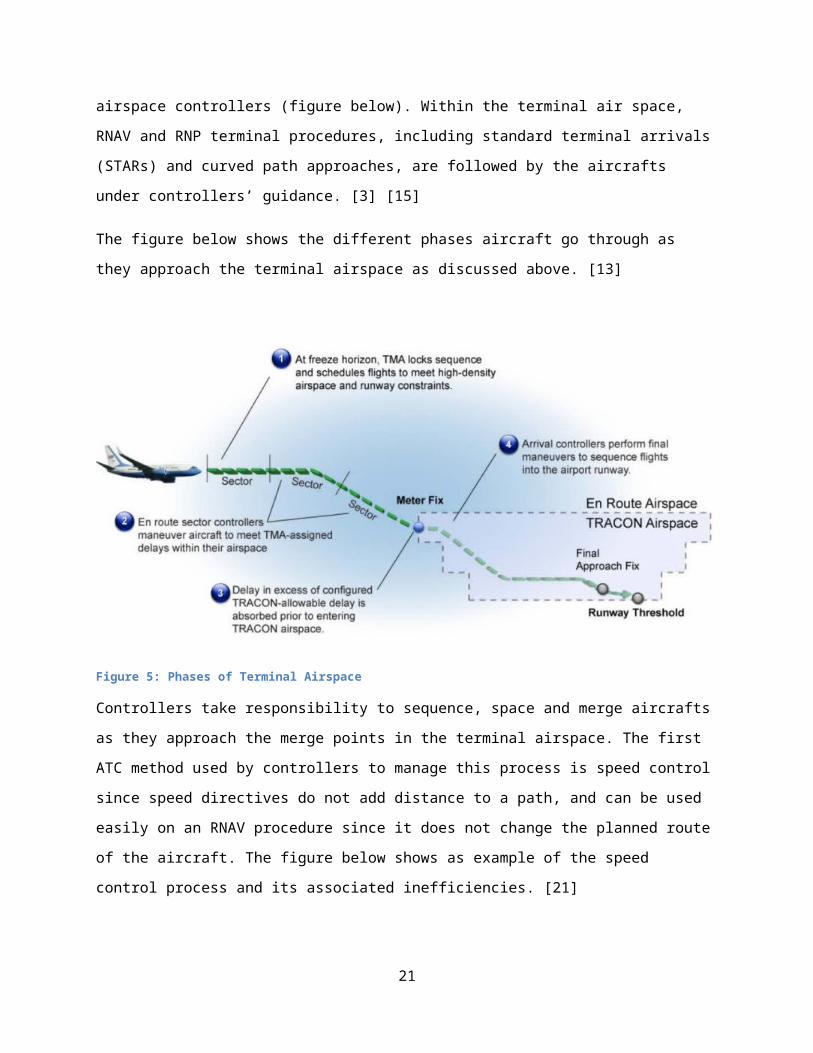
procedure since it does not change the planned route of the aircraft. The figure below shows as example
of the speed control process and its associated inefficiencies. [21]
17
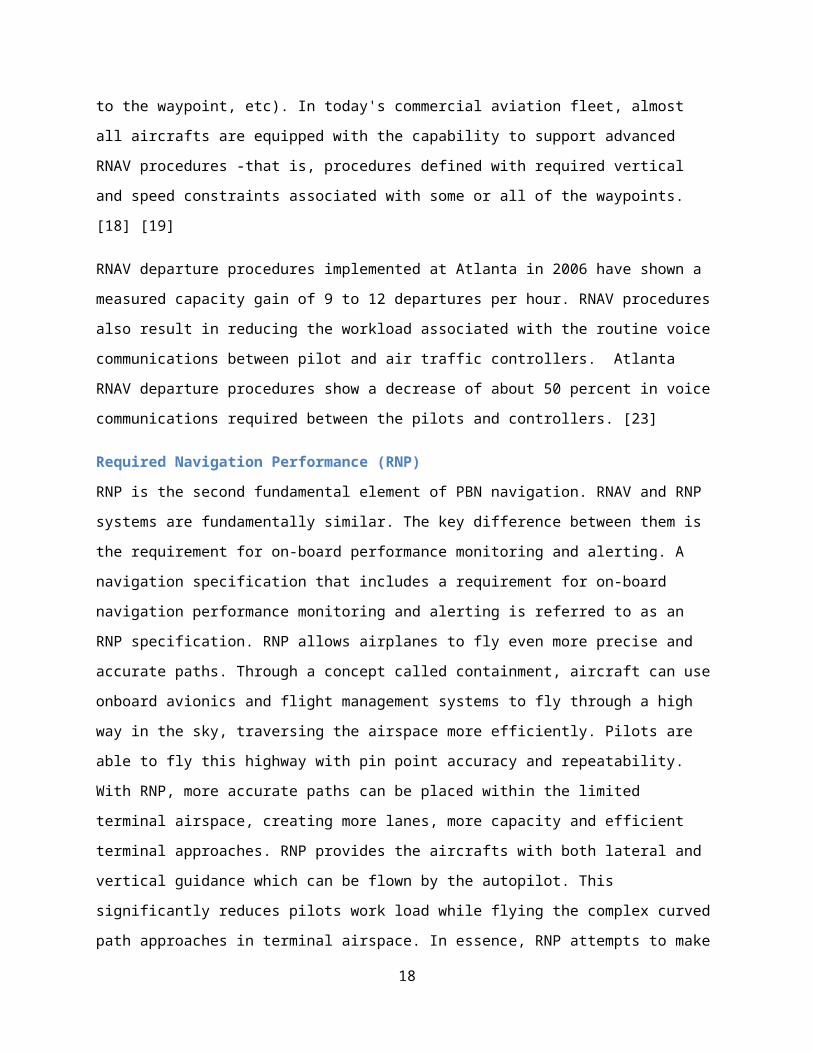
Figure 6: Aircraft Sequencing Procedure [21]
Although speed control has the least effect on the RNAV and RNP procedures, sometimes this method
cannot be fully utilized because there is a limit to the amount of speed- control spacing adjustment that
can be accomplished on a given segment of a route. As an alternative, controllers resort to vectoring to
keep the aircraft on the routes, follow TBFM sequencing and scheduling plan, for spacing or conflict
resolution purpose. Vectoring air flow means altering the lateral path flown for managing conflicts and
merges. Vectoring, at terminal merge points, routinely interrupts or cancels PBN procedures. That’s why
speed directives are preferred as opposed to lateral vectoring since they are less disruptive, do not add
distance to a path, and can be used easily on an RNAV procedure.
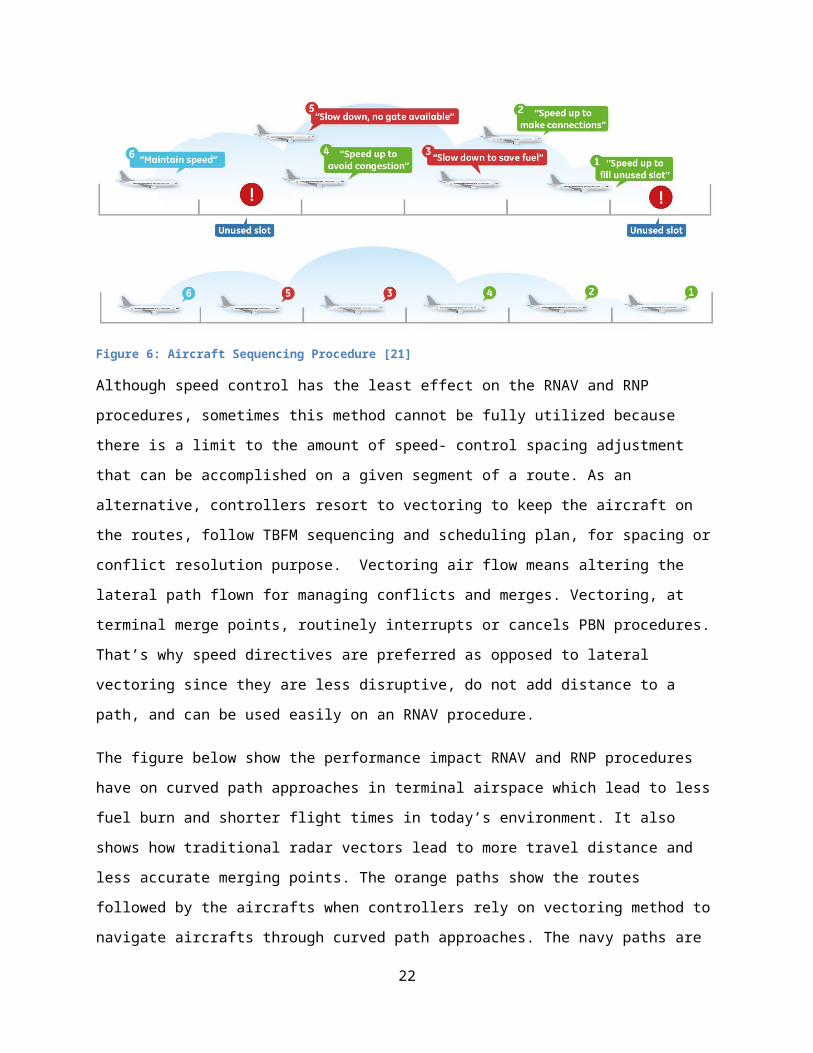
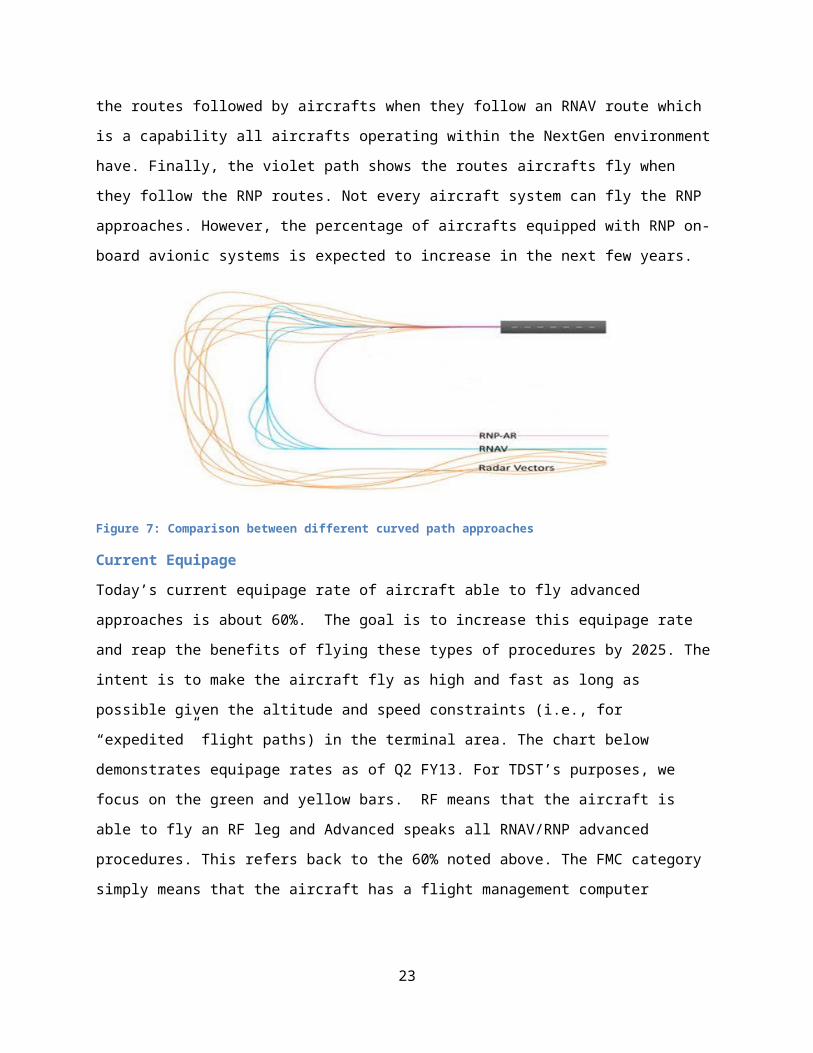
The figure below show the performance impact RNAV and RNP procedures have on curved path
approaches in terminal airspace which lead to less fuel burn and shorter flight times in today’s
environment. It also shows how traditional radar vectors lead to more travel distance and less accurate
merging points. The orange paths show the routes followed by the aircrafts when controllers rely on
vectoring method to navigate aircrafts through curved path approaches. The navy paths are the routes
followed by aircrafts when they follow an RNAV route which is a capability all aircrafts operating within
the NextGen environment have. Finally, the violet path shows the routes aircrafts fly when they follow
the RNP routes. Not every aircraft system can fly the RNP approaches. However, the percentage of
aircrafts equipped with RNP on-board avionic systems is expected to increase in the next few years.
18

Figure 7: Comparison between different curved path approaches
Current Equipage
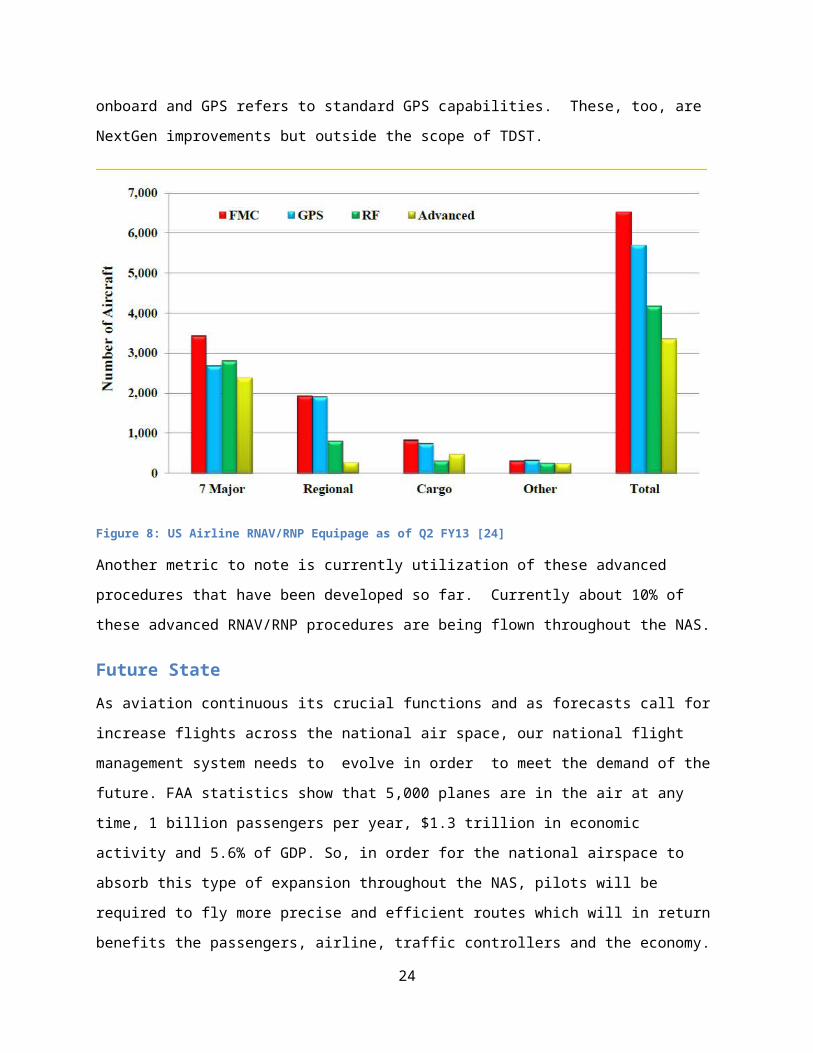
Today’s current equipage rate of aircraft able to fly advanced approaches is about 60%. The goal is to
increase this equipage rate and reap the benefits of flying these types of procedures by 2025. The intent
is to make the aircraft fly as high and fast as long as possible given the altitude and speed constraints
(i.e., for “expedited” flight paths) in the terminal area. The chart below demonstrates equipage rates as
of Q2 FY13. For TDST’s purposes, we focus on the green and yellow bars. RF means that the aircraft is
able to fly an RF leg and Advanced speaks all RNAV/RNP advanced procedures. This refers back to the
60% noted above. The FMC category simply means that the aircraft has a flight management computer
onboard and GPS refers to standard GPS capabilities. These, too, are NextGen improvements but
outside the scope of TDST.
19
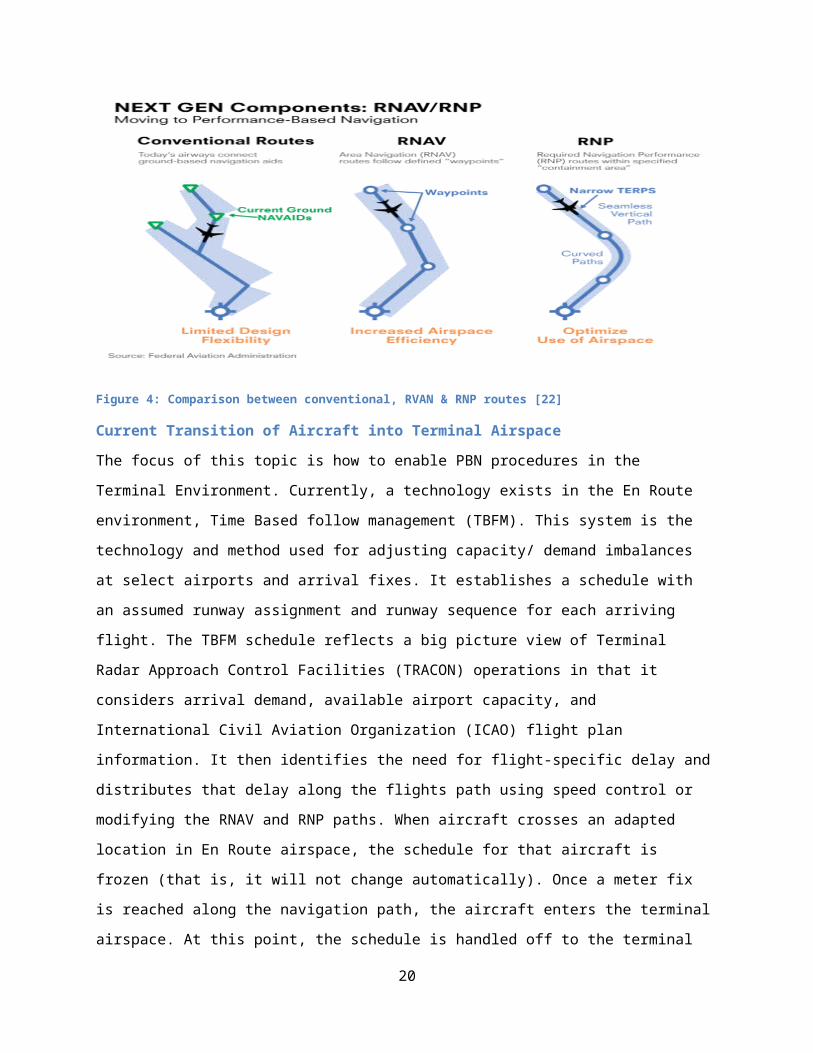
Figure 8: US Airline RNAV/RNP Equipage as of Q2 FY13 [24]
Another metric to note is currently utilization of these advanced procedures that have been developed
so far. Currently about 10% of these advanced RNAV/RNP procedures are being flown throughout the
NAS.
Future State
As aviation continuous its crucial functions and as forecasts call for increase flights across the national
air space, our national flight management system needs to evolve in order to meet the demand of the
future. FAA statistics show that 5,000 planes are in the air at any time, 1 billion passengers per year, $1.3
trillion in economic activity and 5.6% of GDP. So, in order for the national airspace to absorb this type of
expansion throughout the NAS, pilots will be required to fly more precise and efficient routes which will
in return benefits the passengers, airline, traffic controllers and the economy. The expansion also
necessitates a modernization of the national airspace. This modernization process will be driven by the
following set of goals. For the purpose of satisfying the scope of TDST project, this section will focus on
the terminal airspace:
Enhance safety aspects
Reduce carbon emissions
Reduce flight delays
Reduce noise impacts
20
Increase accuracy of Time Based Management Scheduling (TBFM)
Deliver a more efficient, consistent flow of traffic down to the runway
Reduces voice communications and replace it with digital data communication
Reduce miles flown in Terminal Radar Approach Control (TRACON) airspace
In order achieve these goals; aircraft need to follow the PBN procedures defined within the NextGen
system. This includes adhering to the RNAV and RNP procedures in the terminal airspace since they
represent the two fundamental elements of the PBN framework.
The biggest challenge in the terminal air flow management system is managing high air traffic. Future
state is expected to equip controllers with more strategic management and tactical support mechanisms
to achieve more efficient terminal arrival flow management procedures. As terminal air traffic starts to
increase, controllers face more challenges in following the RNAV and RNP procedures. Therefore,
controllers need to avoid the vectoring process, which cancels or interrupt the RNAV and RNP
procedures, and start using merging conflict resolution tools that help them predict merging operation
even when aircrafts are far from the merging points. Controllers sometimes identify the conflicts in
merging routes too late and ask merging aircrafts to hold or redirect to wait for an opening, thus
creating a large separation between the aircraft. This requires the need to have a conflict resolution tool
to maximize the throughput or the terminal airspace allowing for an efficient way to manage heavy
traffic in terminal airspace. While this process appears near the airport, the future state is expected to
have this process initiated hundreds of mile away from the airport allowing pilots to following RNAV and
RNP procedures, such as curved path approaches, which will reduce carbon emissions, flight delays,
noise and fuel.
Gap Description
As noted above in the current and future state, controllers managing merges on RNAV arrival rotes with
high traffic density deal with unpredictable wind and complex speed changes. This is due to the altitude
change along the arrival paths. The type of a merge (the number of turns and length of each route prior
to the merge) requires more effort and creates a higher workload. The demand during high traffic
periods can cause issues at merges that may require the controller to take aircraft off the RNAV routes
for delay vectoring for sequencing. The top 30 airports are considered high traffic areas which mean that
they continuously have high arrival rates of air traffic throughout the day.
21
In other situations, merges may occur just within the boundary of a control position and may require
prior sequencing coordinated by other controllers. To achieve the expected benefits and efficiencies
from these terminal routes, controllers may use automation to assist them in managing the traffic where
the routes merge.
To date, automation is not available to controllers that allow them to be successful in these complex
merge operations. To assist in sequencing and merging aircraft on RNAV routes, an automation tool
must be developed and implemented to assist controllers in these complex merges. This decision
support tool will help to enable controllers to routinely support the execution of performance based
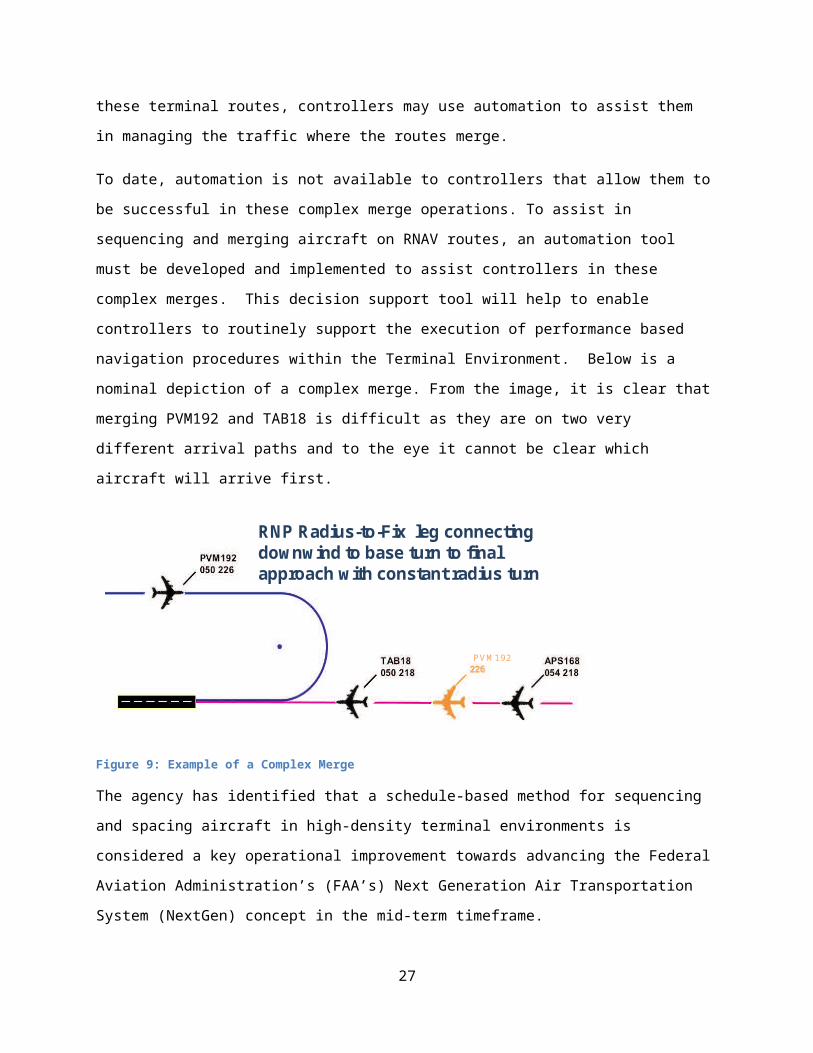
navigation procedures within the Terminal Environment. Below is a nominal depiction of a complex
merge. From the image, it is clear that merging PVM192 and TAB18 is difficult as they are on two very
different arrival paths and to the eye it cannot be clear which aircraft will arrive first.
RNP Radius-to-Fix leg connecting downwind to base turn to final approach with constant radius turn
PVM192
Figure 9: Example of a Complex Merge
The agency has identified that a schedule-based method for sequencing and spacing aircraft in high-
density terminal environments is considered a key operational improvement towards advancing the
Federal Aviation Administration’s (FAA’s) Next Generation Air Transportation System (NextGen) concept
in the mid-term timeframe.
Below the two distinct shortfalls associated with the scope of this gap analysis are called out.
22
Current Shortfall Description of ShortfallInability to continue efficient arrival operations into terminal airspace
Lack of automation for Terminal controllers that can support mixed equipage operations
There is an inability to continue efficient arrival operations—use of Performance-Based Navigation (PBN) procedures—into terminal airspace due to the highly tactical nature of terminal traffic management and the complexities associated with separating, sequencing, and spacing aircraft, particularly at terminal merge points, when the airspace is congested. Aircraft are often vectored off their routes, limiting PBN procedure use and introducing inefficiencies.
The combination of mixed equipage arrivals on different procedures is difficult for controllers to manage, particularly at merges onto the final approach course. As a result, controllers are unable to accommodate routine use of PBN approaches, such as Required Navigation Performance (RNP) Authorization Required approaches with Radius-to- Fix turns.
Table 3: Shortfalls
As things currently stand, the main gap is that a tool to allow controllers to keep aircraft on the curved
path approaches is not available to controllers. The result of pulling aircraft off of these approaches
means that airlines lose the benefits derived by flying on such procedures; a key component of
performance based navigation. The tool must appear on the controllers’ scope to help inform the
placement of aircraft at the time of the merge. The complexity of the tool will depend on the
environment to include whether the airport is high, medium, or low density.
The inability to support the consistent use of PBN procedures jeopardizes the investment the agency has
made in the design and implementation of satellite based procedures. When operators are unable to
benefit from their equipage investments they have already made, they are not going to be inclined to
voluntarily equip to support other NextGen initiatives. This would then lead to a delay in achieving
future NextGen milestones.
Factors and Remedies
In order to address the current gap that exists, the Federal Aviation Administration will need to
implement a decision support tool. Two tools have been identified that will serve the purpose in the
overarching need; increasing the use of performance based navigation. These tools are Terminal
23
Sequencing and Spacing and Relative Position Indicator. These two tools are quite different in nature
but would address the current gap. Below is a description of each capability.
Terminal Sequencing and Spacing
Terminal Sequencing and Spacing (TSS) introduces a capability that assists with the sequencing, spacing,
and merging of aircraft in terminal airspace. This capability does so by scheduling aircraft to cross
strategic points along their routes at designated times. Scheduling aircraft to capacity-constrained
resources, such as airport runways, arrival or departure fixes, or points in the overhead stream, is one
method for delivering a predictable and consistent sequence and spacing of traffic. A schedule-based
method for sequencing and spacing aircraft in high-density terminal environments is considered a key
operational improvement towards advancing the FAA’s NextGen concept in the mid-term timeframe.
The key components/elements of TSS includes
The scheduling of aircraft over strategic merge points and runways
the availability of automation-derived runway assignments and runway sequences to
controllers,
and the display of slot markers to gauge an aircraft’s position relative to where it needs to
be to meet its scheduled time.
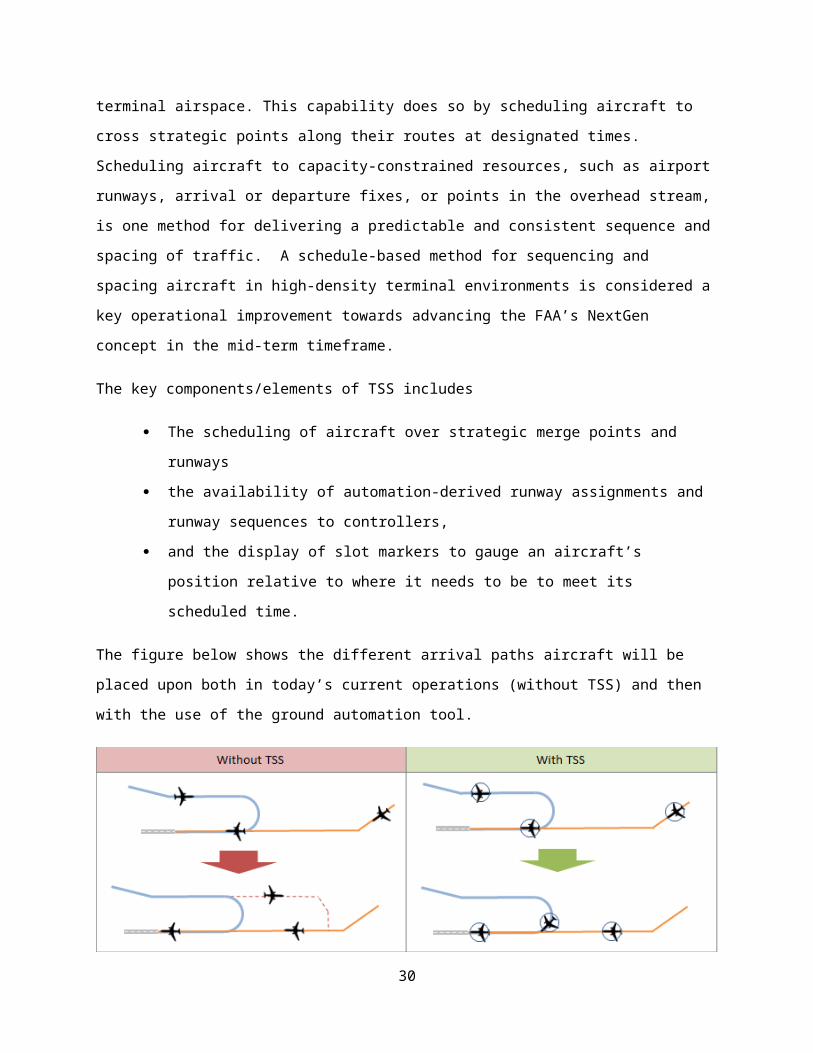
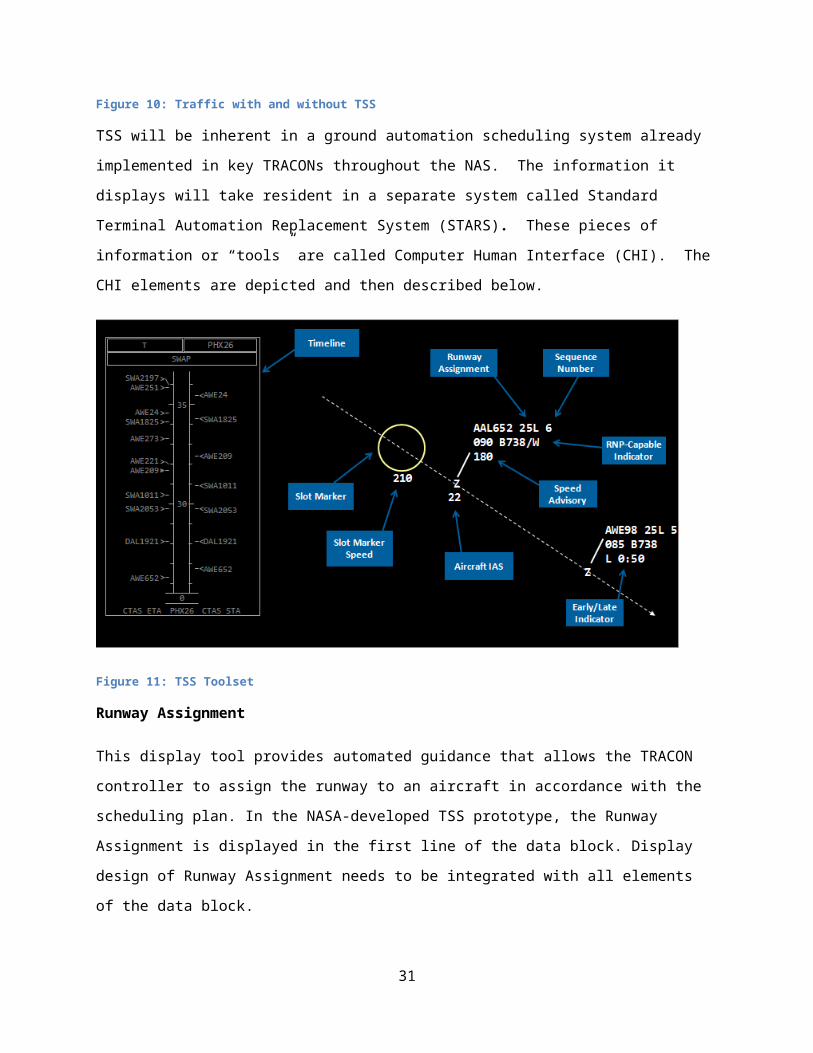
The figure below shows the different arrival paths aircraft will be placed upon both in today’s current
operations (without TSS) and then with the use of the ground automation tool.
Figure 10: Traffic with and without TSS
TSS will be inherent in a ground automation scheduling system already implemented in key TRACONs
throughout the NAS. The information it displays will take resident in a separate system called Standard
24
Terminal Automation Replacement System (STARS). These pieces of information or “tools” are called
Computer Human Interface (CHI). The CHI elements are depicted and then described below.
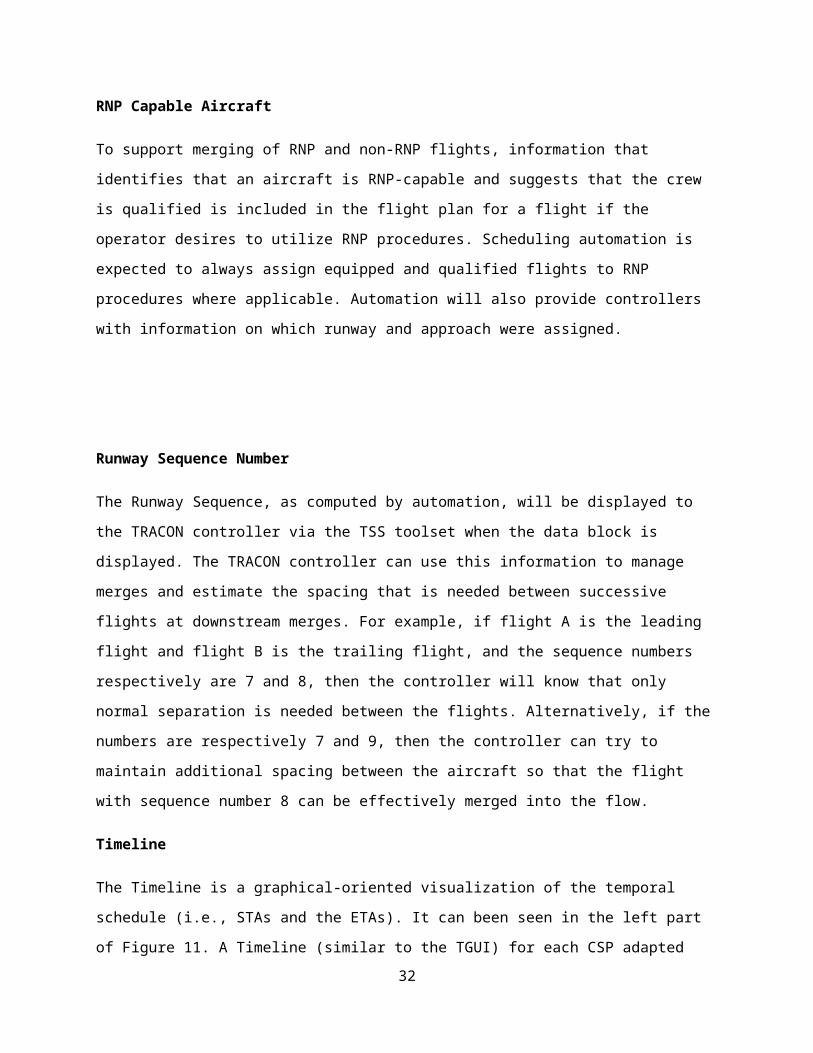
Figure 11: TSS Toolset
Runway Assignment
This display tool provides automated guidance that allows the TRACON controller to assign the runway
to an aircraft in accordance with the scheduling plan. In the NASA-developed TSS prototype, the Runway
Assignment is displayed in the first line of the data block. Display design of Runway Assignment needs to
be integrated with all elements of the data block.
RNP Capable Aircraft
To support merging of RNP and non-RNP flights, information that identifies that an aircraft is RNP-
capable and suggests that the crew is qualified is included in the flight plan for a flight if the operator
desires to utilize RNP procedures. Scheduling automation is expected to always assign equipped and
qualified flights to RNP procedures where applicable. Automation will also provide controllers with
information on which runway and approach were assigned.
25
Runway Sequence Number
The Runway Sequence, as computed by automation, will be displayed to the TRACON controller via the
TSS toolset when the data block is displayed. The TRACON controller can use this information to manage
merges and estimate the spacing that is needed between successive flights at downstream merges. For
example, if flight A is the leading flight and flight B is the trailing flight, and the sequence numbers
respectively are 7 and 8, then the controller will know that only normal separation is needed between
the flights. Alternatively, if the numbers are respectively 7 and 9, then the controller can try to maintain
additional spacing between the aircraft so that the flight with sequence number 8 can be effectively
merged into the flow.
Timeline
The Timeline is a graphical-oriented visualization of the temporal schedule (i.e., STAs and the ETAs). It
can been seen in the left part of Figure 11. A Timeline (similar to the TGUI) for each CSP adapted for that
position is available for display to the TRACON controller. The Timeline includes ETA and STA for each
displayed flight. The Timeline provides the controller with additional situation awareness, as it can
indicate where natural gaps exist in the overall schedule.
Speed Advisory
Speed Advisories provide the TRACON controller with automated guidance on the speed necessary to
resolve an ETA-STA difference for the next downstream CSP for which a Speed Advisory is available. If
the Speed Advisory is displayed, then it indicates to the controller that speed alone can be used to
resolve the ETA-STA difference, and vectoring should not be needed.
Early Late Indicator
The Early/Late Indicator provides the TRACON controller with the aircraft’s ETA-STA difference to the
runway threshold.
Slot Marker
The Slot Marker is a spatial visualization of the 4D schedule trajectory for a particular aircraft. The Slot
Marker is a circle (of configurable size) that “flies” the schedule/solution speed profile along the
aircraft’s lateral path and reaches each CSP at the STA. The Slot Markers are available for display on both
the controller radar scope and TMC PGUI displays.
26
Current Indicated Airspeed
A calculated estimate of the aircraft’s current Indicated Airspeed is displayed to the controller to
alleviate the need for the controller to convert ground speed to Indicated Airspeed.
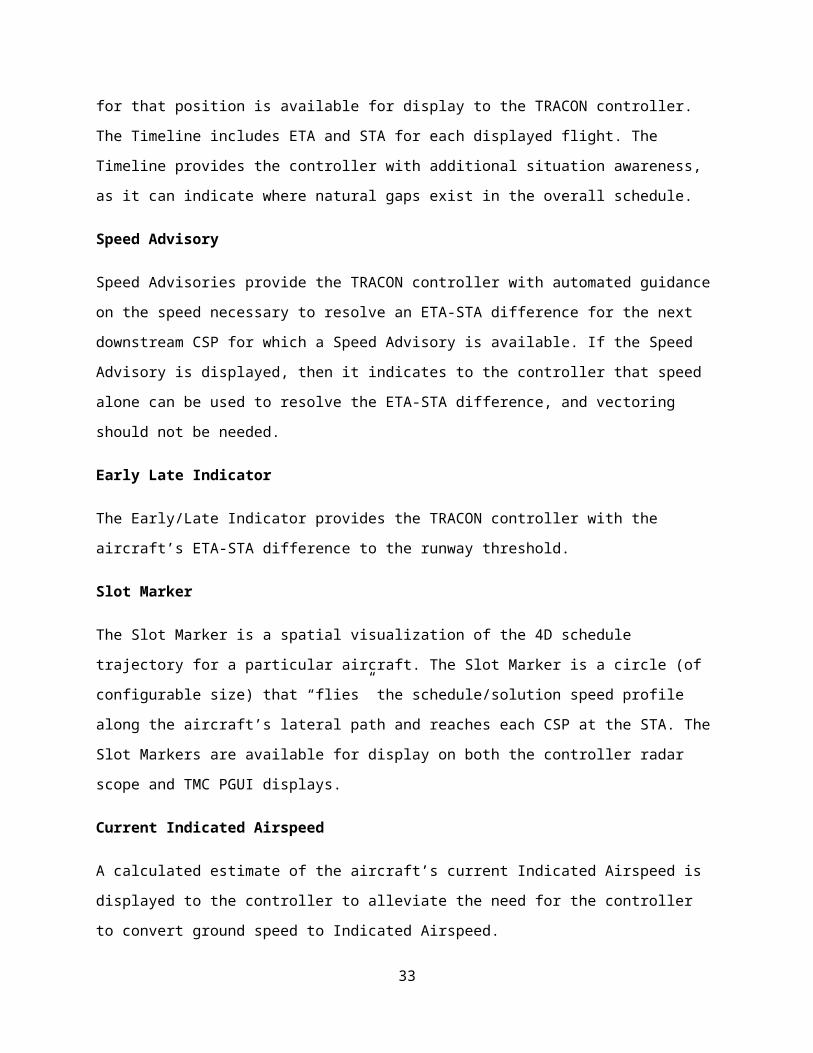
As articulated above, TSS is a suite of capabilities that help to address the shortfalls listed in the gap
description above. This capability has stemmed from research done at NASA Ames and further matured
at MITRE Corporation. Additional Concept Engineering work will be conducted over the next year.
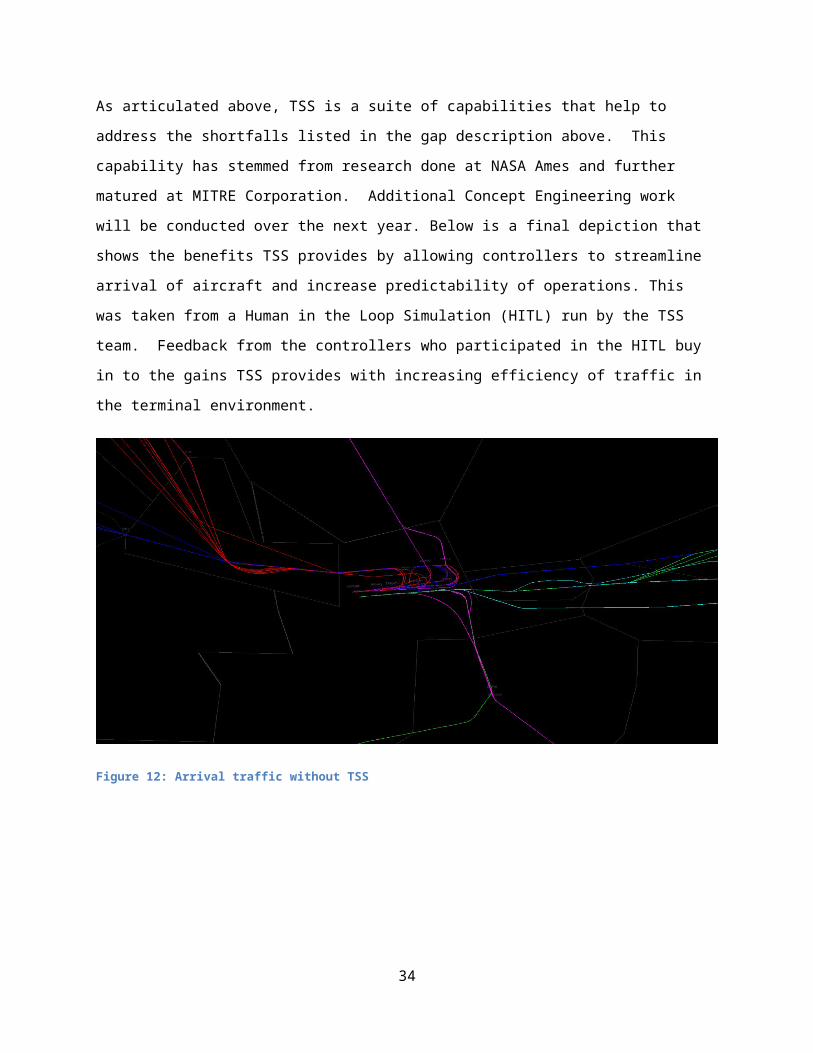
Below is a final depiction that shows the benefits TSS provides by allowing controllers to streamline
arrival of aircraft and increase predictability of operations. This was taken from a Human in the Loop
Simulation (HITL) run by the TSS team. Feedback from the controllers who participated in the HITL buy
in to the gains TSS provides with increasing efficiency of traffic in the terminal environment.
Figure 12: Arrival traffic without TSS
27
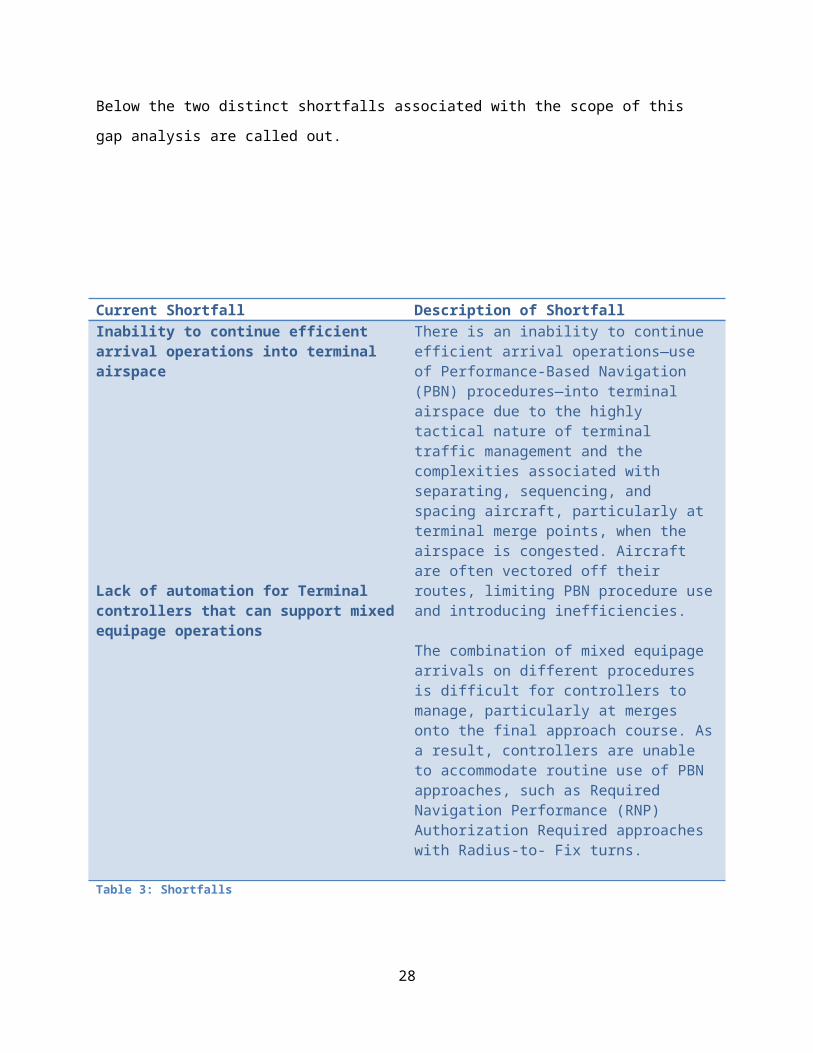
Figure 13: Arrival Traffic with TSS
From the two images, it is clearly seen that the arrival flow of traffic is much more streamlined with the
advent of TSS versus that of the baseline operations (ie operations as they exist today). Aircraft are
arriving in a more predictable manner in keeping with their estimate time of arrival.
Relative Position Indicator
Relative Position Indicator (RPI) is another capability developed under contract by the FAA. RPI builds
upon the functionality of and overcomes many of shortcomings of its foundational tool, the Converging
Runway Display Aid (CRDA). RPI is a passive situational awareness aid and does not issue advisories or
require controller response or reaction. RPI provides a means to illustrate multiple flows as a single flow
to the controller. This allows the controller to see potential merge conflicts sooner and address through
speed control. Below is an image of the RPI Application. The RPI projection does account accurately for
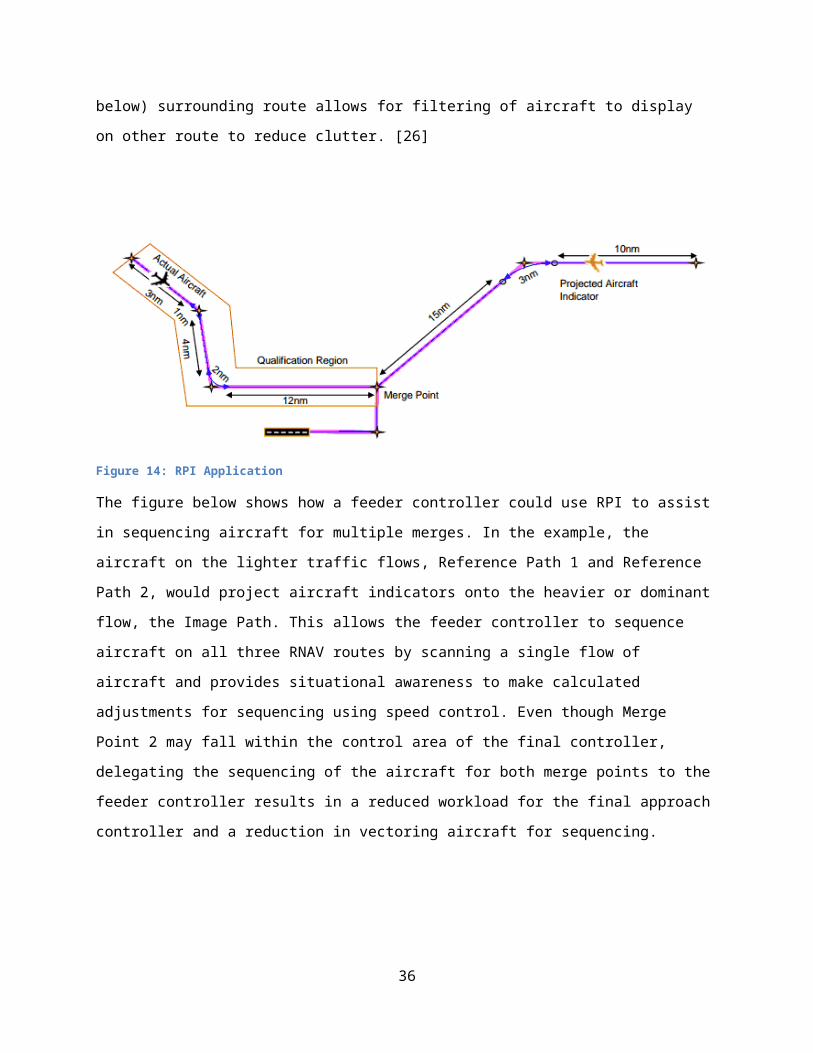
turns. The qualification region (red box below) surrounding route allows for filtering of aircraft to display
on other route to reduce clutter. [26]
28
Figure 14: RPI Application
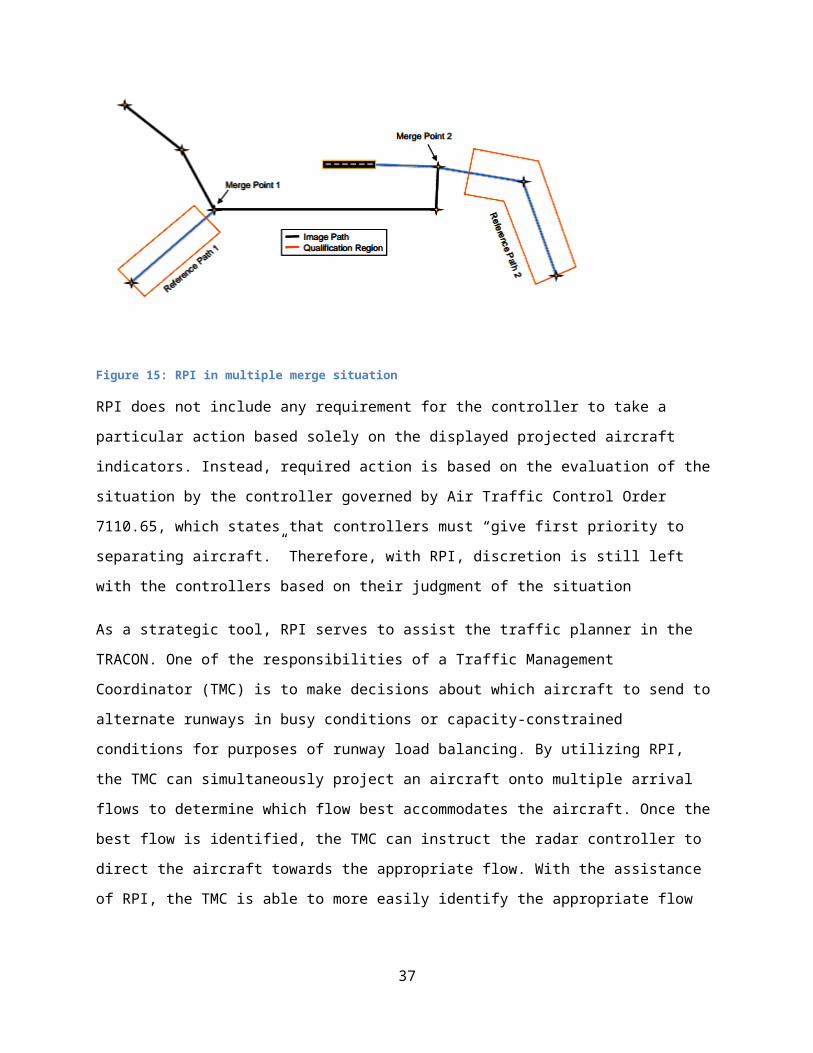
The figure below shows how a feeder controller could use RPI to assist in sequencing aircraft for
multiple merges. In the example, the aircraft on the lighter traffic flows, Reference Path 1 and Reference
Path 2, would project aircraft indicators onto the heavier or dominant flow, the Image Path. This allows
the feeder controller to sequence aircraft on all three RNAV routes by scanning a single flow of aircraft
and provides situational awareness to make calculated adjustments for sequencing using speed control.
Even though Merge Point 2 may fall within the control area of the final controller, delegating the
sequencing of the aircraft for both merge points to the feeder controller results in a reduced workload
for the final approach controller and a reduction in vectoring aircraft for sequencing.
Figure 15: RPI in multiple merge situation
RPI does not include any requirement for the controller to take a particular action based solely on the
displayed projected aircraft indicators. Instead, required action is based on the evaluation of the
29
situation by the controller governed by Air Traffic Control Order 7110.65, which states that controllers
must “give first priority to separating aircraft.” Therefore, with RPI, discretion is still left with the
controllers based on their judgment of the situation
As a strategic tool, RPI serves to assist the traffic planner in the TRACON. One of the responsibilities of a
Traffic Management Coordinator (TMC) is to make decisions about which aircraft to send to alternate
runways in busy conditions or capacity-constrained conditions for purposes of runway load balancing. By
utilizing RPI, the TMC can simultaneously project an aircraft onto multiple arrival flows to determine
which flow best accommodates the aircraft. Once the best flow is identified, the TMC can instruct the
radar controller to direct the aircraft towards the appropriate flow. With the assistance of RPI, the TMC
is able to more easily identify the appropriate flow and the resulting merge will require less controller
intervention. The figure below clearly depicts how this would appear on the scope.
Figure 16: RPI on the Controller's scope
Noteworthy is that fact that RPI’s project algorithm accounts for circular arcs defined by Radius to Fix
(RF legs). Since RF legs provide a fixed ground path, RPI projections are even more accurate when used
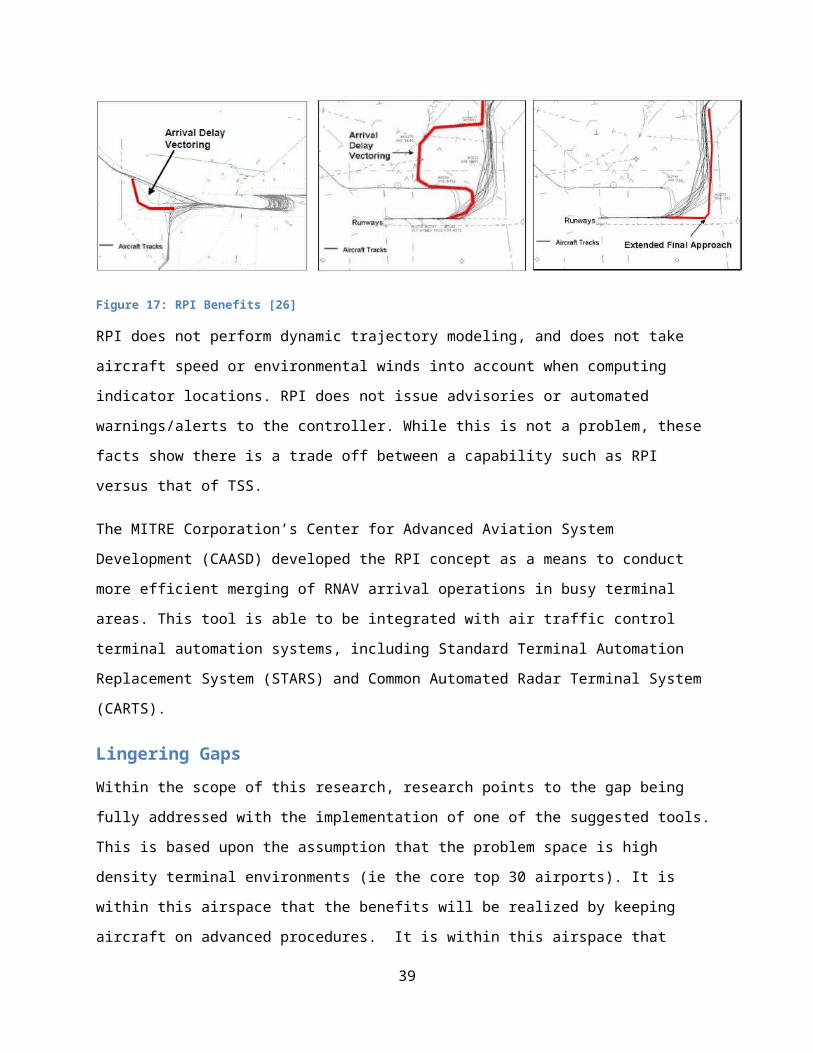
with RNP procedures. [25] The image below shows the benefits of RPI. It allows for controllers to build
30
gaps to more precisely merge traffic. It also reduces delay vectoring and elongation of the final approach
by allowing the controller to merge more efficiently.
Figure 17: RPI Benefits [26]
RPI does not perform dynamic trajectory modeling, and does not take aircraft speed or environmental
winds into account when computing indicator locations. RPI does not issue advisories or automated
warnings/alerts to the controller. While this is not a problem, these facts show there is a trade off
between a capability such as RPI versus that of TSS.
The MITRE Corporation’s Center for Advanced Aviation System Development (CAASD) developed the RPI
concept as a means to conduct more efficient merging of RNAV arrival operations in busy terminal areas.
This tool is able to be integrated with air traffic control terminal automation systems, including Standard
Terminal Automation Replacement System (STARS) and Common Automated Radar Terminal System
(CARTS).
Lingering Gaps
Within the scope of this research, research points to the gap being fully addressed with the
implementation of one of the suggested tools. This is based upon the assumption that the problem
space is high density terminal environments (ie the core top 30 airports). It is within this airspace that
the benefits will be realized by keeping aircraft on advanced procedures. It is within this airspace that
controllers will need one of the tools identified in order to navigate complex merges within this airspace,
thus allowing aircraft to stay on their advanced arrival procedures. This will then lead to an overall gain
in enabling the use of PBN.
31
Alternatives Analysis
One of the key objectives of this project is to perform an alternatives analysis that will evaluate the
identified alternatives and help the decision makers with the best solutions for addressing the gap. This
analysis has been performed by the team and includes great deal of subject matter expertise opinion. In
this case, the subject matter expertise is vital as both technologies were tested using very different
environments. Therefore, a great deal of the assessment must be qualitative and lends heavily on
subject matter expertise.
The steps of this analysis follow those of the qualitative value model development followed by a
quantitative analysis.
Description of Alternatives
Terminal Sequencing and Spacing (TSS): This alternative has been identified as a key capability to
address the gap that exists in enabling the use of Performance Based Navigation (PBN) by the Federal
Aviation Administration (FAA). This capability leverages Traffic Based Flow Management (TBFM), a
system that provides an absolute schedule and displays key information to controllers. Greater detail
about this alternative was provided above in the gap analysis.
Relative Position Indicator (RPI): It is a passive situational awareness tool and does not issue advisories.
It offers foresight into possible merge issues while relying on the controller to use speed control to
achieve sequencing of aircraft. Greater detail about this alternative was provided above in the gap
analysis.
TSS Lite & RPI: This is a proposed alternative for the sake of this alternatives analysis. This provides a
“hybrid” option which has the potential to provide a great deal of benefit in enabling the use of PBN.
While this alternative has not been researched independently it utilizes pieces of information that have
been assessed. This option includes the RPI capability as well as two key pieces of information from TSS
– runway assignment and sequence numbers. These two tools out of the TSS toolset have proven to
provide benefit to controllers as individual pieces of information. This hybrid allows the controller to
realize more benefit by adding some of the TSS information without having to be at a facility where
TBFM is implemented.
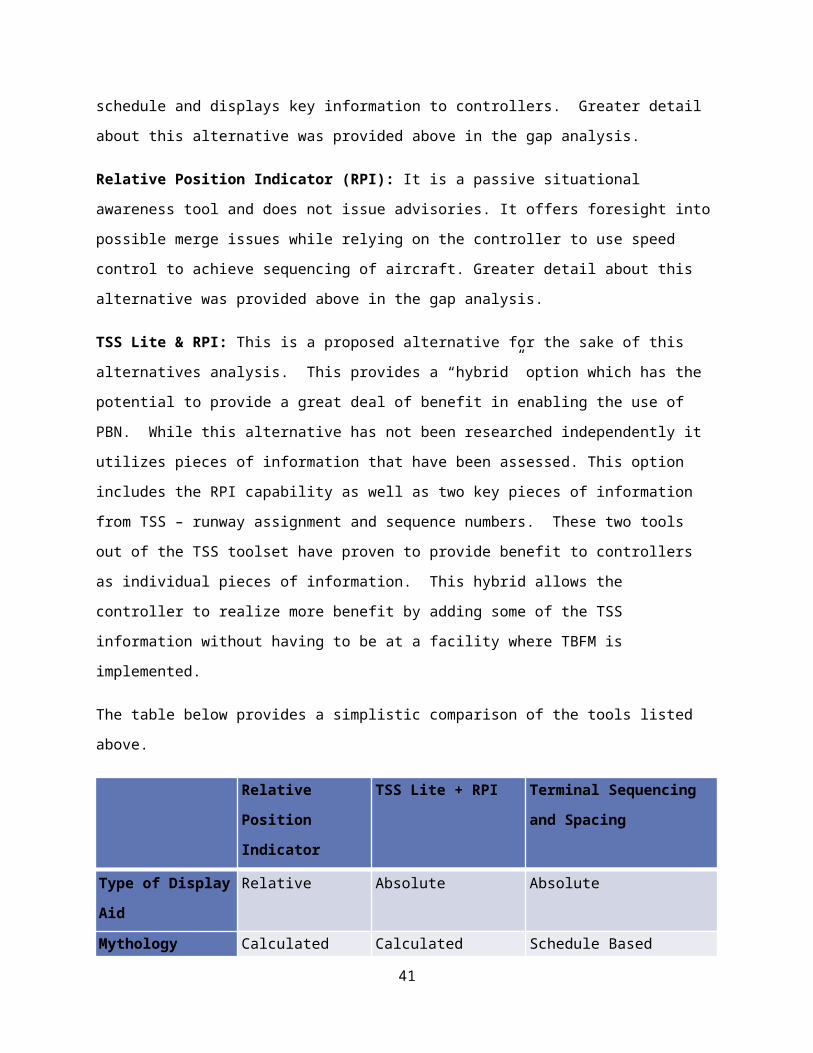
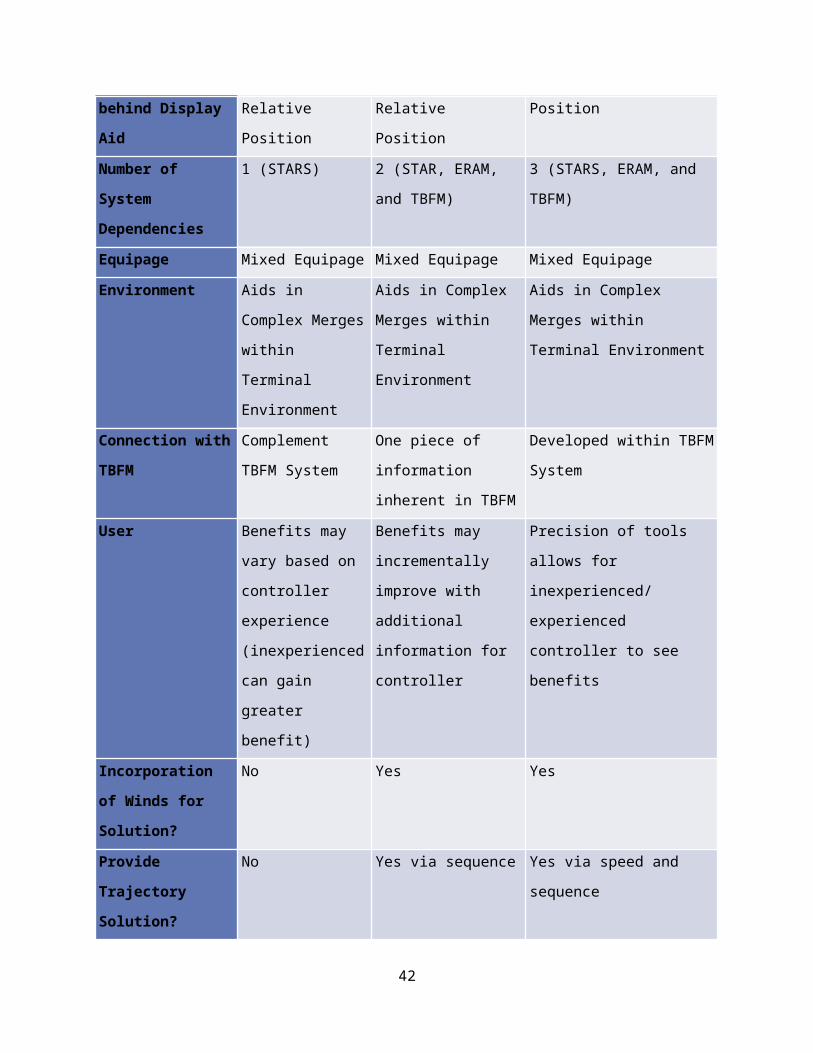
The table below provides a simplistic comparison of the tools listed above.
32
Relative Position
Indicator
TSS Lite + RPI Terminal Sequencing and
Spacing
Type of Display Aid Relative Absolute Absolute
Mythology behind
Display Aid
Calculated Relative
Position
Calculated Relative
Position
Schedule Based Position
Number of System
Dependencies
1 (STARS) 2 (STAR, ERAM, and
TBFM)
3 (STARS, ERAM, and TBFM)
Equipage Mixed Equipage Mixed Equipage Mixed Equipage
Environment Aids in Complex
Merges within
Terminal
Environment
Aids in Complex Merges
within Terminal
Environment
Aids in Complex Merges within
Terminal Environment
Connection with
TBFM
Complement TBFM
System
One piece of
information inherent in
TBFM
Developed within TBFM
System
User Benefits may vary
based on controller
experience
(inexperienced can
gain greater benefit)
Benefits may
incrementally improve
with additional
information for
controller
Precision of tools allows for
inexperienced/ experienced
controller to see benefits
Incorporation of
Winds for Solution?
No Yes Yes
Provide Trajectory
Solution?
No Yes via sequence Yes via speed and sequence
Benefits Reduces
controller
workload
Early Application
of Speed
Delay/Reduce
Delay Vectoring
Provides two more
pieces of
information to
controllers to help
sequence a/c
Further reduces controller
Workload
Allow 95% a/c to stay on
RNP curved path approach
Provide streamlined arrival
solution; increasing
predictability
33
Enables OPD
operations
Table 4: Comparison of Alternatives
Description of Criteria
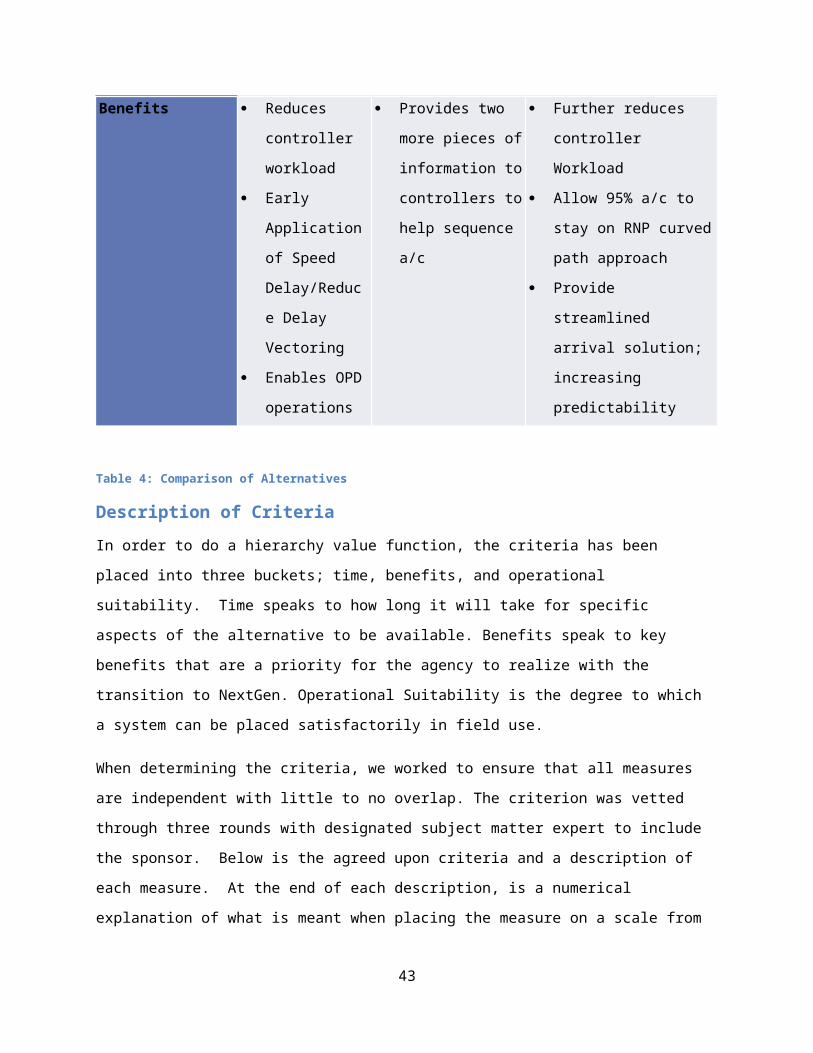
In order to do a hierarchy value function, the criteria has been placed into three buckets; time, benefits,
and operational suitability. Time speaks to how long it will take for specific aspects of the alternative to
be available. Benefits speak to key benefits that are a priority for the agency to realize with the
transition to NextGen. Operational Suitability is the degree to which a system can be placed
satisfactorily in field use.
When determining the criteria, we worked to ensure that all measures are independent with little to no
overlap. The criterion was vetted through three rounds with designated subject matter expert to include
the sponsor. Below is the agreed upon criteria and a description of each measure. At the end of each
description, is a numerical explanation of what is meant when placing the measure on a scale from 1 to
10. These numerical values were also vetted and approved by subject matter expertise.
Time
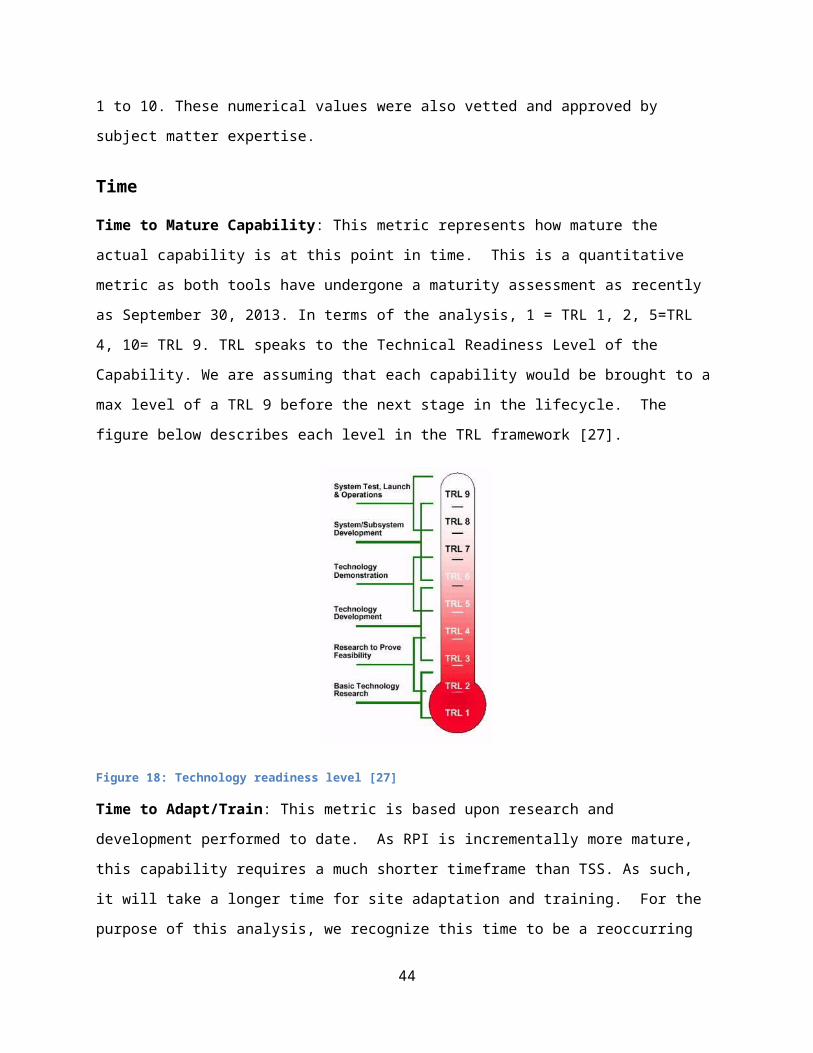
Time to Mature Capability: This metric represents how mature the actual capability is at this point in
time. This is a quantitative metric as both tools have undergone a maturity assessment as recently as
September 30, 2013. In terms of the analysis, 1 = TRL 1, 2, 5=TRL 4, 10= TRL 9. TRL speaks to the
Technical Readiness Level of the Capability. We are assuming that each capability would be brought to a
max level of a TRL 9 before the next stage in the lifecycle. The figure below describes each level in the
TRL framework [27].
34
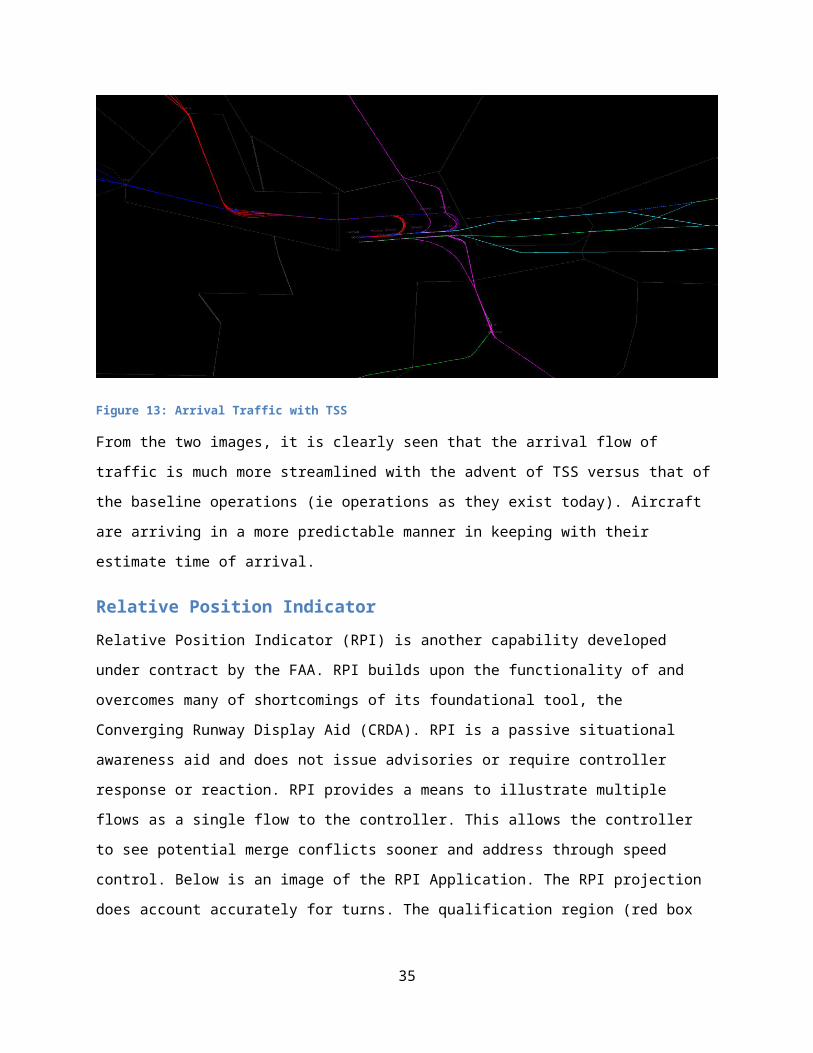
Figure 18: Technology readiness level [27]
Time to Adapt/Train: This metric is based upon research and development performed to date. As RPI is
incrementally more mature, this capability requires a much shorter timeframe than TSS. As such, it will
take a longer time for site adaptation and training. For the purpose of this analysis, we recognize this
time to be a reoccurring measure as this step will need to take place at each site. This number is
quantitative based upon analysis. In terms of the analysis, 1= year or more, 5 = five months, and 10 = 1
month.
Benefits
Maintain/Increase Throughput: Throughput is a measure of number of landings per hour on a given
runway. This metric is a qualitative relationship based upon individual data derived from both TSS and
RPI simulations. In terms of the analysis, 1= 0% increase to throughput, 5= 5% increase, 10= 10%
increase or more to throughput.
RNP Utilization/Predictability: This metric represents a key objective – making arrivals as efficient as
possible using PBN procedures. TSS provides a toolset which makes things as efficient as possible being
that it is based upon an absolute schedule. RPI does provide greater efficiency compared to baseline
operations but is not as efficient as TSS being that it is a relative tool. Included in this metric, is the
ability of controllers to keep aircraft on RNP approaches. TSS has proved to be extremely efficient in
keeping airplans on their RNP curved path approaches. While RPI has also proven effectiveness with
allowing controllers to keep aircraft on PBN procedures, an evaluation of how many aircraft have been
35
taken off their RNP curved path approach has not been conducted. Nonetheless, TSS demonstrates a
clear gain in efficiency with controllers keeping aircraft on 95% of the time. In terms of the analysis, 1 =
50% of a/c stay on approach, 5 = 75% of a/c stay on approach, 10= 100% of a/c stay on approach.
Fuel/Emissions: This metric is based on both qualitative and quantitative data. While an apples to
apples comparison of the two capabilities cannot be performed, data and subject matter expertise
opinion demonstrates that TSS will provide more fuel and emissions savings than RPI. In terms of the
analysis, 1 = 5% savings on fuel/emissions, 5 = 10% savings on fuel/emissions, 10 = 15% savings on
fuel/emissions.
Operational Suitability
Reliability: This is the ability of the system to perform and maintain its functions in routine
circumstances, as well as unexpected circumstances. This includes off nominal situations where
controllers are being faced with difficult situations where the system is being tested in terms of
sensitivity and flexibility. This is a qualitative assessment based upon subject matter expertise. In terms
of the analysis, 1= reliable 10% of the time, 5= reliable 75% of the time, 10= 100% of the time..
Controller Acceptability: This metric represents the amount of buy in controllers have provided in
regards to both capabilities. Human factors element (reduce workload, etc)This metric is based upon
controller involvement in both RPI and TSS simulations and their subsequent feedback which has been
documented in simulation result reports. In terms of the analysis, 1= no buy in, 5 = somewhat buy in, 10
= greatly buy in.
System Use: This metric represents how many facilities will be able to use the capability. TSS is
dependent on the facility having TBFM whereas RPI does not have a similar constraint. Both capabilities
have a dependency on STARS. The factor of what facilities will gain benefit from either/or is also taken
into account. The weights associated with this metric are qualitative based upon subject matter
expertise of all factors listed above. In terms of the analysis, 1= 0 facilities able to use capability, 5 = 35
facilities able to use capability, 10 = 70 facilities or more able to use capability.
Target Accuracy: In specific terms, accuracy is a degree of closeness to the actual value. For this analysis,
we focus on the level of accuracy the system gives in terms to the information it displays to the
controllers. The more accurate the information, the more precisely they can deliver aircraft to the
36
runway. This is also a qualitative assessment based upon subject matter expertise. In terms of the
analysis, 1 = not accurate, 5 = somewhat accurate, 10 = very accurate.
Collision Risk: This metric was included to show that none of these capabilities truly have a collision risk.
All of these tools are decision support tools to the controllers and controllers are ultimately responsible
for separation of aircraft. In terms of the analysis, 1 = .001% risk 5 = .0001%, 10 = .00001% risk.
Hierarchy Value Computations
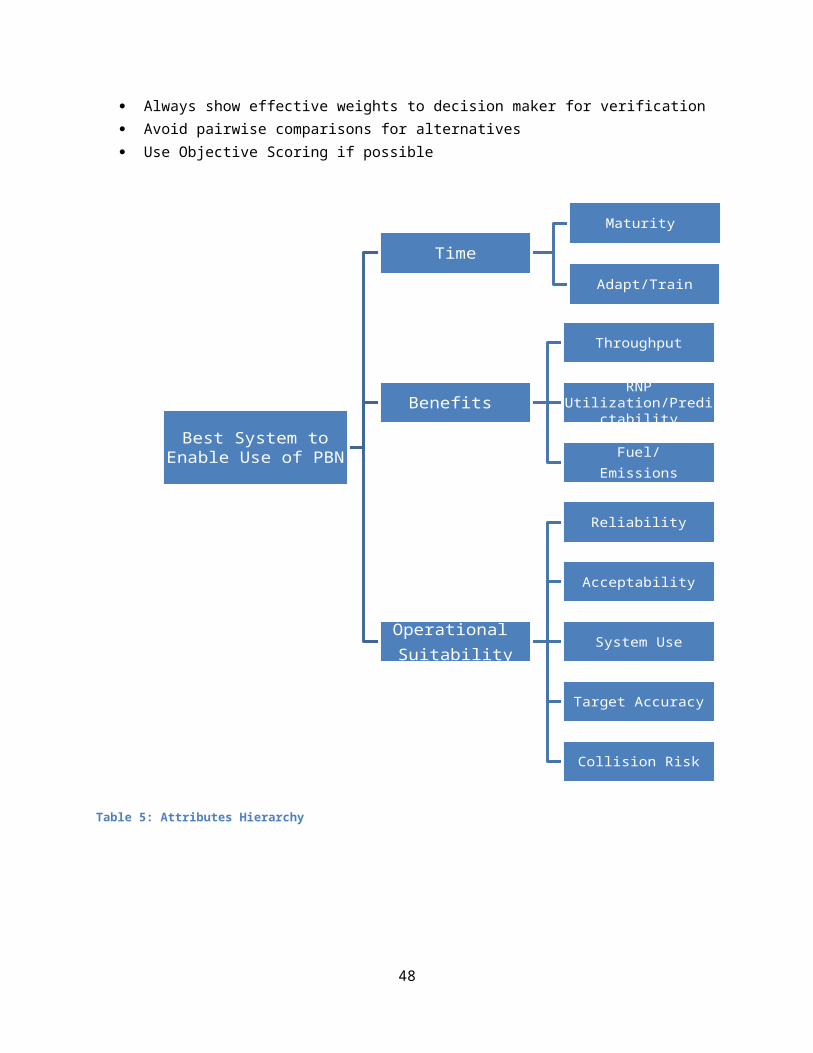
Below is a decision tree (hierarchy) constructed to help decide which metrics are most important in
helping to determine the best system to enable the use of performance based navigation. The metrics
were then placed into buckets according to the appropriate grouping of attributes. The weights were
vetted and decided upon by key subject matter experts to include the decision maker.
The team followed the guidelines below while developing the decision tree:
Maintain independence among elements of hierarchy. Emphasize range of variation of elements during weight elicitation Always show effective weights to decision maker for verification Avoid pairwise comparisons for alternatives Use Objective Scoring if possible
37
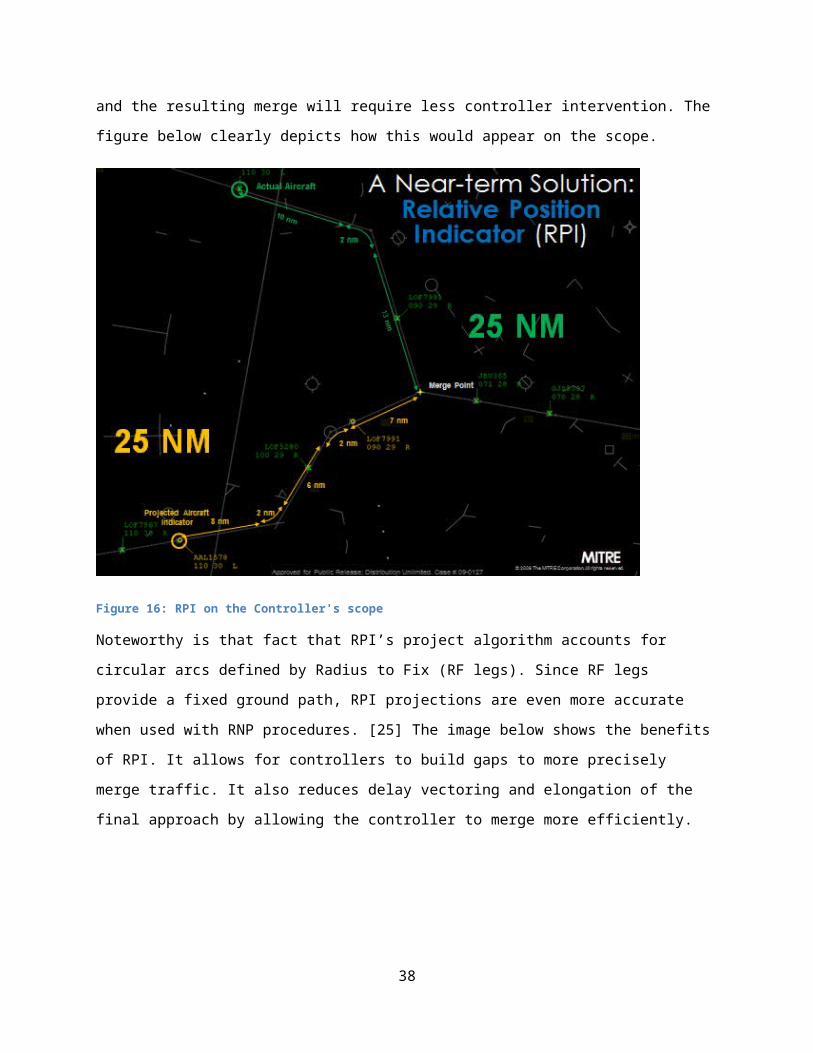
Table 5: Attributes Hierarchy
38
Best System to Enable Use of PBN
Time
Maturity
Adapt/Train
Benefits
Throughput
RNP Utilization/Predictability
Fuel/Emissions
Operational Suitability
Reliability
Acceptability
System Use
Target Accuracy
Collision Risk
Alternatives to Criteria Comparison
The table below represents a comparison of the defined alternatives to the criteria described above in a
rating approach. Each alternative will be scored from 1 to 10. In all cases, 1 is least beneficial while 10
signifies the most benefit for each alternative. These weights have been determined through qualitative
subject matter expertise that is based on experience developing the two technologies and running
human in the loop simulations. A true quantitative analysis across the board is not possible due to the
fact that both capabilities have been tested in very different environments. For more information about
the scoring, refer to the description of criteria above.
TSS TSS Lite + RPI(Runway assignments and sequence numbers plus RPI)
RPI
Time to Mature Capability(1 = TRL 1)
5 5 7
Time to Adapt/Train(1 = 1 year or more)
7 8 9
Maintain/Increase Throughput(1 = no throughput)
7 6 5
RNP Utilization/Predictability(1 = not efficient)
9 7 6
Fuel/Emissions(1 = great amount of fuel burn)
8 6 5
Reliability(1 = not reliable)
6 7 8
Controller Acceptability(1 = not acceptable)
9 8 6
System Use(1 = not available)
5 5 10
Target Accuracy(1 = not accurate)
9 7 6
Collision Risk(1 = .001% risk)
9 10 10
39
Table 6: Alternatives with Scores
Methods of Analysis
Calculate Value Function
The weights were elicited with the SMEs using swing weights. The following steps explain the process
that was followed to obtain the weights
1. Listed all level 2 attributes of the hierarchy in table 5 with their associated range of scores in the
table below. The attributed were grouped according to their level 1 attributes [group 1 = time,
group 2 = benefits, group 3 = operational sustainability]
Level 1 Grouping Level 2 Criteria Worst – Best ScoreGroup 1 Maturity 5 – 7
Adapt/Train 7 – 9
Group 2
Throughput 5 – 7
RNP Utilization/Predictability 6 – 9
Fuel/Emissions 5 – 8
Group 3
Reliability 6 – 8
Acceptability 6 – 9
System Use 5 – 10
Target Accuracy 6 – 9
Collision Risk 9 – 10
Table 7: Swing Weights for Level 2 Attributes
2. The table above was presented to the SMEs along with the full description of each attribute that
was presented in the section “Description of Criteria” in this report above. For each group, the
40
SMEs were asked to pick the attribute that gives the greatest improvement when “swings” to
highest level. Then pick the attribute that gives the next highest increase of improvement when
swung. Also the SMEs were asked to provide the percentage of increase in improvement in
comparison with the first attribute for each attribute that comes next.
3. After this was done with the first group of level 2 attributes, moved to group 2 then group 3.
After having covered all attributes of level 2, repeated the same procedure with the attributes of
level 1 that are listed in table 8.
Level 1 Criteria Worst – Best Score
Time 5 – 9Benefits 5 – 9
Operational Suitability 5 – 10 Table 8: Level 1 Criteria Swing Weight
4. After all the ranking was elicited with the SMEs, the team assessed the weights by solving the
following equations for each group of criteria
k 2=pn k1
k 2=pn k1
.
.
.
k n=pn1k1
∑i=1
n
k i=1
Where k i=weight of attribute i , and
pn1=percentage of improvemnt compared withattribute1
5. After all the data and calculations were recorded from the different SMEs, an average weight was
calculated as show in Table 6.
41
Level 1 (Objective)
Level 2 (Evaluation Measure)
Criteria Weights Criteria Weights
Time 0.355731225 Maturity 0.5555556
Adapt/Train0.4444444
Benefits 0.199604743 Throughput 0.3418182
RNP Utilization/Predictability 0.4272727
Fuel/Emissions 0.230909091
Operational Suitability 0.444664032 Reliability 0.219848053
Acceptability 0.163817664
System Use 0.138176638
Target Accuracy 0.226495726
Safety 0.251661918
Table 9: Results of weights elicitation using swing weights
6. After the weights were elicited, the value function for each level 2 attribute was calculated. The
value function is a multiplication of level 2 weights with its associated level 1 weights.
42
Level 1
(Objective)
Level 2
(Evaluation Measure)
Bottom Row Weights
(Value Function)
Criteria Weights Criteria Weights
Time 0.3557312
2
Maturity 0.5555556 0.197628458
Adapt/Train 0.4444444 0.158102767
Benefits 0.1996047
43
Throughput 0.3418182 0.06822853
RNP
Utilization/Predictability
0.4272727 0.085285663
Fuel/Emissions 0.2309091 0.04609055
Operational
Suitability
0.4446640
32
Reliability 0.2198480
5
0.0977585216
Acceptability 0.1638176
6
0.07284382284
System Use 0.1381766
3
0.06144218100
Target Accuracy 0.2264957
2
0.10071450286
Collision Risk 0.25166191
0.11190500320
Table 10: Calculated Value Function
7. After that, all scores were scaled on scale of 0 to 1 using the formula below
Sattribute (x)=x−worstbest−worst
Where x is the atribute’s score, and
43
worst is the worst score in the range 1-10 wich is 1
best is the best score in the range 1-10 which is 10
8. Then, the team applied MAVT to all alternatives by multiplying the value function for each
attribute with its associated scaled score of each alternative. The sum of the multiplication was
calculated to find the MAVT score of each alternative.The results of the MAVT will be discussed
in more detailes in the following sections.
Alternatives Utilities
Utility of the alternatives being calculated using multi attribute value function (MAVT). The following
equation was used
U (x1 , x2 ,….. , xm)=∑i=1
m
k iU i ( xi )
TSS Total score = 0.685743193
Level 1
(Objective)
Level 2
(Evaluation
Measure)
Bottom Row
Weights (Value
Function)
Alternatives
TSS
Criteria Criteria Scores Scaling Alternative
Score
Time Maturity 0.1976284 5 0.444444444 0.08783487
Adapt/Train 0.1581027 7 0.666666667 0.105401845
Benefits Throughput 0.0682285 7 0.666666667 0.045485687
RNP Utilization/Predictability
0.0852856 9 0.888888889 0.075809478
Fuel/Emissions 0.0460905 8 0.777777778 0.035848205
Operational
Suitability
Reliability 0.09775852 6 0.555555556 0.05431029
Acceptability 0.07284382 9 0.888888889 0.064750065
44
System Use 0.061442181 5 0.444444444 0.027307636
Target Accuracy 0.100714502 9 0.888888889 0.089524003
Collision Risk 0.111905003 9 0.444444444 0.099471114
Total Alternative
Utility
0.685743193
TSS Lite and RPI Total score =0.659355693
Level 1
(Objective)
Level 2
(Evaluation
Measure)
Bottom Row Weights(Value Function)
Alternatives
TSS Lite + RPI
Criteria Criteria Scores Scaling Alternative Score
Time Maturity 0.197628458 5 0.444444444 0.08783487
Adapt/Train 0.158102767 8 0.777777778 0.122968819
Benefits Throughput 0.06822853 6 0.555555556 0.037904739
RNP Utilization/
Predictability
0.085285663 7 0.666666667 0.056857109
Fuel/Emissions 0.04609055 6 0.555555556 0.025605861
Operational
Suitability
Reliability 0.097758522 7 0.666666667 0.065172348
Acceptability 0.072843823 8 0.777777778 0.056656307
System Use 0.061442181 5 0.444444444 0.027307636
Target Accuracy 0.100714503 70.666666667
0.067143002
Collision Risk 0.111905003 10 1 0.111905003
45
Total Alternative Utility 0.659355693
RPI Total Score = 0.716280384
Level 1
(Objective)
Level 2
(Evaluation Measure)
Bottom row weights (Value
Function)
Alternatives
RPI
Criteria Criteria Scores
Scaling Alternative
Score
Time Maturity 0.19762845
8
7 0.666666667 0.131752306
Adapt/Train 0.15810276
7
9 0.888888889 0.140535793
Benefits Throughput 0.06822853 5 0.444444444 0.030323791
RNP Utilization/Predictability
0.08528566
3
6 0.555555556 0.047380924
Fuel/Emissions 0.04609055 5 0.444444444 0.020484689
OperationalSuitability
Reliability 0.09775852
2
8 0.777777778 0.076034406
Acceptability 0.07284382
3
6 0.555555556 0.04046879
System Use 0.06144218 10 1 0.061442181
46
1
Target Accuracy 0.10071450
3
6 0.555555556 0.055952502
Collision Risk 0.11190500
3
10 1 0.111905003
Total Alternative Utility 0.716280384
From the results shown above in the tables, the scoring of the alternatives is as follows:
RPI > TSS > TSS Lite & RPI
Cost Added to Value Function
For this purposes of this analysis, cost was separated from the other values to include benefits. Below
are two key metrics associated with cost.
Cost of Implementation: This metric is qualitative based on a rough order of magnitude cost
assessment. The cost to implement RPI has been determined by MITRE Corporation and TSS is currently
undergoing a cost estimate by another vendor. Notional results support the comparison of costs in the
chart below. TSS will be substantially more expensive than RPI to implement.
Cost of Adaptation/Training: This metric is qualitative based on a rough order of magnitude cost
assessment. The cost of adaptation and training has been determined for RPI by MITRE Corporation and
TSS is currently undergoing a cost estimate. Notional results support the comparison of costs in the
chart below. TSS will be substantially more expensive than RPI to provide the necessary adaptation and
training at the facility level.
Cost is divided under two categories: cost of implementation, which is the fixed cost associated with
each alternative and calculated based on software line of code SLOC. The cost of SLOC is $1,500/line.
SLOC Fixed Cost
47
TSS 45500 $70MTSS Lite/RPI
8000 $12M
RPI 6500 $10MTable 11 Fixed Cost of Alternatives
The other category for cost is, cost of adaptation and training. This cost is calculated based on the total
number of days needed to get controlled qualified for using the proposed tool. Please note that these
days are not exact but represent a relative time. The exact numbers are not known for adaptation and
training but in vetting with subject matter experts, the relationship below in regards to time was
determined.
Alternatives Total days of training
Reoccurring Cost
TSS 3 to 5 days $450KTSS Lite/RPI 2 days $350KRPI 1 day $200K
Table 12 Reoccurring Cost of Alternatives
In taking the individual costs of each system and calculating in the value function scores; the total costs
are derived as depicted below.
Alternatives Utility Cost of implementation Cost of Adaptation & Training
Total Cost
TSS 0.68574 $70,000,000 $450,000 $70,450,000
TSS Lite & RPI 0.65936 $12,000,000 $350,000 $13,150,000
RPI 0.71628 $10,000,000 $200,000 $10,250,000
Below is a graph depicting value versus the cost of the alternatives. This chart helps to quickly identify
the dominated alternatives. This chart also helps the decision-maker visually assess the value added for
the additional cost.
48
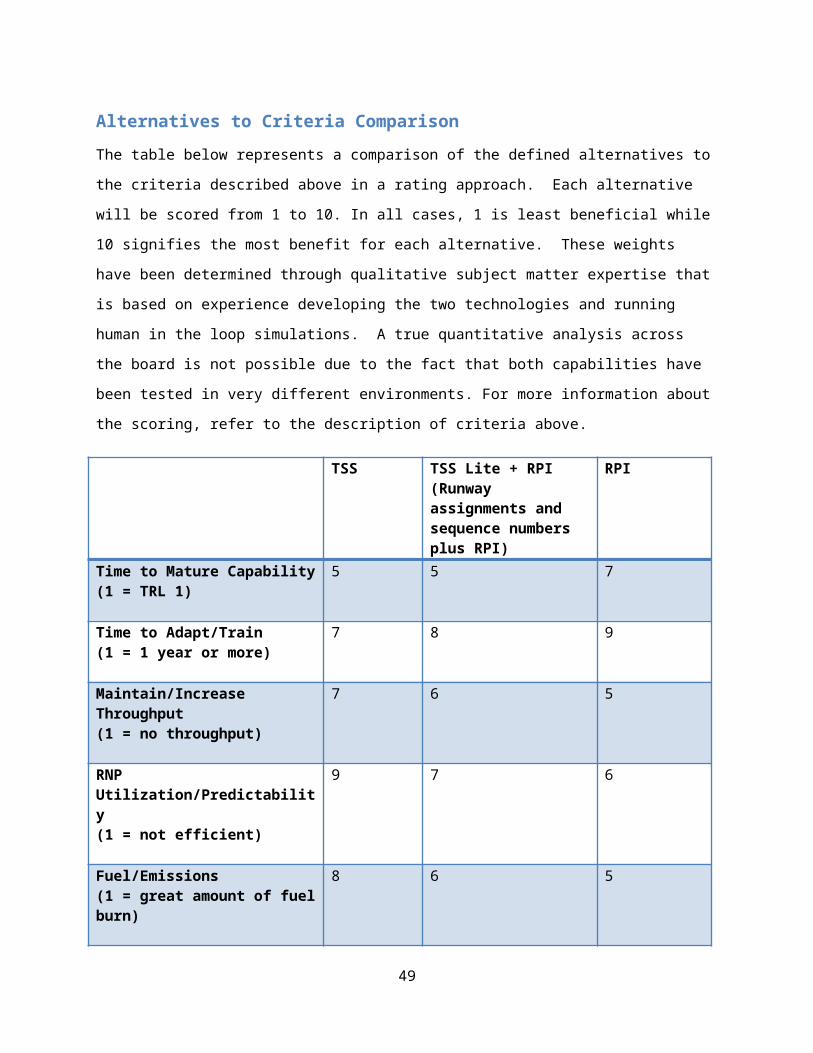
Figure 19: Utility vs Cost Graph
Scenario and Sensitivity Analysis
Scenario Analysis
The scenario analysis was performed to check for the levels at which the results would change when
different stakeholders are weighing the attributes. The table below articulates the various values that
are derived when different perspectives are taken into considerations.
Original scenario: weights were elicited from the end user perspective
Scenario 1: Weights were elicited from customer’s perspective
Scenario 2: Weights were elicited from engineering designer perspective
Scenario 3: Time precedes benefits
Scenario 4: Equal Weights for Level 1 Attributes
49
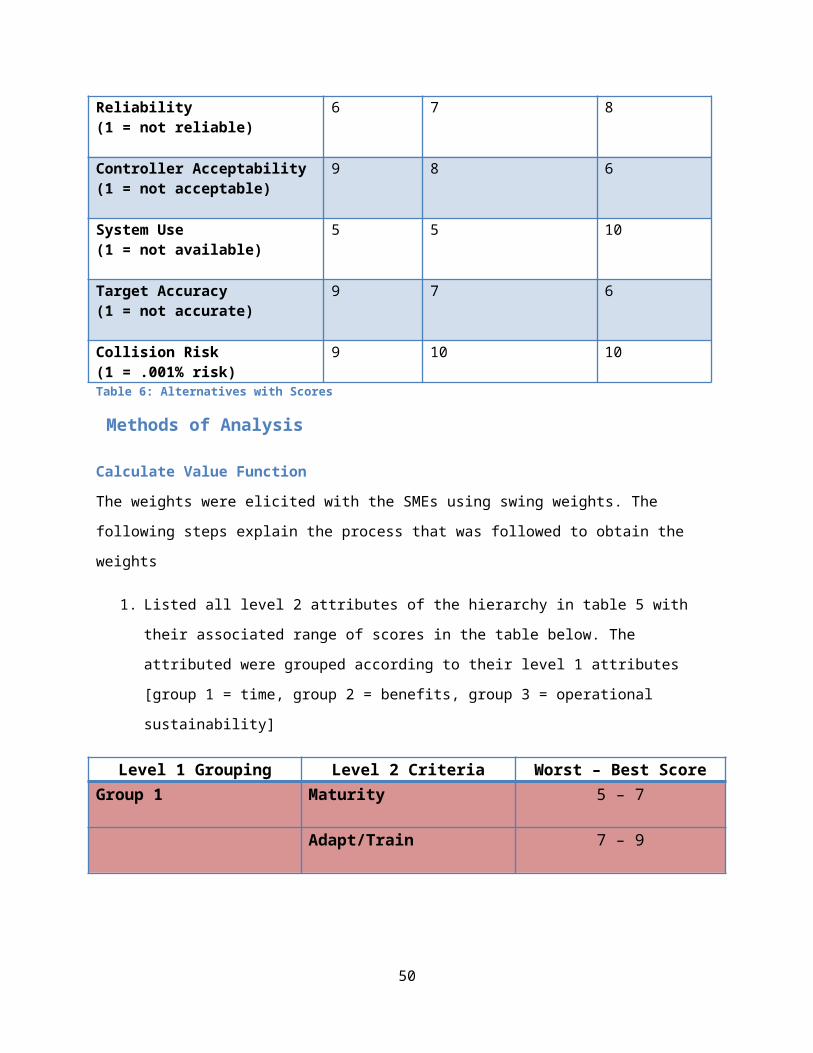
Alternatives User Scenario Agency
Scenario
Systems
Engineering
Scenario
Benefits >
Time
Scenario
Equal Weights
for Level 1
Attributes
TSS 0.69 0.72 0.71 0.73 0.69
TSS Lite + RPI 0.66 0.63 0.68 0.66 0.64
RPI 0.72 0.62 0.72 0.68 0.68
Table 13 Sensitivity Analysis Scenarios
The chart below provides the visual context of the comparison of the values in the chart above.
In performing this analysis, the team has documented the following observations:
TSS has the greatest amount of benefits
RPI is the fastest solution in regards to time to develop and implement
Reliability attribute has a great effect on calculations be careful when scoping
Sensitivity Analysis
The sensitivity analysis was performed to check for the levels at which the results would change when
altering the preference of attributes. The table below articulates the various values that are derived
when the preference is altered.
Rank Attribute Steepness/Slope
1 Maturity 0.198
2 Adapt/Train 0.158
3 Collision 0.112
4 Target Accuracy 0.101
50
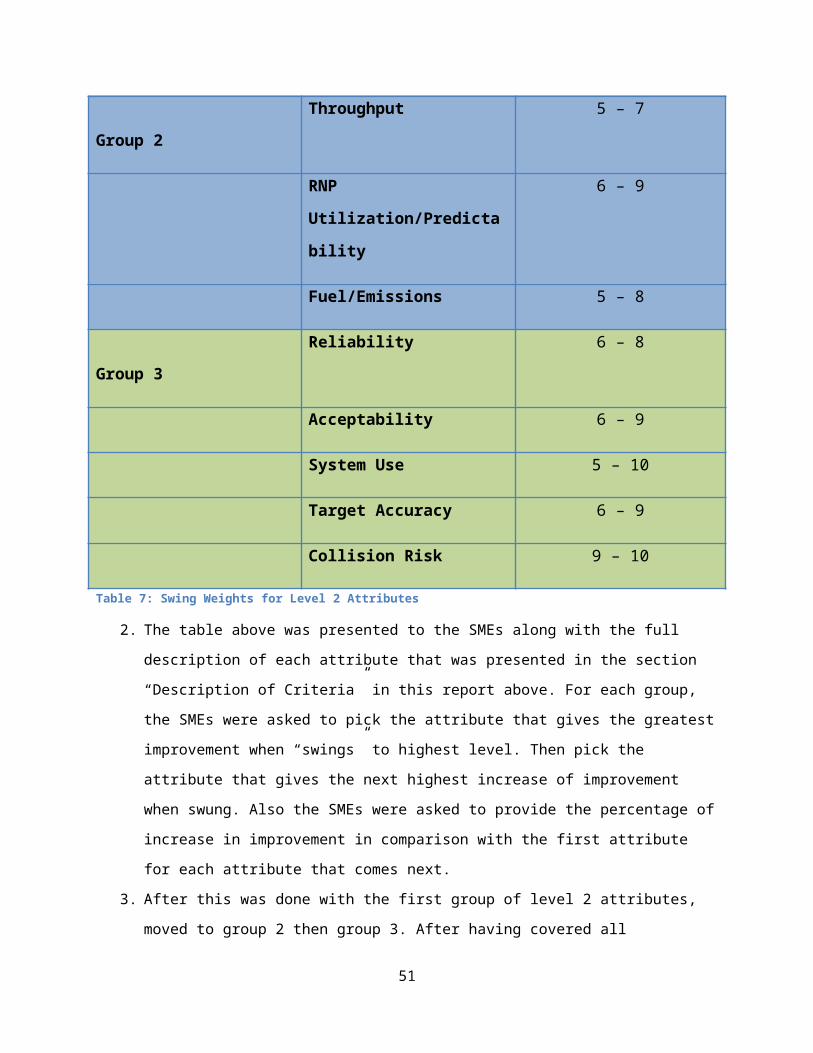
5 Reliability 0.098
6 RNP Utilization/Predictability 0.085
7 Acceptability 0.073
8 Throughput 0.068
9 System Use 0.061
10 Fuel/Emissions 0.046
Results
From the analysis performed, the results demonstrate the following order according to benefits
TSS > TSS Lite/RPI > RPI
51
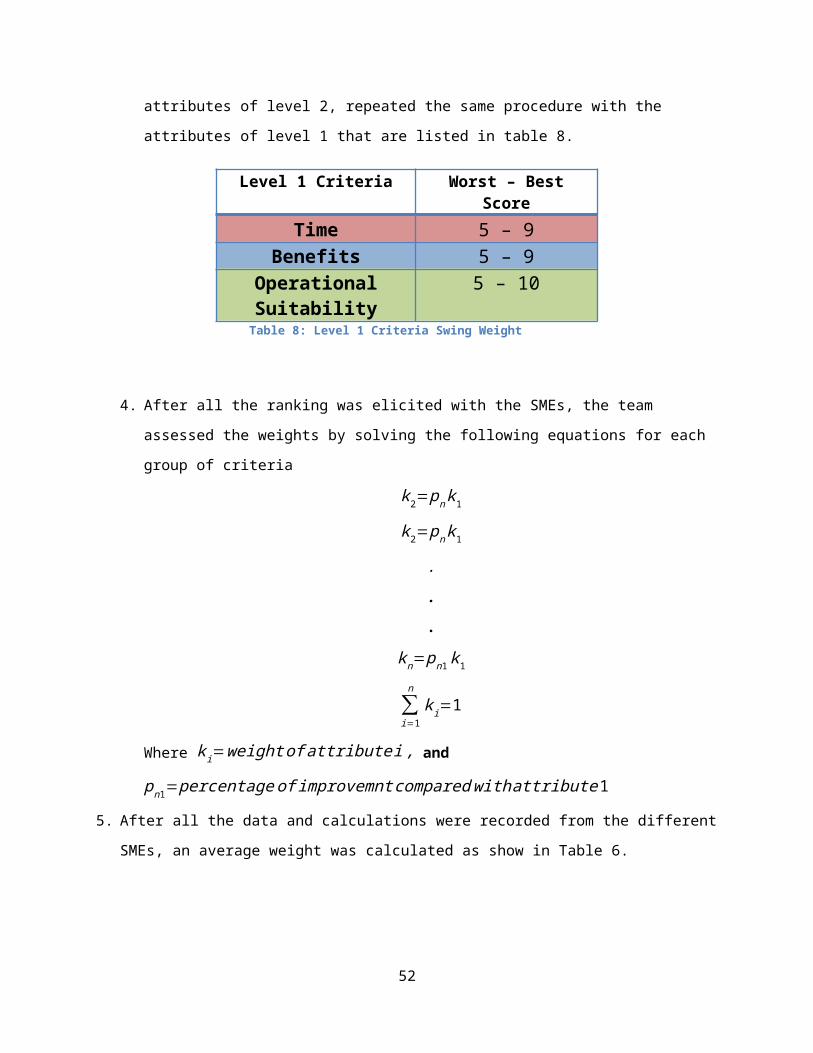
Conclusions/Recommendation
The scores differ considerably between the ATC perspective of values and FAA headquarters'
perspective. The team recommends a meeting at the decision maker level to set clear priorities on what
is MOST important. The alternative analysis framwork is already in place and the team would easily be
run the analysis multiple times with the new weights after the stakholder agree on the priorities.
If cost is not an issue, one potential recommendation is a phased approach of RPI followed by TSS as this
would allow agency to realize some sort of benefits in near term. The table below clearly articulates
which capability “wins” depending on the priority of the decision maker.
If Decision Maker Priority Is….
Capability
Time RPI
Benefits TSS
Cost RPITable 14: Priority vs Capability Table
Schedule
The schedule, as shown below, was developed to keep the TDST on track throughout the course of the
semester. This schedule was updated on a regular basis and key responsibilities were outlined in the
resource section. To date, the schedule is 100% complete and the team stayed “on track” throughout
the course of the semester.
52
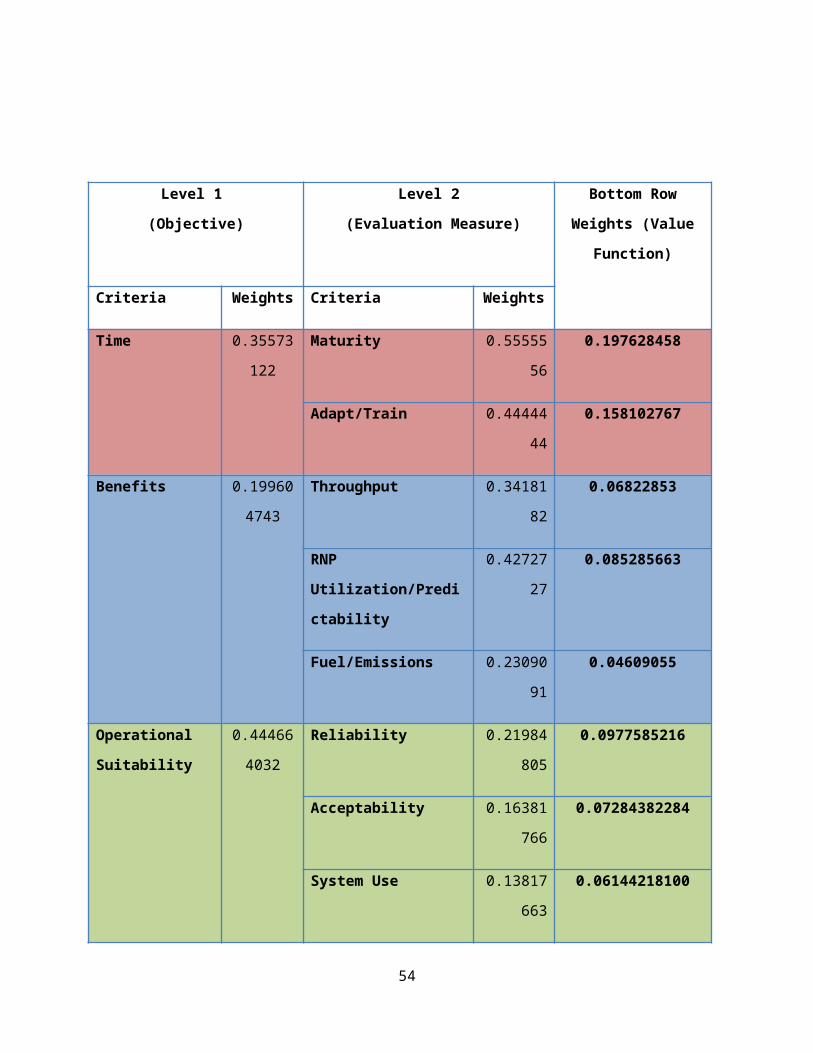
[2] Relative Position Indicator Concept of Operations
[3] C. M. Johnson et al., “Terminal Sequencing and Spacing (TSS) Concept of Operations,” The MITRE
Corporation, McLean, VA, MP130330, Jul. 2013
[4] FAA, National Airspace System (NAS) System Engineering Manual, Version 3.1, Washington, DC, Oct.
2006.
[5] C. M. Johnson et al., “Requirements Validation Plan for Time-Based Metering Using Area Navigation
(RNAV) and Required Navigation Performance (RNP) Routes,” The MITRE Corporation, McLean, VA,
MP100227, Jul. 2010.
[6] Jeffrey Shepley and Paul MacWilliams, "Relative Position Indicator," ATCA Journal, 2008
[7] Paul MacWilliams and Jeffrey Shepley, "A Site Study and Benefits Analysis of a TRACON Situational
Awareness Aid," The MITRE Corporation, McLean, VA, 2007.
[8] Jeffrey Shepley, "Near-Term Terminal Area Automation for Arrival Coordination," The MITRE
Corporation, McLean, VA, 2009.
[9] Becker, T.A.; Barker, D.R.; Smith, A.P., "Methods for maintaining benefits for merging aircraft on
terminal RNAV routes," Digital Avionics Systems Conference, 2004. DASC 04. The 23rd , vol.1, no.,
pp.2.E.1,21-13 Vol.1, 24-28 Oct. 2004 doi: 10.1109/DASC.2004.1391278
[10] Klein, K.A.; Sprong, K.R.; Haltli, B.M.; Becker, T.A.; DeArmon, J.S., "Evaluating operational benefits of
terminal RNAV: Las Vegas case study," Digital Avionics Systems Conference, 2004. DASC 04. The 23rd ,
vol.1, no., pp.2.C.1,21-11 Vol.1, 24-28 Oct. 2004 doi: 10.1109/DASC.2004.1391267
[11] http://en.wikipedia.org/wiki/List_of_the_busiest_airports_in_the_United_States
[12] http://www.geaviation.com/systems/products-and-services/air-traffic-optimization-services/performance-based-navigation/learning-opd.html
[13] http://faaindustryforum.org/1%20-%20BOB%20TYO-Industry%20Forum%20Presentation%20TBFM-PM.pdf
54
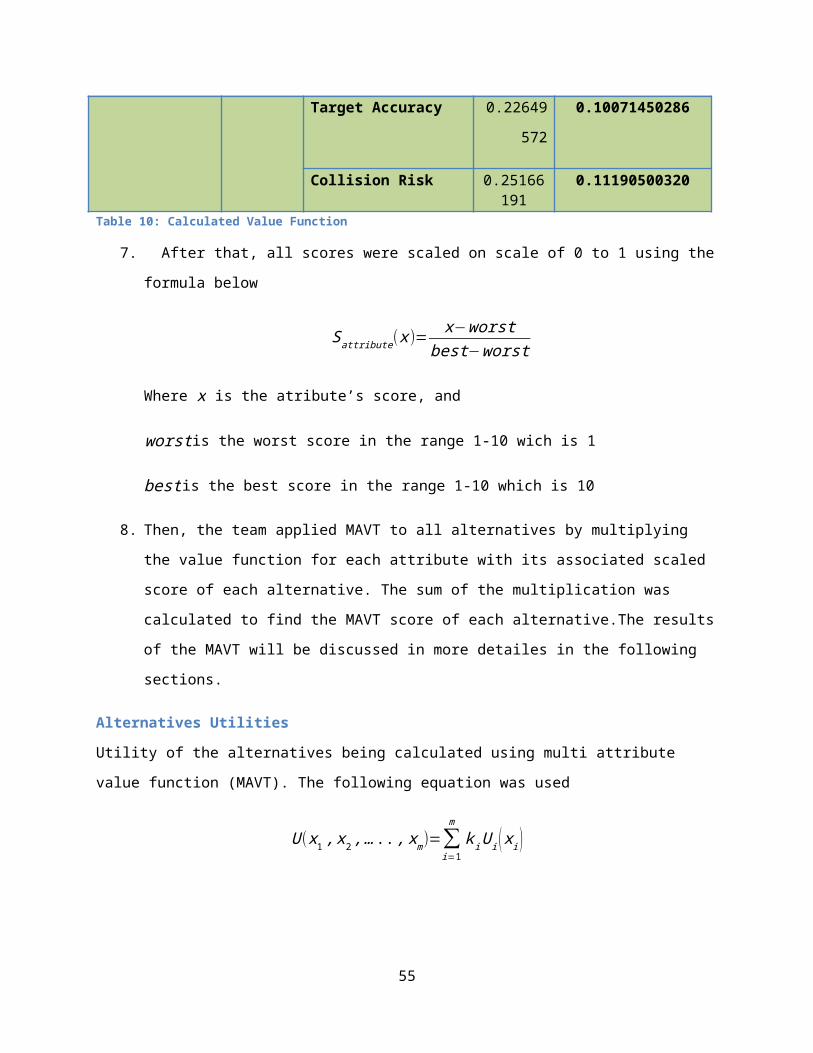
[14]http://www.fly.faa.gov/Products/Training/Traffic_Management_for_Pilots/TFM_in_the_NAS_Booklet_ca10.pdf
[15] http://en.wikipedia.org/wiki/Continuous_descent_approach
[16] http://www.faa.gov/nextgen/library/media/getSmart_PBN.pdf
[17] http://www.faa.gov/news/fact_sheets/news_story.cfm?newsId=10856
[18] http://www.faa.gov/air_traffic/publications/atpubs/aim/aim0102.html
[19] http://www.aea.net/AvionicsNews/ANArchives/RNPJan08.pdf
[20] http://www.geaviation.com/systems/products-and-services/air-traffic-optimization-services/
[21] http://www.jpdo.gov/newsArticle.asp?id=60
[22] http://www.macnoise.com/faq/what-performance-based-navigation-pbn-rnavrnp
[23] http://www.gpo.gov/fdsys/pkg/CHRG-111hhrg51384/html/CHRG-111hhrg51384.htm
[24] Herndon. Capt Albert A, "Promise and Limitations of PBN (RNAV and RNP)," The MITRE Corporation,
McLean, VA, 2013.
[25] http://www.caasd.org/library/documents/Relative%20Position%20Indicator[1].pdf
[26] http://www.atcguild.com/Seminar2011/Presentations/RPI%20for%20India%20October%202011-
final.pdf
[27] http://en.wikipedia.org/wiki/File:NASA_TRL_Meter.jpg
Acronyms
55
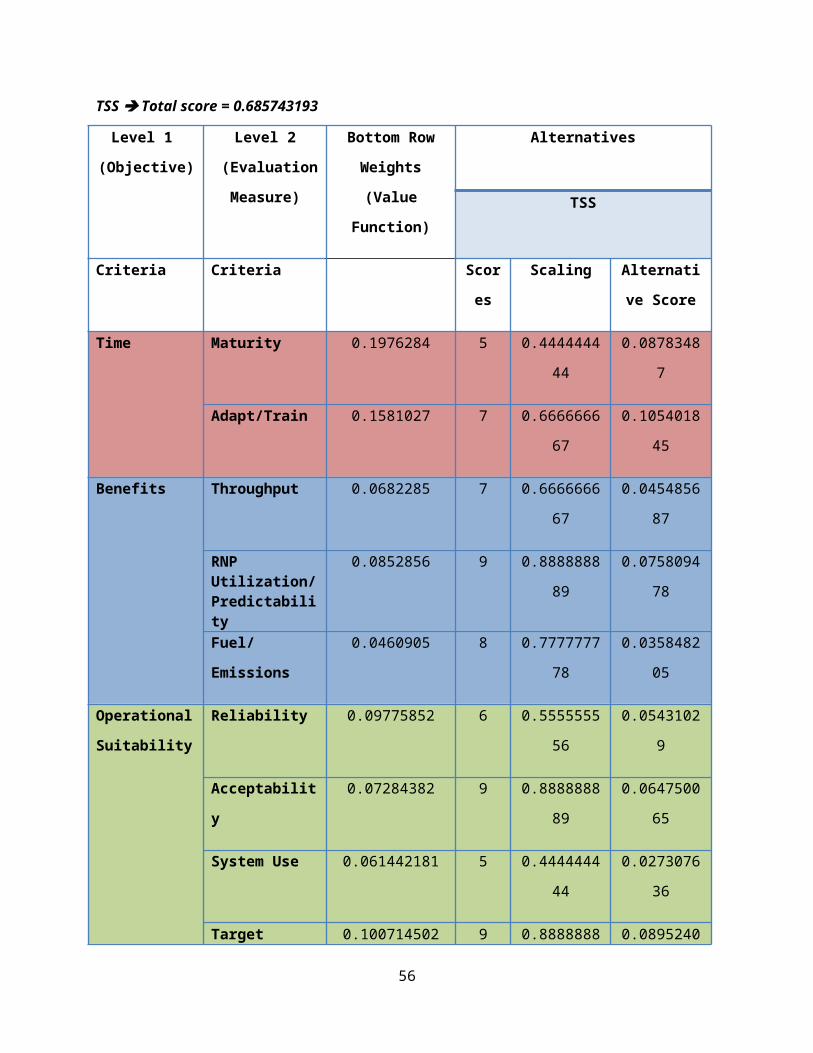
ACRONYM Definition
ADS-B Automatic Dependent Surveillance-BroadcastARTS Automated Radar Tracking SystemCAASD Center for Advanced Aviation System
DevelopmentCARTS Common Automated Radar Terminal SystemConOps Concept of OperationsCRDA Converging Runway Display AidDCA Ronald Reagan Washington National AirportDOC Direct (Aircraft) Operation CostsHFDS Human Factors Design StandardHITL Human-In-The-LoopIAD Dulles International AirportLOAs Letters of AgreementNAS National Airspace SystemOEP Operation Evolution PartnershipP50 Phoenix TRACONPTL Predicted Track LineRF Radius-to-FixRNAV Area NavigationRNP Required Navigation PerformanceRPI Relative Position IndicatorSCT Southern California TRACONSIAP Standard Instrument Approach ProcedureSTARS Standard Terminal Automation Replacement
SystemTBM Time-Based MeteringTDST Terminal Decision Support ToolTMA Traffic Management AdvisorTM Traffic Management
56