Embed Size (px)
Citation preview
1
Term Research Project: Nike, Inc.
Shawn Rembecky
Montclair State University
Fundamentals of Accounting ACCT 204-21
Professor Patricia Villano, CPA
June 23, 2015
2
Table of Contents
Nike, Inc. Summary and Recommendation Letter………………………………….….…………….. 3
Introduction ..................................................................................................................... 4
Financial Statements ..................................................................................................... 6
Statement of Cash Flows .............................................................................................. 6
Income Statement ......................................................................................................... 8
Income Statement Horizontal Analysis ..................................................................... 8
Income Statement Vertical Analysis .......................................................................... 9
Balance Sheet ............................................................................................................. 12
Balance Sheet Horizontal Analysis ......................................................................... 12
Balance Sheet Vertical Analysis ............................................................................. 13
Financial Ratio Analysis .............................................................................................. 16
Liquidity ....................................................................................................................... 16
Solvency ..................................................................................................................... 17
Profitability .................................................................................................................. 18
Industry and Competitor Analysis .............................................................................. 20
Conclusion .................................................................................................................... 22
Appendix: Full Set of Nike, Inc. Financial Statements ............................................. 23
3
TO: Professor Patricia Villano, CPA
FROM: Shawn Rembecky
DATE: June 23, 2015
SUBJECT: Nike, Inc. Summary and Recommendation Letter
Over the last three decades, Nike, Inc. has established itself in America as the
unquestioned leader of the Textile - Apparel Footwear & Accessories industry. Nike’s
growing domestic success propelled the company to become an instantly recognized
brand internationally, competing with the likes of Adidas. Even with new competitors
nipping at their heels, Nike’s power and influence within the industry continues to grow.
Findings
The year 2014 saw continued solid performance by Nike across the board, as
evidenced by the company’s strong financial statements. An overview of Nike’s Income
Statement revealed Nike has experienced steady increases in revenue and net income
every year since 2012. Nike’s Statement of Cash Flows also showed the company is
paying significant dividends to its investors, a finding that was also supported by
fantastic Financial Ratios that measured Nike’s profitability.
Recommendations
Upon exploring the possibility of investing in Nike based on the company’s trends over
the last three years, it is highly recommended to Just Do It. Buy Nike stock. The
company’s financials reveal Nike has discovered a winning formula and plans to stick
with its bread and butter over the coming years: investing considerable capital into
developing their products and strategically pursuing athletic sponsorships.
4
Introduction
Bill Bowerman, a track and field coach, and Phil Knight, a middle-distance runner
who was enrolled in the University of Oregon, teamed up to found Nike in 1964. The
company was originally named Blue Ribbon Sports and operated as a distributor for the
Japanese shoemaker Onitsuka Tiger, which later became ASICS. The company
officially became Nike, Inc. in 1971 when Nike's first employee, Jeff Johnson, had the
idea to adopt the name from the Greek goddess of victory. Interestingly, the iconic Nike
swoosh was designed by Portland State University student Carolyn Davidson for just
$35. Quite the bargain. As compensation for her contribution to the company, Nike
awarded her stock many years later that is worth over $640,000 today.
A pivotal moment in the company’s history came in 1984 when Nike signed then-
rookie Michael Jordan to an endorsement deal and shortly after released his first
signature shoe, the Air Jordan. Originally, the NBA banned players from wearing the Air
Jordan, which drew a remarkable amount of publicity. In a crucial business decision to
continue promoting the shoe, Nike agreed to pay all of Jordan’s fines handed down by
the NBA. The decision proved to be the right one: as Jordan’s popularity and success
soared, Nike benefitted wonderfully from the partnership and quickly saw the value in
establishing athlete partnerships.Despite not playing professionally since 2003, Jordan
still reportedly earns $60 million annually in royalties from Nike, making him the athlete
with, by far, the biggest Nike endorsement deal in the history of the company. The year
2003 also marked the first time in the company’s celebrated history that international
sales exceeded domestic sales, pointing to a clear shift within the industry as Nike
continued to develop into a truly global brand.
5
Today, Nike is headquartered in Beaverton, Oregon, and prides itself on being
the “largest and most successful brand of shoes, sports equipment, clothing, controlling
more than 60% of the market, and becoming a pop culture icon.” Within the United
States, Nike has identified Under Armour as an up and coming competitor. Globally,
Nike has identified Adidas as their biggest competitor, another storied company with
deep roots in athletics. Not known for their nature to be complacent within the Textile -
Apparel Footwear and Accessories industry, Nike has always made it a point to stay
ahead of their competition by continuously pushing new products into the market. Nike
products have stretched beyond running shoes to apparel, to sports equipment, to
eyewear, and even to fitness tracking technology products such as the Nike+
SportWatch GPS, Nike+ Fuelband, and Nike+ Sportbrand, which have all been recently
introduced since the turn of the decade.
Nike also continues to thrive on corporate sponsorships ranging across American
sports including football and basketball, and international sports such as soccer, golf,
handball, and cricket. Identifying key star athletes and sponsoring entire professional or
college teams have contributed to building Nike’s brand and acquiring a greater
domestic and international market share of the industry. Within the Textile - Apparel
Footwear & Accessories industry, Nike has established themselves as a leader and
innovator that does not show any signs of letting up any time soon.
6
Financial Statements
Statement of Cash Flows
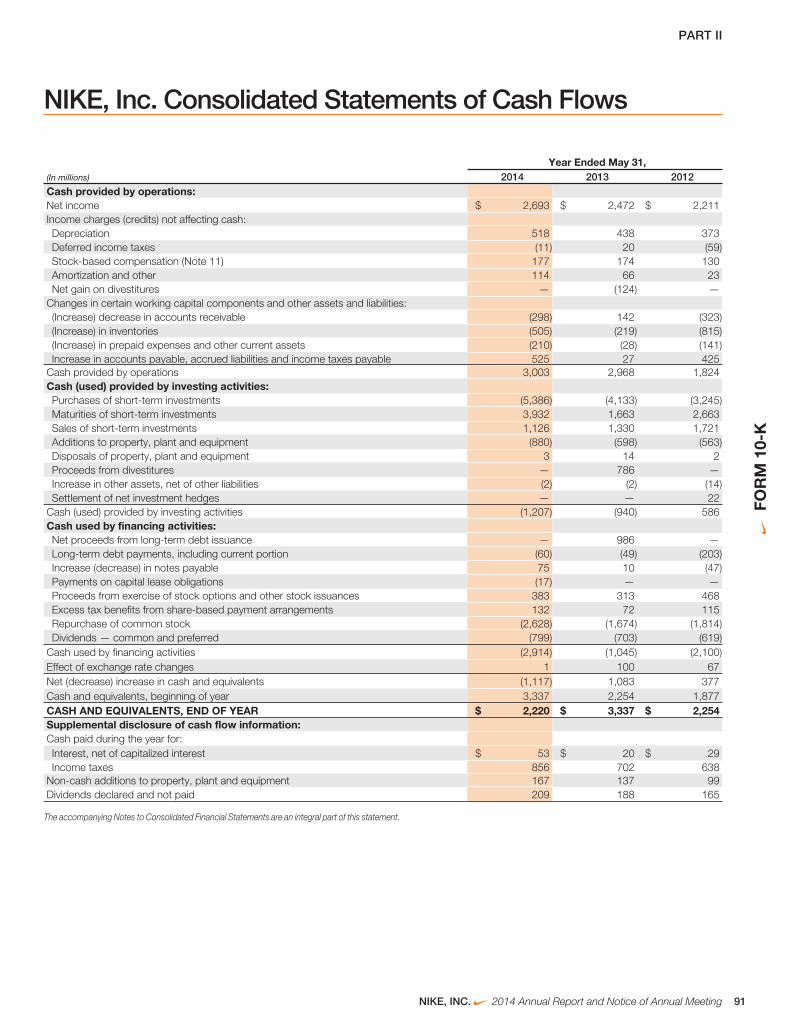
Nike’s Statement of Cash Flows is very telling of the company’s activities over
the last three years. Reviewing Nike’s operating activities, we see the company has
generated approximately $3 billion in cash from operating activities, which indicates that
Nike’s cash receipts from customers ($4 billion) exceeded their cash payments to
suppliers ($1 billion) in 2014. Glancing over Nike’s 2012 ($1.8 billion) and 2013 ($2.9
billion) numbers, we see that Nike has steadily increased its cash from operating
activities over the last three years, which tells us Nike is profitable and operating
efficiently. Aside from Net Income ($2.6 billion), the bulk of Nike’s cash inflows appear to
come from depreciation ($518 million) and accounts payable ($525 million). Observing
that depreciation has steadily increased over the years would suggest Nike is acquiring
more new assets faster than existing assets are reaching the end of their lifecycles. This
is promising considering Nike is capable of generating large gains. Increased accounts
payable from the previous year simply suggests Nike owes dues that it may be
expected to pay as early as 2015.
Examining Nike’s investing activities since 2012, we see Nike has gradually
spent more cash in its investments, accumulating $1.2 billion in 2014. The greatest cash
outflows came with Nike’s increase in purchases of short-term investments ($5.3 billion)
and additions to property, plant, and equipment ($880 million). We also see a noticeable
spike in cash inflows from maturities of short-term investments ($3.9 billion) in 2014,
signaling Nike has been wise with its short-term investments and is enjoying immediate
results from its successful decisions.
7
Lastly, we look at Nike’s financing activities, totaling $2.9 billion for 2014. Among
Nike’s financing activities from last year, two notable activities are Nike’s repurchasing
of common stock ($2.6 billion) and payment of dividends ($799 million). Foremost,
paying dividends is a positive sign for investors. More importantly, Nike has recorded
paying ever-increasing dividends over the last three years, which is very encouraging.
Nike’s decision to repurchase stock also helps investors because repurchasing stock
typically helps increase the value of stock. However, Nike’s repurchase of stock in 2014
far surpassed previous years ($1.6 billion in 2013, $1.8 billion in 2012), which
contributed to Nike’s expensive financing activities final balance.
Despite an increase in cash from operating activities, Nike’s steep cash outflows
from investing and financing activities resulted in its lowest end-of-year cash and
equivalents balance over the last three years. While this may sound daunting on the
surface, Nike actually received $986 million in net proceeds from long-term debt
insurance in 2013, something Nike did not receive in either 2014 or 2012. Removing this
one activity places Nike’s 2014 total right in the ballpark of its cash and equivalents
balances from recent years.
8
Financial Statements
Income Statement
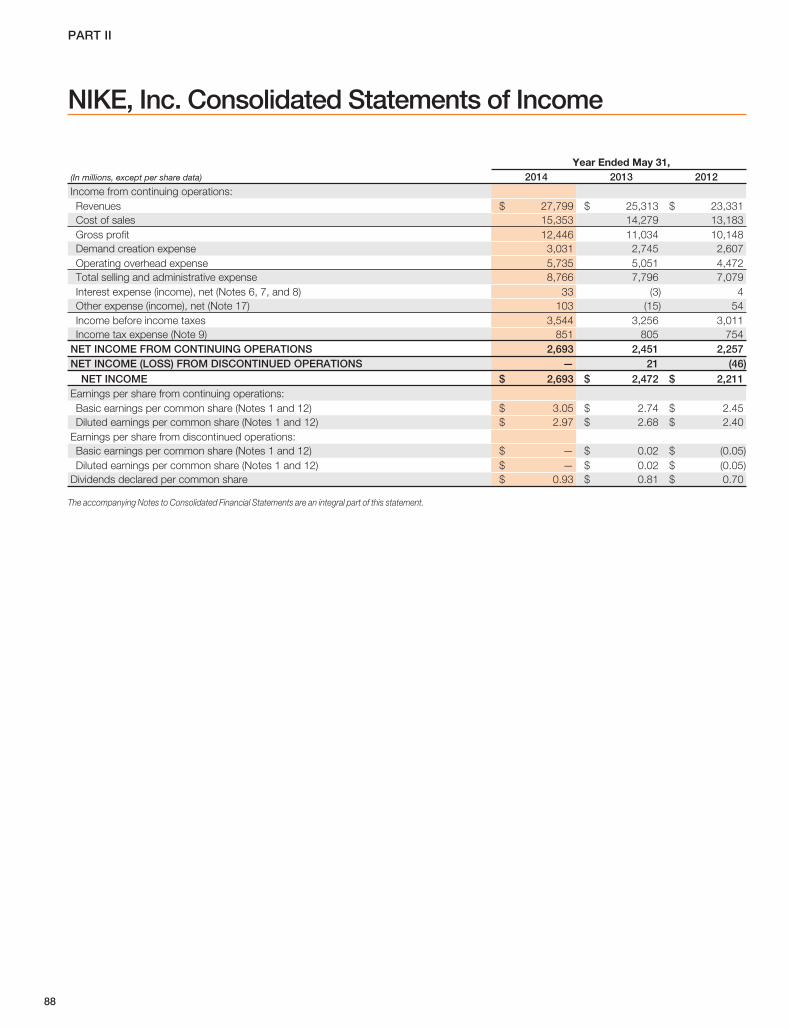
Nike’s 2014 Income Statement stands rather impressively. The company has
experienced increases in revenue and net income every year since 2012. In the
process, Nike managed to increase revenues while keeping cost of sales down,
resulting in a higher gross profit than the last two years. Of course, as more money
comes into the company, more money must go out to ensure the company continues to
run smoothly. As a result, Nike also experienced increased spending across all
expenses from previous years. These increases were necessary, yet it is important for
Nike to be mindful of their steadily growing expenses moving forward.
Income Statement Horizontal Analysis
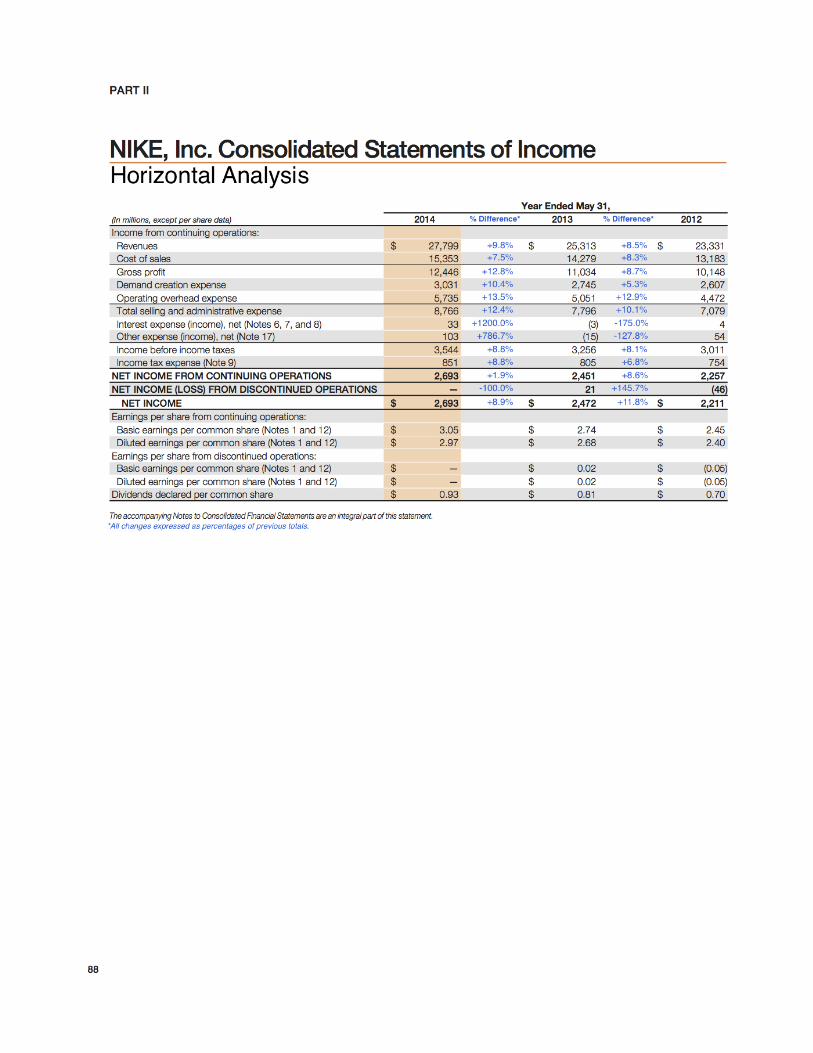
Performing a Horizontal Analysis on Nike’s 2014 Income Statement is indicative
of Nike’s continued growth over the last few years. Right off the bat, we see that
although Nike’s revenue (+9.8%) and cost of Sales (+7.5%) have both increased since
2013, Nike’s revenue experienced greater growth, resulting in a noticeable spike in
gross profit (+12.8%). It is also encouraging to see Nike is willing to increase its demand
creation expense (advertising and promotion expenses, including costs of endorsement
contracts) by +5.3% in 2013 and an additional +10.4% in 2014. These increases show
Nike is sticking with its commitment to creative marketing, one of its tried-and-true
business strategies that it executes to near perfection and sets Nike apart from its
competitors. We also see total selling and administrative expenses increased from 2012
to 2013 (+10.1%) and again from 2013 to 2014 (+12.4%), in large part due to the
aforementioned demand creation expense. While Nike’s net income increased each
9
year over the last three years, the company experienced its greatest rise from 2012 to
2013 (+11.8%) and another significant boost from 2013 to 2014 (+8.9%).
Income Statement Vertical Analysis
A Vertical Analysis of Nike’s 2014 Income Statement tells a slightly different story
about Nike’s numbers and sheds an interesting light on the company’s financial
responsibility. Comparing numbers from the last three years, Nike has remained
relatively consistent with its allocation of resources. Cost of sales have hovered around
55%-56% of sales, while gross profit has hovered around 43%-44% of sales. The same
holds true for Nike’s demand creation expense (10%-11%), operating overhead
expense (19%-20%), total selling and administrative Expense (30%-31%), and even net
income (9%). Nike’s consistency is indicative of the company’s structure. This Vertical
Analysis perfectly illustrates that Nike is not a company to make questionable or
unpredictable decisions with their resources, which is yet another promising sign for
potential investors.
Trends over the last three years indicate Nike is doing a better job of keeping
cost of sales down and maximizing its gross profit. We also see that, although Nike is
spending more on demand creation expense, it is still in proportion to being a
percentage of sales as it was in previous years. Likewise, Nike’s net income has also
steadily increased in total dollar amount, but still only accounts for just fewer than 10%
of total sales. It would appear as though Nike is not taking a larger piece of the pie, but
rather the entire pie itself is simply growing in size.

12
Financial Statements
Balance Sheet
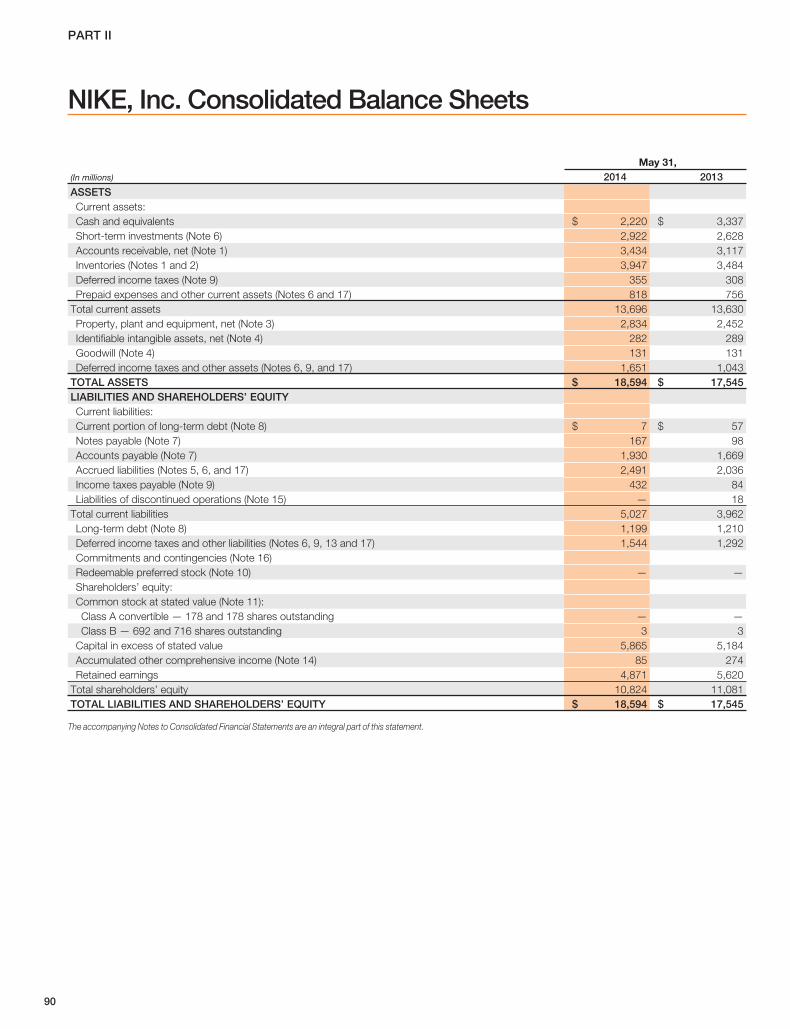
An overview of the Assets portion of the 2014 Balance Sheet reveals that,
despite experiencing a massive hit to the cash and equivalents account to the tune of
$1.117 billion, Nike still managed to grow their other assets and finish 2014 with a $66
million increase in total current assets from the previous year. It is also worth noting the
jump in property, plant, and equipment, which is likely a result of Nike spending more on
manufacturing equipment, or expanding their brick and mortar presence across the
world.
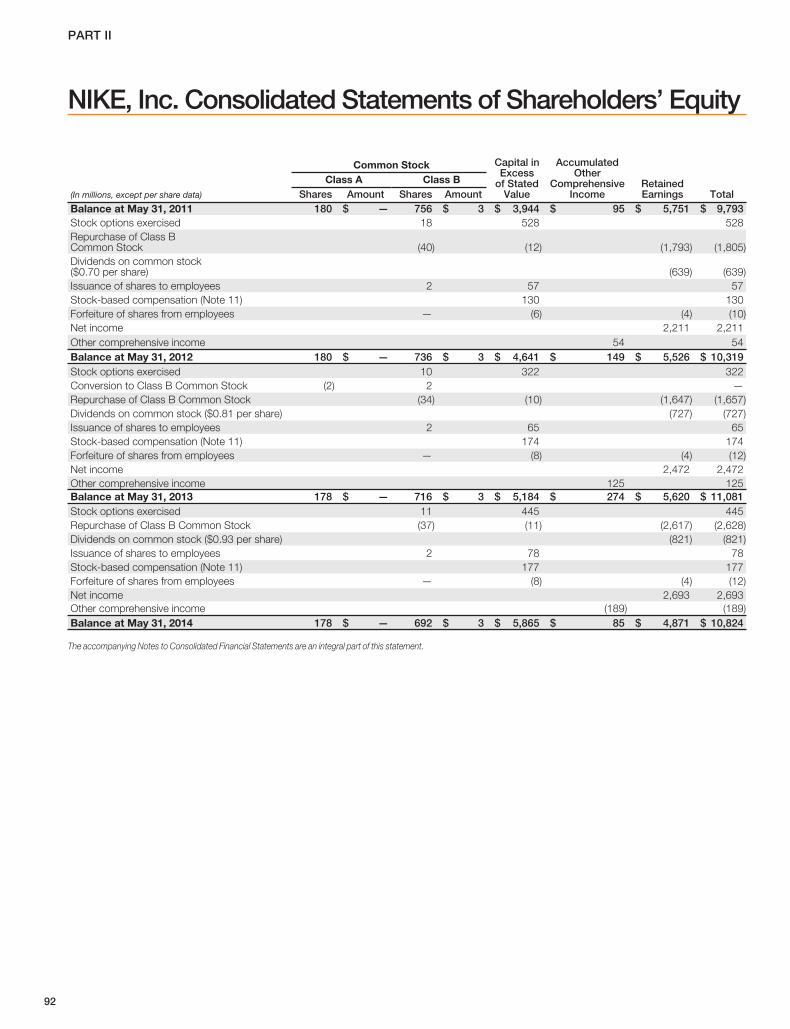
Most of Nike’s drastic changes from the previous year appear in the Liabilities
and Stockholder’s Equity portions of the 2014 Balance Sheet. Nike’s retained earnings
fell $749 million from 2013 to 2014. That decrease in retained earnings is likely a direct
result of the substantial repurchase of common stock and heftier dividends paid out to
investors, which was previously mentioned in the analysis of Nike’s Income Statement.
The decrease in retained earnings from the previous year also represents lost capital
Nike will be without when making future business decisions.
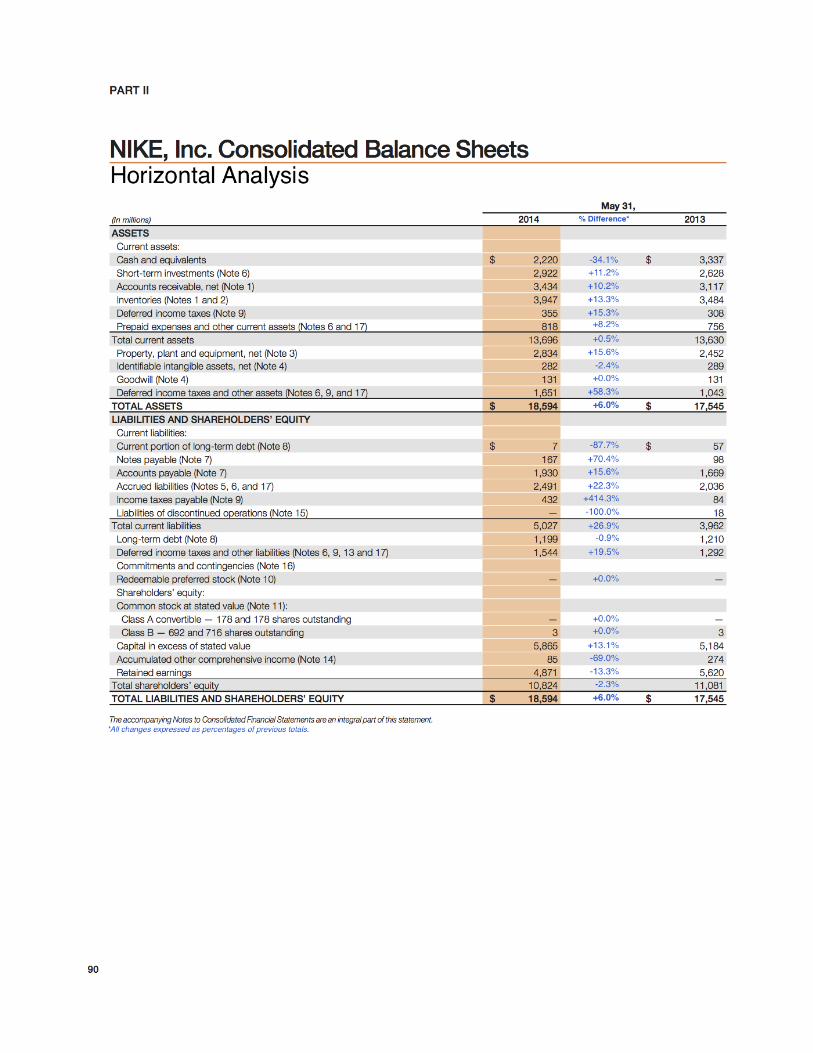
Balance Sheet Horizontal Analysis
Conducting a Horizontal Analysis on Nike’s 2014 Balance Sheet reveals some
noteworthy findings. Nike experienced a -34.1% difference in cash and equivalents from
its 2013 total and only a +0.5% increase in total current assets over that same
timespan. Among the biggest increases in Nike’s Assets came from deferred income
taxes and other assets (+58.3%), property, plant, and equipment (+15.6%), and
inventories (+13.3%). An increase in inventories may prove troublesome if Nike finds
the task of moving older inventory too difficult. It is possible that Nike is currently
13
collecting obsolete inventory, and the company may be forced to recognize it as a loss
in the future.
Meanwhile, total current liabilities experienced a +26.9% jump and total
stockholder’s equity fell -2.3% from the previous year. Major changes to this portion of
the Balance Sheet came from income taxes payable (+414.3%), notes payable
(+70.4%), accumulated other comprehensive income (-69.0%), and current portion of
long-term debt (-87.7%). For a company of Nike’s size and wealth, experiencing such
drastic increases in accounts payable may not be as problematic as they actually seem.
It is worth noting Nike also has assets tied up in Accounts Receivable that significantly
outweigh total accounts payable. Of course, this only helps Nike if their debtors honor
their debts when Nike expects them to.
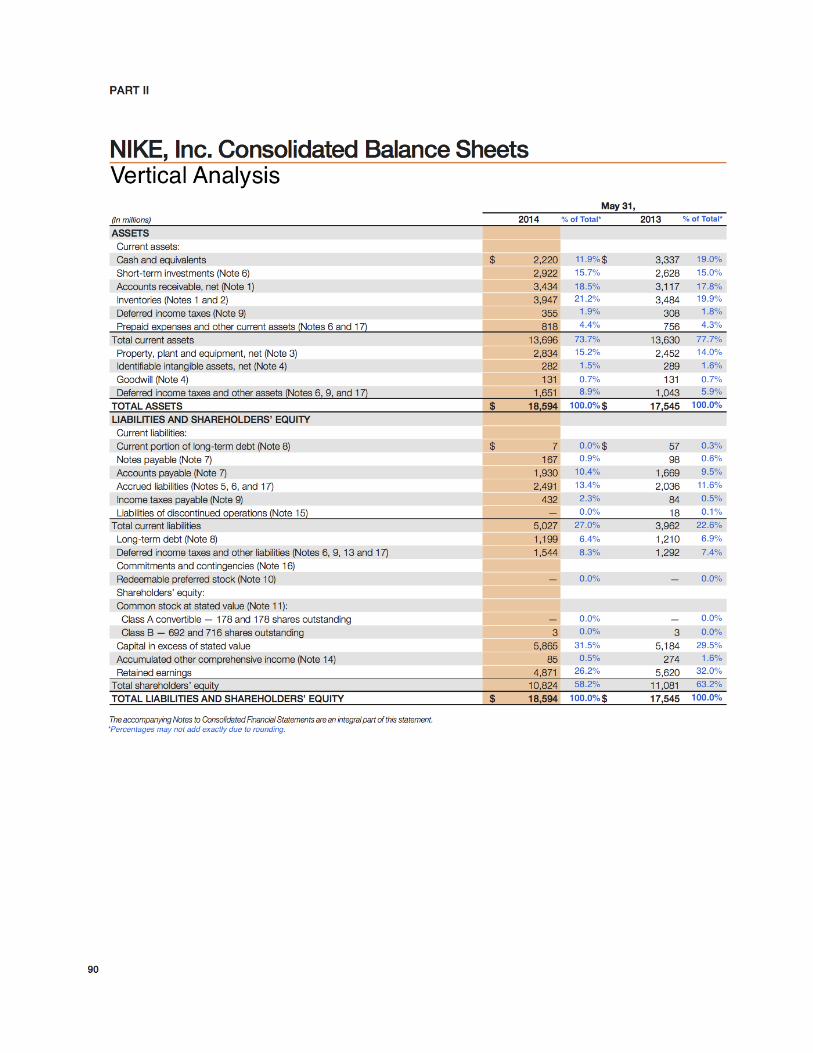
Balance Sheet Vertical Analysis
When performing a Vertical Analysis on Nike’s 2014 Balance Sheet, previous
concerns uncovered by the Horizontal Analysis no longer seem as significant. Once
again, Nike proves to be consistent with its financial allocation of resources. With the
exception of cash and equivalents, all Asset accounts as a percentage of total assets
appear to be relatively consistent with their corresponding calculated percentages from
2013. The Liabilities and Stockholder’s Equity portion of the Balance Sheet seems to tell
a similar story. Minor changes within each of the Liabilities and Stockholder’s Equity
accounts over the last two years shifted some of the weight from total stockholder’s
equity (63.2% in 2013 compared to 58.2% in 2014), onto total liabilities (22.6% in 2013
compared to 27.0% in 2014), but individual accounts as a percentage of total liabilities
and stockholder’s equity remain fairly unchanged.
16
Financial Ratio Analysis
Although reviewing Nike’s financial statements can offer great insight into the
productivity and growth of the company, conducting a Financial Ratio Analysis helps to
provide a more complete picture of Nike’s financial health. Here, we examine Nike’s
liquidity, solvency, and profitability by comparing 2014’s results against the company’s
performance in 2013. All definitions of the terms and ratios for this part of the analysis
were derived directly from our course textbook.
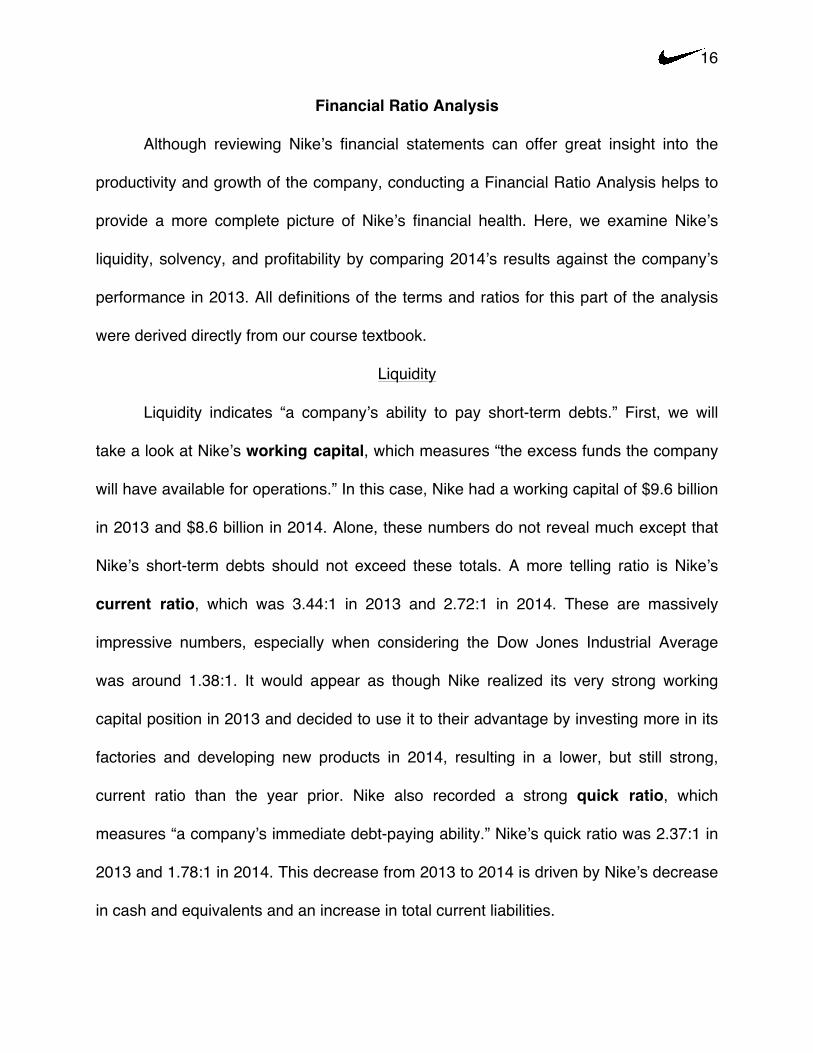
Liquidity
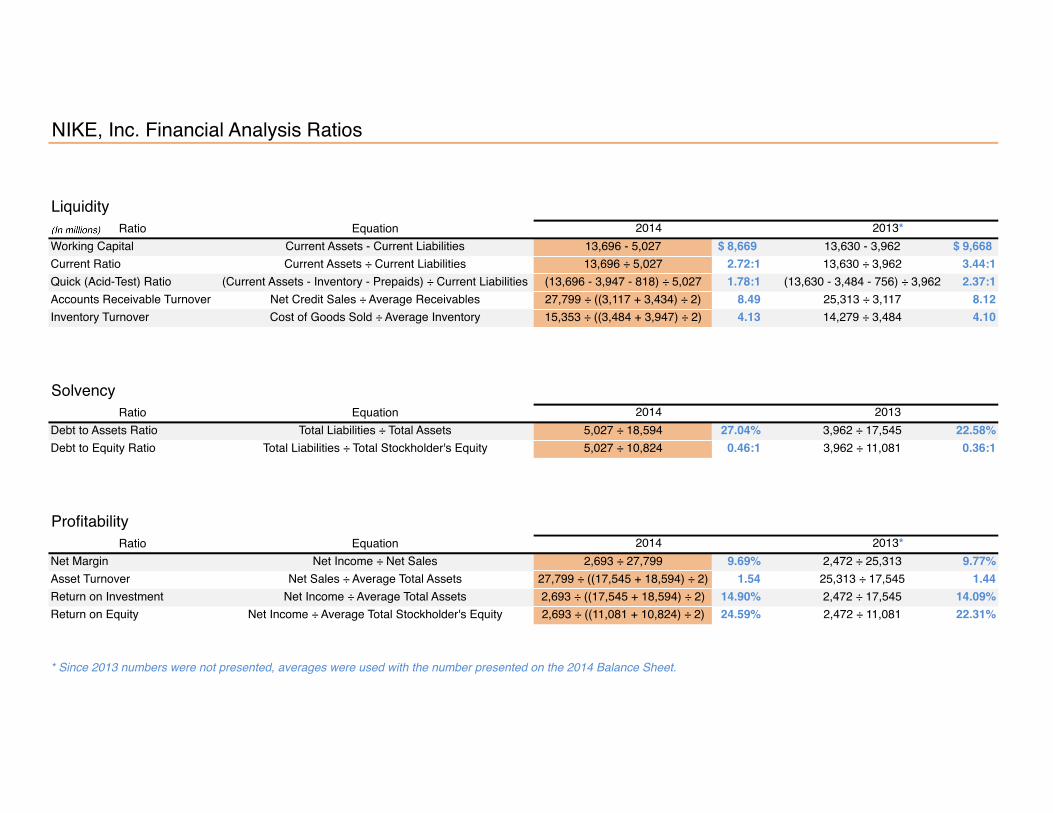
Liquidity indicates “a company’s ability to pay short-term debts.” First, we will
take a look at Nike’s working capital, which measures “the excess funds the company
will have available for operations.” In this case, Nike had a working capital of $9.6 billion
in 2013 and $8.6 billion in 2014. Alone, these numbers do not reveal much except that
Nike’s short-term debts should not exceed these totals. A more telling ratio is Nike’s
current ratio, which was 3.44:1 in 2013 and 2.72:1 in 2014. These are massively
impressive numbers, especially when considering the Dow Jones Industrial Average
was around 1.38:1. It would appear as though Nike realized its very strong working
capital position in 2013 and decided to use it to their advantage by investing more in its
factories and developing new products in 2014, resulting in a lower, but still strong,
current ratio than the year prior. Nike also recorded a strong quick ratio, which
measures “a company’s immediate debt-paying ability.” Nike’s quick ratio was 2.37:1 in
2013 and 1.78:1 in 2014. This decrease from 2013 to 2014 is driven by Nike’s decrease
in cash and equivalents and an increase in total current liabilities.
17
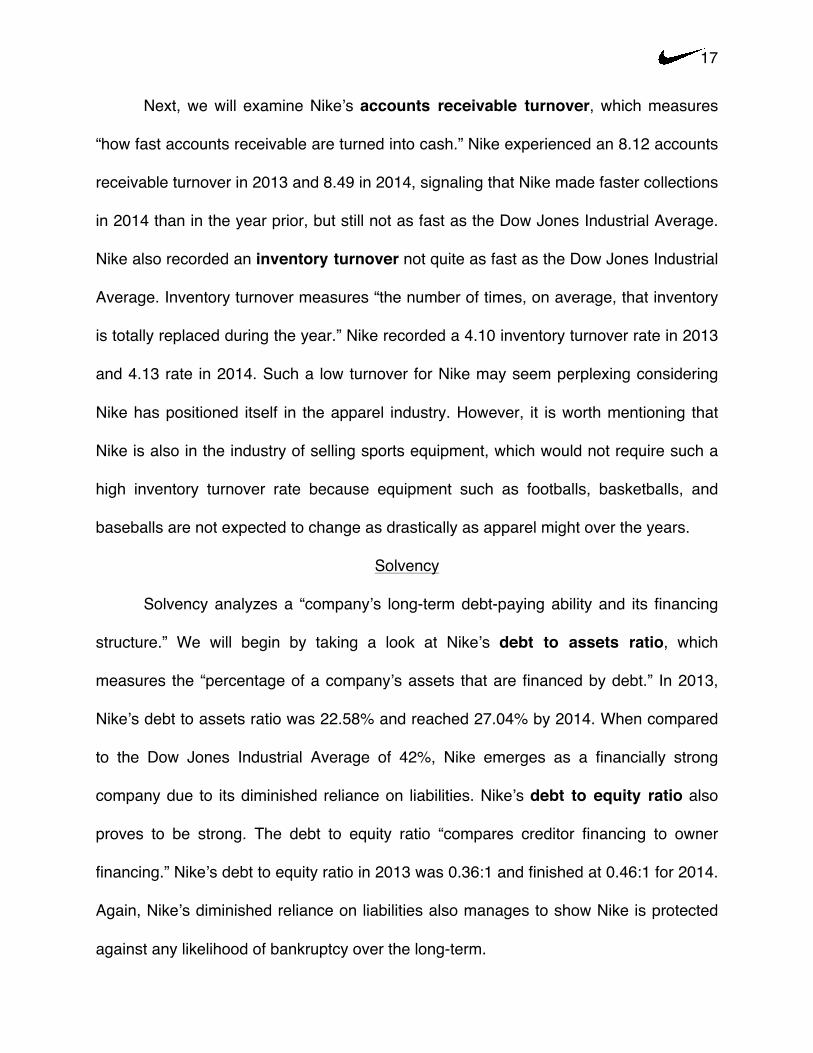
Next, we will examine Nike’s accounts receivable turnover, which measures
“how fast accounts receivable are turned into cash.” Nike experienced an 8.12 accounts
receivable turnover in 2013 and 8.49 in 2014, signaling that Nike made faster collections
in 2014 than in the year prior, but still not as fast as the Dow Jones Industrial Average.
Nike also recorded an inventory turnover not quite as fast as the Dow Jones Industrial
Average. Inventory turnover measures “the number of times, on average, that inventory
is totally replaced during the year.” Nike recorded a 4.10 inventory turnover rate in 2013
and 4.13 rate in 2014. Such a low turnover for Nike may seem perplexing considering
Nike has positioned itself in the apparel industry. However, it is worth mentioning that
Nike is also in the industry of selling sports equipment, which would not require such a
high inventory turnover rate because equipment such as footballs, basketballs, and
baseballs are not expected to change as drastically as apparel might over the years.
Solvency
Solvency analyzes a “company’s long-term debt-paying ability and its financing
structure.” We will begin by taking a look at Nike’s debt to assets ratio, which
measures the “percentage of a company’s assets that are financed by debt.” In 2013,
Nike’s debt to assets ratio was 22.58% and reached 27.04% by 2014. When compared
to the Dow Jones Industrial Average of 42%, Nike emerges as a financially strong
company due to its diminished reliance on liabilities. Nike’s debt to equity ratio also
proves to be strong. The debt to equity ratio “compares creditor financing to owner
financing.” Nike’s debt to equity ratio in 2013 was 0.36:1 and finished at 0.46:1 for 2014.
Again, Nike’s diminished reliance on liabilities also manages to show Nike is protected
against any likelihood of bankruptcy over the long-term.

18
Profitability
Profitability represents “a company’s ability to generate earnings.” An important
measure of profitability is net margin, which “describes the percent of each sales dollar
remaining after subtracting other expenses as well as cost of goods sold.” Nike’s net
margin was 9.77% in 2013 and 9.69% in 2014. Both are respectable numbers but still
below the Dow Jones Industrial Average of 12%. Nike could boost its net margin either
by increasing selling prices or by cutting down expenses. Another useful indicator of
profitability is the asset turnover ratio, which measures “how many sales dollars were
generated for each dollar of assets invested.” In 2013, Nike recorded an asset turnover
ratio of 1.44 and a ratio of 1.54 for 2014. It is reasonable to expect that Nike would have
a lower ratio because the company operates in an industry that relies on large
investments in plant and machinery to develop its products.
Nike’s return on investment proves to be a convincing indicator of the
company’s strong performance. Return on investment is “the ratio of wealth generated
(net income) to the amount invested (average total assets) to generate the wealth.” Nike
had a 14.09% return on investment in 2013 and a 14.90% return on investment in 2014,
well above the Dow Jones Industrial Average of 9%. Typically, higher return on
investments indicates better company performance. Nike’s return on equity is equally
as impressive. Return on equity measures “the profitability of the stockholder’s
investment.” In Nike’s case, investors enjoyed a sizeable 22.31% return on equity in
2013 and a 24.59% return on equity in 2014. These generous returns were sure to
please Nike investors over the last two years.
NIKE, Inc. Financial Analysis Ratios
Ratio EquationWorking Capital Current Assets - Current Liabilities 13,696 - 5,027 8,669$ 13,630 - 3,962 9,668$ Current Ratio Current Assets ÷ Current Liabilities 13,696 ÷ 5,027 2.72:1 13,630 ÷ 3,962 3.44:1Quick (Acid-Test) Ratio (Current Assets - Inventory - Prepaids) ÷ Current Liabilities (13,696 - 3,947 - 818) ÷ 5,027 1.78:1 (13,630 - 3,484 - 756) ÷ 3,962 2.37:1Accounts Receivable Turnover Net Credit Sales ÷ Average Receivables 27,799 ÷ ((3,117 + 3,434) ÷ 2) 8.49 25,313 ÷ 3,117 8.12Inventory Turnover Cost of Goods Sold ÷ Average Inventory 15,353 ÷ ((3,484 + 3,947) ÷ 2) 4.13 14,279 ÷ 3,484 4.10
Ratio EquationDebt to Assets Ratio Total Liabilities ÷ Total Assets 5,027 ÷ 18,594 27.04% 3,962 ÷ 17,545 22.58%Debt to Equity Ratio Total Liabilities ÷ Total Stockholder's Equity 5,027 ÷ 10,824 0.46:1 3,962 ÷ 11,081 0.36:1
Ratio EquationNet Margin Net Income ÷ Net Sales 2,693 ÷ 27,799 9.69% 2,472 ÷ 25,313 9.77%Asset Turnover Net Sales ÷ Average Total Assets 27,799 ÷ ((17,545 + 18,594) ÷ 2) 1.54 25,313 ÷ 17,545 1.44Return on Investment Net Income ÷ Average Total Assets 2,693 ÷ ((17,545 + 18,594) ÷ 2) 14.90% 2,472 ÷ 17,545 14.09%Return on Equity Net Income ÷ Average Total Stockholder's Equity 2,693 ÷ ((11,081 + 10,824) ÷ 2) 24.59% 2,472 ÷ 11,081 22.31%
2014 2013*
Liquidity
Solvency
Profitability
* Since 2013 numbers were not presented, averages were used with the number presented on the 2014 Balance Sheet.
2014 2013*
2014 2013
20
Industry and Competitor Analysis
Within the Textile - Apparel Footwear & Accessories industry, Nike has not been
shy about positioning itself as a premium brand when placing thick price tags on their
products throughout the years. Very telling of Nike’s brand power is the company’s
ability to price a running shoe at $225 running shoe, when there are plenty of shoes
available for under $100, and still manage to generate a profit. How is this possible?
Although a simple answer may not suffice for such a perplexing paradox, Nike has
greatly benefitted from being a steadfast company built on reliable, but not radical,
products and marketing ingenuity. Smart, sensible, strategic movements contribute to
shape Nike’s legacy today even as the company turned 50-years old just last year.
Nike has also built its empire on successfully managed athlete, team, and league
endorsements. Among Nike’s newest deals is an agreement with the NBA to replace
Adidas as the league’s official on-court apparel provider. Even more monumental is the
fact that Nike will become the first apparel company in league history to feature its logo
on player uniforms. The eight-year deal is for the 2017-18 season and is reportedly
worth at $1 billion, giving Nike an even greater hold on the globalized sports market.
David Carter, principal of The Sports Business Group, commented, “Adidas
made it clear months ago that it was going to shift from pursuing a league-wide deal to
signing more high-profile stars to endorsement contracts.” Adidas also admitted their
deal with the NBA was not as rewarding as it was expecting. However, Nike is expecting
a different result. Today, Nike accounts for 90% of basketball shoe sales in America and
also supplies apparel for USA Basketball and many different college programs
21
throughout the country. Nike is also well known for its partnership with Michael Jordan
and is expected to leverage that partnership during its tenure of supplying the NBA.
Adidas’s decision to forgo the NBA deal reveals a telling shift in Adidas’s
strategy. They are facing pressure from a new, formidable competitor: Under Armour.
Nike is currently the largest sportswear company in America. The second largest is
Under Armour, surpassing Adidas just last year. Like Adidas, Nike has identified Under
Armour as a force within the industry, and their corporate battles have spilled onto
countless playing fields.
Earlier this month, the country watched as the Golden State Warriors, led by
2015 NBA MVP Stephen Curry, defeated arguably the greatest player in the world,
LeBron James, and the Cleveland Cavaliers to capture the NBA Finals championship.
Although the Warriors were favored to win the championship, the matchup between
Curry and James had bigger implications in the sports business world: Nike sponsors
James, and Under Armour sponsors Curry. Historically, Nike has dominated sports
sponsorships, signing larger-than-life personalities among the likes of Michael Jordan,
Tiger Woods, and Kobe Bryant. Under Armour, on the other hand, has managed to
make some big sponsorship splashes as of late, and with relatively unknown athletes,
such as Curry and Masters champion Jordan Spieth who most recently won the U.S.
Open at Chambers Bay in Washington this past Father’s Day weekend.
While Under Armour continues to nip at Nike’s heels, Nike’s hold on the industry
does not appear to be loosening any time soon. Even with James losing to Curry in the
NBA Finals, one market research firm estimates James helped to produce $340 million
in basketball shoe sales for Nike in 2014.
22
Conclusion
Reviewing Nike’s Statement of Cash Flows revealed the company’s convincing
capacity to generate cash from operating activities, and Nike’s commitment to well-
calculated cash outflows for investing activities. Nike’s Income Statement also displayed
impressive growth in net income over the last three years. Performing Vertical Analyses
on Nike’s Income Statement and Balance Sheet spoke to the company’s ability to
maintain consistency with its finances and the overall stability of Nike. Among Nike’s
strongest financial ratios were the debt to assets ratio, debt to equity ratio, return on
investment, and return on equity, which proved Nike is far from bankruptcy and able to
provide substantial returns to its investors.
In addition to these valid points, it is also necessary to consider Nike’s innovative
company culture as another reason to invest. In 2013, Fast Company named Nike as
the most innovative company of the year. Bearing in mind physical activity is once again
gaining popularity in America, this “fitness craze” opens the doors for an innovative
company, such as Nike, to develop products that fulfill consumers’ needs for new
products, like wearable fitness tracking technology and exceptional high-performance
sports apparel. In the coming years, Nike is expected to capitalize on this phenomenon
with aggressive spending and fighting to acquire a larger global share of the industry.
Considering the strength of Nike’s financials and promising outlook for the future,
it is highly recommended to buy Nike stock – but only if you have the means. Nike is
currently traded on the New York Stock Exchange and its share price is listed at over
$105. If you do not consider the high valuation of the stock to be a roadblock, choosing
to invest in Nike would be a wise decision.

PART II
NIKE, Inc. Consolidated Statements of Cash Flows
Year Ended May 31,(In millions) 2014 2013 2012Cash provided by operations:Net income $ 2,693 $ 2,472 $ 2,211Income charges (credits) not affecting cash:Depreciation 518 438 373Deferred income taxes (11) 20 (59)Stock-based compensation (Note 11) 177 174 130Amortization and other 114 66 23Net gain on divestitures — (124) —
Changes in certain working capital components and other assets and liabilities:(Increase) decrease in accounts receivable (298) 142 (323)(Increase) in inventories (505) (219) (815)(Increase) in prepaid expenses and other current assets (210) (28) (141)Increase in accounts payable, accrued liabilities and income taxes payable 525 27 425
Cash provided by operations 3,003 2,968 1,824Cash (used) provided by investing activities:Purchases of short-term investments (5,386) (4,133) (3,245)Maturities of short-term investments 3,932 1,663 2,663Sales of short-term investments 1,126 1,330 1,721Additions to property, plant and equipment (880) (598) (563)Disposals of property, plant and equipment 3 14 2Proceeds from divestitures — 786 —Increase in other assets, net of other liabilities (2) (2) (14)Settlement of net investment hedges — — 22
Cash (used) provided by investing activities (1,207) (940) 586Cash used by financing activities:Net proceeds from long-term debt issuance — 986 —Long-term debt payments, including current portion (60) (49) (203)Increase (decrease) in notes payable 75 10 (47)Payments on capital lease obligations (17) — —Proceeds from exercise of stock options and other stock issuances 383 313 468Excess tax benefits from share-based payment arrangements 132 72 115Repurchase of common stock (2,628) (1,674) (1,814)Dividends — common and preferred (799) (703) (619)
Cash used by financing activities (2,914) (1,045) (2,100)Effect of exchange rate changes 1 100 67Net (decrease) increase in cash and equivalents (1,117) 1,083 377Cash and equivalents, beginning of year 3,337 2,254 1,877CASH AND EQUIVALENTS, END OF YEAR $ 2,220 $ 3,337 $ 2,254Supplemental disclosure of cash flow information:Cash paid during the year for:Interest, net of capitalized interest $ 53 $ 20 $ 29Income taxes 856 702 638
Non-cash additions to property, plant and equipment 167 137 99Dividends declared and not paid 209 188 165
The accompanying Notes to Consolidated Financial Statements are an integral part of this statement.
NIKE, INC. 2014 Annual Report and Notice of Annual Meeting 91
FOR
M10
-K
PART II
NIKE, Inc. Consolidated Statements of Income
Year Ended May 31,(In millions, except per share data) 2014 2013 2012Income from continuing operations:Revenues $ 27,799 $ 25,313 $ 23,331Cost of sales 15,353 14,279 13,183Gross profit 12,446 11,034 10,148Demand creation expense 3,031 2,745 2,607Operating overhead expense 5,735 5,051 4,472Total selling and administrative expense 8,766 7,796 7,079Interest expense (income), net (Notes 6, 7, and 8) 33 (3) 4Other expense (income), net (Note 17) 103 (15) 54Income before income taxes 3,544 3,256 3,011Income tax expense (Note 9) 851 805 754
NET INCOME FROM CONTINUING OPERATIONS 2,693 2,451 2,257NET INCOME (LOSS) FROM DISCONTINUED OPERATIONS — 21 (46)
NET INCOME $ 2,693 $ 2,472 $ 2,211Earnings per share from continuing operations:Basic earnings per common share (Notes 1 and 12) $ 3.05 $ 2.74 $ 2.45Diluted earnings per common share (Notes 1 and 12) $ 2.97 $ 2.68 $ 2.40
Earnings per share from discontinued operations:Basic earnings per common share (Notes 1 and 12) $ — $ 0.02 $ (0.05)Diluted earnings per common share (Notes 1 and 12) $ — $ 0.02 $ (0.05)
Dividends declared per common share $ 0.93 $ 0.81 $ 0.70
The accompanying Notes to Consolidated Financial Statements are an integral part of this statement.
88
PART II
NIKE, Inc. Consolidated Balance Sheets
May 31,(In millions) 2014 2013ASSETSCurrent assets:Cash and equivalents $ 2,220 $ 3,337Short-term investments (Note 6) 2,922 2,628Accounts receivable, net (Note 1) 3,434 3,117Inventories (Notes 1 and 2) 3,947 3,484Deferred income taxes (Note 9) 355 308Prepaid expenses and other current assets (Notes 6 and 17) 818 756
Total current assets 13,696 13,630Property, plant and equipment, net (Note 3) 2,834 2,452Identifiable intangible assets, net (Note 4) 282 289Goodwill (Note 4) 131 131Deferred income taxes and other assets (Notes 6, 9, and 17) 1,651 1,043
TOTAL ASSETS $ 18,594 $ 17,545LIABILITIES AND SHAREHOLDERS’ EQUITYCurrent liabilities:Current portion of long-term debt (Note 8) $ 7 $ 57Notes payable (Note 7) 167 98Accounts payable (Note 7) 1,930 1,669Accrued liabilities (Notes 5, 6, and 17) 2,491 2,036Income taxes payable (Note 9) 432 84Liabilities of discontinued operations (Note 15) — 18
Total current liabilities 5,027 3,962Long-term debt (Note 8) 1,199 1,210Deferred income taxes and other liabilities (Notes 6, 9, 13 and 17) 1,544 1,292Commitments and contingencies (Note 16)Redeemable preferred stock (Note 10) — —Shareholders’ equity:Common stock at stated value (Note 11):Class A convertible — 178 and 178 shares outstanding — —Class B — 692 and 716 shares outstanding 3 3
Capital in excess of stated value 5,865 5,184Accumulated other comprehensive income (Note 14) 85 274Retained earnings 4,871 5,620
Total shareholders’ equity 10,824 11,081TOTAL LIABILITIES AND SHAREHOLDERS’ EQUITY $ 18,594 $ 17,545
The accompanying Notes to Consolidated Financial Statements are an integral part of this statement.
90
PART II
NIKE, Inc. Consolidated Statements of Shareholders’ Equity
Common Stock Capital inExcess
of StatedValue
AccumulatedOther
ComprehensiveIncome
RetainedEarnings Total
Class A Class B(In millions, except per share data) Shares Amount Shares AmountBalance at May 31, 2011 180 $ — 756 $ 3 $ 3,944 $ 95 $ 5,751 $ 9,793Stock options exercised 18 528 528Repurchase of Class BCommon Stock (40) (12) (1,793) (1,805)Dividends on common stock($0.70 per share) (639) (639)Issuance of shares to employees 2 57 57Stock-based compensation (Note 11) 130 130Forfeiture of shares from employees — (6) (4) (10)Net income 2,211 2,211Other comprehensive income 54 54Balance at May 31, 2012 180 $ — 736 $ 3 $ 4,641 $ 149 $ 5,526 $ 10,319Stock options exercised 10 322 322Conversion to Class B Common Stock (2) 2 —Repurchase of Class B Common Stock (34) (10) (1,647) (1,657)Dividends on common stock ($0.81 per share) (727) (727)Issuance of shares to employees 2 65 65Stock-based compensation (Note 11) 174 174Forfeiture of shares from employees — (8) (4) (12)Net income 2,472 2,472Other comprehensive income 125 125Balance at May 31, 2013 178 $ — 716 $ 3 $ 5,184 $ 274 $ 5,620 $ 11,081Stock options exercised 11 445 445Repurchase of Class B Common Stock (37) (11) (2,617) (2,628)Dividends on common stock ($0.93 per share) (821) (821)Issuance of shares to employees 2 78 78Stock-based compensation (Note 11) 177 177Forfeiture of shares from employees — (8) (4) (12)Net income 2,693 2,693Other comprehensive income (189) (189)Balance at May 31, 2014 178 $ — 692 $ 3 $ 5,865 $ 85 $ 4,871 $ 10,824
The accompanying Notes to Consolidated Financial Statements are an integral part of this statement.
92

NIKE, INC.One Bowerman DriveBeaverton, OR 97005-6453www.nike.com