Embed Size (px)
Citation preview

Teresa Giannini, Simone Antoniucci, Dario Lorenzetti, Arkady A. Arkharov, Andrea Di Paola, Valeri M. Larionov, Avet Harutyunyan,
Gianluca Li Causi, Brunella Nisini, Fabrizio Vitali
EXORCISM: EXOR optiCal-Infrared Systematic Monitoring

Layout
• Introduction on FUors and EXors
• The EXORCISM monitoring program
• Some results about on-going optical/near-infrared photometric and spectroscopic monitoring
• Investigation at longer wavelengths
• Conclusions

EXors vs FUors Hartmann 1998
• After the main-accretion phase protostars continue to accrete at lower rates, through intermittent outbursts (FUor/EXor events, e.g. Hartmann & Kenyon 1996).
• This evolutionary stage is crucial for the comprehension of the star formation processes, because during this phase the accretion halts, determining the consequent evolution of the protostar
Kospal + 2011s
V2493 CygMiller + 2011

SIMILARITIES :• During quiescence have SEDs typical of a low-mass classical T Tau
stars• IR excess due to circumstellar disk material (gas + dust)• Accretion driven variability
DIFFERENCES (mainly in OUTBURST PHASE):
• Optical ouburst strength: FUors : 4-6 mag, EXors: 2-5 mag
• Outburst duration: FUors : 10-100 yr, EXors: months, years
• Mass accretion rate : FUors : 10-6-10-4 Mʘyr-1, EXors: 10-8-10-5 Mʘyr-1
• Spectroscopy: FUors : absorption lines, EXors: emission lines
EXors vs FUors • Few objects : around 50 objects in total nearly equally distributed in
both classes (Audard+ 2014, PPVI)

Fundamental Questions about FUors and EXors:
• Do they represent peculiar objects or rather are a short but common and repetitive phase of the pre-main evolution? monitoring of known objects and statistics
• Are FUors and EXors distinct objects or rather they represent two subsequent evolutionary stages (with FUors typically younger than EXors) ? search for variables in different evolutionary stages
• Which is the mechanism at the origin of the burst? • disk thermal instability (Lin 1985 ) slow rise in the light-curve• perturbation of the disk induced by an external body (Tassis &
Mouschovias 2005) fast rise in the light-curve• disk-magnetosphere interaction (D’ Angelo & Spruit 2010, 2012)
shorter timescales, able to explain EXor outbursts.
• Which is the role of episodic accretion in stellar and disk evolution ? eg. mass accretion rates

EXORCISM
EXORCISM is a systematic monitoring project based on photometric and spectroscopic observations at optical and near-IR wavelengths, with the aim to:
• trace photometric variations (monthly basis)
• trace spectroscopic variations (yearly basis, more often in case of outburst)
• prompt detection and follow-up of any outburst
The poor knowledge we have of EXors behaviour is mainly due to:
i) lack of long-term multi-wavelength monitoring (photometric and spectroscopic)
ii) only few studies able to compare photometry and/or spectroscopy of the outburst and quiescence phase (eg. Sipos+ 2009, Audard+ 2010, Sicilia-Aguilar+ 2012, Juhasz+ 2012)
iii) few high angular resolution observations able to spatially resolve the inner disk of the sources (eg. radial velocity variations, Kospal + 2014)
Source Lbol (L)
max-min (V mag)
AV (mag) Opticalphot
Opticalspec
NIRphot
NIRspec
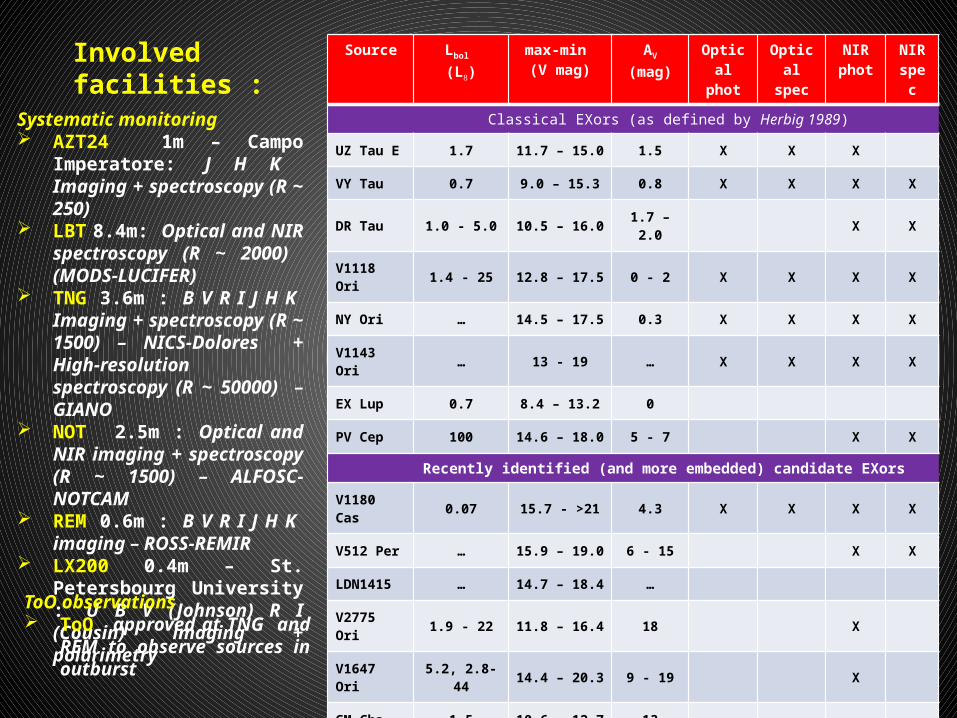
Classical EXors (as defined by Herbig 1989)
UZ Tau E 1.7 11.7 – 15.0 1.5 X X X
VY Tau 0.7 9.0 – 15.3 0.8 X X X X
DR Tau 1.0 - 5.0 10.5 – 16.0 1.7 – 2.0 X X
V1118 Ori 1.4 - 25 12.8 – 17.5 0 - 2 X X X X
NY Ori … 14.5 – 17.5 0.3 X X X X
V1143 Ori … 13 - 19 … X X X X
EX Lup 0.7 8.4 – 13.2 0
PV Cep 100 14.6 – 18.0 5 - 7 X X
Recently identified (and more embedded) candidate EXors
V1180 Cas 0.07 15.7 - >21 4.3 X X X X
V512 Per … 15.9 – 19.0 6 - 15 X X
LDN1415 … 14.7 – 18.4 …
V2775 Ori 1.9 - 22 11.8 – 16.4 18 X
V1647 Ori 5.2, 2.8-44 14.4 – 20.3 9 - 19 X
GM Cha 1.5 10.6 – 12.7 13
OO Ser 4.5 - 26/36 11.4 – 16.1 42
V2492 Cyg 20 14.7 – 18/19 6 - 12 X X X X
V2493 Cyg 2.7 - 12 13.6 – 17.0 3.4
GM Cep 30/40 12.4 – 14.6 2 - 4
Involved facilities :
Systematic monitoring AZT24 1m – Campo Imperatore:
J H K Imaging + spectroscopy (R ~ 250)
LBT 8.4m: Optical and NIR spectroscopy (R ~ 2000) (MODS-LUCIFER)
TNG 3.6m : B V R I J H K Imaging + spectroscopy (R ~ 1500) – NICS-Dolores + High-resolution spectroscopy (R ~ 50000) – GIANO
NOT 2.5m : Optical and NIR imaging + spectroscopy (R ~ 1500) – ALFOSC-NOTCAM
REM 0.6m : B V R I J H K imaging – ROSS-REMIR
LX200 0.4m – St. Petersbourg University : U B V (Johnson) R I (Cousin) imaging + polarimetry
ToO observations ToO approved at TNG and REM
to observe sources in outburst

Photometric monitoringLorenzetti++ 2011Lorenzetti++ 2011 PV Cep V1118 Ori
Audard+ 2010
A systematic monitoring allows to detect not only the largest amplitude bursts, but mainly, significant fluctuations that occur even on less then months timescale.

col-col analysis
AV
____ MS Stars_ _ _ T Tauri……. Extinction laws
○ = quiescent● = outbursting
Lorenzetti++ 2012
Þ EXors become bluer during bursts phases and redder when in quiescence
Þ Typical near-infrared color variations
tend not to follow the extinction vector, so other effects have a role (e.g. disk stratification temperature).
Þ The amplitude of magnitudes variations tends to decrease at longer wavelengths (at least for the largest fluctuations).
Þ infalling matter creates a hot spot on the stellar surface that heats different parts of the disk to different temperatures.

SED analysisÞ While the SED difference can be well
fitted with a single blackbody, it is impossible to fit the data with a pure extinction function.
Þ EXor systems behave as if an additional thermal component appears during the outbursting phase.
Þ Spots persisting up to 50% of the outburst duration, not exceeding 10% of the stellar surface, and with temperatures between 10000-18000 K, are able to account for both the appearance of the additional thermal component and dust sublimation in the inner disk (model by Calvet & Gullbring 1998) .
Lorenzetti+ 2012
V2492 Cyg V2493 Cyg
V1118 Ori SVS 13
V1180 Cas

Spectroscopic monitoringV1118 Ori LBT-MODS
V1118 Ori TNG-NICS
Antoniucci+ 2014• EXors quiescence spectra show a wide
variety of emission features dominated by HI recombination lines.
• EXors outburst spectra are dominated by Fe I and Fe II lines, fairly absent in quiescence phases.
• Typically, HI recombination lines have EW (quiescence) > EW (outburst) continuum increases faster than line flux. This implies that extinction effects are ruled out., being the EW practically unaffected by extinction.
V1118 Ori CI
Lorenzetti+ 2007, 2011
dM/dt
Mass accretion rate in the range 1-3 10-9 M yr-1 is computed by using the empirical relationships that connect the line and accretion luminosity (Alcalà+ 2014).
Line

Antoniucci+ 2014
V1180 Cas TNG-NICS
Spectroscopic monitoring: outburst spectra
The detection of forbidden lines testifies mass-loss phenomena from the source, which is presumably correlated with the ongoing accretion event. Mass accretion rate in the range 1-6 10-8 M yr-1 is computed (Alcalà+ 2014).
Recent outburst of ASASSN 13 DB (Dec 2014- Feb 2015), Antoniucci et al., in prep.

Searching for new EXors
[H-K] variations vs. the H magnitude variations between near-IR observations (Cohen & Kuhi 1979) and 2MASS photometry of a sample of low-mass CTTs. Circled dots are sources that present both magnitude and color variation at S/N level > 5 and 2.5, respectively. Black and red ellipses are the 1 distribution of the whole sample (120 objects) and the circled dots.
• According to the above picture EXors could represent rares cases of a very common phenomenology displayed by all the CTTs.
A way to find candidate EXors is to search for photometric variations in the archival catalogs
[H-K
] cohe
n-[H
-K] 2M
ASS
Hcohen-H2MASS
Redder when brightening Redder when fading
Bluer when brightening Bluer when fading
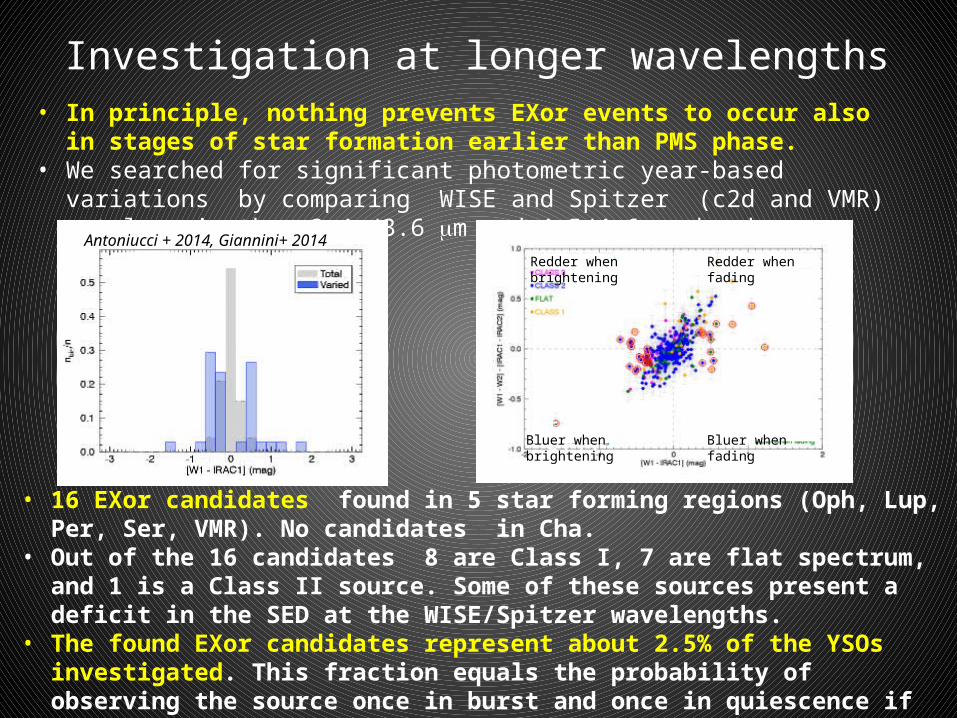
Investigation at longer wavelengths• In principle, nothing prevents EXor events to occur also in stages of star formation
earlier than PMS phase.• We searched for significant photometric year-based variations by comparing WISE
and Spitzer (c2d and VMR) catalogs in the 3.4 /3.6 m and 4.5/4.6 m bands.
Antoniucci + 2014, Giannini+ 2014
• 16 EXor candidates found in 5 star forming regions (Oph, Lup, Per, Ser, VMR). No candidates in Cha.
• Out of the 16 candidates 8 are Class I, 7 are flat spectrum, and 1 is a Class II source. Some of these sources present a deficit in the SED at the WISE/Spitzer wavelengths.
• The found EXor candidates represent about 2.5% of the YSOs investigated. This fraction equals the probability of observing the source once in burst and once in quiescence if the time elapsed between the two events is of about 0.5-1.0 year EXors phenomena could be less rare than believed.
rtf5rt5f
Redder when brightening Redder when fading
Bluer when fadingBluer when brightening

Beyond Spitzer : first detection of a Class 0 FUor ?
• Quite recently, Safron et al. (2015) have reported on the strong variability at 24 m (about a factor of 35) of the Class 0 source
HOPS 383.• However, no significant variations are
reported at longer wavelengths

Variability at Herschel wavelengths? • SED of the Class 0 source
SMM11 (Bolo84) in Perseus, that we have found to be variable in mid-IR (Spitzer/WISE)
• This source shows a variation of about a factor 2.5 also at the Herschel wavelengths (70 m and 160 m) .
• A detailed analysis of the Herschel images is ongoing. If confirmed, this would be a very rare case of source variability detected at sub-mm wavelengths .

Conclusions
• EXORCISM : a systematic optical and near-infrared photometric and spectroscopic monitoring of EXors.
• The main aims are to : 1) enlarge the statistics of EXors2) derive their quiescence parameters3) compare these parameters with those measured during the outburst 4) give observational constraints to theory
• First results have shown that EXors events should be a common phenomenon of PMS stars, but maybe also of YSOs in earlier evolutionary stages
• Need of high-angular resolution observations to investigate the inner regions of the disk (SPHERE observations quite recently performed on Z CmA)
• Need to explore variability at longer wavelengths, SOFIA ?
• X-ray observations (CHANDRA detection of V1180 Cas)


![ANALYTICAL REPORT€¦ · [AAR0955.H/8 May 2018 Page 2 of 46] Summary A painting on canvas by Mikhail Larionov, Still Life, belonging to the Museum Ludwig (reference: ML 1487), that](https://img.pdfslide.us/doc/110x75/60679a72f01a5a5ed741f4e6/analytical-aar0955h8-may-2018-page-2-of-46-summary-a-painting-on-canvas-by-mikhail.jpg)