Embed Size (px)
Citation preview

Tennessee State School Bond Authority A Component Unit of the State of Tennessee
Comprehensive Annual Financial Report
For the Years Ended
June 30, 2017 and June 30, 2016

TENNESSEE STATE SCHOOL BOND AUTHORITY
COMPREHENSIVE
ANNUAL FINANCIAL REPORT
FOR THE YEARS ENDED
JUNE 30, 2017 AND JUNE 30, 2016
Bill Haslam, Governor and Chairman
A COMPONENT UNIT OF THE STATE OF TENNESSEE
Prepared by the Comptroller of the Treasury,
Office of State and Local Finance
Sandra Thompson Director, Office of State and Local Finance
and
Assistant Secretary, TSSBA
TENNESSEE STATE SCHOOL BOND AUTHORITY
COMPREHENSIVE ANNUAL FINANCIAL REPORT
FOR THE YEARS ENDED JUNE 30, 2017 AND JUNE 30, 2016
TABLE OF CONTENTS
INTRODUCTORY SECTION
Letter of Transmittal ..................................................................................................................................................... i
Organization Chart ..................................................................................................................................................... vii
Tennessee State School Bond Authority – Members and Staff ................................................................................ viii
Certificate of Achievement for Excellence in Financial Reporting ............................................................................ ix
FINANCIAL SECTION
Auditor’s Report .......................................................................................................................................................... 1
Management’s Discussion and Analysis ..................................................................................................................... 4
Basic Financial Statements
Statements of Net Position .................................................................................................................................. 15
Statements of Revenues, Expenses and Changes in Net Position ....................................................................... 16
Statements of Cash Flows ................................................................................................................................... 17
Notes to the Financial Statements ....................................................................................................................... 19
Supplementary Schedules
Supplementary Schedules of Net Position – Program Level ............................................................................... 36
Supplementary Schedules of Revenues, Expenses and Changes in Net Position – Program Level ................... 38
Supplementary Schedules of Cash Flows – Program Level ................................................................................ 40
STATISTICAL SECTION
Index to Statistical Section ........................................................................................................................................ 45
Financial Trends Information
Schedules of Revenues, Expenses, and Changes in Net Position ....................................................................... 46
Revenue Capacity Information
Outstanding Loans to Borrowers ........................................................................................................................... 48
Debt Capacity Information
Schedule of Ratios of Outstanding Debt Payable ................................................................................................ 49
Allocable Debt to Borrowers Per FTE – Higher Education Facilities Program ................................................... 50
Allocable Debt to Borrowers Per Capita – Qualified Zone Academy Bonds Program........................................ 51
Allocable Debt to Borrowers Per Capita – Qualified School Construction Bonds Program ............................... 52
College and University Funds – Schedule of Fees/Charges, Legislative Appropriations and Debt Service ...... 53
College and University Funds – Coverage of Annual Financing Charges .......................................................... 54
Debt Service Coverage - Qualified Zone Academy Bond Program ..................................................................... 55
Debt Service Coverage - Qualified School Construction Bonds Program ........................................................... 60
Demographic and Economic Information
State of Tennessee – Demographic and Economic Information ........................................................................... 69
Fall Term Full-Time Equivalent Enrollment in Public Higher Education Schools .............................................. 70
History of Average Daily Membership Grades Kindergarten through Twelve 2007-2016. .................................. 72
Acknowledgements .................................................................................................................................................... 75


INTRODUCTORY SECTION


i
December 22, 2017
The Honorable Bill Haslam, Governor and Chairman
and
Members of the Tennessee State School Bond Authority
I am pleased to submit the Comprehensive Annual Financial Report of the Tennessee State School Bond Authority (the
“Authority”), a component unit of the State of Tennessee, for the fiscal years ended June 30, 2017 and June 30, 2016.
Responsibility for both the accuracy of the data and the completeness and fairness of the presentation, including all
disclosures, rests with the Authority. All disclosures necessary to enable the reader to gain an understanding of the
Authority’s financial activities have been included.
This letter of transmittal is designed to complement Management’s Discussion and Analysis and should be read in conjunction
with it. The Authority’s Management Discussion and Analysis can be found on pages 4 - 11 of this report.
BUSINESS ENVIRONMENT
Legal Authority
The Tennessee State School Bond Authority, created in 1965, is a corporate governmental agency and instrumentality of
the State of Tennessee whose purpose is to finance capital projects for public institutions of higher education located in
Tennessee and to finance projects approved pursuant to the Qualified Zone Academy Bond Program and Qualified School
Construction Bond Program of the federal government for local education agencies. The Authority has no taxing power.
Pursuant to Section 49-3-1204, Tennessee Code Annotated (“T.C.A.”) (the “Act”), the Governor serves as Chairman and
the Comptroller of the Treasury serves as Secretary to the Authority.
Higher Education Facilities Programs. Pursuant to the General Higher Educational Facilities Bond Resolution adopted
in May 1967 (“1967 Resolution”), bonds were issued to provide funds to make loans to the institutions of higher education.
In April 1998, the Authority adopted the Higher Educational Facilities Second Program General Bond Resolution (“1998
Resolution”) with the same purpose and closed the 1967 Resolution. All higher education bonds are now issued pursuant
to the 1998 Resolution, as amended. Projects financed by the Authority must generate revenue sufficient to pay the debt
service on the bonds. The fee charged for financing a project includes both a debt service and an administrative component.
The Authority has financed a variety of projects including dormitories, athletic facilities, parking facilities and major
equipment purchases. These projects could be contrasted with capital projects for higher education needs such as classrooms
and libraries that are funded with the proceeds of the State’s general obligation bonds.
In 1997, the Authority approved a Commercial Paper Resolution that authorized the Authority to issue commercial paper.
The Credit Agreement with State Street Bank and Trust Company for the commercial paper program expired on March 20,
2014. On March 20, 2014, the Authority terminated the commercial paper program and entered into a Revolving Credit
Agreement (“RCA”) with Wells Fargo Bank, National Association, and U.S. Bank, National Association (collectively the
“Banks”). Through the RCA, the Banks have agreed to make loans to the Authority in an aggregate amount not to exceed $300
million. The loan proceeds are used to fund the construction phase of certain projects for the higher education facilities.
When a project is completed or near completion, long-term, fixed-rate debt may be issued to finance the project. The debt
issued to finance a project may be amortized over its useful life, but not to exceed 30 years. Proceeds from the issuance of
the debt will be used to repay the RCA. Certain equipment and property acquisitions are financed solely within the RCA
program. Equipment financed solely within the RCA program is deemed to have a useful life of less than ten years.

ii
Qualified Zone Academy Bond Program. In 1999, the General Assembly authorized the Authority to issue Qualified
Zone Academy Bonds (“QZAB”) pursuant to program requirements approved by the Congress of the United States in
Section 226 of the Taxpayer’s Relief Act of 1997. These bonds are a part of a federal government program in which an
investor receives a federal income tax credit in lieu of an interest payment on the bonds. These bonds are issued under the
provisions of the Authority’s Qualified Zone Academy Bonds First Program Resolution , and they are not supported by either
the 1967 Resolution or the 1998 Resolution for Higher Education Facilities. The QZAB program provides loans to local
education agencies to fund the renovation of classroom buildings and to purchase equipment to enhance learning
opportunities in connection with the establishment of special academic programs from kindergarten through secondary
school. Funding for this program is limited to the amount allocated by the federal government.
Qualified School Construction Bond Program. In 2009, the General Assembly authorized the Authority to issue Qualified
School Construction Bonds (“QSCB”) pursuant to program requirements approved by the Congress of the United States in
Section 1521 of the American Recovery and Reinvestment Act of 2009. The QSCB program is a part of a federal
government program designed to allow schools to borrow funds at minimal interest cost to the borrower. The bonds were
issued under the provision of the Authority’s Qualified School Construction Bonds General Bond Resolut ion. The bonds
are not supported by either the 1967 Resolution or the 1998 Resolution for Higher Education Facilities. The QSCB program
provides loans to local governments to fund new construction, renovation and rehabilitation of schools, as well as the
purchase of land and equipment for use in a qualified project. The Series 2009 QSCBs were issued as tax credit bonds under
which an eligible holder of a QSCB is generally allowed quarterly federal income tax credits in addition to quarterly
supplemental interest payments from the issuer during the time the bond is outstanding. These credits compensate the
bondholder for lending money to the borrower and function as partial payments of interest on the bonds. The Series 2010
QSCBs were issued as direct subsidy payment bonds under which the Authority has elected to receive direct interest subsidy
payments from the United States Treasury rather than to provide a tax credit to the bondholder. The interest subsidy payments
received by the Authority are then transferred to the borrowers as a reimbursement of the interest portion of their loan
repayments. Funding for the QSCB program is limited to the amount allocated by the federal government . The program
only received allocations for 2009 and 2010.
Responsibility of Management
Management assumes responsibility for the fair presentation of the financial statements found in this report in conformity with
accounting principles generally accepted in the United States of America (U.S. GAAP); for compliance with applicable laws,
regulations, and the provisions of contracts (including bond resolutions); and for establishing and maintaining effective internal
control over financial reporting, operations, and compliance.
Internal Control. In developing the Authority's accounting system, much consideration was given to the adequacy of internal
accounting controls. Such controls are designed to provide reasonable, but not absolute assurance regarding (1) preventing,
deterring, and detecting fraudulent activity, and (2) the reliability of financial records used in preparing financial statements.
The concept of reasonable assurance is based on the assumption that the cost of internal accounting controls should not exceed
the benefits expected to be derived from their implementation.
Independent Audit Committee. T.C.A. § 4-35-101 requires that a state governing board, council, commission, or equivalent
body that (a) has the authority to hire and terminate its employees or (b) is responsible for the preparation of financial
statements, whether included in the financial statements of other entities or free standing, shall create an audit committee. The
Authority appointed an independent audit committee on August 12, 2004.
The Authority approved an Audit Charter created by the Audit Committee on September 14, 2006. The Audit Charter defines
the responsibilities of the Audit Committee as follows:
• Overseeing the Authority’s financial reporting and related disclosures, especially when financial statements are
issued;
• Reviewing the adequacy of the management’s process for assessment of risk, including fraud risk;
• Reviewing documentation of assessment results to determine that internal controls are sufficient to mitigate the
assessed risks in the agency;
• Formally reiterating, on a regular basis, to the Authority or its management and staff, the responsibility of the
Authority or its management and staff to prevent, detect and report fraud, waste and abuse;
iii
• Serving as a facilitator of any audits or investigations of the Authority, including advising auditors and
investigators of any information the Committee may receive pertinent to audit or investigative matters;
• Promptly notifying the Comptroller of the Treasury of any indications of fraud; and
• Establishing a process by which employees, taxpayers, investors or other citizens may confidentially report
suspected illegal, improper, wasteful or fraudulent activity and ensure procedures exist for the receipt, retention,
and treatment of such complaints.
The Borrowers
Higher Education Facilities Programs. Public higher education in Tennessee is coordinated by the Tennessee Higher
Education Commission and consists of two systems: The University of Tennessee Board of Trustees (“Board of Trustees”)
governs the University of Tennessee System and the Tennessee Board of Regents (“Board of Regents”) of the State University
and Community College System of Tennessee governs the state universities, community colleges, and colleges of applied
technology. The Board of Trustees and the Board of Regents are referred to collectively as the “Boards”. The Boards are
the governing bodies for all public higher education in Tennessee.
The definition of “Institution” was amended by Chapter 174, Public Laws of 2013 to be “(i) the University of Tennessee
system, including all of its branches and divisions wherever located, and the services, programs and activities provided
therein, and the board of trustees of the University of Tennessee, in the aggregate, and (ii) the state university and
community college system, including all of its constituent institutions, wherever located (whether or not conferring
degrees), and the services, programs and activities provided therein, and the Board of Regents of the state university and
community college system, in the aggregate;”.
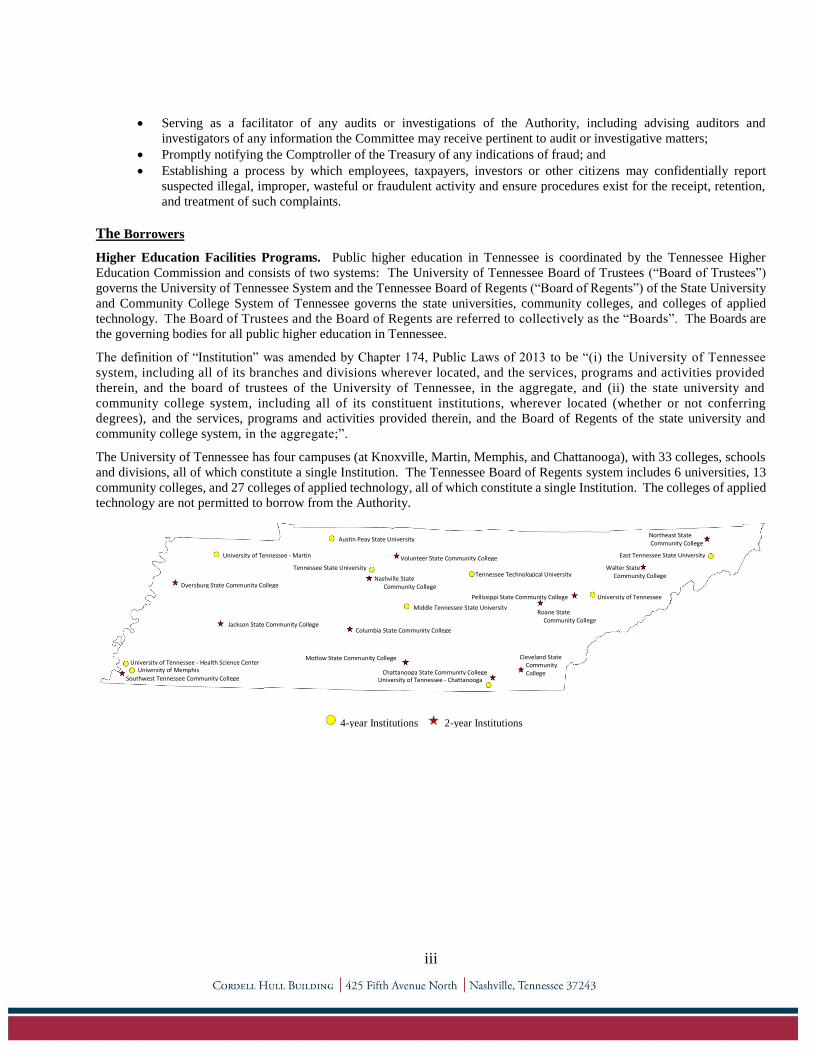
The University of Tennessee has four campuses (at Knoxville, Martin, Memphis, and Chattanooga), with 33 colleges, schools
and divisions, all of which constitute a single Institution. The Tennessee Board of Regents system includes 6 universities, 13
community colleges, and 27 colleges of applied technology, all of which constitute a single Institution. The colleges of applied
technology are not permitted to borrow from the Authority.
Northeast State Community College
East Tennessee State University University of Tennessee - Martin
Austin Peay State University
Dyersburg State Community College
Jackson State Community College
University of Tennessee - Health Science Center University of Memphis
Southwest Tennessee Community College
Volunteer State Community College
Tennessee State University
Nashville State Community College
Tennessee Technological University
Middle Tennessee State University
Columbia State Community College
Motlow State Community College
Chattanooga State Community College
June 30, 2012 June 30, 2011 Community College
University of Tennessee - Chattanooga
Walter State Community College
University of Tennessee
Roane State Community College
Pellissippi State Community College
Cleveland State Community College
June 30, 2012 June 30, 2011 College
4-year Institutions 2-year Institutions

iv
Qualified Zone Academy Bond Program. The QZAB program is a capital financing program originally authorized by the
federal government. The borrowers under the QZAB program are local government units that borrow on behalf of local
education agencies that are governed by the Tennessee Department of Education. A total of 16 local education agencies have
participated in the QZAB program. As of June 30, 2017, Humboldt City Schools, Knox County Schools, Lincoln County
Schools, Scott County Schools, and Unicoi County Schools had paid their debt in full.
Qualified School Construction Bond Program. The QSCB program is a capital financing program authorized by the federal
government. The borrowers under the QSCB program are local government units that borrow on behalf of local education
agencies that are governed by the Tennessee Department of Education. There are currently 23 local governments participating
in the QSCB program.
The Programs
Higher Education Facilities Programs. The Authority and each Board have entered into separate financing agreements under
which the Authority agrees to finance projects and the respective boards agree to make payments to the Authority. Under each
financing agreement, the relevant board covenants and agrees to establish and collect fees and charges at each institution at a
level sufficient to produce in each fiscal year no less than two times the amount required for the payment of the aggregate of
financing charges. In the event a Board fails to make timely and full payment of amounts due and payable, the Commissioner
of Finance and Administration, after notice from the Authority, shall deduct from the amounts appropriated by the General
Assembly of the State of Tennessee for the operation and maintenance of the Institution for which such project was undertaken,
the amount or amounts as may be required to make the Board current with respect to amounts due and payable.
Scott County Schools
Kingsport City Schools
Unicoi County Schools
Knox County Schools
Loudon County Schools
Oak Ridge City Schools
Montgomery County Schools
Davidson County Schools
Blount County Schools
Rhea County Schools
Hamilton County Schools
Lincoln County Schools
Lexington City Schools
Humboldt City Schools
Benton County Schools
Memphis City Schools
Dyersburg City Schools
Dyer County Schools
Shelby County Schools
*Memphis City Schools
Montgomery County Schools
Nashville-Davidson County Schools
Union County Schools
Hawkins County Schools
Kingsport City Schools Sullivan County Schools
Johnson City Schools
Hamblen County Schools
Maryville City Schools
Cleveland City Schools
*Shelby County borrowed QSCB funds from the Authority on behalf of both the Shelby County Schools and the Memphis City Schools.
Trousdale County Schools
Warren County Schools
Coffee County Schools
Maury County Schools
Knox County Schools
Sevier County Schools
Cocke County Schools
Blount County Schools
Jefferson County Schools
Lauderdale County Schools
City Schools County Schools
City Schools County Schools

v
Qualified Zone Academy Bond Program. To receive a QZAB loan, a local education agency, in cooperation with its city or
county, completed an application provided by the Tennessee Department of Education. The Department of Education
recommended to the Authority the projects deemed worthy of funding. Each local education agency and the respective city or
county entered into a loan agreement with the Authority under which the Authority agreed to finance the projects and the
respective city or county agreed to repay the loan.
Qualified School Construction Bond Program. To receive a QSCB loan, a local education agency, in cooperation with its
city or county, completed an application provided by the Authority. The Tennessee Advisory Commission on
Intergovernmental Relations (“TACIR”) recommended to the Authority the projects deemed worthy of funding. Each local
education agency and respective city or county entered into a loan agreement with the Authority under which the Authority
agreed to finance the projects and the respective city or county agreed to repay the loan.
For both the QZAB and QSCB programs, local education agencies received their funding through the city and/or county where
they are located. Debt service for these two federal programs is secured by the general obligation pledge of the borrower and
the pledge of the borrower’s unobligated state-shared taxes. In the event the city or county should fail to make timely debt
service payments, the Commissioner of Finance and Administration, after notice from the Authority, shall intercept a portion
of the state-shared taxes sufficient to cover the debt service payment. Local education agencies do not have taxing power in
Tennessee. The power to tax is vested in cities and counties.
Future Outlook
Enrollment Trends in Higher Education. Enrollment in higher education facilities surged due to the economic downturn
that began in 2008. In 2010, enrollment reached its highest level, up 15% compared to before the recession. Enrollment in
universities and community colleges increased by 5% and 10%, respectively. The Tennessee Education Lottery Scholarship
program (“TELS”) enabled more Tennesseans to attend college. In the 2016-17 academic year, the Tennessee Lottery provided
an $339 million in scholarships to nearly 128,000 students. Beginning with the 2015 Tennessee high school graduates, the
Tennessee Promise program provides for two years of tuition-free attendance at any of the state’s community colleges or
colleges of applied technology. The Tennessee Promise is a last-dollar scholarship, meaning it will cover tuition and mandatory
fees not covered by the federal Pell Grant, the HOPE scholarship (a TELS award), or the Tennessee Student Assistance Award
(a state-funded grant program). In 2016-2017 the Tennessee Promise program distributed over $25 million to nearly 14,000
students. In the Knowledge Economy, the importance of receiving training beyond high school is significant. The growing
demand for higher education will guarantee that the higher education system will sustain its long-term debt commitments well
into the future.
FINANCIAL INFORMATION
Budget. The Authority has no formally approved operating budget. However, controls are in place to assure financial
compliance for each project. All loans made and bonds issued must be approved by the Authority in public meetings. T.C.A.
§ 49-3-1201 et. seq. permits the Authority to make and collect charges from the borrowers for all administrative fees that it
determines to be reasonable. These administrative fees include but are not limited to costs relating to the issuance and payment
of debt, liquidity facilities, trustee fees, and administrative costs of staff. All such fees and charges are subject to independent
audit for reporting and compliance purposes.
Financial Statements. The financial statements included in this report present information on the financial condition of the
Authority and whether resources were adequate to cover the costs of providing services during the reporting period. A
discussion of the financial statements is included on pages 9 - 10 in the Management’s Discussion and Analysis section of this
Comprehensive Annual Financial Report.
Relevant Financial Policies. The Authority adopted a Debt Management Policy (the “Policy”) on November 14, 2011. The
Policy is reviewed annually. The Policy provides written guidance about the amount and type of debt issued as well as the
method used for issuing the debt. The Policy governs the issuance of revolving credit facility loans as short-term debt as well
the issuance of long-term debt. During fiscal year ending June 30, 2017, the Authority borrowed $117,000,000 from the
revolving credit facility. During fiscal year ending June 30, 2016, the Authority borrowed $35,000,000 from the revolving
credit facility, issued the 2014 Series A and B bonds in the amount of $344,650,000, and issued the 2015 Series A and B bonds
in the amount of $464,165,000.

vii
viii
TENNESSEE STATE SCHOOL BOND AUTHORITY
MEMBERS
Bill Haslam, Governor, Chairman
Justin P. Wilson, Comptroller of the Treasury, Secretary
Tre Hargett, Secretary of State
David H. Lillard, State Treasurer
Larry B. Martin, Commissioner of Finance and Administration
Dr. Joseph DiPietro, President of the University of Tennessee
Dr. Flora Tydings, Chancellor of the Tennessee Board of Regents
STAFF
Sandra Thompson, Director of the Office of State and Local Finance, Assistant Secretary
Ann V. Butterworth, Assistant to Comptroller for Public Finance, Assistant Secretary
ix

x

FINANCIAL SECTION


4
Management’s Discussion and Analysis
As management of the Tennessee State School Bond Authority (the Authority), we offer readers of the Authority’s financial
statements this narrative overview and analysis of the financial activities as presented in the financial statements and notes to
the financial statements of the Authority for the fiscal year ended June 30, 2017. These activities are compared to the results
of the fiscal years ended June 30, 2016, and June 30, 2015. We encourage readers to consider the information presented here
in conjunction with additional information that we have furnished in our letter of transmittal along with the Independent
Auditor’s Report, the audited financial statements and accompanying notes of this report.
Program Activity Highlights
The Authority’s purpose is to provide loans to the state’s higher education institutions by issuing bonds and notes of the
Authority and to local governments on behalf of local education agencies (LEAs) through Qualified Zone Academy Bonds
(QZABs) and Qualified School Construction Bonds (QSCBs). The tables below summarize this business activity.
The financial statements and the analysis provided in the remainder of this report reflect the financial results of this activity.
2017 2016 2015
Number of higher education facilities with outstanding loans 19 19 19
Balance of outstanding loans 1,685,658,324$ 1,595,683,475$ 1,480,594,673$
Total number of projects with outstanding loans 225 221 225
Number of projects approved in fiscal year 13 8 11
Dollar amount of loans approved in fiscal year 159,828,000$ 196,829,000$ 230,579,240$
Dollar amount of loans approved in fiscal year - unspent 129,714,086$ 193,267,544$ 224,941,981$
Dollar amount of loans financed in fiscal year 135,382,974$ 243,257,387$ 83,154,335$
Balance of outstanding debt 1,768,511,257$ 1,739,673,979$ 1,784,191,852$
Bonds issued in fiscal year -$ -$ 808,815,000$
Revolving credit facility loans issued in fiscal year 117,000,000$ 35,000,000$ 50,000,000$
Higher Education Facilities Programs
2017 2016 2015
Number of LEAs with outstanding loans 11 11 12
Total number of outstanding loans 13 13 16
Balance of outstanding loans 7,505,974$ 9,975,299$ 12,984,352$
Balance held in Sinking Fund 25,014,347$ 22,614,701$ 30,834,174$
Balance of outstanding debt 32,590,000$ 32,590,000$ 43,920,000$
Qualified Zone Academy Bond Program
2017 2016 2015
Number of LEAs with outstanding loans 23 23 23
Total number of outstanding loans 28 28 28
Balance of outstanding loans 235,032,069$ 259,596,908$ 284,021,020$
Balance held in Sinking Fund 157,702,303$ 140,878,305$ 106,050,986$
Balance of outstanding debt 389,440,000$ 389,440,000$ 389,440,000$
Qualified School Construction Bond Program

5
Debt Administration
Pursuant to Section 49-3-1201 et seq., Tennessee Code Annotated, the General Assembly of the state created the Tennessee
State School Bond Authority to issue revenue bonds and notes to fund capital projects for the higher education institutions
including both four-year institutions and two-year community colleges. Such loans are payable from user fees or savings
generated from the projects in the case of energy conservation projects. The statute was amended in 1999 to authorize the
Authority to issue QZABs and again in 2009 to authorize the Authority to issue QSCBs on behalf of LEAs throughout the
State. For more specific financial information on long-term debt activity, see Note 5, Debt Payable, on pages 26 - 30 in the
Notes to the Financial Statements.
The State is not liable on the bonds, and the bonds are not a debt of the State of Tennessee.
Higher Education Facilities Programs. When a higher education facility applies for project funding through the Authority,
an analysis of the financial feasibility of each loan application is undertaken by comparing the projected debt service to the
pledged revenue before it is approved by the Authority. Once approved by the Authority, the project will be included in the
Financing Agreement between the Authority and the respective higher education system (the Board of Trustees of the
University of Tennessee and the Tennessee Board of Regents of the State University and Community College System of the
State of Tennessee, referred to collectively as the Boards). The Boards covenant and agree in the Financing Agreements to
establish and collect fees and charges at each institution at a level sufficient to produce in each fiscal year no less than two
times the amount required for the payment of total debt service. Fees and charges include all revenues, fees, rental and other
charges received by or on behalf of an institution which are available to pay debt service. In addition, the Boards agree in the
Financing Agreements that the Commissioner of Finance and Administration, after notice from the Authority that a Board has
failed to pay its annual financing charges or administrative fees, shall deduct from the institution’s appropriations the amount
required to make it current with respect to the unpaid annual financing charges and administrative fees.
On March 20, 2014, all outstanding commercial paper was redeemed and the commercial paper program was terminated when
the Authority entered into a Revolving Credit Agreement (RCA) with Wells Fargo Bank, National Association, and U.S. Bank,
National Association. As of March 20, 2014, and thereafter, projects are funded through the RCA program during its
construction phase. For projects in the construction phase that are completed or near completion, the Authority may fix the
interest rate for the term of the projects by issuing long-term debt. The range of RCA interest rates are shown below for the
fiscal year ended June 30, 2017 as compared to fiscal years 2016 and 2015.
For the fiscal year ended June 30, 2017, interest rates on the higher education facilities long-term, fixed-rate, tax-exempt bonds
ranged from a low of 2.50% to a high of 5.20%, and the interest rates on the higher education facilities long-term fixed-rate
federally taxable bonds ranged from a low of 1.02% to a high of 4.207%. By pooling the financing of the capital needs for all
public higher education facilities, management believes that economic efficiency is achieved through a single large borrowing
administered by one agency. The creditworthiness of both large and small institutions is blended into one credit resulting in a
lower cost of borrowing and providing a more equitable cost to students and other users who repay the debt through various
user fees and charges and student debt service fees.
Higher Education Facilities Programs Debt Ratings. As of the fiscal year ended June 30, 2017, the Authority’s higher
education facilities program is rated AA+, and AA+ by Fitch and S&P Global Ratings, respectively. Moody’s Investors Service
has assigned the Authority’s bonds an enhanced rating of Aa1 and a programmatic rating of Aa1. As of the fiscal year ended
June 30, 2016, the Authority’s higher education facilities program was rated AA+, and AA by Fitch and S&P Global Ratings,
respectively. Moody’s Investors Service had assigned the Authority’s bonds an enhanced rating of Aa1 and a programmatic
rating of Aa1. On July 27, 2016 S&P Global Ratings upgraded the Authority’s higher education facilities program rating to
AA+ from AA.
Fiscal Year Low High Low High
2017 0.697% 1.120% 0.967% 1.581%
2016 0.501% 0.690% 0.687% 0.957%
2015 0.476% 0.499% 0.652% 0.684%
Revolving Credit Facility Interest Rates Ranges
Tax-Exempt
Federally
Taxable
Higher Education Facilities Programs

6
7
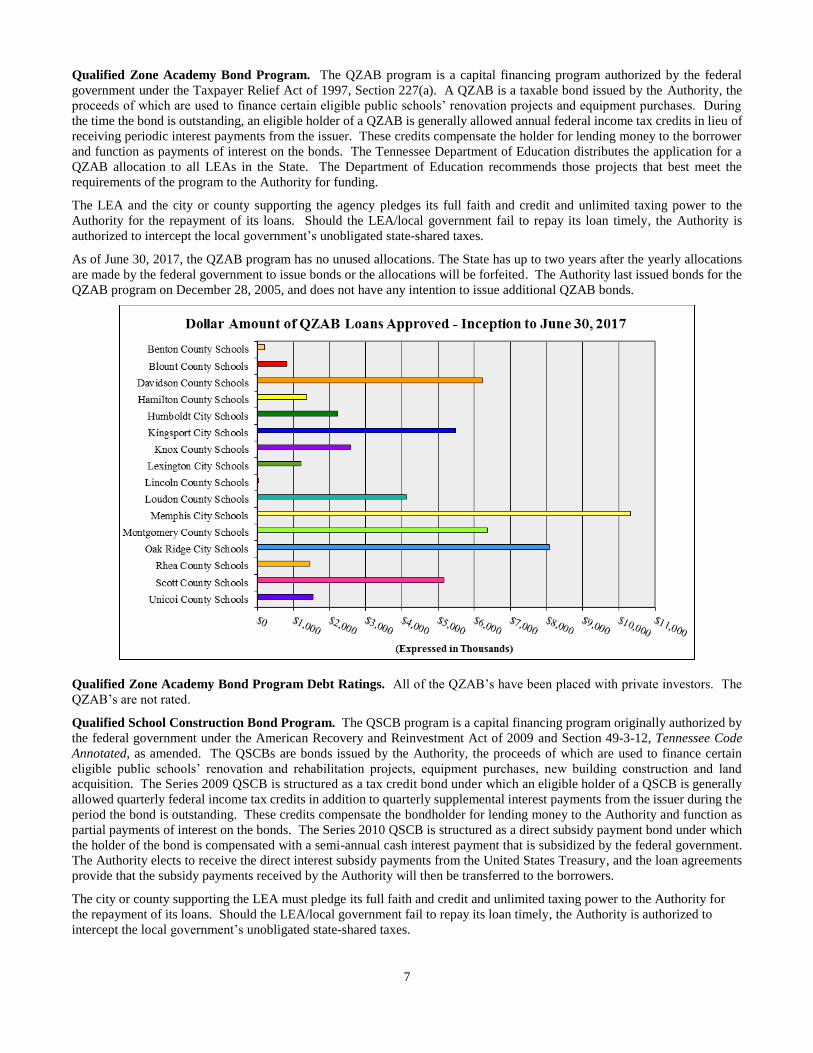
Qualified Zone Academy Bond Program. The QZAB program is a capital financing program authorized by the federal
government under the Taxpayer Relief Act of 1997, Section 227(a). A QZAB is a taxable bond issued by the Authority, the
proceeds of which are used to finance certain eligible public schools’ renovation projects and equipment purchases. During
the time the bond is outstanding, an eligible holder of a QZAB is generally allowed annual federal income tax credits in lieu of
receiving periodic interest payments from the issuer. These credits compensate the holder for lending money to the borrower
and function as payments of interest on the bonds. The Tennessee Department of Education distributes the application for a
QZAB allocation to all LEAs in the State. The Department of Education recommends those projects that best meet the
requirements of the program to the Authority for funding.
The LEA and the city or county supporting the agency pledges its full faith and credit and unlimited taxing power to the
Authority for the repayment of its loans. Should the LEA/local government fail to repay its loan timely, the Authority is
authorized to intercept the local government’s unobligated state-shared taxes.
As of June 30, 2017, the QZAB program has no unused allocations. The State has up to two years after the yearly allocations
are made by the federal government to issue bonds or the allocations will be forfeited. The Authority last issued bonds for the
QZAB program on December 28, 2005, and does not have any intention to issue additional QZAB bonds.
Qualified Zone Academy Bond Program Debt Ratings. All of the QZAB’s have been placed with private investors. The
QZAB’s are not rated.
Qualified School Construction Bond Program. The QSCB program is a capital financing program originally authorized by
the federal government under the American Recovery and Reinvestment Act of 2009 and Section 49-3-12, Tennessee Code
Annotated, as amended. The QSCBs are bonds issued by the Authority, the proceeds of which are used to finance certain
eligible public schools’ renovation and rehabilitation projects, equipment purchases, new building construction and land
acquisition. The Series 2009 QSCB is structured as a tax credit bond under which an eligible holder of a QSCB is generally
allowed quarterly federal income tax credits in addition to quarterly supplemental interest payments from the issuer during the
period the bond is outstanding. These credits compensate the bondholder for lending money to the Authority and function as
partial payments of interest on the bonds. The Series 2010 QSCB is structured as a direct subsidy payment bond under which
the holder of the bond is compensated with a semi-annual cash interest payment that is subsidized by the federal government.
The Authority elects to receive the direct interest subsidy payments from the United States Treasury, and the loan agreements
provide that the subsidy payments received by the Authority will then be transferred to the borrowers.
The city or county supporting the LEA must pledge its full faith and credit and unlimited taxing power to the Authority for
the repayment of its loans. Should the LEA/local government fail to repay its loan timely, the Authority is authorized to
intercept the local government’s unobligated state-shared taxes.

8
Qualified School Construction Bonds Program Debt Ratings. As of the fiscal year ended June 30, 2017, the Authority’s
QSCB program is rated Aa2, AA+, and AA by Moody’s Investors Service, Inc., S&P Global Ratings, and Fitch Ratings,
respectively.
Overview of the Financial Statements
The Authority is a discretely presented component unit of the State of Tennessee and uses proprietary fund accounting. The
financial statements are prepared in accordance with accounting principles generally accepted in the United States of America
using the accrual basis of accounting and the flow of economic resources measurement focus. This basis recognizes revenues
when earned and expenses at the time liabilities are incurred. Using the economic resources measurement focus, a reader is
presented information that allows him/her to determine the transactions and events that have increased or decreased the total
economic resources for the period.
This discussion and analysis is intended to serve as an introduction to the Authority’s basic financial statements. The
Authority’s basic financial statements are comprised of two components: 1) the financial statements and 2) the notes to the
financial statements. The financial statements consist of the Statement of Net Position; Statement of Revenues, Expenses and
Changes in Net Position; and the Statement of Cash Flows.
The Statements of Net Position on page 15 present the Authority’s financial position at June 30, 2017, and June 30, 2016. The
Statements of Revenues, Expenses and Changes in Net Position on page 16 portray the results of operations and the change in
net position for the years presented. The Statements of Cash Flows on pages 17 - 18 summarize the sources and uses of cash
for the fiscal years presented. These statements are accompanied by notes to the financial statements that provide information
that is essential to the reader’s understanding of the financial statements. The Authority’s basic financial statements are
followed by supplementary information containing the financial statement information at the program level.
Financial Analysis of the Authority
Standard indicators of financial success are not applicable to the Authority. The financial goals of the Authority are to provide
timely access to the capital markets for public higher educational institutions and local governments on behalf of LEAs at the
lowest possible cost, to repay debt timely and to achieve the highest possible rating for its debt. During the fiscal year ended
June 30, 2017, the Authority did not issue bonds. At no time did the Authority deny approval of a loan application due to its
inability to access the capital market. For long-term debt, the Authority made all debt service payments timely without having

9
to withdraw funds from the debt service reserve fund or intercept the state appropriations for the higher education institutions.
For short-term debt, No Event of Default, as defined in the RCA, has occurred. The Authority maintained both its long and
short-term credit ratings with all rating agencies.
At June 30, 2017, current assets include $292,461 of unexpended proceeds from prior debt issued that will fund approved
higher education loans as compared to $53,092,376 at June 30, 2016, and $224,121,627 at June 30, 2015. The Authority did
not issue any bonds during the fiscal year ended June 30, 2017 or the fiscal year ended June 30, 2016. During the fiscal year
ended June 30, 2015, the Authority issued $808,815,000 in Higher Education Facilities Second Program bonds which were
used to redeem $141,896,739 of the Authority’s revolving credit facility and refund $468,010,000 of the Authority’s
outstanding long-term debt with the balance of the bond proceeds to be used to fund various project costs and costs of issuance.
Principal was repaid on the higher education outstanding long-term bonds in the amounts of $66,595,000 in 2017; $60,385,000
in 2016; $56,435,000 in 2015. Deposits to the Sinking Fund for the QZABs were made in the amounts of $2,406,957 in 2017;
$3,009,053 in 2016; $3,025,204 in 2015. No QZAB Bonds were retired in fiscal year 2017 or fiscal year 2015. QZAB Series
2001 Bonds in the amount of $11,330,000 were retired during the fiscal year 2016. Deposits to the Sinking Fund for the QSCBs
were made in the amounts of $26,543,123 in 2017; $22,772,381 in 2016; $22,434,828 in 2015. No QSCB bonds were retired
during the fiscal years 2017, 2016, or 2015.
Net position is available to fund ongoing operations and other expenses necessary to meet the goals of the Authority. Assets
and liabilities increase and decrease together in correlation to the issuance and repayment of debt and the resulting loans. The
change in net position from fiscal year ending June 30, 2017, to fiscal year June 30, 2016, was due primarily to the unrealized
loss on the QSCB investments. The change in net position from fiscal year ending June 30, 2016, to fiscal year ending June 30,
2015, was mostly due to the unrealized gain on the QSCB investments.
2017 2016 2015
Current assets 175,358$ 195,321$ 403,912$
Noncurrent assets 2,043,307 1,962,600 1,861,495
Total assets 2,218,665 2,157,921 2,265,407
Deferred outflows of resources 39,973 42,771 45,569
Current liabilities 124,480 85,808 144,427
Noncurrent liabilities 2,122,290 2,095,123 2,157,180
Total liabilites 2,246,770 2,180,931 2,301,607
Deferred inflows of resources 756 1,791 832
Net position (unrestricted) 11,112$ 17,970$ 8,537$
Note: The Authority owns no capital assets.
Statements of Net Position Summary
(in thousands of dollars)

10
The Authority’s operating revenues include revenue from loans in the form of administrative fees, interest on loans, and income
earned on investments. Operating expenses include interest expense on outstanding short-term and long-term debt and
administrative expenses. The change in operating revenues and expenses for fiscal year ending June 30, 2017, can be attributed
to the QSCB program. The QSCB had a decrease in value in the Sinking Fund which resulted in a significant decrease in
unrealized investment earnings and a decrease in net position. The decrease was partially mitigated by lower bond interest
expense in the higher education program and subsidy to borrowers.
The change in operating revenues and expenses for fiscal year ending June 30, 2016, can be attributed to the QSCB program
and the higher education program. The QSCB program had an increase in value in the Sinking Fund thus allowing for an
increase in unrealized investment earnings. The increase in the unrealized investment earnings was the major contributor to
the decrease in operating loss and increase in the change in net position. The higher education program had an increase in
revenue from loans due to the issuance of the 2014 and 2015 bonds and increased interest rates on the short-term financing.
For the fiscal years ended June 30, 2017, June 30, 2016, and June 30, 2015, the Authority elected to return the investment
income that it earned on funds held by the trustee and interest earned on unspent bond proceeds to the borrowers in the higher
education facilities program to be applied toward amounts due on debt service from the borrowers.
Pursuant to the bond resolution for the QZABs, Sinking Fund payments are invested in the State Pooled Investment Fund
(“SPIF”). SPIF rates for fiscal year ended June 30, 2017, ranged from 0.35% to 0.86%. Investment earnings related to the
QZAB program are held by the Authority for the benefit of the LEAs participating in the program and are applied as a subsidy
toward each LEA’s individual debt service Sinking Fund payment on an annual basis. Pursuant to the supplemental bond
resolutions for the 2004 and 2005 Series QZABs, Sinking Fund payments are invested in Forward Delivery Agreements which
guarantee a fixed rate of interest of 3.00% and 3.64%, respectively, on investments. The investments are held by the State
Treasurer in the Authority’s name.
Investment earnings related to the QSCB program are held by the Authority for the benefit of the local governments
participating in the program and are applied as a subsidy on a monthly basis toward the amounts due on each LEA’s individual
debt service principal and interest payments.
Future Financing Activities
Higher Education Facilities Programs. As Tennessee continues into an economic era that emphasizes the human capital
potential of its citizens rather than physical capital and natural resources, the higher education system must be positioned to
2017 2016 2015
Operating Revenues
Revenue from loans 73,984$ 75,210$ 66,092$
Investment earnings (6,471) 15,146 5,697
Total operating revenues 67,513 90,356 71,789
Operating Expenses
Interest expense 72,960 75,579 64,623
Subsidy to borrowers 10,282 13,939 13,341
Other expenses 719 994 2,473
Total operating expenses 83,961 90,512 80,437
Operating loss (16,448) (156) (8,648)
Nonoperating Revenues
Federal subsidy on bonds 9,590 9,589 9,549
Total nonoperating revenues 9,590 9,589 9,549
Increase (decrease) in net position (6,858)$ 9,433$ 901$
Net Position
Net position, July 1 17,970 8,537 7,636
Net position, June 30 11,112$ 17,970$ 8,537$
Statements of Revenues, Expenses, and
Changes in Net Position Summary
(in thousands of dollars)
11
serve the broader-based need for access to post-secondary education and to produce degree and certificate holding work-ready
citizens. A host of policy and environmental factors influence the demands for access and completion, and the means through
which this demand will be met.
These factors include:
▪ Economic conditions in 2008 led to an enrollment bulge in Tennessee colleges and universities that rippled through
2010. University enrollment increased eight percent from 2008 to 2011, while community college enrollment
increased 20 percent in the same time period, the largest increase in more than two decades. These enrollment
increases began to wane soon after, however overall enrollment still tops pre-Great Recession levels. Compared to
2007, enrollments are up 4 percent at universities and 15 percent at community colleges.
▪ The demographic composition of the state is changing dramatically and the higher education system must position
itself to serve the needs of an increasingly diverse population.
▪ The advent of the Tennessee Education Lottery Scholarship program allowed more Tennesseans to attend college. In
2016-17, the Tennessee Lottery provided an estimated $339 million in scholarships to more than 128,000 students.
In January 2010, the Tennessee General Assembly enacted the Complete College Tennessee Act (CCTA), a comprehensive
reform agenda that seeks to transform public higher education through changes in academic, fiscal and administrative policies
at the state and institutional level. The primary goal of these reforms is for more Tennesseans to be better educated and trained.
At the heart of the CCTA is a new Public Agenda for higher education, which establishes the direct link between the state’s
economic development and its educational system. The overarching goal of the Public agenda is to have Tennessee meet the
projected national average in educational attainment by 2025. The primary state policy levers for addressing the state’s
educational needs include (1) a new funding formula which incorporates outcomes in lieu of enrollment; (2) a new Performance
Funding program which focuses on quality assurance; and (3) the establishment of institutional mission statements or profiles
which distinguish each institution by degree level, program offerings and student characteristics. Other major components of
the reform agenda include more efficient student transfer, a more integrated community college system, reforms to the delivery
of student remediation programs, and an enhanced research focus for the University of Tennessee Knoxville and the University
of Memphis, the state’s two public Carnegie Research institutions.
With the creation of CCTA, the importance of receiving training beyond high school became more significant. In 2008, 24.5%
of Tennessee’s working-age adults held a college degree, compared to the national average of 29.5%. To reach the national
average educational attainment levels of 2008, Tennessee would have needed an additional 170,000 citizens with a bachelor’s
degree or higher, more than double the annual degree production of the state’s public and private institutions at that time.
Furthermore, the percentage of adults in the state with an associate’s degree or some college in 2008 was 31.3%, in comparison
with the national average of 37.9%. To reach the 2008 national average, Tennessee would have needed an additional 220,000
citizens with an associate’s degree or higher. As of 2015, the percentage of adults in the state with a bachelor’s degree or
higher was 27.3 percent compared to the national rate of 32 percent. Those with an associate’s degree or higher increased to
34.8 percent while the national rate was 40.9 percent.
While Tennessee continues to trail the national rate, the gap has narrowed for adults with an associate’s or bachelor’s degree.
The increased enrollment during the economic downturn years and demand for advanced education and training put stress on
the capital facilities at all campuses. As the State continues to promote educational attainment to its citizens, we anticipate an
increased need for funding of various facilities through the Authority.
Qualified Zone Academy Bonds and Qualified School Construction Bonds Programs. The issuance of bonds within the
QZAB and QSCB programs is limited to the amounts allocated by the federal government. At this time, the Authority does
not anticipate further issuance of debt for the QZAB program due to economic and financial conditions and constraints. The
QSCB only received allocations for 2009 and 2010.
Contacting the Authority’s Management Team
This discussion and analysis is designed to provide our citizens, education agencies, investors and creditors with a general
overview of the Authority’s finances and to demonstrate its accountability for the moneys it receives. If you have questions
about this report or need additional financial information, contact the Director of the Office of State and Local Finance, State
of Tennessee, Cordell Hull Building, 425 Fifth Avenue North, Nashville, Tennessee 37243-3400, visit our website at
www.comptroller.tn.gov/TSSBA/, or call (615) 747-5369.

12
This Page Intentionally Left Blank

BASIC FINANCIAL STATEMENTS
13

14
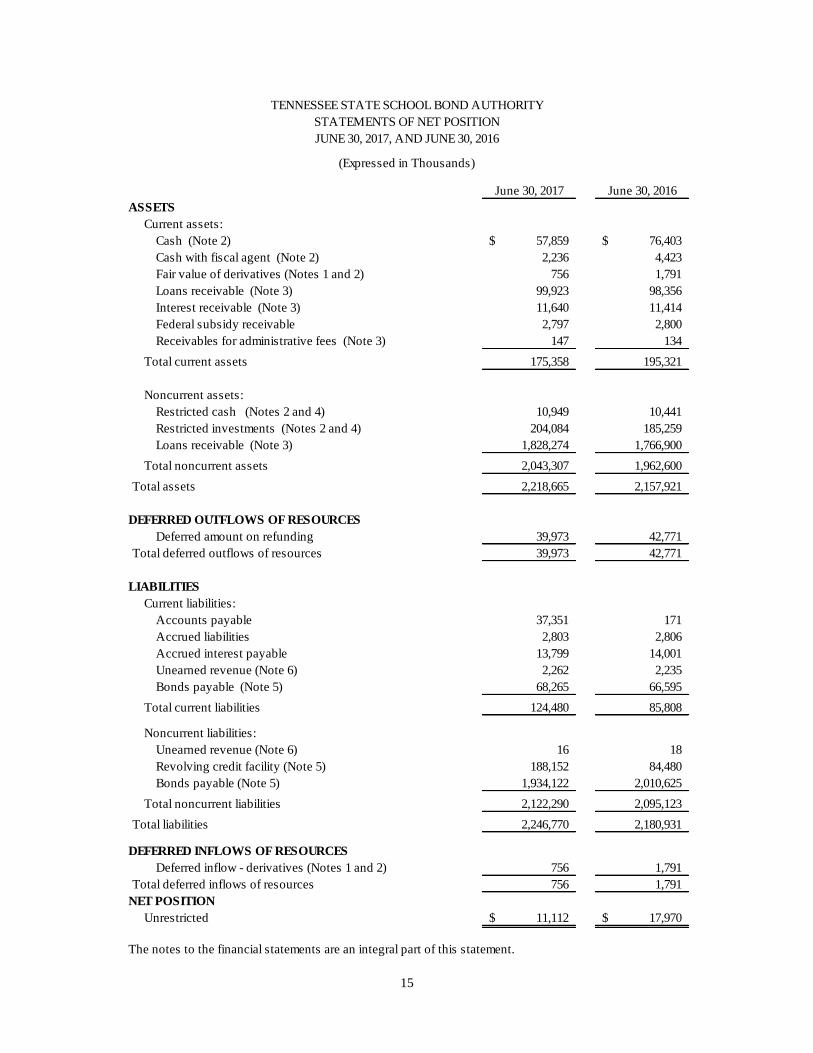
15
June 30, 2017 June 30, 2016
ASSETS
Current assets:
Cash (Note 2) 57,859$ 76,403$
Cash with fiscal agent (Note 2) 2,236 4,423
Fair value of derivatives (Notes 1 and 2) 756 1,791
Loans receivable (Note 3) 99,923 98,356
Interest receivable (Note 3) 11,640 11,414
Federal subsidy receivable 2,797 2,800
Receivables for administrative fees (Note 3) 147 134
Total current assets 175,358 195,321
Noncurrent assets:
Restricted cash (Notes 2 and 4) 10,949 10,441
Restricted investments (Notes 2 and 4) 204,084 185,259
Loans receivable (Note 3) 1,828,274 1,766,900
Total noncurrent assets 2,043,307 1,962,600
Total assets 2,218,665 2,157,921
DEFERRED OUTFLOWS OF RESOURCES
Deferred amount on refunding 39,973 42,771
Total deferred outflows of resources 39,973 42,771
LIABILITIES
Current liabilities:
Accounts payable 37,351 171
Accrued liabilities 2,803 2,806
Accrued interest payable 13,799 14,001
Unearned revenue (Note 6) 2,262 2,235
Bonds payable (Note 5) 68,265 66,595
Total current liabilities 124,480 85,808
Noncurrent liabilities:
Unearned revenue (Note 6) 16 18
Revolving credit facility (Note 5) 188,152 84,480
Bonds payable (Note 5) 1,934,122 2,010,625
Total noncurrent liabilities 2,122,290 2,095,123
Total liabilities 2,246,770 2,180,931
DEFERRED INFLOWS OF RESOURCES
Deferred inflow - derivatives (Notes 1 and 2) 756 1,791
Total deferred inflows of resources 756 1,791
NET POSITION
Unrestricted 11,112$ 17,970$
The notes to the financial statements are an integral part of this statement.
TENNESSEE STATE SCHOOL BOND AUTHORITY
STATEMENTS OF NET POSITION
JUNE 30, 2017, AND JUNE 30, 2016
(Expressed in Thousands)
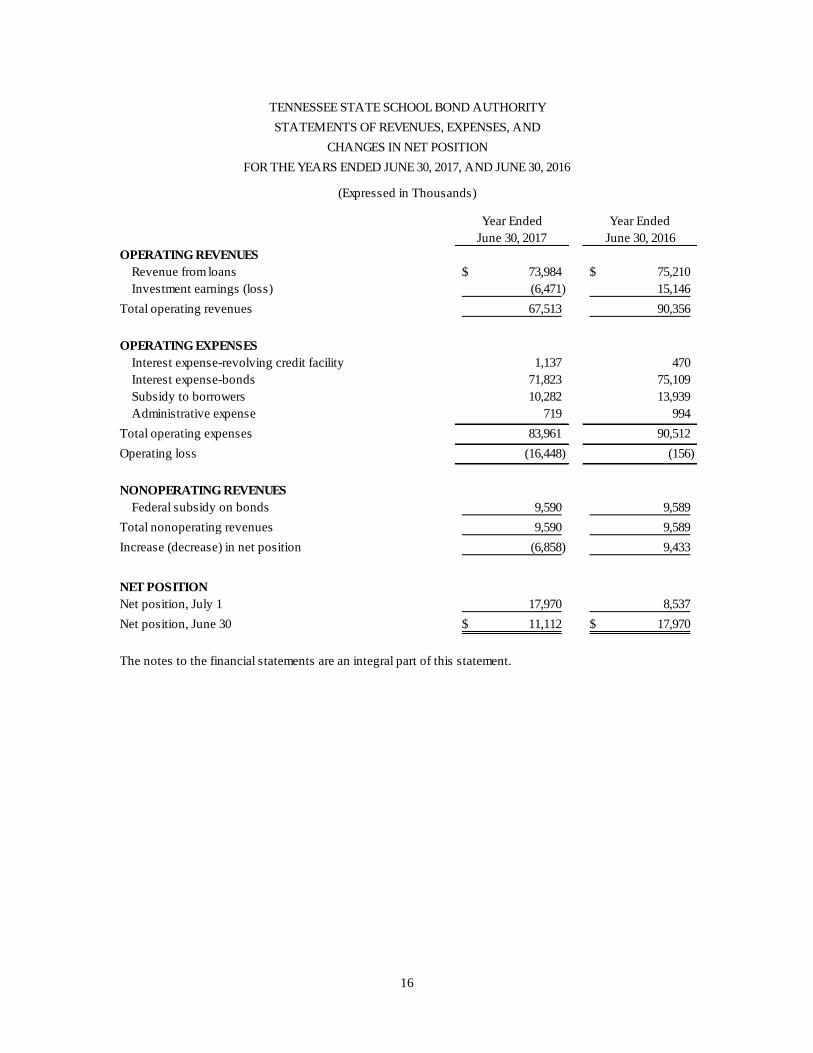
16
Year Ended Year Ended
June 30, 2017 June 30, 2016
OPERATING REVENUES
Revenue from loans 73,984$ 75,210$
Investment earnings (loss) (6,471) 15,146
Total operating revenues 67,513 90,356
OPERATING EXPENSES
Interest expense-revolving credit facility 1,137 470
Interest expense-bonds 71,823 75,109
Subsidy to borrowers 10,282 13,939
Administrative expense 719 994
Total operating expenses 83,961 90,512
Operating loss (16,448) (156)
NONOPERATING REVENUES
Federal subsidy on bonds 9,590 9,589
Total nonoperating revenues 9,590 9,589
Increase (decrease) in net position (6,858) 9,433
NET POSITION
Net position, July 1 17,970 8,537
Net position, June 30 11,112$ 17,970$
The notes to the financial statements are an integral part of this statement.
(Expressed in Thousands)
TENNESSEE STATE SCHOOL BOND AUTHORITY
FOR THE YEARS ENDED JUNE 30, 2017, AND JUNE 30, 2016
CHANGES IN NET POSITION
STATEMENTS OF REVENUES, EXPENSES, AND

17
Year Ended Year Ended
June 30, 2017 June 30, 2016
CASH FLOWS FROM OPERATING ACTIVITIES
Receipts from borrowers for administrative fees 809$ 825$
Payment to suppliers (832) (890)
Net cash used in operating activities (23) (65)
CASH FLOWS FROM NONCAPITAL FINANCING
ACTIVITIES
Proceeds from sale of bonds - -
Proceeds from sale of refunding bonds - -
Proceeds from the sale of revolving credit facility 117,000 35,000
Bond interest subsidy from federal government 9,594 9,574
Bond issuance costs paid - (125)
Refunding bond proceeds placed in escrow - -
Debt Service Reserve Fund released in escrow - -
Principal paid - bonds and revolving credit facility (79,923) (83,917)
Interest paid - bonds and revolving credit facililty (78,649) (79,908)
Subsidy to borrowers (9,594) (9,574)
Net cash used in noncapital financing activities (41,572) (128,950)
CASH FLOWS FROM INVESTING ACTIVITIES
Purchases of investments (92,675) (82,963)
Proceeds from sales and maturities of investments 64,472 63,697
Interest received on investments 3,448 3,275
Loans issued (135,383) (243,257)
Collections of loan principal 105,862 95,681
Interest received on loans 75,648 65,180
Net cash provided by (used in) investing activities 21,372 (98,387)
Net decrease in cash (20,223) (227,402)
Cash, July 1 91,267 318,669
Cash, June 30 71,044$ 91,267$
Reconciliation of cash to the Statement of Net Position:
Cash 57,859$ 76,403$
Cash with fiscal agent 2,236 4,423
Restricted cash 10,949 10,441
Cash, June 30 71,044$ 91,267$
FOR THE YEARS ENDED JUNE 30, 2017, AND JUNE 30, 2016
STATEMENTS OF CASH FLOWS
TENNESSEE STATE SCHOOL BOND AUTHORITY
(Expressed in Thousands)

18
Year Ended Year Ended
June 30, 2017 June 30, 2016
Reconciliation of operating loss to net
cash used in operating activities:
Operating loss (16,448)$ (156)$
Adjustments to reconcile operating loss to net cash
used in operating activities:
Investment earnings (loss) 6,471 (15,147)
Interest expense 72,959 75,579
Subsidy to borrowers 10,282 13,939
Bond issuance costs - 125
Interest income from loans (73,162) (74,370)
Changes in assets and liabilities:
(Increase) decrease in receivables for administrative fees (11) (16)
Increase (decrease) in payables for administrative fees (112) (20)
Increase (decrease) in unearned revenue (2) 1
Total adjustments 16,425 91
Net cash used in operating activities (23)$ (65)$
Noncash investing activities:
Increase in fair value of investments 3,128$ 13,481$
The notes to the financial statements are an integral part of this statement.
FOR THE YEARS ENDED JUNE 30, 2017, AND JUNE 30, 2016
STATEMENTS OF CASH FLOWS
TENNESSEE STATE SCHOOL BOND AUTHORITY
(Expressed in Thousands)
Tennessee State School Bond Authority
Notes to the Financial Statements
June 30, 2017, and June 30, 2016
19
NOTE 1. SUMMARY OF SIGNIFICANT ACCOUNTING POLICIES
Reporting Entity
The Tennessee State School Bond Authority (the Authority) was created to provide a mechanism for
financing capital projects for the State of Tennessee’s higher education institutions. During 1999, the
General Assembly empowered the Authority to issue Qualified Zone Academy Bonds (QZABs) for local
governments to borrow for financing improvement projects on behalf of local education agencies
pursuant to the federal program authorized in the Taxpayer Relief Act of 1997. In addition, under the
American Recovery and Reinvestment Act of 2009, the Authority was authorized to issue Qualified
School Construction Bonds (QSCBs) for local governments to borrow on behalf of local education
agencies at nominal or zero percent interest for financing renovation and rehabilitation projects,
equipment purchases, new building construction and land acquisition.
The Authority is a component unit of the State of Tennessee and a separate legal entity. In accordance
with the Governmental Accounting Standards Board’s (GASB) Statement No. 14 (as amended), The
Financial Reporting Entity, the Authority is discretely presented in the Tennessee Comprehensive
Annual Financial Report because a majority of the Authority’s board consists of state officials which
include the Governor, the State Treasurer, the Secretary of State, the Commissioner of Finance and
Administration, the Comptroller of the Treasury, the Chancellor of the Tennessee Board of Regents, and
the President of the University of Tennessee. The Governor serves as chairman, and the Comptroller of
the Treasury serves as secretary. The Director of the Office of State and Local Finance serves as the
assistant secretary; the office provides administrative and financial services to the Authority. Therefore,
the State has the ability to affect the day-to-day operations of the Authority.
Basis of Presentation
The accompanying financial statements have been prepared in accordance with accounting principles
generally accepted in the United States of America as prescribed by the Governmental Accounting
Standards Board.
Measurement Focus and Basis of Accounting
The accompanying financial statements have been prepared using the accrual basis of accounting and
the flow of economic resources measurement focus. Under this basis, revenues are recorded when
earned and expenses are recorded at the time liabilities are incurred, regardless of the timing of related
cash flows.
The Authority distinguishes operating revenues and expenses from nonoperating items. Operating
revenues and expenses generally result from providing services and producing and delivering services
in connection with principal ongoing operations. The Authority’s principal ongoing operation is to
provide loans for constructing capital projects, renovating and rehabilitating facilities, and acquiring land
and equipment to higher educational facilities and to local government units pursuant to the criteria set
by the federal government for the QZAB and QSCB programs. Therefore, the Authority also recognizes
income on investments as operating revenue. The Authority’s operating expenses include interest paid
on borrowings, subsidies to borrowers, bond issuance costs, arbitrage, and administrative expenses. Any
revenues and expenses not meeting this definition would be reported as nonoperating revenues and
expenses.
Tennessee State School Bond Authority
Notes to the Financial Statements (Cont.)
June 30, 2017, and June 30, 2016
20
Investments
Investments for the Higher Education, QZAB, and QSCB Programs are stated at fair value.
Amortized Amounts
A. Bond Discounts, Premiums, and Deferred Amount on Refundings. The Authority amortizes bond
discounts and premiums using the straight-line method over the life of the bonds. The deferred amount
on refundings is amortized using the straight-line method over the remaining life of the old debt or the
life of the new debt, whichever is shorter.
Amortization of bond discount, premium, and deferred amount on refundings is reported with bond
interest expense in the financial statements.
B. Unearned Revenue. The Authority requires the QSCB borrowers to prepay bondholder interest to the
Debt Service Fund as outlined in the loan agreements. The interest of the Debt Service Fund is credited
back to the borrower as bondholder interest payments are made. The prepaid interest is reported on the
statement of net position as unearned revenue and is not amortized.
NOTE 2. DEPOSITS AND INVESTMENTS
Moneys pertaining to the Higher Education Second Program General Bond Resolution, the Qualified
Zone Academy Bonds First Program Resolution and the Qualified School Construction Bonds General
Bond Resolution of the Tennessee State School Bond Authority, pursuant to Tennessee Code Annotated,
Section 49-3-1205, may be invested, pursuant to each Bond Resolution listed above, in obligations of
the United States or its agencies under flexible repurchase agreements which are fully collateralized by
obligations of the United States or obligations, the timely payment of the principal of and interest on
which are guaranteed by the United States, the State’s pooled investment fund as provided in Tennessee
Code Annotated, Section 9-4-603, and any other investment authorized by the State Investment Policy
adopted by the State Funding Board pursuant to Tennessee Code Annotated, Section 9-4-602.
Deposits
The Authority has cash on deposit in the State Pooled Investment Fund and Local Government
Investment Pool administered by the State Treasurer. The funds are very liquid; there are no minimum
amounts or lengths of time for investment with the exception of a 24-hour notice for withdrawals
exceeding $5,000,000. The funds’ investment policy and required risk disclosures are presented in the
State of Tennessee’s Treasurer’s Report. That report is available on the state’s website at
www.tn.gov/treasury.
The Authority’s deposits are held in a financial institution, which participates in the bank collateral pool
administered by the State Treasurer. The securities pledged to protect these accounts are pledged in the
aggregate rather than against each individual account. The members of the pool may be required by
agreement to pay an assessment to cover any deficiency. Under this additional assessment agreement,
public fund accounts covered by the pool are considered to be insured for purposes of credit risk
disclosure.
Tennessee State School Bond Authority
Notes to the Financial Statements (Cont.)
June 30, 2017, and June 30, 2016
21
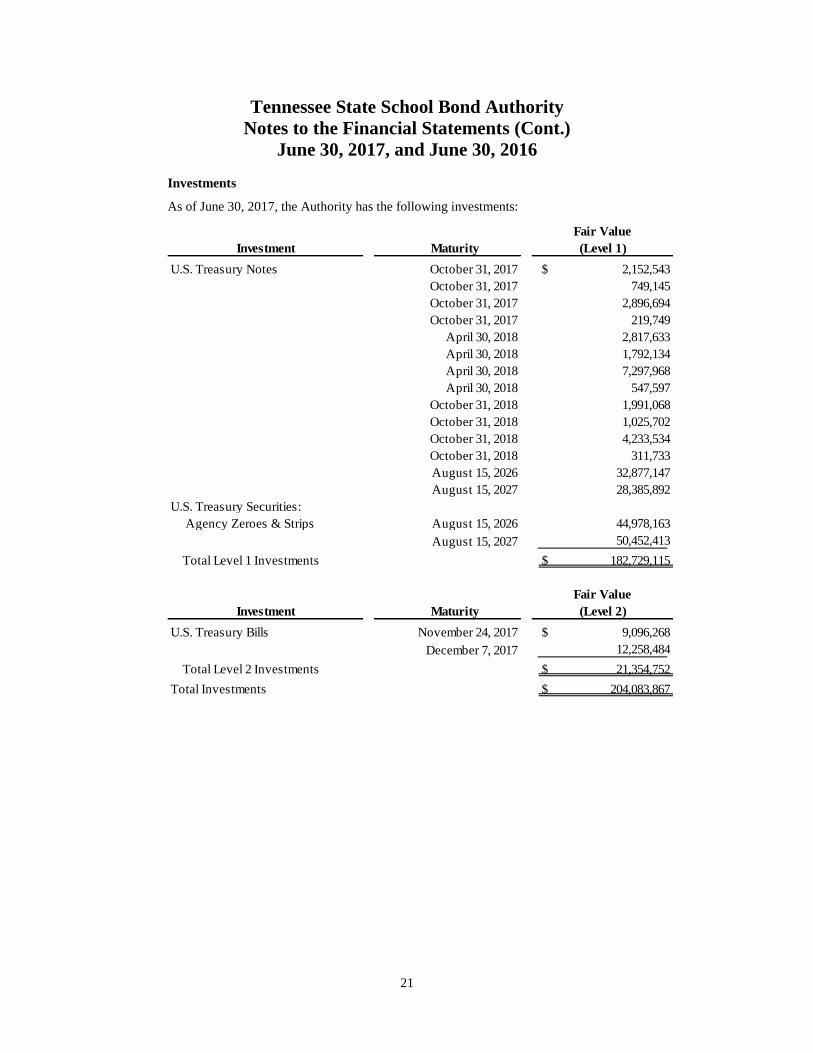
Investments
As of June 30, 2017, the Authority has the following investments:
Investment Maturity
Fair Value
(Level 1)
U.S. Treasury Notes October 31, 2017 $ 2,152,543
October 31, 2017 749,145
October 31, 2017 2,896,694
October 31, 2017 219,749
April 30, 2018 2,817,633
April 30, 2018 1,792,134
April 30, 2018 7,297,968
April 30, 2018 547,597
October 31, 2018 1,991,068
October 31, 2018 1,025,702
October 31, 2018 4,233,534
October 31, 2018 311,733
August 15, 2026 32,877,147
August 15, 2027 28,385,892
U.S. Treasury Securities:
Agency Zeroes & Strips August 15, 2026 44,978,163
August 15, 2027 50,452,413
Total Level 1 Investments $ 182,729,115
Investment Maturity
Fair Value
(Level 2)
U.S. Treasury Bills November 24, 2017 $ 9,096,268
December 7, 2017 12,258,484
Total Level 2 Investments $ 21,354,752
Total Investments $ 204,083,867

Tennessee State School Bond Authority
Notes to the Financial Statements (Cont.)
June 30, 2017, and June 30, 2016
22
As of June 30, 2016, the Authority had the following investments:
Debt and equity securities classified as Level 1 of the fair value hierarchy are valued using prices quoted
in active markets for those securities. Debt securities classified as Level 2 of the fair value hierarchy are
valued using a matrix pricing technique. Matrix pricing is used to value securities based on the
securities’ relationship to benchmark quoted prices.
Interest Rate Risk
Interest rate risk is the risk that future changes in prevailing market rates of interest will have an adverse
effect on the fair value of debt investments. The State’s Investment Policy does not formally address
interest rate risk. As a matter of practice, higher education investments are invested no longer than five
years to reduce the interest rate risk. QZAB investments follow the guidelines in the Forward Delivery
Agreements, which are limited to six-month maturities so that interest rate risk is contained. QSCB
investments are intended to be held to maturity at which time par value will be received, which decreases
significantly the concerns related to interest rate risk. The Authority’s investments are specifically
identified above.
Investment Maturity
Fair Value
(Level 1)
U.S. Treasury Notes November 30, 2016 $ 1,146,214
April 30, 2017 4,399,780
April 30, 2017 579,971
April 30, 2017 3,040,214
April 30, 2017 10,829,459
April 30, 2017 3,726,294
April 30, 2017 849,957
April 30, 2017 270,821
October 31, 2017 1,483,582
August 15, 2026 25,680,376
August 15, 2027 25,834,557
U.S. Treasury Securities:
Agency Zeroes & Strips August 15, 2026 44,650,964
August 15, 2027 43,563,450
Total Level 1 Investments $ 166,055,639
Investment Maturity
Fair Value
(Level 2)
U.S. Treasury Bills November 25, 2016 $ 8,234,262
December 8, 2016 10,969,051
Total Level 2 Investments $ 19,203,313
Total Investments $ 185,258,952
Tennessee State School Bond Authority
Notes to the Financial Statements (Cont.)
June 30, 2017, and June 30, 2016
23
Credit Risk
Credit risk is the risk that an issuer or other counterparty to an investment will not fulfill its obligations.
At June 30, 2017, and June 30, 2016, the Authority had cash on deposit in the State Pooled Investment
Fund and Local Government Investment Pool administered by the State Treasurer, which are unrated.
At June 30, 2017, and June 30, 2016, the Authority also invested in U.S. Government obligations, or
obligations of which the principal and interest are guaranteed by the United States.
Custodial Credit Risk
For an investment, custodial credit risk is the risk that, in the event of the failure of a counterparty, the
Authority will not be able to recover the value of investment or collateral securities that are in the
possession of an outside party. The Authority’s investment securities are exposed to custodial credit risk
if they are uninsured, are not registered in the name of the Authority, and are held by either the
counterparty or the counterparty’s trust department or agent but not in the Authority’s name. At June
30, 2017, and June 30, 2016, the Authority’s investments were registered in the name of the Authority.
Concentration of Credit Risk
A concentration of investments in any one single issuer of debt securities presents a greater risk for loss
in the event that the issuer fails on its obligations. At June 30, 2017, and June 30, 2016, the Authority
only invested in U.S. Treasury securities, or obligations of which the principal and interest are guaranteed
by the United States.
Forward Delivery Agreements
On November 24, 2004, the Authority entered into a Forward Delivery Agreement (the “Agreement”)
with Bank of America, N.A. related to the Series 2004 QZABs. The Agreement guarantees to the
Authority a fixed rate of interest of 3%. Cash from borrowers’ loan repayments will be used to purchase
securities from Bank of America, N.A. in accordance with the Agreement. The accumulated funds will
be used to redeem the $12,600,000 Series 2004 QZABs at maturity. As a result of the Agreement,
borrowers will repay only $9,984,800 of the $12,600,000 principal. The investments will be held by the
State Treasurer in the Authority’s name. As of June 30, 2017, $9,096,268 is invested through the
Agreement. As of June 30, 2016, $8,234,262 was invested through the Agreement. The Authority
negotiated a “one way” termination provision in the event of counterparty default on the Agreement.
The Authority also has the right to optionally terminate the Agreement at any time.
On December 28, 2005, the Authority entered into a Forward Delivery Agreement (the “Agreement”)
with J.P. Morgan Chase Bank, N.A. related to the Series 2005 QZABs. The Agreement guarantees to
the Authority a fixed rate of interest of 3.64%. Cash from borrowers’ loan repayments will be used to
purchase securities from J.P. Morgan Chase Bank, N.A. in accordance with the Agreement. The
accumulated funds will be used to redeem the $17,545,000 Series 2005 QZABs at maturity. As a result
of the Agreement, borrowers will repay only $13,438,510 of the $17,545,000 principal. The investments
will be held by the State Treasurer in the Authority’s name. As of June 30, 2017, $12,258,484 is invested
through the Agreement. As of June 30, 2016, $10,969,052 was invested through the Agreement. The
Authority negotiated a “one way” termination provision in the event of counterparty default on the
Agreement. The Authority also has the right to optionally terminate the Agreement at any time.
Tennessee State School Bond Authority
Notes to the Financial Statements (Cont.)
June 30, 2017, and June 30, 2016
24
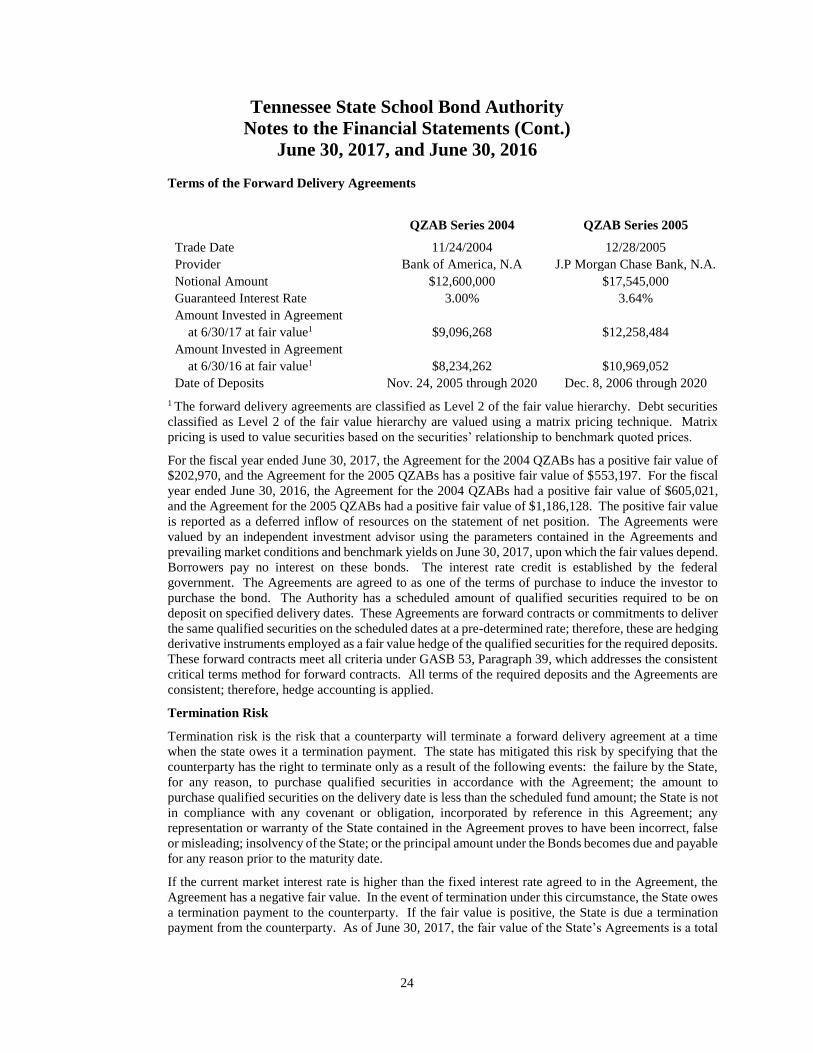
Terms of the Forward Delivery Agreements
QZAB Series 2004 QZAB Series 2005
Trade Date 11/24/2004 12/28/2005
Provider Bank of America, N.A J.P Morgan Chase Bank, N.A.
Notional Amount $12,600,000 $17,545,000
Guaranteed Interest Rate 3.00% 3.64%
Amount Invested in Agreement at 6/30/17 at fair value1 $9,096,268 $12,258,484
Amount Invested in Agreement at 6/30/16 at fair value1 $8,234,262 $10,969,052
Date of Deposits Nov. 24, 2005 through 2020 Dec. 8, 2006 through 2020
1 The forward delivery agreements are classified as Level 2 of the fair value hierarchy. Debt securities
classified as Level 2 of the fair value hierarchy are valued using a matrix pricing technique. Matrix
pricing is used to value securities based on the securities’ relationship to benchmark quoted prices.
For the fiscal year ended June 30, 2017, the Agreement for the 2004 QZABs has a positive fair value of
$202,970, and the Agreement for the 2005 QZABs has a positive fair value of $553,197. For the fiscal
year ended June 30, 2016, the Agreement for the 2004 QZABs had a positive fair value of $605,021,
and the Agreement for the 2005 QZABs had a positive fair value of $1,186,128. The positive fair value
is reported as a deferred inflow of resources on the statement of net position. The Agreements were
valued by an independent investment advisor using the parameters contained in the Agreements and
prevailing market conditions and benchmark yields on June 30, 2017, upon which the fair values depend.
Borrowers pay no interest on these bonds. The interest rate credit is established by the federal
government. The Agreements are agreed to as one of the terms of purchase to induce the investor to
purchase the bond. The Authority has a scheduled amount of qualified securities required to be on
deposit on specified delivery dates. These Agreements are forward contracts or commitments to deliver
the same qualified securities on the scheduled dates at a pre-determined rate; therefore, these are hedging
derivative instruments employed as a fair value hedge of the qualified securities for the required deposits.
These forward contracts meet all criteria under GASB 53, Paragraph 39, which addresses the consistent
critical terms method for forward contracts. All terms of the required deposits and the Agreements are
consistent; therefore, hedge accounting is applied.
Termination Risk
Termination risk is the risk that a counterparty will terminate a forward delivery agreement at a time
when the state owes it a termination payment. The state has mitigated this risk by specifying that the
counterparty has the right to terminate only as a result of the following events: the failure by the State,
for any reason, to purchase qualified securities in accordance with the Agreement; the amount to
purchase qualified securities on the delivery date is less than the scheduled fund amount; the State is not
in compliance with any covenant or obligation, incorporated by reference in this Agreement; any
representation or warranty of the State contained in the Agreement proves to have been incorrect, false
or misleading; insolvency of the State; or the principal amount under the Bonds becomes due and payable
for any reason prior to the maturity date.
If the current market interest rate is higher than the fixed interest rate agreed to in the Agreement, the
Agreement has a negative fair value. In the event of termination under this circumstance, the State owes
a termination payment to the counterparty. If the fair value is positive, the State is due a termination
payment from the counterparty. As of June 30, 2017, the fair value of the State’s Agreements is a total
Tennessee State School Bond Authority
Notes to the Financial Statements (Cont.)
June 30, 2017, and June 30, 2016
25
positive value of $756,167. As of June 30, 2016, the fair value of the State’s Agreements was a total
positive value of $1,791,149.
NOTE 3. LOANS RECEIVABLE
Higher Education Facilities Programs
The Authority has entered into financing agreements with both the Board of Trustees of the University
of Tennessee (the Board of Trustees) and the Tennessee Board of Regents of the State University and
Community College System of the State of Tennessee (the Tennessee Board of Regents). The Second
Financing Agreement (the “Agreement”), is dated November 1, 1997, and was amended and restated on
May 9, 2013. Under the Agreement, the Authority agrees to finance construction projects for the Board
of Trustees or the Tennessee Board of Regents. Annual financing charges payable under the Agreement
must be sufficient to pay the debt obligations of the Authority and the costs of administering the
programs.
When the Authority issues bonds to finance capital projects for the higher education institutions and
local governments, the principal amount of the loan differs from the actual amount of funds available
for capital expenditures because the par amount of the bonds is adjusted by bond discounts and premiums
in order to arrive at the amount of bond proceeds available for capital expenditures. These discounts and
premiums are amortized on a straight-line basis over the life of the related bond because the higher
education institutions and the local governments either receive the benefit or bear the cost of this
difference. These differences are included in loans receivable on the statement of net position.
Qualified Zone Academy Bonds Program
The Authority has entered into loan agreements with the local governments on behalf of local education
agencies for the 1999 QZABs, dated November 30, 1999; the 2001 QZABs, dated December 18, 2001;
the 2003 QZABs, dated December 23, 2003; the 2004 QZABs, dated November 24, 2004; and the 2005
QZABs, dated December 28, 2005. Under the agreements, the Authority agrees to finance renovation
projects and equipment for the local education agencies. On the date designated in the agreements,
annual financing charges must be paid by the borrower sufficient to pay the annual principal payment,
which is deposited into a bond sinking fund held by the State Treasurer that will pay the bonds at
maturity, and the costs of administering the program.
Qualified School Construction Bonds Program
The Authority has entered into loan agreements with the local governments on behalf of local education
agencies for the 2009 QSCBs, dated December 1, 2009, and the 2010 QSCBs, dated October 1, 2010.
Under the agreements, the Authority agrees to finance renovation and rehabilitation projects, equipment
purchases, new building construction, and land acquisition for the local education agencies. On the dates
designated in the agreements, monthly financing charges must be paid by the borrower sufficient to pay
the monthly principal payment, which is deposited into a bond sinking fund held by the State Treasurer
that will pay the bonds at maturity; interest payment; and the costs of administering the program.
NOTE 4. RESTRICTED ASSETS
Cash and Investments
The Higher Education Facilities Second Program General Bond Resolution, effective for all bonds issued
in 1998 and thereafter, permits the Authority to satisfy the debt service reserve requirement by either
placing an amount equal to the maximum semiannual debt service requirement in a debt service reserve
account or by maintaining a Reserve Fund Credit Facility. The Authority obtained a surety bond,
constituting a Reserve Fund Credit Facility under the Resolution, in lieu of maintaining a debt service
reserve fund for the 2005 Series A and B; 2006 Series A; 2007 Series A, B and C; and 2008 Series A

Tennessee State School Bond Authority
Notes to the Financial Statements (Cont.)
June 30, 2017, and June 30, 2016
26
Bonds. Due to market conditions at the time of issuance of the 2008 Series B, 2009 Series A, and 2010
Series A and B Bonds, the Authority deposited funds into a debt service reserve account equal to the
maximum semiannual debt service for those bonds. The Authority elected to establish a separate debt
service reserve fund solely for the 2012 Series A, B, and C, 2013 Series A, 2014 Series A and B, and
2015 Series A and B bonds with no current funding requirement.
The first program bond resolution of the QZABs requires the establishment of a special trust fund, the
bond Sinking Fund account. This account represents the funds set aside to redeem the QZABs at
maturity.
The first program bond resolution of the QSCBs requires the establishment of a special trust fund, the
bond Sinking Fund account. This account represents the funds set aside to redeem the QSCBs at maturity.
NOTE 5. DEBT PAYABLE
The State of Tennessee shall not be liable on the bonds issued by the Authority, and the bonds shall not
be a debt of the State.
Higher Education Facilities Programs
A. Bonds. The principal, Sinking Fund installments, if any, and redemption price of and interest on the
bonds are payable solely from the annual financing charges, legislative appropriations, and other
moneys and securities held or set aside under the resolutions.
B. Revolving Credit Facility. Revolving credit facility constitutes a special obligation of the Authority.
Principal and interest on the revolving credit facility is payable from the following sources: (i) as to
principal only, the proceeds of the draw on the revolving credit facility to pay the principal of other
outstanding revolving credit facility, (ii) available revenues, (iii) the money and securities (if any)
on deposit in the Reimbursement Fund and in the Debt Service Fund, (iv) the moneys and securities
(if any) on deposit in the Project Construction Account for such projects, and (v) the proceeds of
bonds or notes issued to make such payments.
Qualified Zone Academy Bonds Program
On September 9, 1999, the Authority adopted a Qualified Zone Academy Bond Resolution authorizing
the issuance of QZABs to make loans to local governments on behalf of local education agencies for the
purpose of financing eligible costs of certain projects. The state Department of Education recommends
the projects to the Authority that should be funded under the QZAB program. The Taxpayer Relief Act
of 1997 provided this financial tool whereby interest on QZABs is paid by the federal government in the
form of an annual tax credit to the financial institutions that hold the QZABs. The bonds are secured
solely by the payments made by the borrowers under the loan agreements, including amounts collected
from unobligated state-shared taxes in the event of non-payment by the local governments and by certain
funds held under the Qualified Zone Academy Bond Resolution.
Qualified School Construction Bonds Program
On November 5, 2009, the Authority adopted a Qualified School Construction Bond Resolution
authorizing the issuance of QSCBs to make loans to local governments on behalf of local education
agencies for the purpose of financing eligible costs of certain projects. The Tennessee Advisory
Commission on Intergovernmental Relations recommended the projects to be funded by the Authority
under the QSCB program. The American Recovery and Reinvestment Act of 2009 provided this
financial tool whereby interest on QSCBs, Series 2009, is paid by the federal government in the form of
a quarterly tax credit to the financial institutions that hold the QSCBs. Market conditions at the time of
issuance demanded the borrowers pay an additional quarterly interest payment to supplement the tax
credit to the investors. The 2010 QSCBs were issued as direct subsidy payment bonds, a financial tool

Tennessee State School Bond Authority
Notes to the Financial Statements (Cont.)
June 30, 2017, and June 30, 2016
27
whereby the interest on the QSCBs is intended to be fully subsidized by the federal government. The
bonds are secured solely by the payments made by the borrowers under the Loan Agreements, including
amounts collected from unobligated state-shared taxes in the event of non-payment by the local
governments and by certain funds held under the Qualified School Construction Bond Resolution. The
September 15, 2016, federal interest subsidy payment for the 2010 QSCBs was reduced by 6.8%, or
$350,169.10, as a part of the Budget Control Act of 2011. The sequestration reduction rate was
applicable until the end of the federal fiscal year, September 30, 2016. On August 3, 2016, the Internal
Revenue Service announced that federal subsidy payments will be cut by 6.9% during the 2017 federal
fiscal year.
Changes in debt payable for the years ended June 30, 2017, and June 30,2016, are as follows (expressed
in thousands):
Amounts
Balance Balance Due Within
July 1, 2016 Additions Deletions June 30, 2017 One Year
Revolving Credit Facility 84,480$ 117,000$ 13,328$ 188,152$ -$
Bonds payable 1,908,125$ -$ 66,595$ 1,841,530$ 68,265$
Less: unamortized bond
discount (52) - (3) (49) -
Add: unamortized bond
premium 169,147 - 8,241 160,906 -
Total bonds payable 2,077,220$ -$ 74,833$ 2,002,387$ 68,265$
Amounts
Balance Balance Due Within
July 1, 2015 Additions Deletions June 30, 2016 One Year
Revolving Credit Facility 61,682$ 35,000$ 12,202$ 84,480$ -$
Bonds payable 1,979,840$ -$ 71,715$ 1,908,125$ 66,595$
Less: unamortized bond
discount (56) - (4) (52) -
Add: unamortized bond
premium 176,080 - 6,933 169,147 -
Total bonds payable 2,155,864$ -$ 78,644$ 2,077,220$ 66,595$

Tennessee State School Bond Authority
Notes to the Financial Statements (Cont.)
June 30, 2017, and June 30, 2016
28
Bonds and revolving credit facility at June 30, 2017, and June 30, 2016, are as follows
(expressed in thousands):
June 30, 2017 June 30, 2016
Bonds Payable:
2007 Series A at interest rates of 4.25% maturing to
2036 (original par - $33,730)
2,185 3,615
2007 Series B (Federally Taxable) at interest rate of
5.243% maturing to 2017 (original par - $14,040)
0 480
2007 Series C at interest rates of 5.00% maturing to
2032 (original par - $89,940)
41,640 42,045
2008 Series B at interest rates of 5.00% maturing to
2018 (original par - $166,990)
7,315 14,315
2009 Series A at interest rates from 4.00% to 5.00%
maturing to 2019 (original par - $109,905)
7,075 10,625
2010 Series A at interest rates from 3.125% to 4.250%
maturing to 2040 (original par - $213,920)
69,240 79,315
2010 Series B at interest rates from 3.00% to 5.20%
maturing to 2040 (original par - $18,015)
14,845 15,355
2012 Series A at interest rates from 2.50% to 5.00%
maturing to 2042 (original par - $208,295)
189,810 194,445
2012 Series B (Federally Taxable) at interest rates from
1.772% to 3.845% maturing to 2042 (original par -
$103,790)
86,765 92,490
2012 Refunding Series C at interest rates from 3.00%
to 5.00% maturing to 2034 (original par - $125,635)
86,295 94,345
2013 Series A at interest rates from 4.00% to 5.00%
maturing to 2044 (original par - $149,130)
136,270 140,875
2014 Series A (Federally Taxable) at interest rates from
1.250% to 4.207% maturing to 2045 (original par -
$132,450)
111,130 121,825
2014 Refunding Series B at interest rates from 4.00%
to 5.000% maturing to 2038 (original par - $212,200)
208,940 212,200
2015 Series A (Federally Taxable) at interest rates from
1.020% to 3.950% maturing to 2046 (original par -
$75,550)
73,440 75,550
2015 Series B at interest rates of 5.00% maturing to
2046 (original par - $388,615)
384,550 388,615
2003 Qualified Zone Academy Bonds non-interest
bearing maturing in 2019 (original par - $2,445)
2,445 2,445
2004 Qualified Zone Academy Bonds non-interest
bearing maturing in 2021 (original par - $12,600)
12,600 12,600
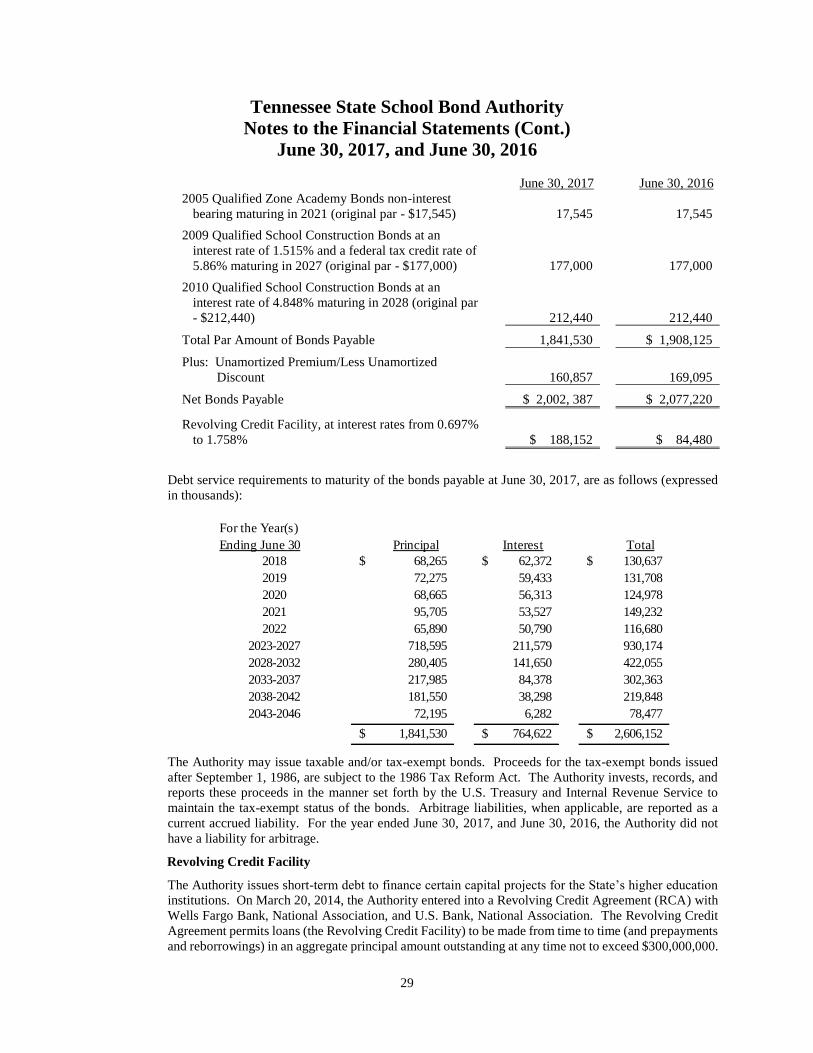
Tennessee State School Bond Authority
Notes to the Financial Statements (Cont.)
June 30, 2017, and June 30, 2016
29
June 30, 2017 June 30, 2016
2005 Qualified Zone Academy Bonds non-interest
bearing maturing in 2021 (original par - $17,545)
17,545 17,545
2009 Qualified School Construction Bonds at an
interest rate of 1.515% and a federal tax credit rate of
5.86% maturing in 2027 (original par - $177,000)
177,000 177,000
2010 Qualified School Construction Bonds at an
interest rate of 4.848% maturing in 2028 (original par
- $212,440)
212,440 212,440
Total Par Amount of Bonds Payable 1,841,530 $ 1,908,125
Plus: Unamortized Premium/Less Unamortized
Discount
160,857 169,095
Net Bonds Payable $ 2,002, 387 $ 2,077,220
Revolving Credit Facility, at interest rates from 0.697%
to 1.758%
$ 188,152 $ 84,480
Debt service requirements to maturity of the bonds payable at June 30, 2017, are as follows (expressed
in thousands):
The Authority may issue taxable and/or tax-exempt bonds. Proceeds for the tax-exempt bonds issued
after September 1, 1986, are subject to the 1986 Tax Reform Act. The Authority invests, records, and
reports these proceeds in the manner set forth by the U.S. Treasury and Internal Revenue Service to
maintain the tax-exempt status of the bonds. Arbitrage liabilities, when applicable, are reported as a
current accrued liability. For the year ended June 30, 2017, and June 30, 2016, the Authority did not
have a liability for arbitrage.
Revolving Credit Facility
The Authority issues short-term debt to finance certain capital projects for the State’s higher education
institutions. On March 20, 2014, the Authority entered into a Revolving Credit Agreement (RCA) with
Wells Fargo Bank, National Association, and U.S. Bank, National Association. The Revolving Credit
Agreement permits loans (the Revolving Credit Facility) to be made from time to time (and prepayments
and reborrowings) in an aggregate principal amount outstanding at any time not to exceed $300,000,000.
For the Year(s)
Ending June 30 Principal Interest Total
2018 68,265$ 62,372$ 130,637$
2019 72,275 59,433 131,708
2020 68,665 56,313 124,978
2021 95,705 53,527 149,232
2022 65,890 50,790 116,680
2023-2027 718,595 211,579 930,174
2028-2032 280,405 141,650 422,055
2033-2037 217,985 84,378 302,363
2038-2042 181,550 38,298 219,848
2043-2046 72,195 6,282 78,477
1,841,530$ 764,622$ 2,606,152$

Tennessee State School Bond Authority
Notes to the Financial Statements (Cont.)
June 30, 2017, and June 30, 2016
30
The Revolving Credit Agreement was amended on March 20, 2017 with an expiration date of March 20,
2020. The revolving credit facility may be issued as tax-exempt or as taxable loans. At the program’s
inception, the revolving credit facility refinanced certain outstanding commercial paper proceeds that
the Authority had previously issued to finance capital projects. At June 30, 2017, $180 165 320 of tax-
exempt revolving credit facility and $7,986,746 of taxable revolving credit facility loans were
outstanding. At June 30, 2016, $75,367,383 of tax-exempt revolving credit facility and $9,112,778 of
taxable revolving credit facility loans were outstanding.
NOTE 6. UNEARNED REVENUE
Changes in unearned revenue for the years ended June 30, 2017, and June 30, 2016, are as follows
(expressed in thousands):
NOTE 7. SUBSEQUENT EVENTS
On September 21, 2017, the Authority issued the 2017 Series A Bonds (“2017A”), the 2017 Refunding
Series B Bonds (“2017B”), and the 2017 Refunding Series C Bonds (Federally Taxable) (“2017C”). The
2017A tax-exempt bond proceeds in the amount of $247,570,000 were sold with an original issue
premium of $50,270,901.28. The 2017A bonds were issued to prepay $128,306,796 of the principal
amount of the revolving credit loans outstanding. The 2017B tax-exempt bond proceeds in the amount
of $139,740,000 were sold with an original issue premium of $30,387,310.51. The 2017B bonds were
issued to refund $2,185,000 of the 2007 Series A Bonds, $37,705,000 of the 2007 Series C Bonds,
$69,240,000 of the 2010 Series A Bonds, $47,930,000 of the 2012 Series A Bonds, and $14,250,000 of
the 2013 Series A Bonds. The 2017C taxable bond proceeds in the amount of $15,150,000 were issued
at par. The 2017C bonds were issued to refund $14,845,000 of the 2010 Series B Bonds. The balance
of the proceeds of the 2017A, 2017B, and 2017C bonds will be used to pay for construction costs of
certain projects and various costs of issuance.
The September 15, 2017, federal interest subsidy payment for the 2010 QSCBs was reduced by 6.9%,
or $355,318.65, as a part of the Budget Control Act of 2011. The sequestration reduction rate was
applicable until the end of the federal fiscal year, September 30, 2017. On August 2, 2017, the Internal
Balance Balance
July 1, 2016 Additions Deletions July 1, 2017
Prepaid Interest 2,233$ 2,260$ 2,233$ 2,260$
Other unearned revenue 20 - 2 18
Total unearned revenue 2,253$ 2,260$ 2,235$ 2,278$
Balance Balance
July 1, 2015 Additions Deletions June 30, 2016
Prepaid Interest 2,141$ 2,416$ 2,324$ 2,233$
Other unearned revenue 21 - 1 20
Total unearned revenue 2,162$ 2,416$ 2,325$ 2,253$
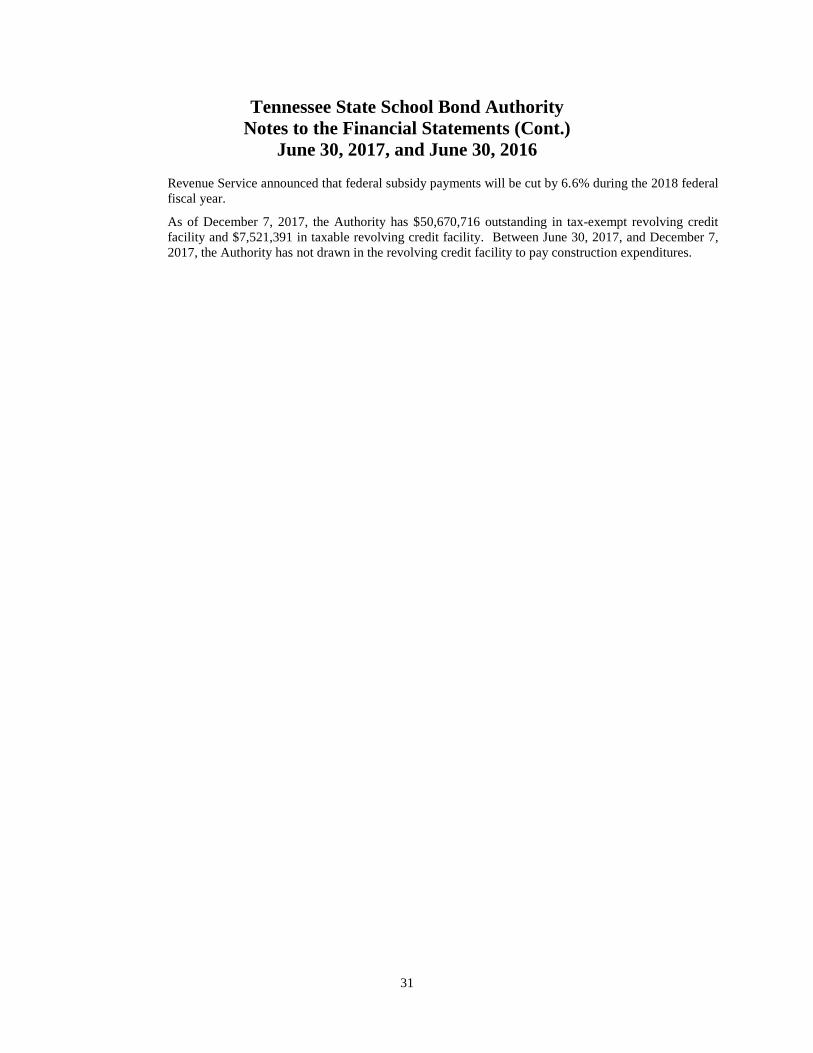
Tennessee State School Bond Authority
Notes to the Financial Statements (Cont.)
June 30, 2017, and June 30, 2016
31
Revenue Service announced that federal subsidy payments will be cut by 6.6% during the 2018 federal
fiscal year.
As of December 7, 2017, the Authority has $50,670,716 outstanding in tax-exempt revolving credit
facility and $7,521,391 in taxable revolving credit facility. Between June 30, 2017, and December 7,
2017, the Authority has not drawn in the revolving credit facility to pay construction expenditures.

32
This Page Intentionally Left Blank

SUPPLEMENTARY SCHEDULES
33

34

35
This Page Intentionally Left Blank
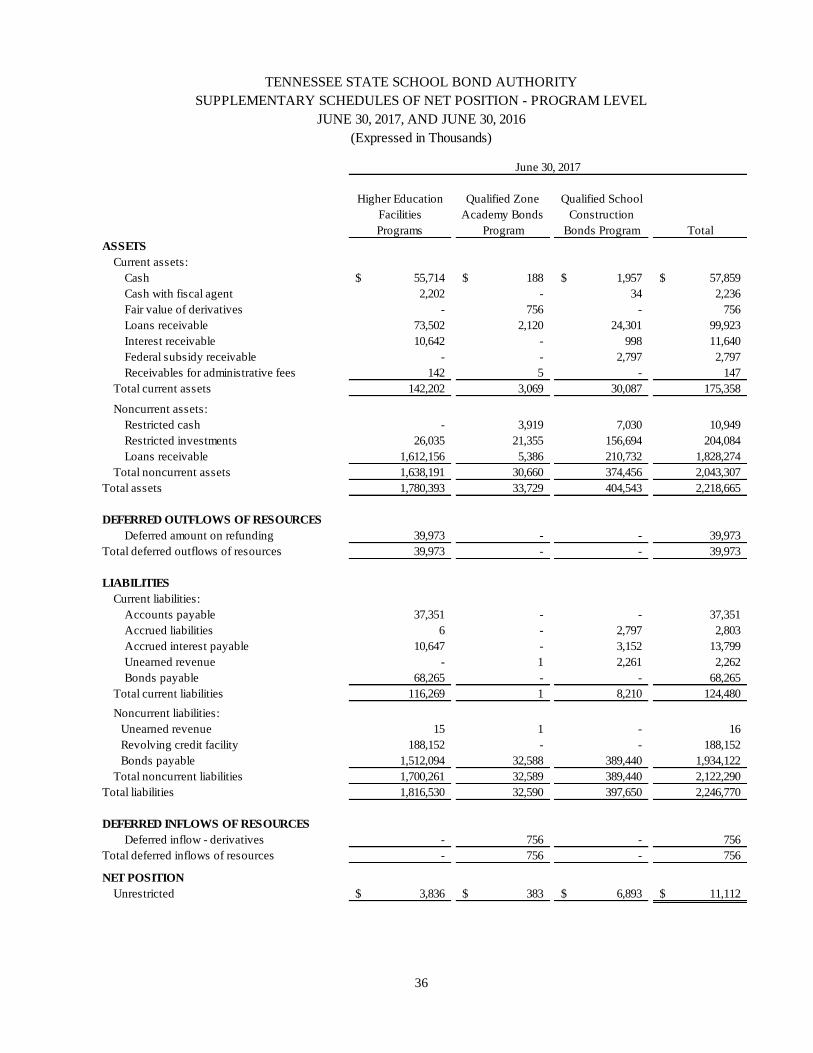
36
Higher Education Qualified Zone Qualified School
Facilities Academy Bonds Construction
Programs Program Bonds Program Total
ASSETS
Current assets:
Cash 55,714$ 188$ 1,957$ 57,859$
Cash with fiscal agent 2,202 - 34 2,236
Fair value of derivatives - 756 - 756
Loans receivable 73,502 2,120 24,301 99,923
Interest receivable 10,642 - 998 11,640
Federal subsidy receivable - - 2,797 2,797
Receivables for administrative fees 142 5 - 147
Total current assets 142,202 3,069 30,087 175,358
Noncurrent assets:
Restricted cash - 3,919 7,030 10,949
Restricted investments 26,035 21,355 156,694 204,084
Loans receivable 1,612,156 5,386 210,732 1,828,274
Total noncurrent assets 1,638,191 30,660 374,456 2,043,307
Total assets 1,780,393 33,729 404,543 2,218,665
DEFERRED OUTFLOWS OF RESOURCES
Deferred amount on refunding 39,973 - - 39,973
Total deferred outflows of resources 39,973 - - 39,973
LIABILITIES
Current liabilities:
Accounts payable 37,351 - - 37,351
Accrued liabilities 6 - 2,797 2,803
Accrued interest payable 10,647 - 3,152 13,799
Unearned revenue - 1 2,261 2,262
Bonds payable 68,265 - - 68,265
Total current liabilities 116,269 1 8,210 124,480
Noncurrent liabilities:
Unearned revenue 15 1 - 16
Revolving credit facility 188,152 - - 188,152
Bonds payable 1,512,094 32,588 389,440 1,934,122
Total noncurrent liabilities 1,700,261 32,589 389,440 2,122,290
Total liabilities 1,816,530 32,590 397,650 2,246,770
DEFERRED INFLOWS OF RESOURCES
Deferred inflow - derivatives - 756 - 756
Total deferred inflows of resources - 756 - 756
NET POSITION
Unrestricted 3,836$ 383$ 6,893$ 11,112$
June 30, 2017
TENNESSEE STATE SCHOOL BOND AUTHORITY
SUPPLEMENTARY SCHEDULES OF NET POSITION - PROGRAM LEVEL
JUNE 30, 2017, AND JUNE 30, 2016
(Expressed in Thousands)
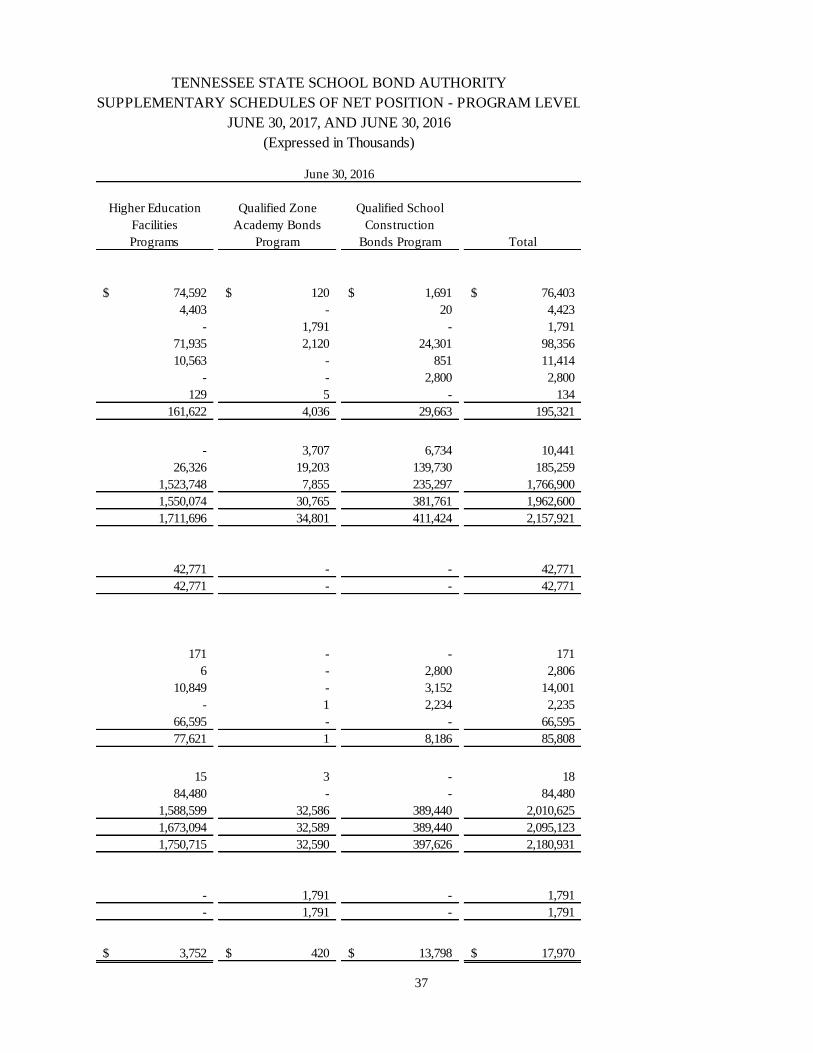
37
Higher Education Qualified Zone Qualified School
Facilities Academy Bonds Construction
Programs Program Bonds Program Total
74,592$ 120$ 1,691$ 76,403$
4,403 - 20 4,423
- 1,791 - 1,791
71,935 2,120 24,301 98,356
10,563 - 851 11,414
- - 2,800 2,800
129 5 - 134
161,622 4,036 29,663 195,321
- 3,707 6,734 10,441
26,326 19,203 139,730 185,259
1,523,748 7,855 235,297 1,766,900
1,550,074 30,765 381,761 1,962,600
1,711,696 34,801 411,424 2,157,921
42,771 - - 42,771
42,771 - - 42,771
171 - - 171
6 - 2,800 2,806
10,849 - 3,152 14,001
- 1 2,234 2,235
66,595 - - 66,595
77,621 1 8,186 85,808
15 3 - 18
84,480 - - 84,480
1,588,599 32,586 389,440 2,010,625
1,673,094 32,589 389,440 2,095,123
1,750,715 32,590 397,626 2,180,931
- 1,791 - 1,791
- 1,791 - 1,791
3,752$ 420$ 13,798$ 17,970$
JUNE 30, 2017, AND JUNE 30, 2016
(Expressed in Thousands)
June 30, 2016
TENNESSEE STATE SCHOOL BOND AUTHORITY
SUPPLEMENTARY SCHEDULES OF NET POSITION - PROGRAM LEVEL
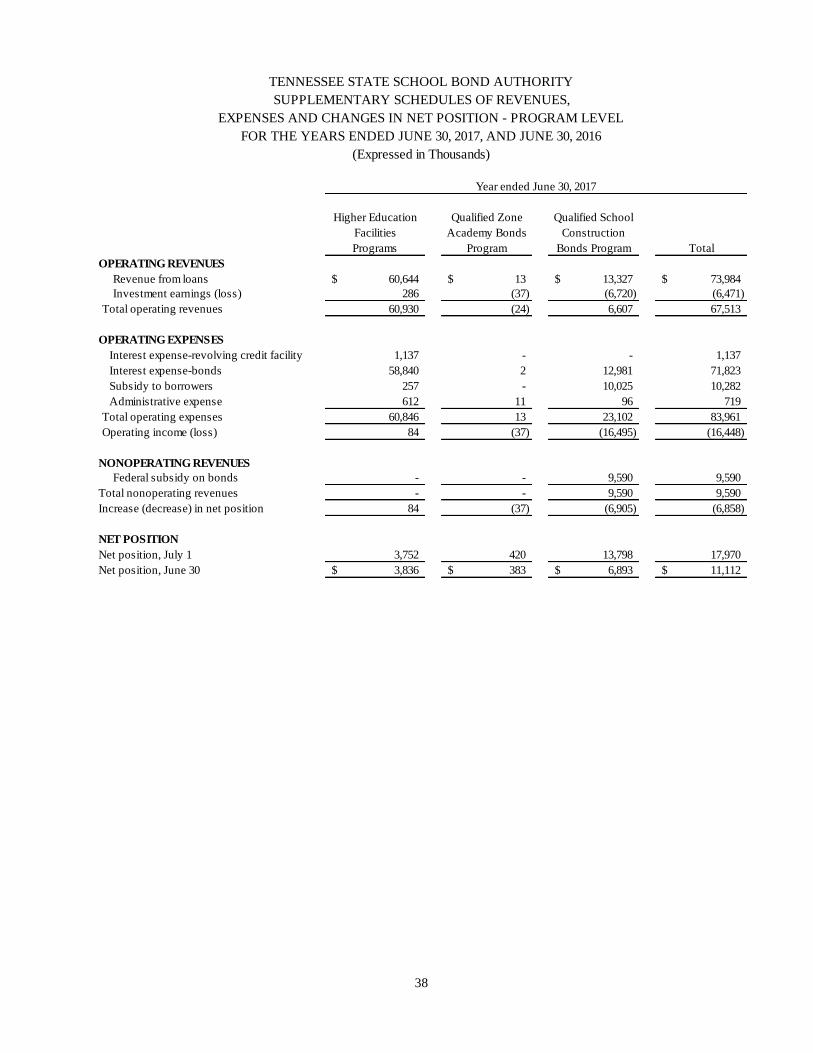
38
Higher Education Qualified Zone Qualified School
Facilities Academy Bonds Construction
Programs Program Bonds Program Total
OPERATING REVENUES
Revenue from loans 60,644$ 13$ 13,327$ 73,984$
Investment earnings (loss) 286 (37) (6,720) (6,471)
Total operating revenues 60,930 (24) 6,607 67,513
OPERATING EXPENSES
Interest expense-revolving credit facility 1,137 - - 1,137
Interest expense-bonds 58,840 2 12,981 71,823
Subsidy to borrowers 257 - 10,025 10,282
Administrative expense 612 11 96 719
Total operating expenses 60,846 13 23,102 83,961
Operating income (loss) 84 (37) (16,495) (16,448)
NONOPERATING REVENUES
Federal subsidy on bonds - - 9,590 9,590
Total nonoperating revenues - - 9,590 9,590
Increase (decrease) in net position 84 (37) (6,905) (6,858)
NET POSITION
Net position, July 1 3,752 420 13,798 17,970
Net position, June 30 3,836$ 383$ 6,893$ 11,112$
Year ended June 30, 2017
TENNESSEE STATE SCHOOL BOND AUTHORITY
SUPPLEMENTARY SCHEDULES OF REVENUES,
EXPENSES AND CHANGES IN NET POSITION - PROGRAM LEVEL
FOR THE YEARS ENDED JUNE 30, 2017, AND JUNE 30, 2016
(Expressed in Thousands)

39
Higher Education Qualified Zone Qualified School
Facilities Academy Bonds Construction
Programs Program Bonds Program Total
61,868$ 14$ 13,328$ 75,210$
634 19 14,493 15,146
62,502 33 27,821 90,356
470 - - 470
62,126 2 12,981 75,109
616 - 13,323 13,939
854 14 126 994
64,066 16 26,430 90,512
(1,564) 17 1,391 (156)
- - 9,589 9,589
- - 9,589 9,589
(1,564) 17 10,980 9,433
5,316 403 2,818 8,537
3,752$ 420$ 13,798$ 17,970$
(Expressed in Thousands)
Year ended June 30, 2016
TENNESSEE STATE SCHOOL BOND AUTHORITY
SUPPLEMENTARY SCHEDULES OF REVENUES,
EXPENSES AND CHANGES IN NET POSITION - PROGRAM LEVEL
FOR THE YEARS ENDED JUNE 30, 2017, AND JUNE 30, 2016

40
Higher Education Qualified Zone Qualified School
Facilities Academy Bonds Construction
Programs Program Bonds Program Total
CASH FLOWS FROM OPERATING ACTIVITIES
Receipts from borrowers for administrative fees 450$ 10$ 349$ 809$
Payment to suppliers (724) (12) (96) (832)
Net cash provided by (used in) operating activities (274) (2) 253 (23)
CASH FLOWS FROM NONCAPITAL FINANCING
ACTIVITIES
Proceeds from sale of revolving credit facility 117,000 - - 117,000
Bond interest subsidy from federal government - - 9,594 9,594
Bond issuance costs paid - - - -
Principal paid - bonds and revolving credit facility (79,923) - - (79,923)
Interest paid - bonds and revolving credit facility (65,668) - (12,981) (78,649)
Subsidy to borrowers - - (9,594) (9,594)
Net cash used in noncapital financing activities (28,591) - (12,981) (41,572)
CASH FLOWS FROM INVESTING ACTIVITIES
Purchases of investments (24,669) (41,842) (26,164) (92,675)
Proceeds from sales and maturities of investments 24,818 39,654 - 64,472
Interest received on investments 427 689 2,332 3,448
Loans issued (135,383) - - (135,383)
Collections of loan principal 79,923 1,788 24,151 105,862
Interest received on loans 62,670 (7) 12,985 75,648
Net cash provided by (used in) investing activities 7,786 282 13,304 21,372
Net increase (decrease) in cash (21,079) 280 576 (20,223)
Cash, July 1 78,995 3,827 8,445 91,267
Cash, June 30 57,916$ 4,107$ 9,021$ 71,044$
Reconciliation of cash to the Statement of Net Position:
Cash 55,714$ 188$ 1,957$ 57,859$
Cash with fiscal agent 2,202 - 34 2,236
Restricted cash - 3,919 7,030 10,949
Cash, June 30 57,916$ 4,107$ 9,021$ 71,044$
Reconciliation of operating income (loss) to net
cash provided by (used in) operating activities:
Operating income (loss) 84$ (37)$ -$ (16,495)$ (16,448)$
Adjustments to reconcile operating income (loss) to net cash
provided by (used in) operating activities:
Investment earnings (286) 36 6,721 6,471
Interest expense 59,977 1 12,981 72,959
Subsidy to borrowers 257 - 10,025 10,282
Bond issuance costs - - - -
Interest income (loss) from loans (60,181) - (12,981) (73,162)
Changes in assets and liabilities:
(Increase) decrease in receivables for administrative fees (13) - 2 (11)
Increase (decrease) in payables for administrative fees (112) - - (112)
Increase (decrease) in unearned revenue - (2) - (2)
Total adjustments (358) 35 16,748 16,425
Net cash provided by (used in) operating activities (274)$ (2)$ 253$ (23)$
Noncash investing activities:
Increase (decrease) in fair value of investments (110)$ -$ 3,238$ 3,128$
SUPPLEMENTARY SCHEDULES OF CASH FLOWS - PROGRAM LEVEL
TENNESSEE STATE SCHOOL BOND AUTHORITY
FOR THE YEARS ENDED JUNE 30, 2017, AND JUNE 30, 2016(Expressed in Thousands)
Year ended June 30, 2017

41
Higher Education Qualified Zone Qualified School
Facilities Academy Bonds Construction
Programs Program Bonds Program Total
461$ 14$ 350$ 825$
(738) (14) (138) (890)
(277) - 212 (65)
35,000 - - 35,000
- - 9,574 9,574
(125) - - (125)
(72,587) (11,330) - (83,917)
(66,927) - (12,981) (79,908)
- - (9,574) (9,574)
(104,639) (11,330) (12,981) (128,950)
(22,904) (37,503) (22,556) (82,963)
28,309 35,388 - 63,697
662 615 1,998 3,275
(243,257) - - (243,257)
72,587 2,395 20,699 95,681
52,120 - 13,060 65,180
(112,483) 895 13,201 (98,387)
(217,399) (10,435) 432 (227,402)
296,394 14,262 8,013 318,669
78,995$ 3,827$ 8,445$ 91,267$
74,592$ 120$ 1,691$ 76,403$
4,403 - 20 4,423
- 3,707 6,734 10,441
78,995$ 3,827$ 8,445$ 91,267$
(1,564)$ 17$ 1,391$ (156)$
(636) (18) (14,493) (15,147)
62,597 1 12,981 75,579
616 - 13,323 13,939
125 - - 125
(61,389) - (12,981) (74,370)
(17) 1 - (16)
(9) - (11) (20)
- (1) 2 1
1,287 (17) (1,179) 91
(277)$ -$ 212$ (65)$
22$ -$ 13,459$ 13,481$
TENNESSEE STATE SCHOOL BOND AUTHORITY
SUPPLEMENTARY SCHEDULES OF CASH FLOWS - PROGRAM LEVEL
FOR THE YEARS ENDED JUNE 30, 2017, AND JUNE 30, 2016(Expressed in Thousands)
Year ended June 30, 2016

42
This Page Intentionally Left Blank
STATISTICAL SECTION
43

44

45
STATISTICAL SECTION
The Statistical Section provides additional historical information as a context for understanding what the information
in the financial statements, notes to the financial statements and required supplementary information says about the
Tennessee State School Bond Authority's overall financial health.
Financial Trends Information
This schedule presents trend information to help the reader understand how the Tennessee State School Bond
Authority's performance and fiscal health have changed over time.
Schedules of Revenues, Expenses, and Changes in Net Position ........................................................................................... 46
Revenue Capacity Information
This schedule contains information to help the reader understand the Tennessee State School Bond Authority's most
significant revenue source.
Outstanding Loans to Borrowers ............................................................................................................................................ 48
Debt Capacity Information
These schedules present information to help the reader understand and assess the Tennessee State School Bond
Authority’s outstanding debt and ability to issue debt in the future.
Schedule of Ratios of Outstanding Debt Payable .................................................................................................................... 49
Allocable Debt to Borrowers Per FTE – Higher Education Facilities Program ...................................................................... 50
Allocable Debt to Borrowers Per Capita – Qualified Zone Academy Bonds Program ........................................................... 51
Allocable Debt to Borrowers Per Capita – Qualified School Construction Bonds Program ................................................... 52
College and University Funds – Schedule of Fees/Charges, Legislative Appropriations and Debt Service ........................... 53
College and University Funds – Coverage of Annual Financing Charges .............................................................................. 54
Debt Service Coverage - Qualified Zone Academy Bond Program ........................................................................................ 55
Debt Service Coverage - Qualified School Construction Bonds Program .............................................................................. 60
Demographic and Economic Information
This schedule contains information to help the reader understand the environment within which the Tennessee State
School Bond Authority’s financial activities take place.
State of Tennessee – Demographic and Economic Information ............................................................................................. 69
Fall Term Full-Time Equivalent Enrollment in Public Higher Education Schools ................................................................ 70
History of Average Daily Membership Grades Kindergarten through Twelve 2007-2016 .................................................72

46
2017 2016 2015
OPERATING REVENUES
Revenue from loans 73,984$ 75,210$ 66,092$
Investment earnings (loss) (6,471) 15,146 5,697
Total operating revenues 67,513 90,356 71,789
OPERATING EXPENSES
Interest expense-commercial paper - - -
Interest expense-revolving credit facility 1,137 470 679
Interest expense-bonds 71,823 75,109 63,944
Loss on retirement of bonds - - -
Subsidy to borrowers 10,282 13,939 13,341
Administrative expense 719 994 2,473
Amortization of bond issuance costs - - -
Total operating expenses 83,961 90,512 80,437
Operating income (loss) (16,448) (156) (8,648)
NONOPERATING REVENUES
Federal subsidy on bonds 9,590 9,589 9,549 9,589
Total nonoperating revenues 9,590 9,589 9,549
Increase (decrease) in net position (6,858) 9,433 901
NET POSITION
Net position, July 1 before change in accounting principle 17,970 8,537 7,636
Cumulative effect of a change in accounting principle - - -
Net position, July 1 17,970 8,537 7,636
Net position, June 30 11,112$ 17,970$ 8,537$
TENNESSEE STATE SCHOOL BOND AUTHORITY
SCHEDULES OF REVENUES, EXPENSES, AND
CHANGES IN NET POSITION
FOR FISCAL YEARS ENDED 2008 TO 2017
(Expressed in Thousands)

47
2014 2013 2012 2011 2010 2009 2008
66,625$ 62,496$ 59,242$ 57,310$ 43,377$ 38,979$ 34,991$
2,571 1,725 1,100 512 386 742 1,356
69,196 64,221 60,342 57,822 43,763 39,721 36,347
173 244 323 450 757 3,457 6,244
224 - - - - - -
65,636 60,761 57,684 54,905 41,357 33,999 27,385
- - 4 - - - -
12,097 12,314 11,314 8,061 291 511 1,183
1,864 2,334 1,143 1,356 773 970 681
- - - 787 632 543 561
79,994 75,653 70,468 65,559 43,810 39,480 36,054
(10,798) (11,432) (10,126) (7,737) (47) 241 293
9,264 10,299 10,299 7,524 - - -
9,264 10,299 10,299 7,524 - - -
(1,534) (1,133) 173 (213) (47) 241 293
9,170 10,303 7,831 8,044 8,091 7,850 7,557
- - 2,299 - - - -
9,170 10,303 10,130 8,044 8,091 7,850 7,557
7,636$ 9,170$ 10,303$ 7,831$ 8,044$ 8,091$ 7,850$
TENNESSEE STATE SCHOOL BOND AUTHORITY
SCHEDULES OF REVENUES, EXPENSES, AND
CHANGES IN NET POSITION
FOR FISCAL YEARS ENDED 2008 TO 2017
(Expressed in Thousands)

48
Fiscal
Year
Higher Education
Facilities
Programs
Qualified Zone
Academy Bonds
Program
Qualified School
Construction Bonds
Program Total
2017** 1,685,658$ 7,506$ 235,032$ 1,928,196$
2016** 1,595,683 9,975 259,597 1,865,255
2015** 1,480,595 12,984 284,021 1,777,600
2014** 1,391,547 16,010 308,234 1,715,791
2013** 1,301,314 18,963 330,122 1,594,266
2012 1,165,181 21,927 290,801 1,477,909
2011 1,107,640 24,729 145,281 1,277,650
2010 1,071,729 28,011 23,192 1,122,932
2009 999,371 31,020 - 1,030,391
2008 859,706 33,614 - 893,320
(Expressed in Thousands)
TENNESSEE STATE SCHOOL BOND AUTHORITY
OUTSTANDING LOANS TO BORROWERS*
FOR THE LAST TEN YEARS
Note: The QSCB loans were only made in fiscal years 2010 and 2011 with loan proceeds disbursed over a three-year period.
*The outstanding loans to borrowers represent the portion of the total outstanding debt allocable to the borrowers in each
program. Differences in the amounts shown as total outstanding debt and total outstanding loans arise from the following:
• Higher Education Facilities Programs - Debt Service Reserve Funds, unspent proceeds, and capitalized interest
• Qualified Zone Academy Bonds Program - funds on deposit in the sinking fund
• Qualified School Construction Bonds Program - funds on deposit in the sinking fund
**The outstanding loans for fiscal year 2013, 2014, 2015, 2016 and 2017 include amounts previously reported as unearned
revenue on the Statement of Net Position, which are now included in loans receivable (See Note 3 in the Notes to the
Financial Statements)
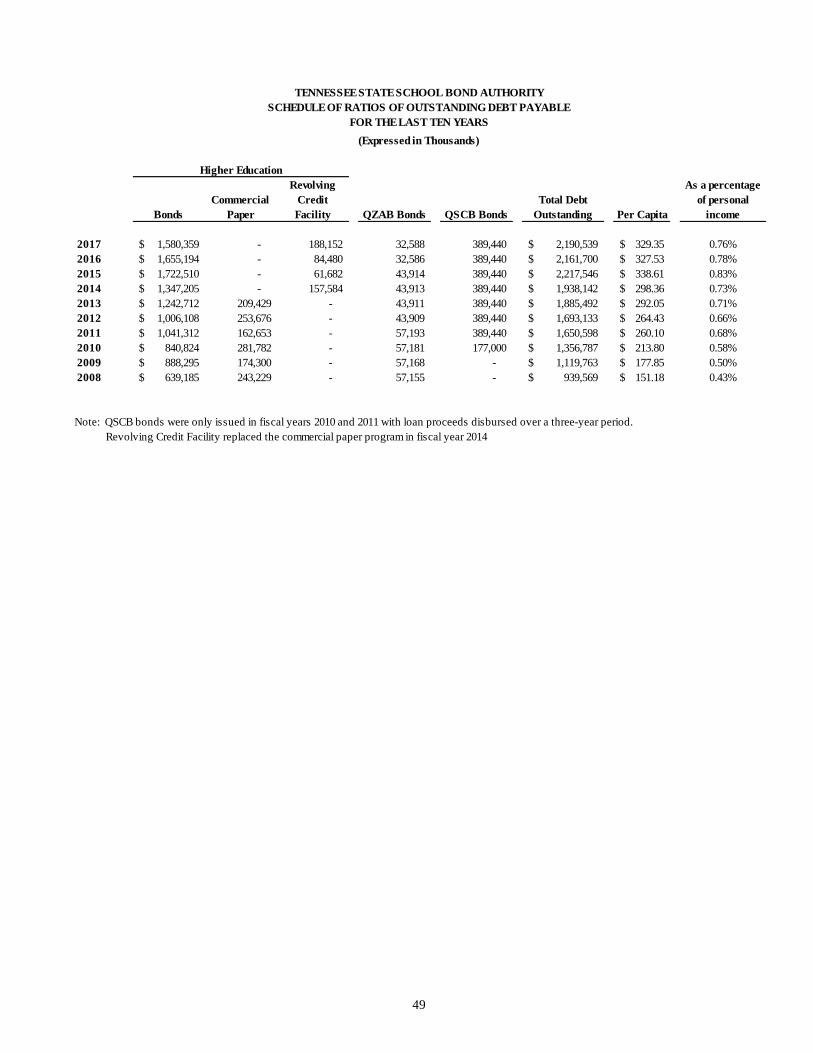
49
Bonds
Commercial
Paper
Revolving
Credit
Facility QZAB Bonds QSCB Bonds
Total Debt
Outstanding Per Capita
As a percentage
of personal
income
2017 1,580,359$ - 188,152 32,588 389,440 2,190,539$ 329.35$ 0.76%
2016 1,655,194$ - 84,480 32,586 389,440 2,161,700$ 327.53$ 0.78%
2015 1,722,510$ - 61,682 43,914 389,440 2,217,546$ 338.61$ 0.83%
2014 1,347,205$ - 157,584 43,913 389,440 1,938,142$ 298.36$ 0.73%
2013 1,242,712$ 209,429 - 43,911 389,440 1,885,492$ 292.05$ 0.71%
2012 1,006,108$ 253,676 - 43,909 389,440 1,693,133$ 264.43$ 0.66%
2011 1,041,312$ 162,653 - 57,193 389,440 1,650,598$ 260.10$ 0.68%
2010 840,824$ 281,782 - 57,181 177,000 1,356,787$ 213.80$ 0.58%
2009 888,295$ 174,300 - 57,168 - 1,119,763$ 177.85$ 0.50%
2008 639,185$ 243,229 - 57,155 - 939,569$ 151.18$ 0.43%
Note: QSCB bonds were only issued in fiscal years 2010 and 2011 with loan proceeds disbursed over a three-year period.
Revolving Credit Facility replaced the commercial paper program in fiscal year 2014
Higher Education
TENNESSEE STATE SCHOOL BOND AUTHORITY
SCHEDULE OF RATIOS OF OUTSTANDING DEBT PAYABLE
FOR THE LAST TEN YEARS
(Expressed in Thousands)

50
ALLOCABLE DEBT TO BORROWERS
The Tennessee State School Bond Authority (“Authority”) is a corporate governmental agency and instrumentality of the State of
Tennessee which was created to provide a means of financing projects for its borrowers through the issuance of debt. The
Authority consists of three different programs: Higher Education Facilities Program, Qualified Zone Academy Bond Program,
and Qualified School Construction Bond Program. The following charts present each borrower’s allocable amount of the
outstanding debt of each program under the Authority. The allocable debt to the borrower is equal to the amount of outstanding
loans to the borrowers. The allocable debt would not include certain debt proceeds issued by the Authority that are held on
deposit for the borrowers in the form of debt service reserve funds, capitalized interest funds, and unspent construction funds. In
addition, the allocable debt would not include borrowers’ debt service payments held on deposit in sinking funds. Amounts held
on deposit are available for the Authority to pay debt service when needed.
The following charts present the allocable debt for each borrower on a per capita basis. In the case of the Higher Education
Facilities Program, this amount is expressed on a per student basis – as measured by the Fall Term Full-Time Enrollment (“FTE”)
of each respective higher education institution. In the case of the Qualified Zone Academy Bonds Program and Qualified School
Construction Bonds Program, this amount is expressed on a per resident basis for the county of each respective school district.
*The 2017 Debt per FTE is based on 2016 FTE since 2017 FTE was not available by the date of this CAFR.
Fiscal
Year
Total
Allocable Debt
Debt Per
FTE*
Total
Allocable Debt
Debt Per
FTE*
2017 926,055$ 21.23 668,991$ 5.20
2016 873,910 20.03 681,136 5.29
2015 767,865 17.63 712,729 5.50
2014 694,598 16.01 696,948 5.47
2013 633,813 14.58 667,501 5.12
2012 567,280 12.61 597,900 4.41
2011 532,436 12.08 575,205 4.11
2010 545,156 12.45 526,573 3.74
2009 518,244 11.91 481,122 3.60
2008 461,963 10.80 397,693 3.27
Tennessee Board of Regents
ALLOCABLE DEBT TO BORROWERS PER FTE*
FOR THE LAST TEN YEARS
TENNESSEE STATE SCHOOL BOND AUTHORITY
HIGHER EDUCATION FACILITIES PROGRAMS
(Expressed in Thousands)
University of Tennessee

51
Note: QZAB Bonds were last issued in fiscal year 2006 1 Per Capita for Fiscal Years ending June 30, 2010 through June 30, 2017 are calculated based on the 2010 Census 2 Per Capita for Fiscal Years ending June 30, 2005 through June 30, 2009 are calculated based on the 2000 Census 3 Loan amounts are pulled from the receivable schedule
Loans
Debt Per
Capita1
Loans
Debt Per
Capita1
Loans
Debt Per
Capita1
Loans
Debt Per
Capita1
Loans
Debt Per
Capita1
Benton County 60$ 3.77$ 76$ 4.75$ 90$ 5.63$ 106$ 6.63$ 118$ 7.38$
Blount County 135 1.10 192 1.56 248 2.02 302 2.46 354 2.88
Hamilton County 20 0.06 123 0.37 223 0.66 321 0.96 419 1.25
Humboldt City - - - - 156 19.50 314 39.25 471 58.88
Kingsport City 971 20.23 5,735 119.48 2,141 44.60 2,488 51.83 2,808 58.50
Knox County - - - - - - - - - -
Lexington City 333 41.61 417 52.13 499 62.38 578 72.25 656 82.00
Lincoln County - - - - - - - - - -
Loudon County 1,221 24.92 1,529 31.20 1,826 37.27 2,137 43.61 2,389 48.76
Memphis City - - - - 410 0.63 957 1.48 1,503 2.32
Montgomery County - - - - 1,838 10.69 2,307 13.41 2,721 15.82
Nashville-Davidson County 1,047 1.67 1,513 2.41 1,961 3.13 2,428 3.87 2,808 4.48
Oak Ridge City 301 10.38 378 13.03 3,363 115.97 3,905 134.66 4,417 152.31
Rhea County 46 1.45 192 6.00 229 7.16 268 8.38 299 9.34
Scott County - - - - - - - - - -
Unicoi County - - - - - - - - - -
ALLOCABLE DEBT TO BORROWERS PER CAPITA
QUALIFIED ZONE ACADEMY BONDS PROGRAM
FOR THE LAST TEN YEARS
(Debt Expressed in Thousands)
2017 2016 201320142015
TENNESSEE STATE SCHOOL BOND AUTHORITY
Loans
Debt Per
Capita1
Loans
Debt Per
Capita1
Loans
Debt Per
Capita1
Loans
Debt Per
Capita2
Loans
Debt Per
Capita2
Benton County 131$ 8.19$ 144$ 9.00$ 156$ 9.75$ 168$ 9.88$ 179$ 10.53$
Blount County 409 3.33 453 3.68 501 4.07 546 5.15 588 5.55
Hamilton County 517 1.54 614 1.83 713 2.12 812 2.64 917 2.98
Humboldt City 629 78.63 786 98.25 942 117.75 1,088 120.89 1,227 136.33
Kingsport City 3,146 65.54 3,469 72.27 3,802 79.21 4,121 91.58 4,424 98.31
Knox County - - 211 0.49 423 0.98 617 1.62 798 2.09
Lexington City 737 92.13 803 100.38 874 109.25 942 134.57 1,008 144.00
Lincoln County - - - - - - - - - -
Loudon County 2,656 54.20 2,913 59.45 3,161 64.51 3,400 87.18 3,628 93.03
Memphis City 2,051 3.17 2,304 3.56 2,850 4.40 3,364 5.18 3,898 6.00
Montgomery County 3,149 18.31 3,566 20.73 3,975 23.11 4,271 31.64 4,451 32.97
Nashville-Davidson County 3,210 5.12 3,597 5.74 3,971 6.33 4,316 7.57 4,461 7.83
Oak Ridge City 4,959 171.00 5,409 186.52 5,882 202.83 6,341 234.85 6,744 249.78
Rhea County 333 10.41 441 13.78 548 17.13 648 23.14 742 26.50
Scott County - - - - - - - - - -
Unicoi County - - 222 12.33 418 23.22 605 33.61 789 43.83
2012 2011 2010 2009 2008
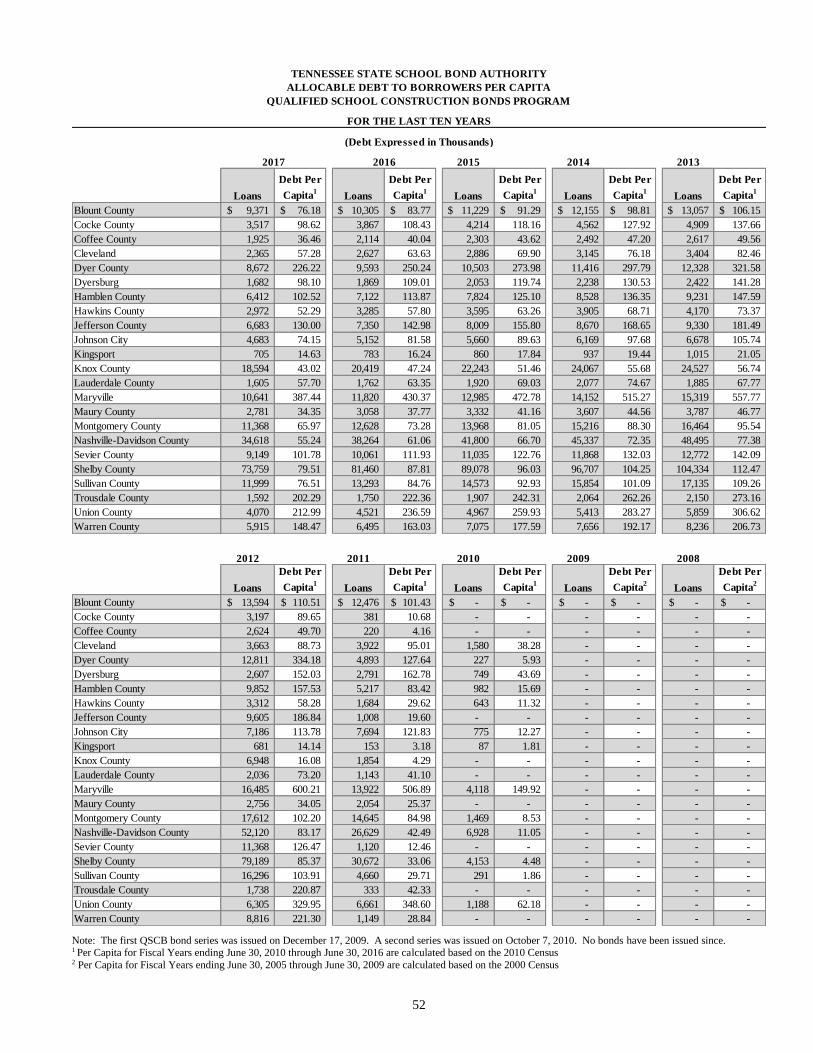
52
Note: The first QSCB bond series was issued on December 17, 2009. A second series was issued on October 7, 2010. No bonds have been issued since. 1 Per Capita for Fiscal Years ending June 30, 2010 through June 30, 2016 are calculated based on the 2010 Census 2 Per Capita for Fiscal Years ending June 30, 2005 through June 30, 2009 are calculated based on the 2000 Census
2015 2014 2013
Loans
Debt Per
Capita1
Loans
Debt Per
Capita1
Loans
Debt Per
Capita1
Loans
Debt Per
Capita1
Loans
Debt Per
Capita1
Blount County 9,371$ 76.18$ 10,305$ 83.77$ 11,229$ 91.29$ 12,155$ 98.81$ 13,057$ 106.15$
Cocke County 3,517 98.62 3,867 108.43 4,214 118.16 4,562 127.92 4,909 137.66
Coffee County 1,925 36.46 2,114 40.04 2,303 43.62 2,492 47.20 2,617 49.56
Cleveland 2,365 57.28 2,627 63.63 2,886 69.90 3,145 76.18 3,404 82.46
Dyer County 8,672 226.22 9,593 250.24 10,503 273.98 11,416 297.79 12,328 321.58
Dyersburg 1,682 98.10 1,869 109.01 2,053 119.74 2,238 130.53 2,422 141.28
Hamblen County 6,412 102.52 7,122 113.87 7,824 125.10 8,528 136.35 9,231 147.59
Hawkins County 2,972 52.29 3,285 57.80 3,595 63.26 3,905 68.71 4,170 73.37
Jefferson County 6,683 130.00 7,350 142.98 8,009 155.80 8,670 168.65 9,330 181.49
Johnson City 4,683 74.15 5,152 81.58 5,660 89.63 6,169 97.68 6,678 105.74
Kingsport 705 14.63 783 16.24 860 17.84 937 19.44 1,015 21.05
Knox County 18,594 43.02 20,419 47.24 22,243 51.46 24,067 55.68 24,527 56.74
Lauderdale County 1,605 57.70 1,762 63.35 1,920 69.03 2,077 74.67 1,885 67.77
Maryville 10,641 387.44 11,820 430.37 12,985 472.78 14,152 515.27 15,319 557.77
Maury County 2,781 34.35 3,058 37.77 3,332 41.16 3,607 44.56 3,787 46.77
Montgomery County 11,368 65.97 12,628 73.28 13,968 81.05 15,216 88.30 16,464 95.54
Nashville-Davidson County 34,618 55.24 38,264 61.06 41,800 66.70 45,337 72.35 48,495 77.38
Sevier County 9,149 101.78 10,061 111.93 11,035 122.76 11,868 132.03 12,772 142.09
Shelby County 73,759 79.51 81,460 87.81 89,078 96.03 96,707 104.25 104,334 112.47
Sullivan County 11,999 76.51 13,293 84.76 14,573 92.93 15,854 101.09 17,135 109.26
Trousdale County 1,592 202.29 1,750 222.36 1,907 242.31 2,064 262.26 2,150 273.16
Union County 4,070 212.99 4,521 236.59 4,967 259.93 5,413 283.27 5,859 306.62
Warren County 5,915 148.47 6,495 163.03 7,075 177.59 7,656 192.17 8,236 206.73
(Debt Expressed in Thousands)
2017 2016
TENNESSEE STATE SCHOOL BOND AUTHORITY
ALLOCABLE DEBT TO BORROWERS PER CAPITA
QUALIFIED SCHOOL CONSTRUCTION BONDS PROGRAM
FOR THE LAST TEN YEARS
2012 2011 2010 2009 2008
Loans
Debt Per
Capita1
Loans
Debt Per
Capita1
Loans
Debt Per
Capita1
Loans
Debt Per
Capita2
Loans
Debt Per
Capita2
Blount County 13,594$ 110.51$ 12,476$ 101.43$ -$ -$ -$ -$ -$ -$
Cocke County 3,197 89.65 381 10.68 - - - - - -
Coffee County 2,624 49.70 220 4.16 - - - - - -
Cleveland 3,663 88.73 3,922 95.01 1,580 38.28 - - - -
Dyer County 12,811 334.18 4,893 127.64 227 5.93 - - - -
Dyersburg 2,607 152.03 2,791 162.78 749 43.69 - - - -
Hamblen County 9,852 157.53 5,217 83.42 982 15.69 - - - -
Hawkins County 3,312 58.28 1,684 29.62 643 11.32 - - - -
Jefferson County 9,605 186.84 1,008 19.60 - - - - - -
Johnson City 7,186 113.78 7,694 121.83 775 12.27 - - - -
Kingsport 681 14.14 153 3.18 87 1.81 - - - -
Knox County 6,948 16.08 1,854 4.29 - - - - - -
Lauderdale County 2,036 73.20 1,143 41.10 - - - - - -
Maryville 16,485 600.21 13,922 506.89 4,118 149.92 - - - -
Maury County 2,756 34.05 2,054 25.37 - - - - - -
Montgomery County 17,612 102.20 14,645 84.98 1,469 8.53 - - - -
Nashville-Davidson County 52,120 83.17 26,629 42.49 6,928 11.05 - - - -
Sevier County 11,368 126.47 1,120 12.46 - - - - - -
Shelby County 79,189 85.37 30,672 33.06 4,153 4.48 - - - -
Sullivan County 16,296 103.91 4,660 29.71 291 1.86 - - - -
Trousdale County 1,738 220.87 333 42.33 - - - - - -
Union County 6,305 329.95 6,661 348.60 1,188 62.18 - - - -
Warren County 8,816 221.30 1,149 28.84 - - - - - -

53
UNIVERSITY OF TENNESSEE SYSTEM
Prior and Subordinate Debt Service
Fiscal Total Fees Legislative Debt Service Requirements Requirements2
Year and Charges Appropriations1
(Non Authority) (Authority Bonds)
2017 780,867$ 527,569$ -$ 73,608$
2016 746,986 499,862 - 73,722
2015 700,757 475,416 - 55,553
2014 691,600 467,845 - 55,821
2013 609,399 432,636 - 52,859
2012 584,147 411,729 - 51,469
2011 685,003 548,787 - 48,256
2010 648,298 493,304 12 43,998
2009 599,973 476,333 35 35,373
2008 565,963 510,261 35 29,158
TENNESSEE BOARD OF REGENTS SYSTEM
Prior and Subordinate Debt Service
Fiscal Total Fees Legislative Debt Service Requirements Requirements2
Year and Charges Appropriations1
(Non Authority) (Authority Bonds)
2017 1,131,352$ 750,764$ -$ 57,029$
2016 1,102,572 660,789 - 57,511
2015 1,158,289 578,734 - 52,405
2014 1,057,701 644,437 - 53,349
2013 1,035,821 621,841 - 49,484
2012 1,216,903 501,867 1,399 45,016
2011 1,143,916 660,608 1,399 43,367
2010 1,039,268 633,006 1,399 43,120
2009 923,813 610,380 1,699 31,997
2008 863,336 645,952 1,889 27,556
Source - Tennessee State School Bond Authority and Universities and Colleges (Unaudited)
1 Appropriations for operation and maintenance, including employer social security and retirement contributions,
for the respective systems (including the respective schools and Boards).
2 Debt Service Requirements consist of only principal and interest.
SCHEDULE OF FEES/CHARGES, LEGISLATIVE APPROPRIATIONS AND DEBT SERVICE
TENNESSEE STATE SCHOOL BOND AUTHORITY
(Expressed in Thousands)
FOR THE LAST TEN YEARS
COLLEGE AND UNIVERSITY FUNDS
(EXCLUDING COMMERCIAL PAPER)
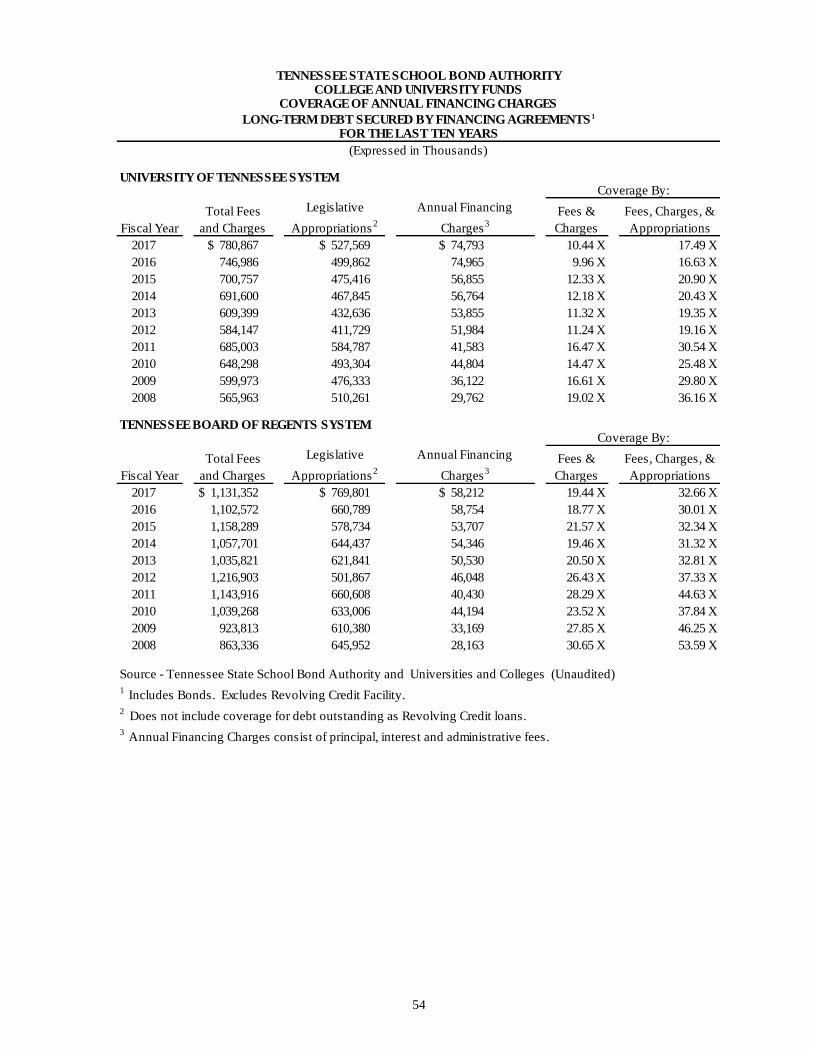
54
UNIVERSITY OF TENNESSEE SYSTEM
Fiscal Year
Total Fees
and Charges
Legislative
Appropriations2
Annual Financing
Charges3
Fees &
Charges
Fees, Charges, &
Appropriations
2017 $ 780,867 $ 527,569 $ 74,793 10.44 X 17.49 X
2016 746,986 499,862 74,965 9.96 X 16.63 X
2015 700,757 475,416 56,855 12.33 X 20.90 X
2014 691,600 467,845 56,764 12.18 X 20.43 X
2013 609,399 432,636 53,855 11.32 X 19.35 X
2012 584,147 411,729 51,984 11.24 X 19.16 X
2011 685,003 584,787 41,583 16.47 X 30.54 X
2010 648,298 493,304 44,804 14.47 X 25.48 X
2009 599,973 476,333 36,122 16.61 X 29.80 X
2008 565,963 510,261 29,762 19.02 X 36.16 X
TENNESSEE BOARD OF REGENTS SYSTEM
Fiscal Year
Total Fees
and Charges
Legislative
Appropriations2
Annual Financing
Charges3
Fees &
Charges
Fees, Charges, &
Appropriations
2017 $ 1,131,352 $ 769,801 $ 58,212 19.44 X 32.66 X
2016 1,102,572 660,789 58,754 18.77 X 30.01 X
2015 1,158,289 578,734 53,707 21.57 X 32.34 X
2014 1,057,701 644,437 54,346 19.46 X 31.32 X
2013 1,035,821 621,841 50,530 20.50 X 32.81 X
2012 1,216,903 501,867 46,048 26.43 X 37.33 X
2011 1,143,916 660,608 40,430 28.29 X 44.63 X
2010 1,039,268 633,006 44,194 23.52 X 37.84 X
2009 923,813 610,380 33,169 27.85 X 46.25 X
2008 863,336 645,952 28,163 30.65 X 53.59 X
Source - Tennessee State School Bond Authority and Universities and Colleges (Unaudited)
1 Includes Bonds. Excludes Revolving Credit Facility.
2 Does not include coverage for debt outstanding as Revolving Credit loans.
3 Annual Financing Charges consist of principal, interest and administrative fees.
Coverage By:
LONG-TERM DEBT SECURED BY FINANCING AGREEMENTS 1
(Expressed in Thousands)
TENNESSEE STATE SCHOOL BOND AUTHORITY
COVERAGE OF ANNUAL FINANCING CHARGESCOLLEGE AND UNIVERSITY FUNDS
FOR THE LAST TEN YEARS
Coverage By:

55
BENTON COUNTY SCHOOLS
Fiscal QZAB Other Pledged Total State Shared
Year Obligations Obligations 3
Obligations Taxes Coverage
2017 14 62 76 3,471 45.67 X
2016 14 62 76 3,486 45.87 X
2015 14 62 76 3,394 44.66 X
2014 14 62 76 3,285 43.23 X
2013 14 62 76 3,322 43.72 X
2012 14 62 76 3,356 44.16 X
2011 14 62 76 3,282 43.19 X
2010 14 62 76 3,192 42.00 X
2009 14 64 78 3,013 38.63 X
2008 14 170 184 2,982 16.21 X
BLOUNT COUNTY SCHOOLS
Fiscal QZAB Other Pledged Total State Shared
Year Obligations Obligations 3
Obligations Taxes Coverage
2017 51 1,647 1,698 5,110 3.01 X
2016 51 1,647 1,698 5,069 2.99 X
2015 51 1,647 1,698 4,765 2.81 X
2014 51 1,647 1,698 4,862 2.86 X
2013 51 1,647 1,698 4,766 2.81 X
2012 51 1,465 1,516 4,711 3.11 X
2011 51 633 684 4,475 6.54 X
2010 51 - 51 4,488 88.01 X
2009 51 - 51 4,597 90.14 X
2008 51 - 51 4,376 85.80 X
HAMILTON COUNTY SCHOOLS
Fiscal QZAB Other Pledged Total State Shared
Year Obligations Obligations 3
Obligations Taxes Coverage
2017 91 153 244 10,141 41.56 X
2016 91 153 244 9,950 40.83 X
2015 91 596 687 9,382 13.66 X
2014 91 596 687 9,073 13.21 X
2013 91 596 687 8,884 12.94 X
2012 91 596 687 9,245 13.46 X
2011 91 596 687 8,691 12.65 X
2010 91 596 687 8,961 13.04 X
2009 91 596 687 8,602 12.53 X
2008 91 596 687 8,510 12.39 X
(Continued)
DEBT SERVICE COVERAGE
FOR THE LAST TEN YEARS
QUALIFIED ZONE ACADEMY BONDS PROGRAM
TENNESSEE STATE SCHOOL BOND AUTHORITY
STATE SHARED TAX OBLIGATIONS
STATE SHARED TAX OBLIGATIONS
(Expressed in Thousands)
STATE SHARED TAX OBLIGATIONS
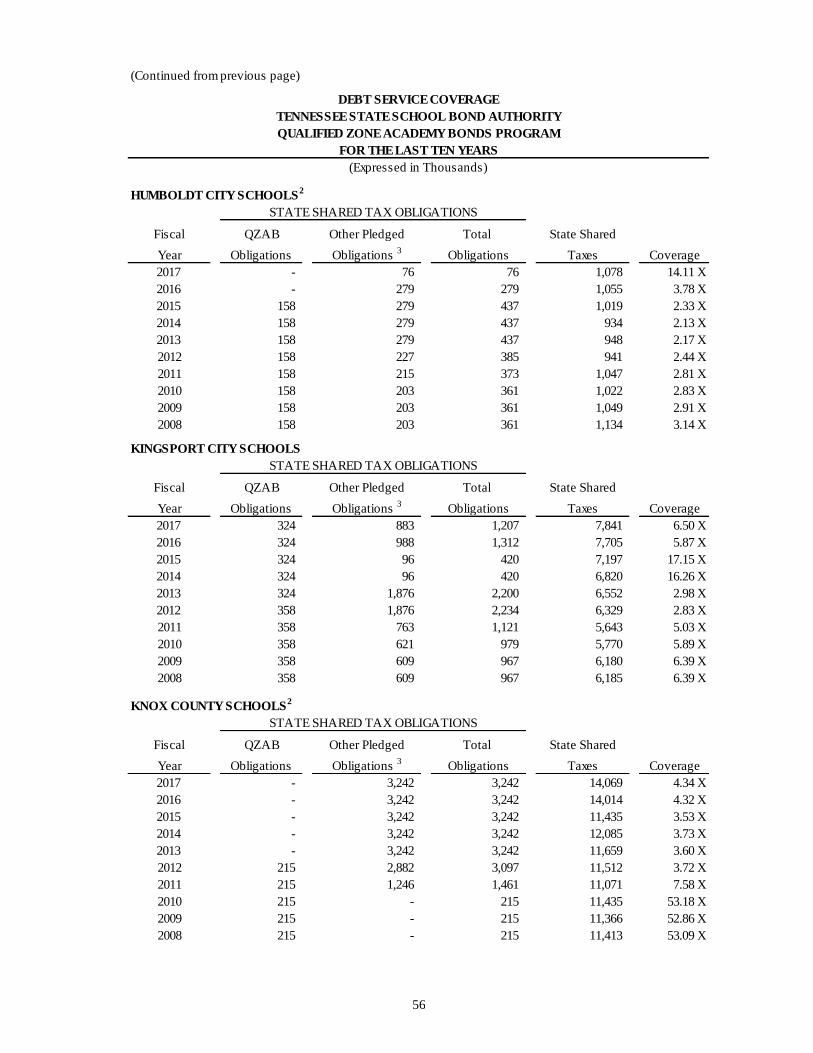
56
(Continued from previous page)
HUMBOLDT CITY SCHOOLS2
Fiscal QZAB Other Pledged Total State Shared
Year Obligations Obligations 3
Obligations Taxes Coverage
2017 - 76 76 1,078 14.11 X
2016 - 279 279 1,055 3.78 X
2015 158 279 437 1,019 2.33 X
2014 158 279 437 934 2.13 X
2013 158 279 437 948 2.17 X
2012 158 227 385 941 2.44 X
2011 158 215 373 1,047 2.81 X
2010 158 203 361 1,022 2.83 X
2009 158 203 361 1,049 2.91 X
2008 158 203 361 1,134 3.14 X
KINGSPORT CITY SCHOOLS
Fiscal QZAB Other Pledged Total State Shared
Year Obligations Obligations 3
Obligations Taxes Coverage
2017 324 883 1,207 7,841 6.50 X
2016 324 988 1,312 7,705 5.87 X
2015 324 96 420 7,197 17.15 X
2014 324 96 420 6,820 16.26 X
2013 324 1,876 2,200 6,552 2.98 X
2012 358 1,876 2,234 6,329 2.83 X
2011 358 763 1,121 5,643 5.03 X
2010 358 621 979 5,770 5.89 X
2009 358 609 967 6,180 6.39 X
2008 358 609 967 6,185 6.39 X
KNOX COUNTY SCHOOLS2
Fiscal QZAB Other Pledged Total State Shared
Year Obligations Obligations 3
Obligations Taxes Coverage
2017 - 3,242 3,242 14,069 4.34 X
2016 - 3,242 3,242 14,014 4.32 X
2015 - 3,242 3,242 11,435 3.53 X
2014 - 3,242 3,242 12,085 3.73 X
2013 - 3,242 3,242 11,659 3.60 X
2012 215 2,882 3,097 11,512 3.72 X
2011 215 1,246 1,461 11,071 7.58 X
2010 215 - 215 11,435 53.18 X
2009 215 - 215 11,366 52.86 X
2008 215 - 215 11,413 53.09 X
QUALIFIED ZONE ACADEMY BONDS PROGRAM
TENNESSEE STATE SCHOOL BOND AUTHORITY
DEBT SERVICE COVERAGE
FOR THE LAST TEN YEARS
(Expressed in Thousands)
STATE SHARED TAX OBLIGATIONS
STATE SHARED TAX OBLIGATIONS
STATE SHARED TAX OBLIGATIONS
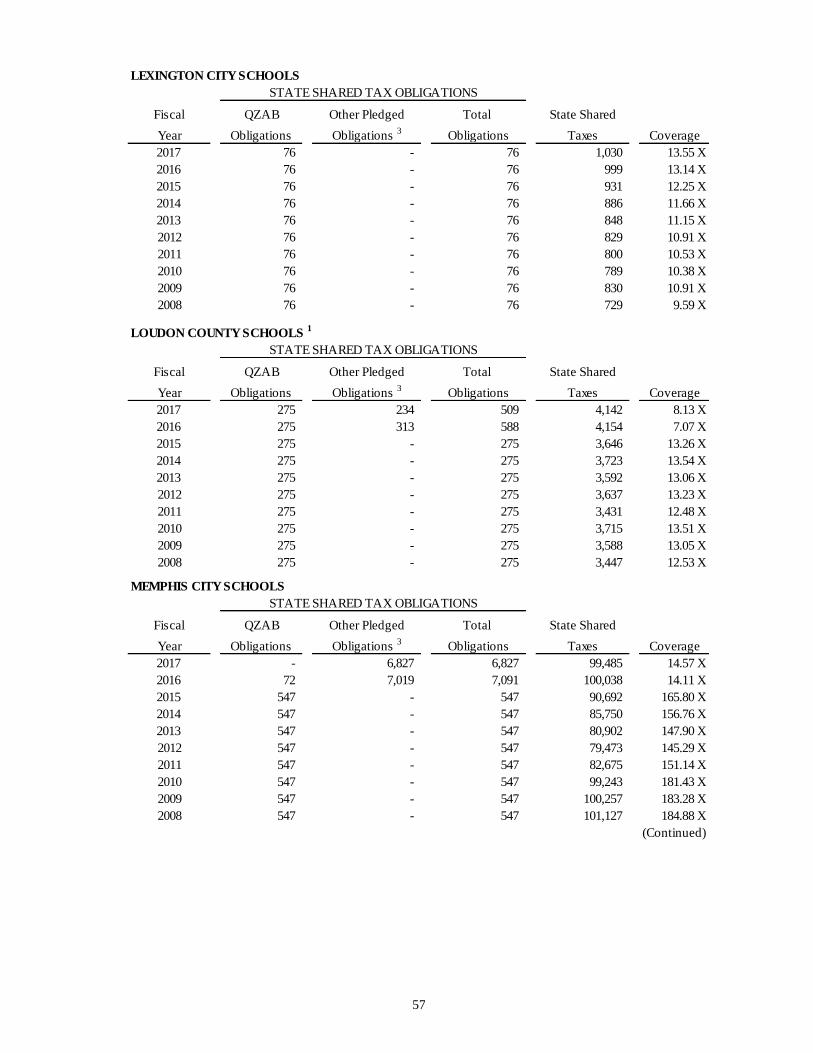
57
LEXINGTON CITY SCHOOLS
Fiscal QZAB Other Pledged Total State Shared
Year Obligations Obligations 3
Obligations Taxes Coverage
2017 76 - 76 1,030 13.55 X
2016 76 - 76 999 13.14 X
2015 76 - 76 931 12.25 X
2014 76 - 76 886 11.66 X
2013 76 - 76 848 11.15 X
2012 76 - 76 829 10.91 X
2011 76 - 76 800 10.53 X
2010 76 - 76 789 10.38 X
2009 76 - 76 830 10.91 X
2008 76 - 76 729 9.59 X
LOUDON COUNTY SCHOOLS 1
Fiscal QZAB Other Pledged Total State Shared
Year Obligations Obligations 3
Obligations Taxes Coverage
2017 275 234 509 4,142 8.13 X
2016 275 313 588 4,154 7.07 X
2015 275 - 275 3,646 13.26 X
2014 275 - 275 3,723 13.54 X
2013 275 - 275 3,592 13.06 X
2012 275 - 275 3,637 13.23 X
2011 275 - 275 3,431 12.48 X
2010 275 - 275 3,715 13.51 X
2009 275 - 275 3,588 13.05 X
2008 275 - 275 3,447 12.53 X
MEMPHIS CITY SCHOOLS
Fiscal QZAB Other Pledged Total State Shared
Year Obligations Obligations 3
Obligations Taxes Coverage
2017 - 6,827 6,827 99,485 14.57 X
2016 72 7,019 7,091 100,038 14.11 X
2015 547 - 547 90,692 165.80 X
2014 547 - 547 85,750 156.76 X
2013 547 - 547 80,902 147.90 X
2012 547 - 547 79,473 145.29 X
2011 547 - 547 82,675 151.14 X
2010 547 - 547 99,243 181.43 X
2009 547 - 547 100,257 183.28 X
2008 547 - 547 101,127 184.88 X
(Continued)
STATE SHARED TAX OBLIGATIONS
STATE SHARED TAX OBLIGATIONS
STATE SHARED TAX OBLIGATIONS

58
(Continued from previous page)
MONTGOMERY COUNTY SCHOOLS
Fiscal QZAB Other Pledged Total State Shared
Year Obligations Obligations 3
Obligations Taxes Coverage
2017 260 1,551 1,811 5,148 2.84 X
2016 260 1,551 1,811 5,125 2.83 X
2015 436 1,551 1,987 4,945 2.49 X
2014 436 1,551 1,987 4,824 2.43 X
2013 436 1,551 1,987 4,815 2.42 X
2012 436 1,551 1,987 4,806 2.42 X
2011 436 1,343 1,779 4,489 2.52 X
2010 436 200 636 4,348 6.84 X
2009 436 - 436 4,164 9.55 X
2008 436 - 436 4,231 9.70 X
NASHVILLE - DAVIDSON COUNTY SCHOOLS 1
Fiscal QZAB Other Pledged Total State Shared
Year Obligations Obligations 3,4
Obligations Taxes Coverage
2017 415 5,580 5,995 99,009 16.52 X
2016 415 5,580 5,995 100,038 16.69 X
2015 415 5,580 5,995 90,280 15.06 X
2014 415 5,580 5,995 86,077 14.36 X
2013 415 5,580 5,995 77,201 12.88 X
2012 415 31,369 31,784 77,093 2.43 X
2011 415 29,160 29,575 69,820 2.36 X
2010 415 26,438 26,853 71,367 2.66 X
2009 415 24,144 24,559 75,512 3.07 X
2008 415 25,788 26,203 78,039 2.98 X
OAK RIDGE CITY SCHOOLS
Fiscal QZAB Other Pledged Total State Shared
Year Obligations Obligations 3
Obligations Taxes Coverage
2017 510 1,068 1,578 4,600 2.91 X
2016 510 1,068 1,578 4,612 2.92 X
2015 510 188 698 4,256 6.10 X
2014 510 1,203 1,713 3,998 2.33 X
2013 510 1,203 1,713 3,880 2.26 X
2012 510 1,420 1,930 3,812 1.98 X
2011 510 1,203 1,713 3,569 2.08 X
2010 510 1,203 1,713 3,652 2.13 X
2009 510 1,219 1,729 3,771 2.18 X
2008 510 1,219 1,729 3,965 2.29 X
STATE SHARED TAX OBLIGATIONS
FOR THE LAST EIGHT YEARS
(Expressed in Thousands)
STATE SHARED TAX OBLIGATIONS
STATE SHARED TAX OBLIGATIONS
DEBT SERVICE COVERAGE
TENNESSEE STATE SCHOOL BOND AUTHORITY
QUALIFIED ZONE ACADEMY BOND PROGRAM
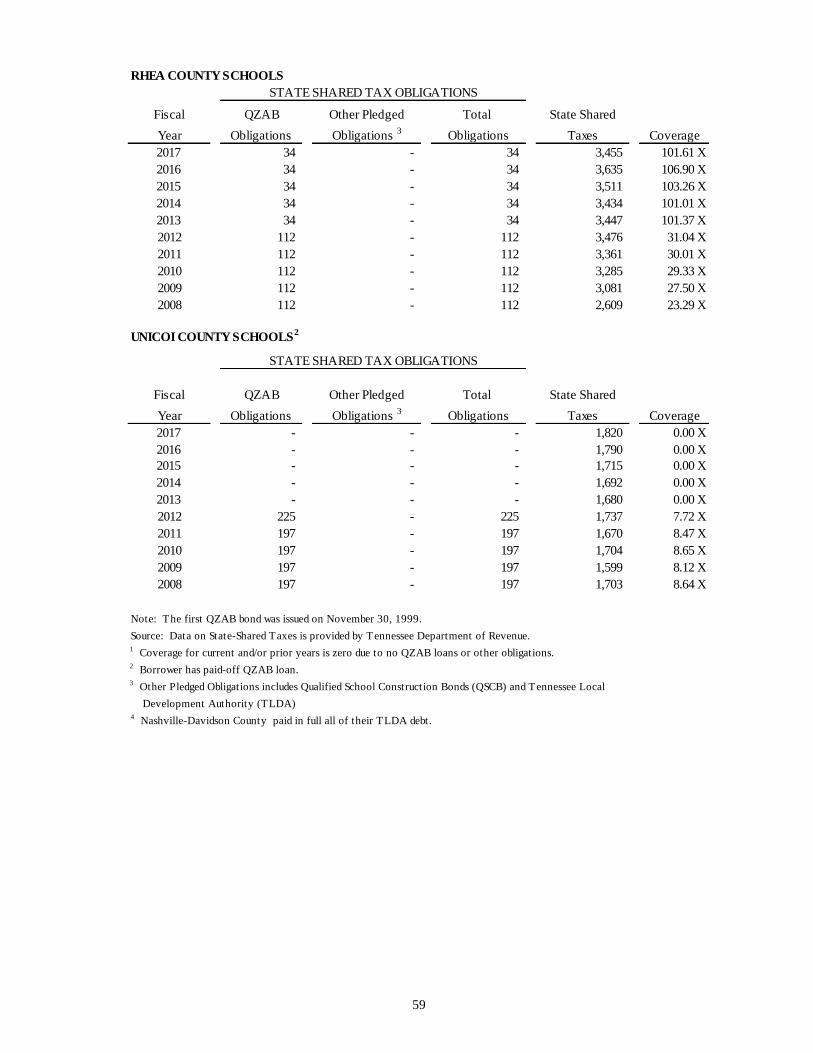
59
RHEA COUNTY SCHOOLS
Fiscal QZAB Other Pledged Total State Shared
Year Obligations Obligations 3
Obligations Taxes Coverage
2017 34 - 34 3,455 101.61 X
2016 34 - 34 3,635 106.90 X
2015 34 - 34 3,511 103.26 X
2014 34 - 34 3,434 101.01 X
2013 34 - 34 3,447 101.37 X
2012 112 - 112 3,476 31.04 X
2011 112 - 112 3,361 30.01 X
2010 112 - 112 3,285 29.33 X
2009 112 - 112 3,081 27.50 X
2008 112 - 112 2,609 23.29 X
UNICOI COUNTY SCHOOLS2
Fiscal QZAB Other Pledged Total State Shared
Year Obligations Obligations 3
Obligations Taxes Coverage
2017 - - - 1,820 0.00 X
2016 - - - 1,790 0.00 X
2015 - - - 1,715 0.00 X
2014 - - - 1,692 0.00 X
2013 - - - 1,680 0.00 X
2012 225 - 225 1,737 7.72 X
2011 197 - 197 1,670 8.47 X
2010 197 - 197 1,704 8.65 X
2009 197 - 197 1,599 8.12 X
2008 197 - 197 1,703 8.64 X
Note: The first QZAB bond was issued on November 30, 1999.
Source: Data on State-Shared Taxes is provided by Tennessee Department of Revenue.1 Coverage for current and/or prior years is zero due to no QZAB loans or other obligations.2 Borrower has paid-off QZAB loan.3 Other Pledged Obligations includes Qualified School Construction Bonds (QSCB) and Tennessee Local
Development Authority (TLDA)4 Nashville-Davidson County paid in full all of their TLDA debt.
STATE SHARED TAX OBLIGATIONS
STATE SHARED TAX OBLIGATIONS

60
BLOUNT COUNTY SCHOOLS
Fiscal QSCB Other Pledged Total State Shared
Year Obligations Obligations 2
Obligations Taxes Coverage
2016 1,647$ 51$ 1,698$ 5,069$ 2.99 X
2015 1,647 51 1,698 4,765 2.81 X
2014 1,647 51 1,698 4,862 2.86 X
2013 1,647 51 1,698 4,766 2.81 X
2012 1,465 51 1,516 4,711 3.11 X
2011 633 51 684 4,475 6.54 X
2010 - 51 51 4,488 88.01 X
2009 - 51 51 4,597 90.14 X
2008 - 51 51 4,376 85.80 X
2007 - 51 51 3,977 77.99 X
CLEVELAND CITY SCHOOLS 1
Fiscal QSCB Other Pledged Total State Shared
Year Obligations Obligations 2
Obligations Taxes Coverage
2016 323$ 834$ 1,156$ 7,471$ 6.46 X
2015 323 50 373 5,738 15.40 X
2014 323 50 373 5,658 15.18 X
2013 323 50 373 5,557 14.91 X
2012 323 50 373 5,253 14.10 X
2011 279 21 300 4,736 15.78 X
2010 42 - 42 5,327 127.84 X
2009 - - - - 0.00 X
2008 - - - - 0.00 X
2007 - - - - 0.00 X
COCKE COUNTY SCHOOLS1
Fiscal QSCB Other Pledged Total State Shared
Year Obligations Obligations 2
Obligations Taxes Coverage
2016 618$ -$ 618$ 2,753$ 4.45 X
2015 618 - 618 2,648 4.28 X
2014 618 - 618 2,595 4.20 X
2013 618 - 618 2,601 4.21 X
2012 550 - 550 2,610 4.75 X
2011 238 - 238 2,594 10.92 X
2010 - - - - 0.00 X
2009 - - - - 0.00 X
2008 - - - - 0.00 X
2007 - - - - 0.00 X
STATE SHARED TAX OBLIGATIONS
STATE SHARED TAX OBLIGATIONS
DEBT SERVICE COVERAGE
TENNESSEE STATE SCHOOL BOND AUTHORITY
QUALIFIED SCHOOL CONSTRUCTION BONDS PROGRAM
FOR THE LAST TEN YEARS
(Expressed in Thousands)
STATE SHARED TAX OBLIGATIONS

61
COFFEE COUNTY SCHOOLS1
Fiscal QSCB Other Pledged Total State Shared
Year Obligations Obligations 2
Obligations Taxes Coverage
2017 336 - 336 3,157 9.41 X
2016 336 - 336 3,150 9.38 X
2015 336 - 336 3,022 9.00 X
2014 336 - 336 2,957 8.81 X
2013 336 - 336 2,950 8.79 X
2012 298 - 298 2,987 10.01 X
2011 129 - 129 2,921 22.63 X
2010 - - - - 0.00 X
2009 - - - - 0.00 X
2008 - - - - 0.00 X
DYER COUNTY SCHOOLS1
Fiscal QSCB Other Pledged Total State Shared
Year Obligations Obligations 2
Obligations Taxes Coverage
2017 1,324 - 1,324 2,944 2.22 X
2016 1,324 - 1,324 2,929 2.21 X
2015 1,324 - 1,324 2,786 2.10 X
2014 1,324 - 1,324 2,714 2.05 X
2013 1,324 - 1,324 2,700 2.04 X
2012 1,254 - 1,254 2,718 2.17 X
2011 843 - 843 2,712 3.22 X
2010 90 - 90 2,662 29.67 X
2009 - - - - 0.00 X
2008 - - - - 0.00 X
DYERSBURG CITY SCHOOLS 1
Fiscal QSCB Other Pledged Total State Shared
Year Obligations Obligations 2
Obligations Taxes Coverage
2017 230 - 230 2,417 10.53 X
2016 230 - 230 2,360 10.28 X
2015 230 - 230 2,205 9.60 X
2014 230 - 230 2,066 9.00 X
2013 230 - 230 2,034 8.86 X
2012 230 - 230 2,042 8.89 X
2011 199 - 199 2,014 10.13 X
2010 30 - 30 2,035 68.63 X
2009 - - - - 0.00 X
2008 - - - - 0.00 X
(Continued)
STATE SHARED TAX OBLIGATIONS
STATE SHARED TAX OBLIGATIONS
STATE SHARED TAX OBLIGATIONS
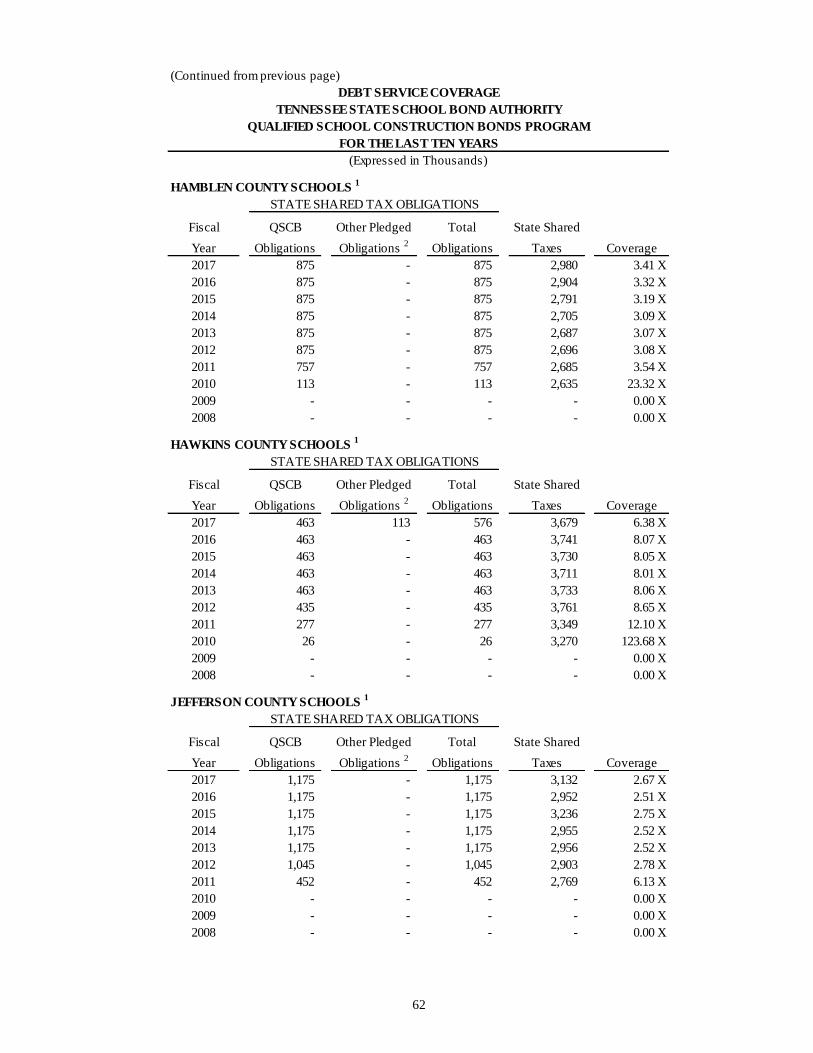
62
(Continued from previous page)
HAMBLEN COUNTY SCHOOLS 1
Fiscal QSCB Other Pledged Total State Shared
Year Obligations Obligations 2
Obligations Taxes Coverage
2017 875 - 875 2,980 3.41 X
2016 875 - 875 2,904 3.32 X
2015 875 - 875 2,791 3.19 X
2014 875 - 875 2,705 3.09 X
2013 875 - 875 2,687 3.07 X
2012 875 - 875 2,696 3.08 X
2011 757 - 757 2,685 3.54 X
2010 113 - 113 2,635 23.32 X
2009 - - - - 0.00 X
2008 - - - - 0.00 X
HAWKINS COUNTY SCHOOLS 1
Fiscal QSCB Other Pledged Total State Shared
Year Obligations Obligations 2
Obligations Taxes Coverage
2017 463 113 576 3,679 6.38 X
2016 463 - 463 3,741 8.07 X
2015 463 - 463 3,730 8.05 X
2014 463 - 463 3,711 8.01 X
2013 463 - 463 3,733 8.06 X
2012 435 - 435 3,761 8.65 X
2011 277 - 277 3,349 12.10 X
2010 26 - 26 3,270 123.68 X
2009 - - - - 0.00 X
2008 - - - - 0.00 X
JEFFERSON COUNTY SCHOOLS 1
Fiscal QSCB Other Pledged Total State Shared
Year Obligations Obligations 2
Obligations Taxes Coverage
2017 1,175 - 1,175 3,132 2.67 X
2016 1,175 - 1,175 2,952 2.51 X
2015 1,175 - 1,175 3,236 2.75 X
2014 1,175 - 1,175 2,955 2.52 X
2013 1,175 - 1,175 2,956 2.52 X
2012 1,045 - 1,045 2,903 2.78 X
2011 452 - 452 2,769 6.13 X
2010 - - - - 0.00 X
2009 - - - - 0.00 X
2008 - - - - 0.00 X
(Expressed in Thousands)
STATE SHARED TAX OBLIGATIONS
STATE SHARED TAX OBLIGATIONS
STATE SHARED TAX OBLIGATIONS
DEBT SERVICE COVERAGE
TENNESSEE STATE SCHOOL BOND AUTHORITY
QUALIFIED SCHOOL CONSTRUCTION BONDS PROGRAM
FOR THE LAST TEN YEARS

63
JOHNSON CITY SCHOOLS 1
Fiscal QSCB Other Pledged Total State Shared
Year Obligations Obligations 2
Obligations Taxes Coverage
2017 633 - 633 9,896 15.64 X
2016 633 - 633 9,067 14.33 X
2015 633 - 633 8,439 13.34 X
2014 633 - 633 8,167 12.91 X
2013 633 - 633 7,914 12.51 X
2012 633 - 633 7,777 12.29 X
2011 548 - 548 6,551 11.96 X
2010 82 - 82 7,145 87.42 X
2009 - - - - 0.00 X
2008 - - - - 0.00 X
KINGSPORT CITY SCHOOLS
Fiscal QSCB Other Pledged Total State Shared
Year Obligations Obligations 2,3
Obligations Taxes Coverage
2017 96 1,111 1,207 7,841 6.50 X
2016 96 1,216 1,312 7,705 5.87 X
2015 96 324 420 7,197 17.13 X
2014 96 324 420 6,820 16.23 X
2013 96 2,104 2,200 6,552 2.98 X
2012 96 2,138 2,234 6,329 2.83 X
2011 83 1,038 1,121 5,643 5.03 X
2010 12 967 979 5,770 5.89 X
2009 - 967 967 6,180 6.39 X
2008 - 967 967 6,185 6.40 X
KNOX COUNTY SCHOOLS
Fiscal QSCB Other Pledged Total State Shared
Year Obligations Obligations 2
Obligations Taxes Coverage
2017 3,242 - 3,242 14,069 4.34 X
2016 3,242 - 3,242 14,014 4.32 X
2015 3,242 - 3,242 11,435 3.53 X
2014 3,242 - 3,242 12,085 3.73 X
2013 3,242 - 3,242 11,659 3.60 X
2012 2,882 215 3,097 11,512 3.72 X
2011 1,246 215 1,461 11,071 7.58 X
2010 - 215 215 11,435 53.18 X
2009 - 215 215 11,366 52.86 X
2008 - 215 215 11,413 53.09 X
(Continued)
STATE SHARED TAX OBLIGATIONS
STATE SHARED TAX OBLIGATIONS
STATE SHARED TAX OBLIGATIONS

64
(Continued from previous page)
LAUDERDALE COUNTY SCHOOLS 1
Fiscal QSCB Other Pledged Total State Shared
Year Obligations Obligations 2
Obligations Taxes Coverage
2017 280 - 280 2,617 9.36 X
2016 280 - 280 2,581 9.22 X
2015 280 - 280 2,489 8.90 X
2014 280 - 280 2,426 8.67 X
2013 280 - 280 2,424 8.67 X
2012 249 - 249 2,449 9.85 X
2011 108 - 108 2,456 22.83 X
2010 - - - - 0.00 X
2009 - - - - 0.00 X
2008 - - - - 0.00 X
MARYVILLE CITY SCHOOLS 1
Fiscal QSCB Other Pledged Total State Shared
Year Obligations Obligations 2
Obligations Taxes Coverage
2017 1,452 141 1,593 4,226 2.65 X
2016 1,452 141 1,593 4,137 2.60 X
2015 1,452 141 1,593 3,758 2.36 X
2014 1,452 141 1,593 3,650 2.29 X
2013 1,452 141 1,593 3,395 2.13 X
2012 1,452 141 1,593 3,332 2.09 X
2011 1,257 - 1,257 2,870 2.28 X
2010 187 - 187 2,920 15.58 X
2009 - - - - 0.00 X
2008 - - - - 0.00 X
MAURY COUNTY SCHOOLS 1
Fiscal QSCB Other Pledged Total State Shared
Year Obligations Obligations 2
Obligations Taxes Coverage
2017 489 364 853 3,942 4.62 X
2016 489 364 853 3,897 4.57 X
2015 489 364 853 3,793 4.45 X
2014 489 364 853 3,746 4.39 X
2013 489 364 853 3,745 4.39 X
2012 435 364 799 3,720 4.66 X
2011 188 364 552 3,600 6.52 X
2010 - - - - 0.00 X
2009 - - - - 0.00 X
2008 - - - - 0.00 X
STATE SHARED TAX OBLIGATIONS
DEBT SERVICE COVERAGE
TENNESSEE STATE SCHOOL BOND AUTHORITY
QUALIFIED SCHOOL CONSTRUCTION BONDS PROGRAM
FOR THE LAST TEN YEARS
(Expressed in Thousands)
STATE SHARED TAX OBLIGATIONS
STATE SHARED TAX OBLIGATIONS

65
(Continued from previous page)
LAUDERDALE COUNTY SCHOOLS 1
Fiscal QSCB Other Pledged Total State Shared
Year Obligations Obligations 2
Obligations Taxes Coverage
2016 280$ -$ 280$ 2,581$ 9.22 X
2015 280 - 280 2,489 8.90 X
2014 280 - 280 2,426 8.67 X
2013 280 - 280 2,424 8.67 X
2012 249 - 249 2,449 9.85 X
2011 108 - 108 2,456 22.83 X
2010 - - - - 0.00 X
2009 - - - - 0.00 X
2008 - - - - 0.00 X
2007 - - - - 0.00 X
MARYVILLE CITY SCHOOLS 1
Fiscal QSCB Other Pledged Total State Shared
Year Obligations Obligations 2
Obligations Taxes Coverage
2016 1,452$ 141$ 1,593$ 4,137$ 2.60 X
2015 1,452 141 1,593 3,758 2.36 X
2014 1,452 141 1,593 3,650 2.29 X
2013 1,452 141 1,593 3,395 2.13 X
2012 1,452 141 1,593 3,332 2.09 X
2011 1,257 - 1,257 2,870 2.28 X
2010 187 - 187 2,920 15.58 X
2009 - - - - 0.00 X
2008 - - - - 0.00 X
2007 - - - - 0.00 X
MAURY COUNTY SCHOOLS 1
Fiscal QSCB Other Pledged Total State Shared
Year Obligations Obligations 2
Obligations Taxes Coverage
2016 489$ 364$ 853$ 3,897$ 4.57 X
2015 489 364 853 3,793 4.45 X
2014 489 364 853 3,746 4.39 X
2013 489 364 853 3,745 4.39 X
2012 435 364 799 3,720 4.66 X
2011 188 364 552 3,600 6.52 X
2010 - - - - 0.00 X
2009 - - - - 0.00 X
2008 - - - - 0.00 X
2007 - - - - 0.00 X
STATE SHARED TAX OBLIGATIONS
STATE SHARED TAX OBLIGATIONS
STATE SHARED TAX OBLIGATIONS
DEBT SERVICE COVERAGE
TENNESSEE STATE SCHOOL BOND AUTHORITY
QUALIFIED SCHOOL CONSTRUCTION BONDS PROGRAM
FOR THE LAST TEN YEARS
(Expressed in Thousands)

66
METROPOLITIAN GOVERNMENT OF NASHVILLE
Fiscal QSCB Other Pledged Total State Shared
Year Obligations Obligations 2,3
Obligations Taxes Coverage
2017 5,580 415 5,995 99,009 16.52 X
2016 5,580 415 5,995 100,038 16.69 X
2015 5,580 415 5,995 90,280 15.06 X
2014 5,580 415 5,995 86,077 14.36 X
2013 5,580 415 5,995 77,201 12.88 X
2012 5,143 26,641 31,784 77,093 2.43 X
2011 2,934 26,641 29,575 69,820 2.36 X
2010 212 26,641 26,853 71,367 2.66 X
2009 - 24,559 24,559 75,512 3.07 X
2008 - 26,203 26,203 78,039 2.98 X
MONTGOMERY COUNTY SCHOOLS
Fiscal QSCB Other Pledged Total State Shared
Year Obligations Obligations 2
Obligations Taxes Coverage
2017 1,551 260 1,811 5,148 2.84 X
2016 1,551 260 1,811 5,125 2.83 X
2015 1,551 436 1,987 4,945 2.49 X
2014 1,551 436 1,987 4,824 2.43 X
2013 1,551 436 1,987 4,815 2.42 X
2012 1,551 436 1,987 4,806 2.42 X
2011 1,343 436 1,779 4,348 2.44 X
2010 200 436 636 4,348 6.83 X
2009 - 436 436 4,164 9.55 X
2008 - 436 436 4,231 9.70 X
SEVIER COUNTY SCHOOLS 1
Fiscal QSCB Other Pledged Total State Shared
Year Obligations Obligations 2
Obligations Taxes Coverage
2017 1,608 - 1,608 4,369 2.72 X
2016 1,608 - 1,608 4,315 2.68 X
2015 1,608 - 1,608 4,057 2.52 X
2014 1,608 - 1,608 3,977 2.47 X
2013 1,608 - 1,608 3,921 2.44 X
2012 1,430 - 1,430 3,997 2.80 X
2011 618 - 618 3,740 6.05 X
2010 - - - - 0.00 X
2009 - - - - 0.00 X
2008 - - - - 0.00 X
(Continued)
STATE SHARED TAX OBLIGATIONS
STATE SHARED TAX OBLIGATIONS
STATE SHARED TAX OBLIGATIONS
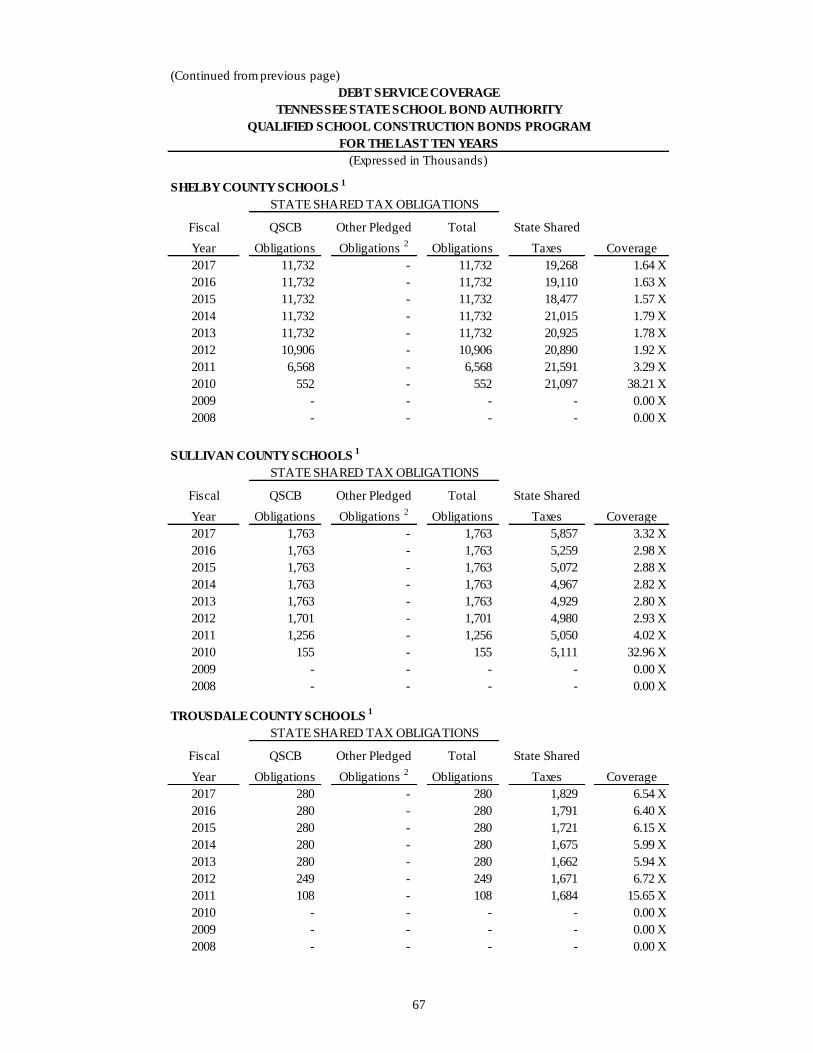
67
(Continued from previous page)
SHELBY COUNTY SCHOOLS 1
Fiscal QSCB Other Pledged Total State Shared
Year Obligations Obligations 2
Obligations Taxes Coverage
2017 11,732 - 11,732 19,268 1.64 X
2016 11,732 - 11,732 19,110 1.63 X
2015 11,732 - 11,732 18,477 1.57 X
2014 11,732 - 11,732 21,015 1.79 X
2013 11,732 - 11,732 20,925 1.78 X
2012 10,906 - 10,906 20,890 1.92 X
2011 6,568 - 6,568 21,591 3.29 X
2010 552 - 552 21,097 38.21 X
2009 - - - - 0.00 X
2008 - - - - 0.00 X
SULLIVAN COUNTY SCHOOLS 1
Fiscal QSCB Other Pledged Total State Shared
Year Obligations Obligations 2
Obligations Taxes Coverage
2017 1,763 - 1,763 5,857 3.32 X
2016 1,763 - 1,763 5,259 2.98 X
2015 1,763 - 1,763 5,072 2.88 X
2014 1,763 - 1,763 4,967 2.82 X
2013 1,763 - 1,763 4,929 2.80 X
2012 1,701 - 1,701 4,980 2.93 X
2011 1,256 - 1,256 5,050 4.02 X
2010 155 - 155 5,111 32.96 X
2009 - - - - 0.00 X
2008 - - - - 0.00 X
TROUSDALE COUNTY SCHOOLS 1
Fiscal QSCB Other Pledged Total State Shared
Year Obligations Obligations 2
Obligations Taxes Coverage
2017 280 - 280 1,829 6.54 X
2016 280 - 280 1,791 6.40 X
2015 280 - 280 1,721 6.15 X
2014 280 - 280 1,675 5.99 X
2013 280 - 280 1,662 5.94 X
2012 249 - 249 1,671 6.72 X
2011 108 - 108 1,684 15.65 X
2010 - - - - 0.00 X
2009 - - - - 0.00 X
2008 - - - - 0.00 X
STATE SHARED TAX OBLIGATIONS
STATE SHARED TAX OBLIGATIONS
STATE SHARED TAX OBLIGATIONS
DEBT SERVICE COVERAGE
TENNESSEE STATE SCHOOL BOND AUTHORITY
QUALIFIED SCHOOL CONSTRUCTION BONDS PROGRAM
FOR THE LAST TEN YEARS
(Expressed in Thousands)

68
UNION COUNTY SCHOOLS 1
Fiscal QSCB Other Pledged Total State Shared
Year Obligations Obligations 2
Obligations Taxes Coverage
2017 555 - 555 2,655 4.78 X
2016 555 - 555 2,636 4.75 X
2015 555 - 555 2,584 4.65 X
2014 555 - 555 2,497 4.50 X
2013 555 - 555 2,492 4.49 X
2012 555 - 555 2,519 4.54 X
2011 481 - 481 2,473 5.14 X
2010 72 - 72 2,407 33.57 X
2009 - - - - 0.00 X
2008 - - - - 0.00 X
WARREN COUNTY SCHOOLS 1
Fiscal QSCB Other Pledged Total State Shared
Year Obligations Obligations 2
Obligations Taxes Coverage
2017 1,031 103 1,134 2,837 2.50 X
2016 1,031 - 1,031 2,813 2.73 X
2015 1,031 - 1,031 2,726 2.64 X
2014 1,031 - 1,031 2,687 2.61 X
2013 1,031 - 1,031 2,663 2.58 X
2012 917 - 917 2,667 2.91 X
2011 396 - 396 2,663 6.72 X
2010 - - - - 0.00 X
2009 - - - - 0.00 X
2008 - - - - 0.00 X
Note: The first QSCB bond was issued on December 17, 2009.
Source: Data on State-Shared Taxes is provided by Tennessee Department of Revenue.1 Coverage for current and/or prior years is zero due to no QSCB loans or other obligations.2 Other Pledged Obligations includes Qualified Zone Academy Bonds (QZAB) and Tennessee Local
Development Authority (TLDA)3 Kingsport and Metropolitan Government of Nashville paid in full all of their TLDA debt.
STATE SHARED TAX OBLIGATIONS
STATE SHARED TAX OBLIGATIONS
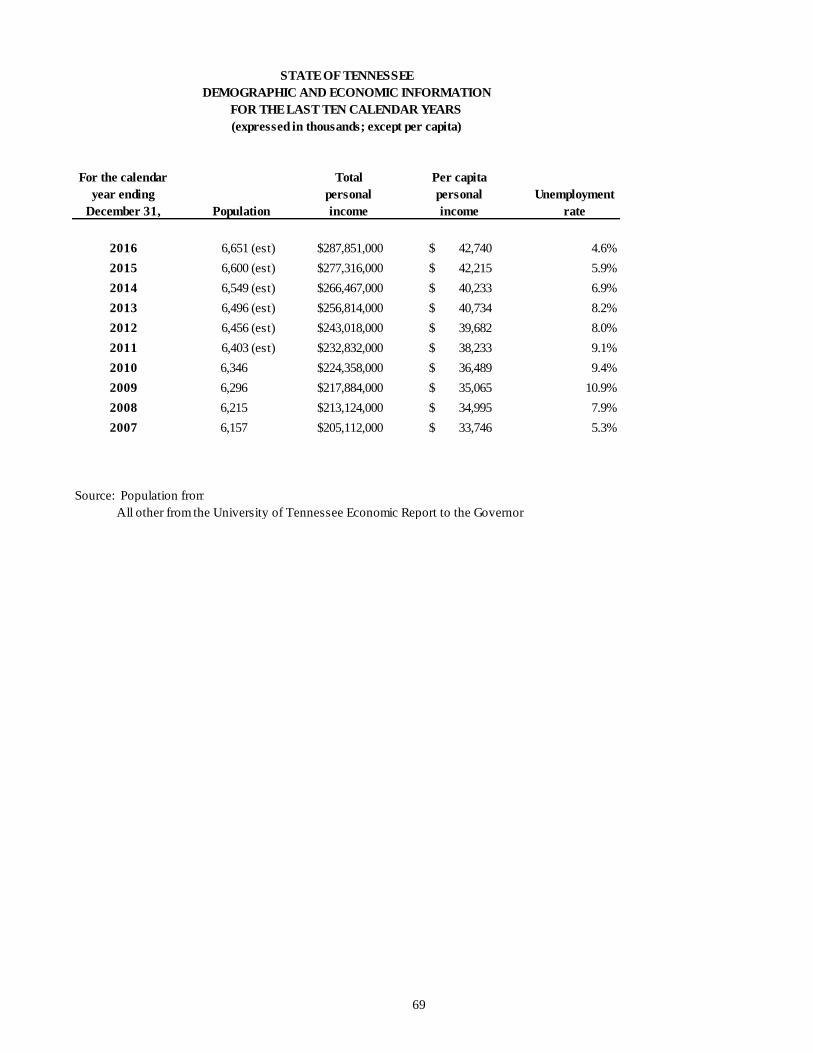
69
For the calendar
year ending
December 31, Population
Total
personal
income
Per capita
personal
income
Unemployment
rate
2016 6,651 (est) 287,851,000$ 42,740$ 4.6%
2015 6,600 (est) 277,316,000$ 42,215$ 5.9%
2014 6,549 (est) 266,467,000$ 40,233$ 6.9%
2013 6,496 (est) 256,814,000$ 40,734$ 8.2%
2012 6,456 (est) 243,018,000$ 39,682$ 8.0%
2011 6,403 (est) 232,832,000$ 38,233$ 9.1%
2010 6,346 224,358,000$ 36,489$ 9.4%
2009 6,296 217,884,000$ 35,065$ 10.9%
2008 6,215 213,124,000$ 34,995$ 7.9%
2007 6,157 205,112,000$ 33,746$ 5.3%
All other from the University of Tennessee Economic Report to the Governor
STATE OF TENNESSEE
DEMOGRAPHIC AND ECONOMIC INFORMATION
FOR THE LAST TEN CALENDAR YEARS
(expressed in thousands; except per capita)
Source: Population from www.census.gov

70
Institution4
2002 2003 2004 2005 2006 2007 2008 2009
APSU 6,079 6,278 6,939 7,336 7,443 7,139 7,499 7,566
ETSU1
9,664 9,936 10,070 10,185 10,594 10,770 11,117 11,727
ETSU Medical3
n/a n/a n/a n/a n/a 239 245 253
ETSU Pharmacy3
n/a n/a n/a n/a n/a 215 334 298
MTSU 18,151 18,735 19,037 19,139 19,355 19,525 20,062 21,049
TSU 7,703 7,716 7,662 7,462 7,464 7,465 6,694 7,025
TTU 7,554 7,509 7,559 7,562 7,900 8,312 8,568 9,057
UM 15,696 15,720 16,128 15,910 15,946 15,747 15,910 16,792
TBR Total 64,846 65,894 67,394 67,593 68,702 69,412 70,429 73,767
UT Chattanooga 7,050 7,138 7,326 7,317 7,564 8,168 8,446 9,116
UT Knoxville2
23,221 22,730 23,141 23,642 24,016 24,160 24,697 24,214
UT Veterinary3
n/a n/a n/a n/a n/a 408 429 484
UT Space Inst n/a n/a n/a n/a n/a 105 104 88
UT Martin 5,311 5,265 5,570 5,833 5,968 6,108 6,305 6,714
UT Health Science3
1,977 2,008 2,062 2,295 2,505 2,733 2,778 2,914
UT Total 37,559 37,141 38,099 39,088 40,053 41,682 42,759 43,530
Total 4 Year 102,404 103,035 105,494 106,681 108,755 111,094 113,188 117,297
Chattanooga 5,264 5,186 5,124 4,890 5,054 5,044 5,334 5,987
Cleveland 2,200 2,224 2,088 2,103 2,034 2,022 2,195 2,504
Columbia 3,108 3,082 3,145 3,120 2,963 3,003 3,081 3,569
Dyersburg 1,657 1,819 1,770 1,744 1,693 1,668 1,741 2,213
Jackson 2,713 2,743 2,702 2,573 2,791 2,953 2,803 3,313
Motlow 2,556 2,436 2,465 2,392 2,566 2,739 2,892 3,353
Nashville 3,757 3,769 3,889 4,074 4,083 4,063 4,315 5,154
Northeast 2,968 3,112 3,334 3,142 3,374 3,387 3,606 4,231
Pellissippi 5,208 5,013 4,963 4,963 5,149 5,446 5,686 6,695
Roane 3,767 3,775 3,850 3,603 3,738 3,764 3,766 4,227
Southwest 7,141 7,361 7,561 7,332 7,306 6,794 7,219 8,465
Volunteer 4,525 4,426 4,483 4,553 4,677 4,427 4,582 5,501
Walters 3,867 4,067 3,864 3,826 3,872 3,884 4,082 4,780
Total 2 Year 48,729 49,013 49,238 48,315 49,300 49,194 51,302 59,993
Grand Total 151,133 152,048 154,732 154,995 158,055 160,288 164,490 177,290
Two Year Institutions5
Tennessee Higher Education Commission
History of Fall Term Full-Time Equivalent Enrollment in Public Higher Education Schools
Four Year Institutions
1- Prior to 2010, 14th day enrollment was used to calculate FTE. Since 2010 end-of-term enrollment is used.
1- Prior to 2007, ETSU totals included ETSU Med and ETSU Pharm.
2- Prior to 2007, UTK totals included UT Vet and UTSI.
3- FTE is equivalent to headcount since medical units require residency. From 2010 to 2012 FTE was used instead of headcount. The one-year decline should therefore not be referenced for medical units.
4 - TBR = Tennesse Board of Regents, APSU = Austin Peay State University, ETSU = East Tennessee State University, MTSU = Middle Tennessee
State University, TSU = Tennessee State University, TTU = Tennessee Technological University, UM = University of Memphis, UT = University
of Tennessee
5 - Two Year Schools = State Community Colleges

71
% Change
2010 2011 2012 2013 2014 2015 2016 15 to 16 11 to 16
8,493 8,513 8,508 8,416 8,241 8,180 8,466 3.5% -0.5%
12,224 12,442 12,187 11,763 11,683 11,740 11,707 -0.3% -5.9%
733 795 816 282 288 284 282 -0.7% -64.5%
493 488 505 329 324 323 321 -0.6% -34.2%
22,010 21,807 20,824 19,637 18,787 18,362 18,177 -1.0% -16.6%
7,142 7,159 6,901 7,080 7,388 7,639 7,342 -3.9% 2.6%
9,361 9,525 9,636 9,797 9,983 9,569 9,208 -3.8% -3.3%
17,536 17,725 17,462 16,704 16,554 16,112 16,744 3.9% -5.5%
77,992 78,453 76,839 74,007 73,247 72,209 72,247 0.1% -7.9%
9,788 9,845 9,951 10,208 10,029 9,886 10,029 1.4% 1.9%
23,797 23,065 23,193 23,456 23,698 24,201 24,422 0.9% 5.9%
520 480 522 351 354 347 352 1.4% -26.7%
85 88 67 52 55 53 53 -0.5% -39.5%
6,959 6,852 6,770 6,555 6,273 5,989 5,670 -5.3% -17.3%
2,623 3,751 4,477 2,859 2,977 3,075 3,097 0.7% -17.4%
43,773 44,081 44,980 43,481 43,386 43,551 43,623 0.2% -1.0%
121,765 122,534 121,819 117,489 116,633 115,761 115,870 0.1% -5.4%
6,712 6,671 6,585 6,388 5,901 6,190 5,743 -7.2% -13.9%
2,592 2,617 2,482 2,487 2,316 2,413 2,282 -5.4% -12.8%
3,579 3,417 3,348 3,352 3,263 3,634 3,816 5.0% 11.7%
2,419 2,334 2,217 1,918 1,678 1,690 1,694 0.2% -27.4%
3,410 3,260 2,847 2,722 2,825 2,907 2,968 2.1% -8.9%
3,337 3,069 2,925 2,984 2,984 3,654 4,152 13.6% 35.3%
5,619 5,686 5,681 5,796 5,807 6,272 5,588 -10.9% -1.7%
4,624 4,423 4,289 3,912 3,888 4,215 4,250 0.8% -3.9%
7,274 7,402 7,057 6,978 6,644 6,755 6,645 -1.6% -10.2%
4,389 4,205 4,153 3,964 3,777 3,891 3,788 -2.6% -9.9%
8,431 8,216 7,555 6,801 6,355 6,169 5,624 -8.8% -31.5%
5,777 5,449 5,091 4,985 4,747 5,406 5,869 8.6% 7.7%
4,808 4,595 4,425 4,103 4,008 4,074 4,086 0.3% -11.1%
62,973 61,343 58,656 56,392 54,192 57,269 56,505 -1.3% -7.9%
184,738 183,877 180,475 173,880 170,825 173,030 172,375 -0.4% -6.3%
Five-Year Growth Rate
-1.3%
Four Year Institutions
Two Year Institutions5
Tennessee Higher Education Commission
History of Fall Term Full-Time Equivalent Enrollment in Public Higher Education Schools
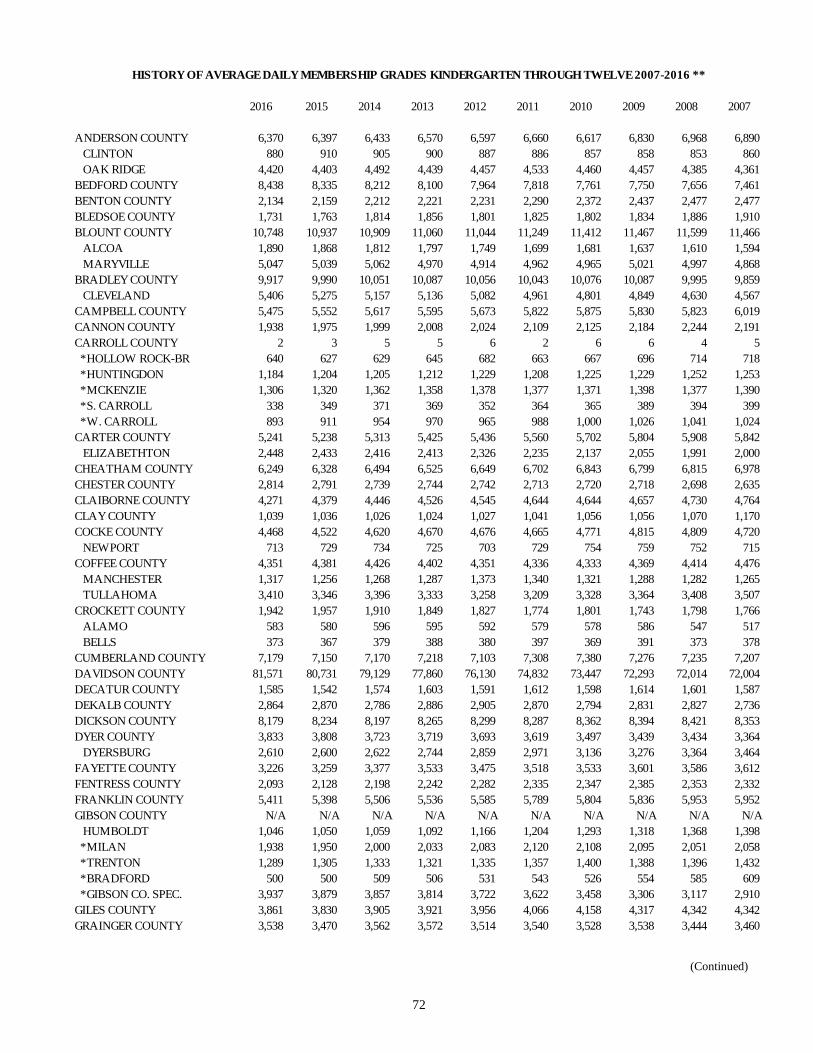
72
2016 2015 2014 2013 2012 2011 2010 2009 2008 2007
ANDERSON COUNTY 6,370 6,397 6,433 6,570 6,597 6,660 6,617 6,830 6,968 6,890
CLINTON 880 910 905 900 887 886 857 858 853 860
OAK RIDGE 4,420 4,403 4,492 4,439 4,457 4,533 4,460 4,457 4,385 4,361
BEDFORD COUNTY 8,438 8,335 8,212 8,100 7,964 7,818 7,761 7,750 7,656 7,461
BENTON COUNTY 2,134 2,159 2,212 2,221 2,231 2,290 2,372 2,437 2,477 2,477
BLEDSOE COUNTY 1,731 1,763 1,814 1,856 1,801 1,825 1,802 1,834 1,886 1,910
BLOUNT COUNTY 10,748 10,937 10,909 11,060 11,044 11,249 11,412 11,467 11,599 11,466
ALCOA 1,890 1,868 1,812 1,797 1,749 1,699 1,681 1,637 1,610 1,594
MARYVILLE 5,047 5,039 5,062 4,970 4,914 4,962 4,965 5,021 4,997 4,868
BRADLEY COUNTY 9,917 9,990 10,051 10,087 10,056 10,043 10,076 10,087 9,995 9,859
CLEVELAND 5,406 5,275 5,157 5,136 5,082 4,961 4,801 4,849 4,630 4,567
CAMPBELL COUNTY 5,475 5,552 5,617 5,595 5,673 5,822 5,875 5,830 5,823 6,019
CANNON COUNTY 1,938 1,975 1,999 2,008 2,024 2,109 2,125 2,184 2,244 2,191
CARROLL COUNTY 2 3 5 5 6 2 6 6 4 5
*HOLLOW ROCK-BR 640 627 629 645 682 663 667 696 714 718
*HUNTINGDON 1,184 1,204 1,205 1,212 1,229 1,208 1,225 1,229 1,252 1,253
*MCKENZIE 1,306 1,320 1,362 1,358 1,378 1,377 1,371 1,398 1,377 1,390
*S. CARROLL 338 349 371 369 352 364 365 389 394 399
*W. CARROLL 893 911 954 970 965 988 1,000 1,026 1,041 1,024
CARTER COUNTY 5,241 5,238 5,313 5,425 5,436 5,560 5,702 5,804 5,908 5,842
ELIZABETHTON 2,448 2,433 2,416 2,413 2,326 2,235 2,137 2,055 1,991 2,000
CHEATHAM COUNTY 6,249 6,328 6,494 6,525 6,649 6,702 6,843 6,799 6,815 6,978
CHESTER COUNTY 2,814 2,791 2,739 2,744 2,742 2,713 2,720 2,718 2,698 2,635
CLAIBORNE COUNTY 4,271 4,379 4,446 4,526 4,545 4,644 4,644 4,657 4,730 4,764
CLAY COUNTY 1,039 1,036 1,026 1,024 1,027 1,041 1,056 1,056 1,070 1,170
COCKE COUNTY 4,468 4,522 4,620 4,670 4,676 4,665 4,771 4,815 4,809 4,720
NEWPORT 713 729 734 725 703 729 754 759 752 715
COFFEE COUNTY 4,351 4,381 4,426 4,402 4,351 4,336 4,333 4,369 4,414 4,476
MANCHESTER 1,317 1,256 1,268 1,287 1,373 1,340 1,321 1,288 1,282 1,265
TULLAHOMA 3,410 3,346 3,396 3,333 3,258 3,209 3,328 3,364 3,408 3,507
CROCKETT COUNTY 1,942 1,957 1,910 1,849 1,827 1,774 1,801 1,743 1,798 1,766
ALAMO 583 580 596 595 592 579 578 586 547 517
BELLS 373 367 379 388 380 397 369 391 373 378
CUMBERLAND COUNTY 7,179 7,150 7,170 7,218 7,103 7,308 7,380 7,276 7,235 7,207
DAVIDSON COUNTY 81,571 80,731 79,129 77,860 76,130 74,832 73,447 72,293 72,014 72,004
DECATUR COUNTY 1,585 1,542 1,574 1,603 1,591 1,612 1,598 1,614 1,601 1,587
DEKALB COUNTY 2,864 2,870 2,786 2,886 2,905 2,870 2,794 2,831 2,827 2,736
DICKSON COUNTY 8,179 8,234 8,197 8,265 8,299 8,287 8,362 8,394 8,421 8,353
DYER COUNTY 3,833 3,808 3,723 3,719 3,693 3,619 3,497 3,439 3,434 3,364
DYERSBURG 2,610 2,600 2,622 2,744 2,859 2,971 3,136 3,276 3,364 3,464
FAYETTE COUNTY 3,226 3,259 3,377 3,533 3,475 3,518 3,533 3,601 3,586 3,612
FENTRESS COUNTY 2,093 2,128 2,198 2,242 2,282 2,335 2,347 2,385 2,353 2,332
FRANKLIN COUNTY 5,411 5,398 5,506 5,536 5,585 5,789 5,804 5,836 5,953 5,952
GIBSON COUNTY N/A N/A N/A N/A N/A N/A N/A N/A N/A N/A
HUMBOLDT 1,046 1,050 1,059 1,092 1,166 1,204 1,293 1,318 1,368 1,398
*MILAN 1,938 1,950 2,000 2,033 2,083 2,120 2,108 2,095 2,051 2,058
*TRENTON 1,289 1,305 1,333 1,321 1,335 1,357 1,400 1,388 1,396 1,432
*BRADFORD 500 500 509 506 531 543 526 554 585 609
*GIBSON CO. SPEC. 3,937 3,879 3,857 3,814 3,722 3,622 3,458 3,306 3,117 2,910
GILES COUNTY 3,861 3,830 3,905 3,921 3,956 4,066 4,158 4,317 4,342 4,342
GRAINGER COUNTY 3,538 3,470 3,562 3,572 3,514 3,540 3,528 3,538 3,444 3,460
HISTORY OF AVERAGE DAILY MEMBERSHIP GRADES KINDERGARTEN THROUGH TWELVE 2007-2016 **
(Continued)

73
2016 2015 2014 2013 2012 2011 2010 2009 2008 2007
GREENE COUNTY 6,672 6,875 6,946 6,969 7,063 7,123 7,113 7,252 7,232 7,183
GREENEVILLE 2,769 2,725 2,715 2,726 2,682 2,676 2,696 2,705 2,740 2,771
GRUNDY COUNTY 2,078 2,150 2,118 2,186 2,209 2,218 2,192 2,271 2,200 2,285
HAMBLEN COUNTY 10,091 10,052 10,007 9,976 9,918 9,890 9,819 9,564 9,651 9,654
HAMILTON COUNTY 43,102 42,669 42,385 42,427 41,836 41,615 40,677 39,892 39,852 40,007
HANCOCK COUNTY 985 960 967 977 985 1,012 1,027 1,006 1,019 1,010
HARDEMAN COUNTY 3,575 3,731 3,800 3,839 3,883 3,958 4,063 4,108 4,214 4,252
HARDIN COUNTY 3,456 3,522 3,510 3,556 3,581 3,464 3,657 3,739 3,740 3,724
HAWKINS COUNTY 6,899 6,962 7,073 7,235 7,301 7,400 7,545 7,630 7,695 7,618
ROGERSVILLE 639 624 648 657 673 681 665 663 658 645
HAYWOOD COUNTY 2,909 2,970 3,112 3,156 3,225 3,310 3,265 3,301 3,326 3,401
HENDERSON COUNTY 3,870 3,833 3,836 3,768 3,695 3,734 3,682 3,555 3,476 3,518
LEXINGTON 881 935 909 970 991 995 1,025 1,062 1,100 1,077
HENRY COUNTY 2,957 2,998 3,020 3,050 3,045 3,104 3,171 3,119 3,145 3,120
*PARIS 1,690 1,683 1,685 1,686 1,656 1,646 1,580 1,589 1,578 1,539
HICKMAN COUNTY 3,339 3,488 3,511 3,567 3,615 3,740 3,807 3,839 3,872 3,884
HOUSTON COUNTY 1,308 1,311 1,322 1,345 1,333 1,410 1,466 1,442 1,464 1,486
HUMPHREYS COUNTY 2,886 2,852 2,842 2,942 2,955 3,033 3,052 3,064 3,060 3,024
JACKSON COUNTY 1,468 1,520 1,537 1,577 1,500 1,532 1,627 1,646 1,651 1,678
JEFFERSON COUNTY 7,154 7,228 7,208 7,280 7,246 7,353 7,372 7,389 7,429 7,377
JOHNSON COUNTY 2,004 2,080 2,108 2,128 2,130 2,167 2,211 2,215 2,244 2,270
KNOX COUNTY 57,929 57,582 57,022 56,811 56,298 55,588 55,521 55,265 54,293 54,215
LAKE COUNTY 789 813 840 870 873 884 893 900 920 897
LAUDERDALE COUNTY 4,133 4,318 4,406 4,452 4,441 4,458 4,503 4,510 4,547 4,528
LAWRENCE COUNTY 6,609 6,531 6,659 6,851 6,603 6,726 6,732 6,675 6,717 6,732
LEWIS COUNTY 1,728 1,767 1,797 1,840 1,839 1,874 1,900 1,892 1,901 1,898
LINCOLN COUNTY 3,835 3,859 3,870 3,933 3,921 3,921 4,009 4,043 4,087 4,053
FAYETTEVILLE 1,434 1,432 1,352 1,216 1,166 1,162 993 986 995 956
LOUDON COUNTY 4,674 4,723 4,718 4,816 4,928 4,846 5,040 5,028 5,086 5,046
LENOIR CITY 2,264 2,274 2,248 2,234 2,209 2,244 2,191 2,191 2,118 2,146
MCMINN COUNTY 5,518 5,558 5,698 5,801 5,877 5,859 5,885 5,952 5,928 5,872
ATHENS 1,570 1,563 1,587 1,537 1,494 1,594 1,674 1,673 1,744 1,716
ETOWAH 353 314 341 339 329 311 329 351 374 365
MCNAIRY COUNTY 4,199 4,200 4,183 4,225 4,268 4,295 4,353 4,310 4,318 4,318
MACON COUNTY 3,679 3,680 3,670 3,710 3,664 3,710 3,724 3,736 3,735 3,723
MADISON COUNTY 12,492 12,543 12,599 12,704 12,649 12,756 12,808 13,134 13,409 13,783
MARION COUNTY 4,030 4,077 4,161 4,176 4,227 4,224 4,271 4,253 4,163 4,130
*RICHARD CITY 275 270 277 297 339 322 312 286 322 327
MARSHALL COUNTY 5,311 5,266 5,278 5,248 5,211 5,228 5,260 5,258 5,286 5,146
MAURY COUNTY 11,900 11,725 11,664 11,554 11,418 11,327 11,403 11,501 11,505 11,421
MEIGS COUNTY 1,712 1,742 1,726 1,715 1,734 1,752 1,827 1,813 1,841 1,820
MONROE COUNTY 5,353 5,396 5,414 5,458 5,446 5,523 5,524 5,518 5,487 5,424
SWEETWATER 1,532 1,520 1,537 1,513 1,501 1,481 1,480 1,492 1,516 1,468
MONTGOMERY COUNTY 31,882 31,384 30,706 29,871 29,728 29,202 28,661 28,401 27,813 27,449
MOORE COUNTY 852 891 924 978 993 992 973 975 970 981
MORGAN COUNTY 3,032 3,050 3,136 3,189 3,178 3,198 3,206 3,277 3,265 3,281
OBION COUNTY 3,411 3,509 3,576 3,633 3,645 3,787 3,837 3,907 3,987 4,017
UNION CITY 1,565 1,531 1,473 1,447 1,451 1,444 1,454 1,399 1,376 1,420
OVERTON COUNTY 3,099 3,146 3,238 3,298 3,317 3,430 3,448 3,352 3,372 3,371
PERRY COUNTY 1,041 1,078 1,087 1,069 1,110 1,120 1,110 1,116 1,099 1,102
PICKETT COUNTY 722 740 747 733 725 705 682 665 658 674
POLK COUNTY 2,361 2,418 2,493 2,520 2,564 2,650 2,640 2,658 2,673 2,656
HISTORY OF AVERAGE DAILY MEMBERSHIP GRADES KINDERGARTEN THROUGH TWELVE 2007-2016 **
(Continued from previous page)

74
2016 2015 2014 2013 2012 2011 2010 2009 2008 2007
PUTNAM COUNTY 10,723 10,706 10,640 10,632 10,511 10,501 10,434 10,388 10,337 10,251
RHEA COUNTY 4,248 4,229 4,296 4,275 4,214 4,192 4,236 4,152 4,118 4,133
DAYTON 821 791 822 802 791 743 755 734 705 722
ROANE COUNTY 6,583 6,708 6,874 6,882 7,036 7,115 7,293 7,320 7,480 7,451
ROBERTSON COUNTY 10,977 11,143 10,807 11,182 11,050 10,957 10,909 10,774 10,710 10,551
RUTHERFORD COUNTY 42,650 41,425 40,932 39,969 38,645 38,122 37,238 36,497 35,706 34,384
MURFREESBORO 7,981 7,528 7,072 7,151 7,069 6,837 6,903 6,859 6,849 6,661
SCOTT COUNTY 2,840 2,888 2,904 2,869 2,848 2,866 2,750 2,806 2,768 2,679
*ONEIDA 1,219 1,230 1,241 1,252 1,225 1,201 1,192 1,263 1,276 1,318
SEQUATCHIE COUNTY 2,257 2,260 2,277 2,257 2,261 2,274 2,277 2,251 2,217 2,179
SEVIER COUNTY 14,265 14,253 14,304 14,303 14,216 14,315 14,291 14,277 14,317 14,202
SHELBY COUNTY 1
106,455 110,807 144,338 146,896 150,109 150,955 151,868 153,070 155,750 159,870
ARLINGTON 4,985 4,850 0 0 0 0 0 0 0 0
BARTLETT 8,500 8,332 0 0 0 0 0 0 0 0
COLLIERVILLE 8,021 7,853 0 0 0 0 0 0 0 0
GERMANTOWN 5,727 5,676 0 0 0 0 0 0 0 0
LAKELAND 901 844 0 0 0 0 0 0 0 0
MILLINGTON 2,539 2,653 0 0 0 0 0 0 0 0
SMITH COUNTY 3,025 3,013 3,080 3,084 3,138 3,201 3,253 3,240 3,245 3,260
STEWART COUNTY 2,003 2,001 2,113 2,113 2,140 2,130 2,161 2,239 2,235 2,202
SULLIVAN COUNTY 9,899 10,079 10,355 10,596 10,737 11,054 11,418 11,659 11,860 12,020
BRISTOL 3,966 3,990 3,883 3,895 3,842 3,876 3,853 3,918 3,914 3,876
KINGSPORT 7,151 7,038 7,011 6,798 6,698 6,556 6,439 6,392 6,396 6,455
SUMNER COUNTY 28,764 28,346 28,237 27,958 27,612 27,377 27,032 26,554 26,241 25,872
TIPTON COUNTY 10,940 11,152 11,215 11,398 11,544 11,738 11,767 11,781 11,736 11,670
TROUSDALE COUNTY 1,236 1,194 1,225 1,230 1,246 1,219 1,297 1,373 1,331 1,331
UNICOI COUNTY 2,319 2,412 2,499 2,538 2,575 2,520 2,583 2,533 2,491 2,534
UNION COUNTY 3,484 4,228 5,305 5,871 4,549 2,953 2,970 2,968 2,989 3,026
VAN BUREN COUNTY 724 728 718 729 732 717 758 782 782 778
WARREN COUNTY 6,363 6,457 6,396 6,427 6,450 6,475 6,501 6,341 6,326 6,244
WASHINGTON COUNTY 8,596 8,668 8,864 8,927 9,058 9,050 9,169 9,174 9,150 9,123
JOHNSON CITY 7,772 7,732 7,645 7,529 7,425 7,390 7,313 7,328 7,239 7,094
WAYNE COUNTY 2,215 2,229 2,303 2,312 2,333 2,356 2,398 2,394 2,445 2,491
WEAKLEY COUNTY 4,204 4,253 4,340 4,373 4,499 4,550 4,662 4,751 4,721 4,766
WHITE COUNTY 3,859 3,944 3,935 3,929 3,969 3,966 3,981 4,007 3,990 4,003
WILLIAMSON COUNTY 36,303 34,991 33,916 32,912 31,949 31,275 30,517 29,762 28,585 27,301
*FRANKLIN 3,438 3,585 3,633 3,710 3,671 3,748 3,688 3,720 3,825 3,781
WILSON COUNTY 17,206 16,766 16,446 16,002 15,637 15,408 15,057 14,778 14,269 14,048
*LEBANON 3,552 3,628 3,581 3,547 3,381 3,327 3,183 3,117 3,145 3,053
ASD 2
9,603 6,790 3,912 1,503 0 0 0 0 0
GRAND TOTAL 960,959 959,532 958,276 956,975 951,035 948,616 946,668 944,621 943,594 942,645
HISTORY OF AVERAGE DAILY MEMBERSHIP GRADES KINDERGARTEN THROUGH TWELVE 2007-2016 **
*SPECIAL SCHOOL DISTRICT
**AVERAGE DAILY MEMBERSHIP INCLUDES ADULT HIGH SCHOOL STUDENTS IN GRADES 9-12.
1 YEARS PRIOR TO 2015 WERE NOT LISTED SEPARATELY BY CITY
2 ACHIEVEMENT SCHOOL DISTRICT FOUNDED IN 2013

75
OFFICE OF STATE AND LOCAL FINANCE
SANDRA THOMPSON*
JACQUELINE FELLAND*
SHARON SCHMUCKER*
MICHAEL MERCER*
MARK GRAUBNER
LORI BARNARD
DONNA KAUKAS
CINDY LIDDELL
STEVE OSBORNE
KATHY PALMER
RON QUEEN
ALICIA WEST
*PREPARER OF COMPREHENSIVE ANNUAL FINANCIAL REPORT