Embed Size (px)
Citation preview
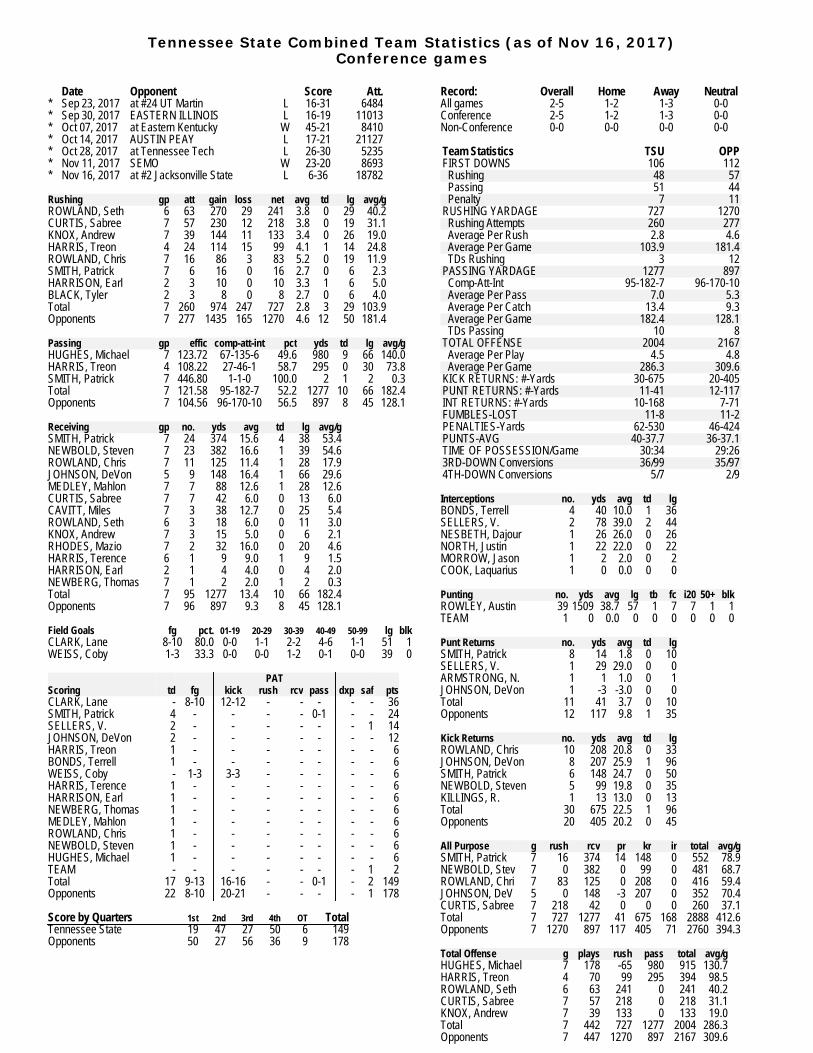
Tennessee State Combined Team Statistics (as of Nov 16, 2017)
Conference games
Date Opponent Score Att.
* Sep 23, 2017 at #24 UT Martin L 16-31 6484
* Sep 30, 2017 EASTERN ILLINOIS L 16-19 11013
* Oct 07, 2017 at Eastern Kentucky W 45-21 8410
* Oct 14, 2017 AUSTIN PEAY L 17-21 21127
* Oct 28, 2017 at Tennessee Tech L 26-30 5235
* Nov 11, 2017 SEMO W 23-20 8693
* Nov 16, 2017 at #2 Jacksonville State L 6-36 18782
Rushing gp att gain loss net avg td lg avg/g
ROWLAND, Seth 6 63 270 29 241 3.8 0 29 40.2
CURTIS, Sabree 7 57 230 12 218 3.8 0 19 31.1
KNOX, Andrew 7 39 144 11 133 3.4 0 26 19.0
HARRIS, Treon 4 24 114 15 99 4.1 1 14 24.8
ROWLAND, Chris 7 16 86 3 83 5.2 0 19 11.9
SMITH, Patrick 7 6 16 0 16 2.7 0 6 2.3
HARRISON, Earl 2 3 10 0 10 3.3 1 6 5.0
BLACK, Tyler 2 3 8 0 8 2.7 0 6 4.0
Total 7 260 974 247 727 2.8 3 29 103.9
Opponents 7 277 1435 165 1270 4.6 12 50 181.4
Passing gp effic comp-att-int pct yds td lg avg/g
HUGHES, Michael 7 123.72 67-135-6 49.6 980 9 66 140.0
HARRIS, Treon 4 108.22 27-46-1 58.7 295 0 30 73.8
SMITH, Patrick 7 446.80 1-1-0 100.0 2 1 2 0.3
Total 7 121.58 95-182-7 52.2 1277 10 66 182.4
Opponents 7 104.56 96-170-10 56.5 897 8 45 128.1
Receiving gp no. yds avg td lg avg/g
SMITH, Patrick 7 24 374 15.6 4 38 53.4
NEWBOLD, Steven 7 23 382 16.6 1 39 54.6
ROWLAND, Chris 7 11 125 11.4 1 28 17.9
JOHNSON, DeVon 5 9 148 16.4 1 66 29.6
MEDLEY, Mahlon 7 7 88 12.6 1 28 12.6
CURTIS, Sabree 7 7 42 6.0 0 13 6.0
CAVITT, Miles 7 3 38 12.7 0 25 5.4
ROWLAND, Seth 6 3 18 6.0 0 11 3.0
KNOX, Andrew 7 3 15 5.0 0 6 2.1
RHODES, Mazio 7 2 32 16.0 0 20 4.6
HARRIS, Terence 6 1 9 9.0 1 9 1.5
HARRISON, Earl 2 1 4 4.0 0 4 2.0
NEWBERG, Thomas 7 1 2 2.0 1 2 0.3
Total 7 95 1277 13.4 10 66 182.4
Opponents 7 96 897 9.3 8 45 128.1
Field Goals fg pct. 01-19 20-29 30-39 40-49 50-99 lg blk
CLARK, Lane 8-10 80.0 0-0 1-1 2-2 4-6 1-1 51 1
WEISS, Coby 1-3 33.3 0-0 0-0 1-2 0-1 0-0 39 0
PAT
Scoring td fg kick rush rcv pass dxp saf pts
CLARK, Lane - 8-10 12-12 - - - - - 36
SMITH, Patrick 4 - - - - 0-1 - - 24
SELLERS, V. 2 - - - - - - 1 14
JOHNSON, DeVon 2 - - - - - - - 12
HARRIS, Treon 1 - - - - - - - 6
BONDS, Terrell 1 - - - - - - - 6
WEISS, Coby - 1-3 3-3 - - - - - 6
HARRIS, Terence 1 - - - - - - - 6
HARRISON, Earl 1 - - - - - - - 6
NEWBERG, Thomas 1 - - - - - - - 6
MEDLEY, Mahlon 1 - - - - - - - 6
ROWLAND, Chris 1 - - - - - - - 6
NEWBOLD, Steven 1 - - - - - - - 6
HUGHES, Michael 1 - - - - - - - 6
TEAM - - - - - - - 1 2
Total 17 9-13 16-16 - - 0-1 - 2 149
Opponents 22 8-10 20-21 - - - - 1 178
Score by Quarters 1st 2nd 3rd 4th OT Total
Tennessee State 19 47 27 50 6 149
Opponents 50 27 56 36 9 178
Record: Overall Home Away Neutral
All games 2-5 1-2 1-3 0-0
Conference 2-5 1-2 1-3 0-0
Non-Conference 0-0 0-0 0-0 0-0
Team Statistics TSU OPP
FIRST DOWNS 106 112
R u s h i n g 48 57
P a s s i n g 51 44
P e n a l t y 7 11
RUSHING YARDAGE 727 1270
Rushing Attempts 260 277
Average Per Rush 2.8 4.6
Average Per Game 103.9 181.4
TDs Rushing 3 12
PASSING YARDAGE 1277 897
C o m p - A t t - I n t 95-182-7 96-170-10
Average Per Pass 7.0 5.3
Average Per Catch 13.4 9.3
Average Per Game 182.4 128.1
TDs Passing 10 8
TOTAL OFFENSE 2004 2167
Average Per Play 4.5 4.8
Average Per Game 286.3 309.6
KICK RETURNS: #-Yards 30-675 20-405
PUNT RETURNS: #-Yards 11-41 12-117
INT RETURNS: #-Yards 10-168 7-71
FUMBLES-LOST 11-8 11-2
PENALTIES-Yards 62-530 46-424
PUNTS-AVG 40-37.7 36-37.1
TIME OF POSSESSION/Game 3 0 : 3 4 2 9 : 2 6
3RD-DOWN Conversions 36/99 35/97
4TH-DOWN Conversions 5/7 2/9
Interceptions no. yds avg td lg
BONDS, Terrell 4 40 10.0 1 36
SELLERS, V. 2 78 39.0 2 44
NESBETH, Dajour 1 26 26.0 0 26
NORTH, Justin 1 22 22.0 0 22
MORROW, Jason 1 2 2.0 0 2
COOK, Laquarius 1 0 0.0 0 0
Punting no. yds avg lg tb fc i20 50+ blk
ROWLEY, Austin 39 1509 38.7 57 1 7 7 1 1
TEAM 1 0 0.0 0 0 0 0 0 0
Punt Returns no. yds avg td lg
SMITH, Patrick 8 14 1.8 0 10
SELLERS, V. 1 29 29.0 0 0
ARMSTRONG, N. 1 1 1.0 0 1
JOHNSON, DeVon 1 -3 -3.0 0 0
Total 11 41 3.7 0 10
Opponents 12 117 9.8 1 35
Kick Returns no. yds avg td lg
ROWLAND, Chris 10 208 20.8 0 33
JOHNSON, DeVon 8 207 25.9 1 96
SMITH, Patrick 6 148 24.7 0 50
NEWBOLD, Steven 5 99 19.8 0 35
KILLINGS, R. 1 13 13.0 0 13
Total 30 675 22.5 1 96
Opponents 20 405 20.2 0 45
All Purpose g rush rcv pr kr ir total avg/g
SMITH, Patrick 7 16 374 14 148 0 552 78.9
NEWBOLD, Stev 7 0 382 0 99 0 481 68.7
ROWLAND, Chri 7 83 125 0 208 0 416 59.4
JOHNSON, DeV 5 0 148 -3 207 0 352 70.4
CURTIS, Sabree 7 218 42 0 0 0 260 37.1
Total 7 727 1277 41 675 168 2888 412.6
Opponents 7 1270 897 117 405 71 2760 394.3
Total Offense g plays rush pass total avg/g
HUGHES, Michael 7 178 -65 980 915 130.7
HARRIS, Treon 4 70 99 295 394 98.5
ROWLAND, Seth 6 63 241 0 241 40.2
CURTIS, Sabree 7 57 218 0 218 31.1
KNOX, Andrew 7 39 133 0 133 19.0
Total 7 442 727 1277 2004 286.3
Opponents 7 447 1270 897 2167 309.6
Tackles Sacks Pass defense Fumbles blkd
## Defensive Leaders gp ua a tot tfl/yds no-yds int-yds brup qbh rcv-yds ff kick saf
32 COLLINS, Chris 7 36 29 65 6.5-21 1.0-9 . 1 1 . . . .
26 COOK, Laquarius 7 26 21 47 1.5-4 . 1-0 1 . . . . .
19 NORTH, Justin 7 23 23 46 8.5-27 1.0-5 1-22 . . . 2 . .
30 EDWARDS, Blair 7 27 14 41 5.0-5 1.0-1 . 1 2 1-0 1 . .
25 SELLERS, V. 7 25 8 33 1.0-3 . 2-78 5 . . . 1 1
Total 7 272 189 461 40-114 6-34 10-168 20 15 2-0 3 2 2
Opponents 7 251 218 469 52-229 24-156 7-71 20 22 8-22 8 2 1
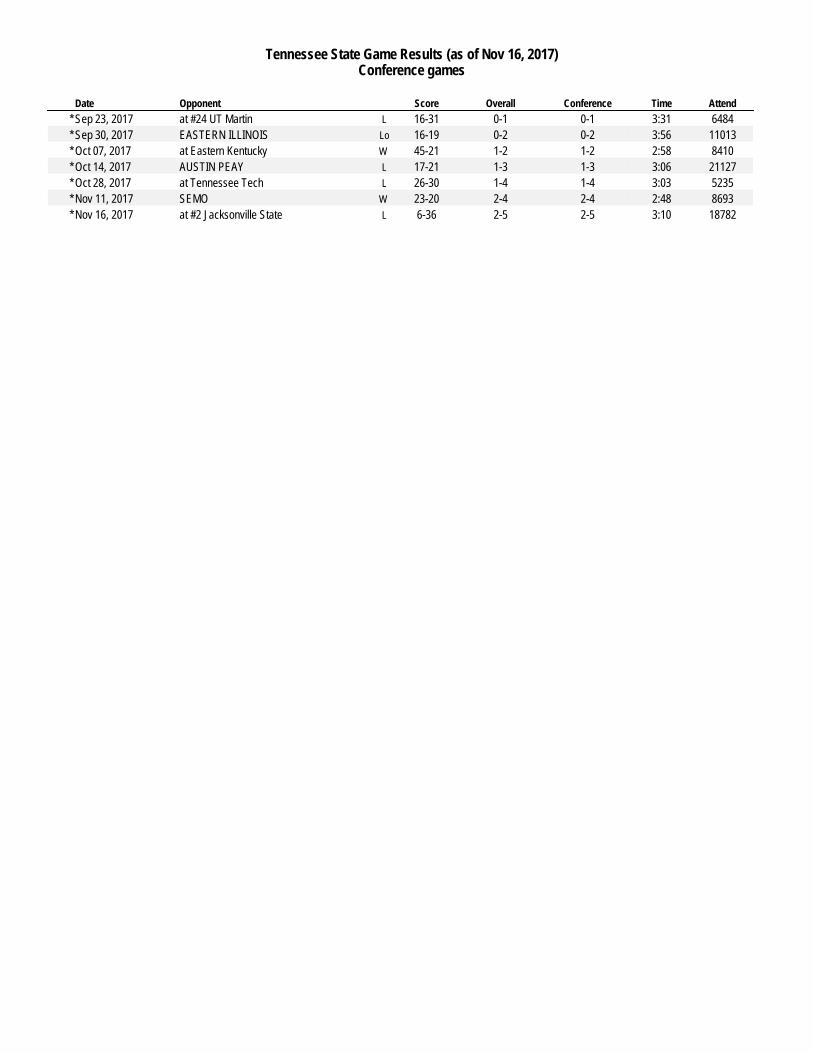
Tennessee State Game Results (as of Nov 16, 2017)
Conference games
Date Opponent Score Overall Conference Time Attend
* Sep 23, 2017 at #24 UT Martin L 16-31 0-1 0-1 3:31 6484
* Sep 30, 2017 EASTERN ILLINOIS L o 16-19 0-2 0-2 3:56 11013
* Oct 07, 2017 at Eastern Kentucky W 45-21 1-2 1-2 2:58 8410
* Oct 14, 2017 AUSTIN PEAY L 17-21 1-3 1-3 3:06 21127
* Oct 28, 2017 at Tennessee Tech L 26-30 1-4 1-4 3:03 5235
* Nov 11, 2017 SEMO W 23-20 2-4 2-4 2:48 8693
* Nov 16, 2017 at #2 Jacksonville State L 6-36 2-5 2-5 3:10 18782
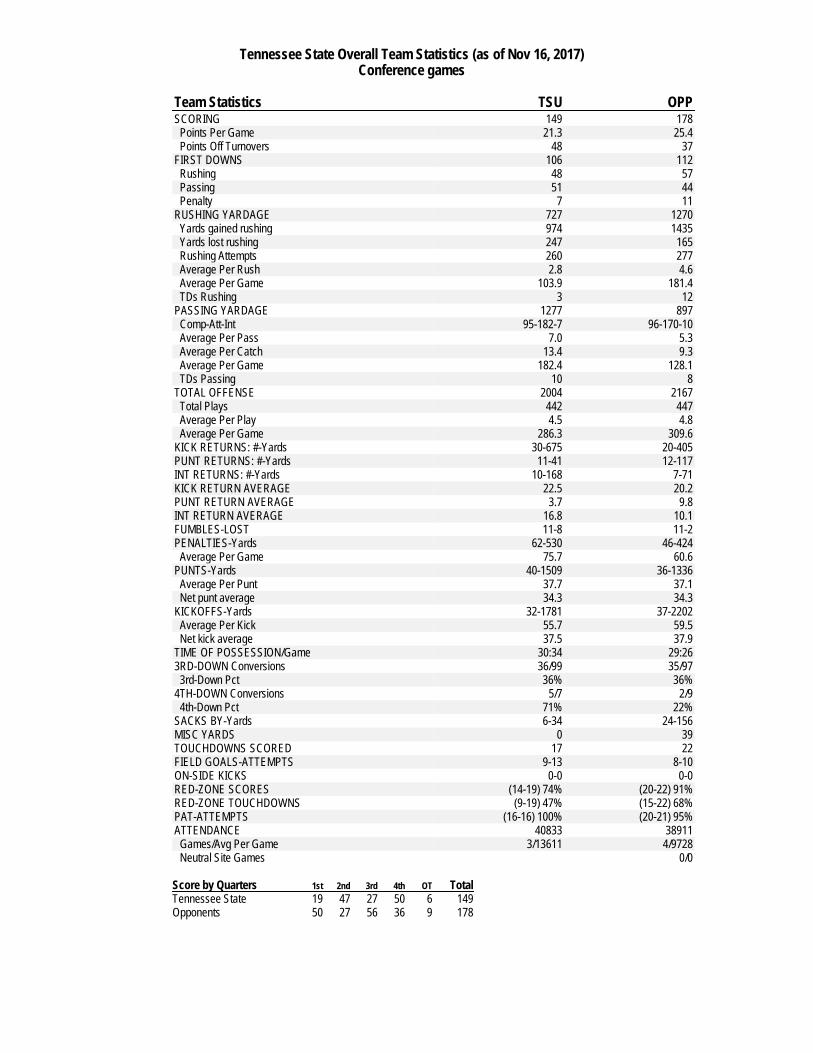
Tennessee State Overall Team Statistics (as of Nov 16, 2017)
Conference games
Team Statistics TSU OPP
SCORING 149 178
Points Per Game 21.3 25.4
Points Off Turnovers 48 37
FIRST DOWNS 106 112
R u s h i n g 48 57
P a s s i n g 51 44
P e n a l t y 7 11
RUSHING YARDAGE 727 1270
Yards gained rushing 974 1435
Yards lost rushing 247 165
Rushing Attempts 260 277
Average Per Rush 2.8 4.6
Average Per Game 103.9 181.4
TDs Rushing 3 12
PASSING YARDAGE 1277 897
C o m p - A t t - I n t 95-182-7 96-170-10
Average Per Pass 7.0 5.3
Average Per Catch 13.4 9.3
Average Per Game 182.4 128.1
TDs Passing 10 8
TOTAL OFFENSE 2004 2167
Total Plays 442 447
Average Per Play 4.5 4.8
Average Per Game 286.3 309.6
KICK RETURNS: #-Yards 30-675 20-405
PUNT RETURNS: #-Yards 11-41 12-117
INT RETURNS: #-Yards 10-168 7-71
KICK RETURN AVERAGE 22.5 20.2
PUNT RETURN AVERAGE 3.7 9.8
INT RETURN AVERAGE 16.8 10.1
FUMBLES-LOST 11-8 11-2
PENALTIES-Yards 62-530 46-424
Average Per Game 75.7 60.6
PUNTS-Yards 40-1509 36-1336
Average Per Punt 37.7 37.1
Net punt average 34.3 34.3
KICKOFFS-Yards 32-1781 37-2202
Average Per Kick 55.7 59.5
Net kick average 37.5 37.9
TIME OF POSSESSION/Game 3 0 : 3 4 2 9 : 2 6
3RD-DOWN Conversions 36/99 35/97
3rd-Down Pct 36% 36%
4TH-DOWN Conversions 5/7 2/9
4th-Down Pct 71% 22%
SACKS BY-Yards 6-34 24-156
MISC YARDS 0 39
TOUCHDOWNS SCORED 17 22
FIELD GOALS-ATTEMPTS 9-13 8-10
ON-SIDE KICKS 0-0 0-0
RED-ZONE SCORES (14-19) 74% (20-22) 91%
RED-ZONE TOUCHDOWNS (9-19) 47% (15-22) 68%
PAT-ATTEMPTS (16-16) 100% (20-21) 95%
ATTENDANCE 40833 38911
Games/Avg Per Game 3/13611 4/9728
Neutral Site Games 0/0
Score by Quarters 1st 2nd 3rd 4th OT Total
Tennessee State 19 47 27 50 6 149
Opponents 50 27 56 36 9 178
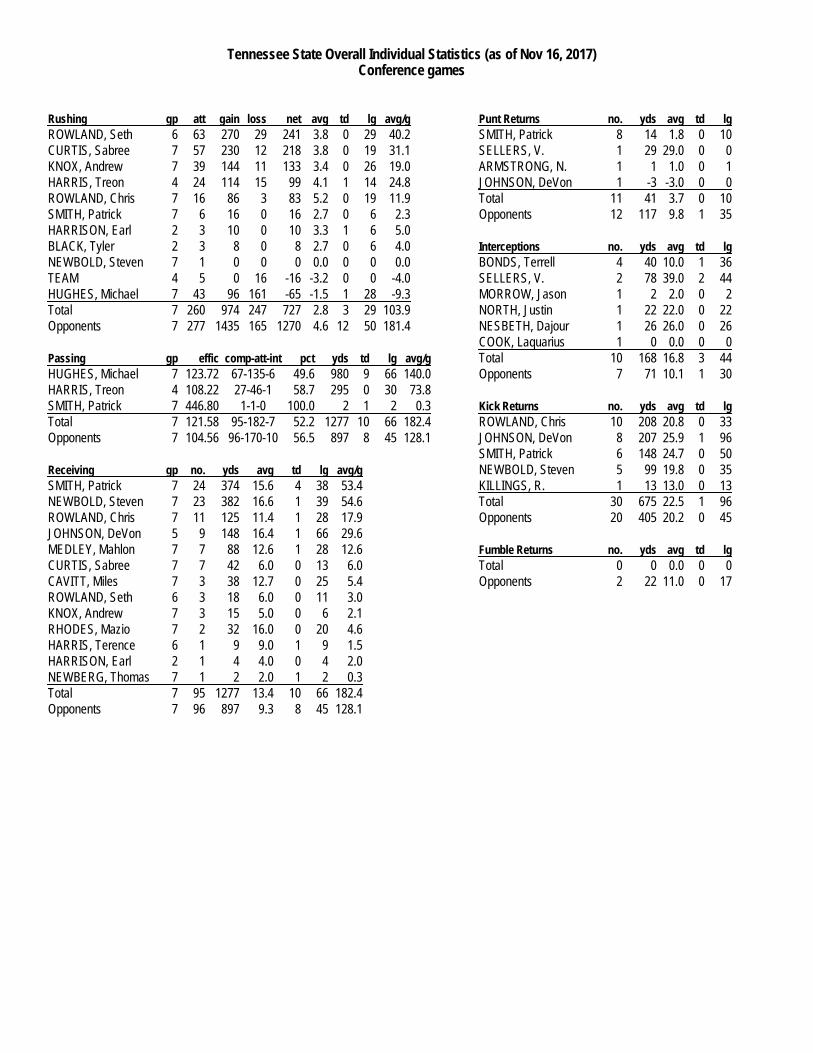
Tennessee State Overall Individual Statistics (as of Nov 16, 2017)
Conference games
Rushing gp att gain loss net avg td lg avg/g
ROWLAND, Seth 6 63 270 29 241 3.8 0 29 40.2
CURTIS, Sabree 7 57 230 12 218 3.8 0 19 31.1
KNOX, Andrew 7 39 144 11 133 3.4 0 26 19.0
HARRIS, Treon 4 24 114 15 99 4.1 1 14 24.8
ROWLAND, Chris 7 16 86 3 83 5.2 0 19 11.9
SMITH, Patrick 7 6 16 0 16 2.7 0 6 2.3
HARRISON, Earl 2 3 10 0 10 3.3 1 6 5.0
BLACK, Tyler 2 3 8 0 8 2.7 0 6 4.0
NEWBOLD, Steven 7 1 0 0 0 0.0 0 0 0.0
TEAM 4 5 0 16 -16 -3.2 0 0 -4.0
HUGHES, Michael 7 43 96 161 -65 -1.5 1 28 -9.3
Total 7 260 974 247 727 2.8 3 29 103.9
Opponents 7 277 1435 165 1270 4.6 12 50 181.4
Passing gp effic comp-att-int pct yds td lg avg/g
HUGHES, Michael 7 123.72 67-135-6 49.6 980 9 66 140.0
HARRIS, Treon 4 108.22 27-46-1 58.7 295 0 30 73.8
SMITH, Patrick 7 446.80 1-1-0 100.0 2 1 2 0.3
Total 7 121.58 95-182-7 52.2 1277 10 66 182.4
Opponents 7 104.56 96-170-10 56.5 897 8 45 128.1
Receiving gp no. yds avg td lg avg/g
SMITH, Patrick 7 24 374 15.6 4 38 53.4
NEWBOLD, Steven 7 23 382 16.6 1 39 54.6
ROWLAND, Chris 7 11 125 11.4 1 28 17.9
JOHNSON, DeVon 5 9 148 16.4 1 66 29.6
MEDLEY, Mahlon 7 7 88 12.6 1 28 12.6
CURTIS, Sabree 7 7 42 6.0 0 13 6.0
CAVITT, Miles 7 3 38 12.7 0 25 5.4
ROWLAND, Seth 6 3 18 6.0 0 11 3.0
KNOX, Andrew 7 3 15 5.0 0 6 2.1
RHODES, Mazio 7 2 32 16.0 0 20 4.6
HARRIS, Terence 6 1 9 9.0 1 9 1.5
HARRISON, Earl 2 1 4 4.0 0 4 2.0
NEWBERG, Thomas 7 1 2 2.0 1 2 0.3
Total 7 95 1277 13.4 10 66 182.4
Opponents 7 96 897 9.3 8 45 128.1
Punt Returns no. yds avg td lg
SMITH, Patrick 8 14 1.8 0 10
SELLERS, V. 1 29 29.0 0 0
ARMSTRONG, N. 1 1 1.0 0 1
JOHNSON, DeVon 1 -3 -3.0 0 0
Total 11 41 3.7 0 10
Opponents 12 117 9.8 1 35
Interceptions no. yds avg td lg
BONDS, Terrell 4 40 10.0 1 36
SELLERS, V. 2 78 39.0 2 44
MORROW, Jason 1 2 2.0 0 2
NORTH, Justin 1 22 22.0 0 22
NESBETH, Dajour 1 26 26.0 0 26
COOK, Laquarius 1 0 0.0 0 0
Total 10 168 16.8 3 44
Opponents 7 71 10.1 1 30
Kick Returns no. yds avg td lg
ROWLAND, Chris 10 208 20.8 0 33
JOHNSON, DeVon 8 207 25.9 1 96
SMITH, Patrick 6 148 24.7 0 50
NEWBOLD, Steven 5 99 19.8 0 35
KILLINGS, R. 1 13 13.0 0 13
Total 30 675 22.5 1 96
Opponents 20 405 20.2 0 45
Fumble Returns no. yds avg td lg
Total 0 0 0.0 0 0
Opponents 2 22 11.0 0 17
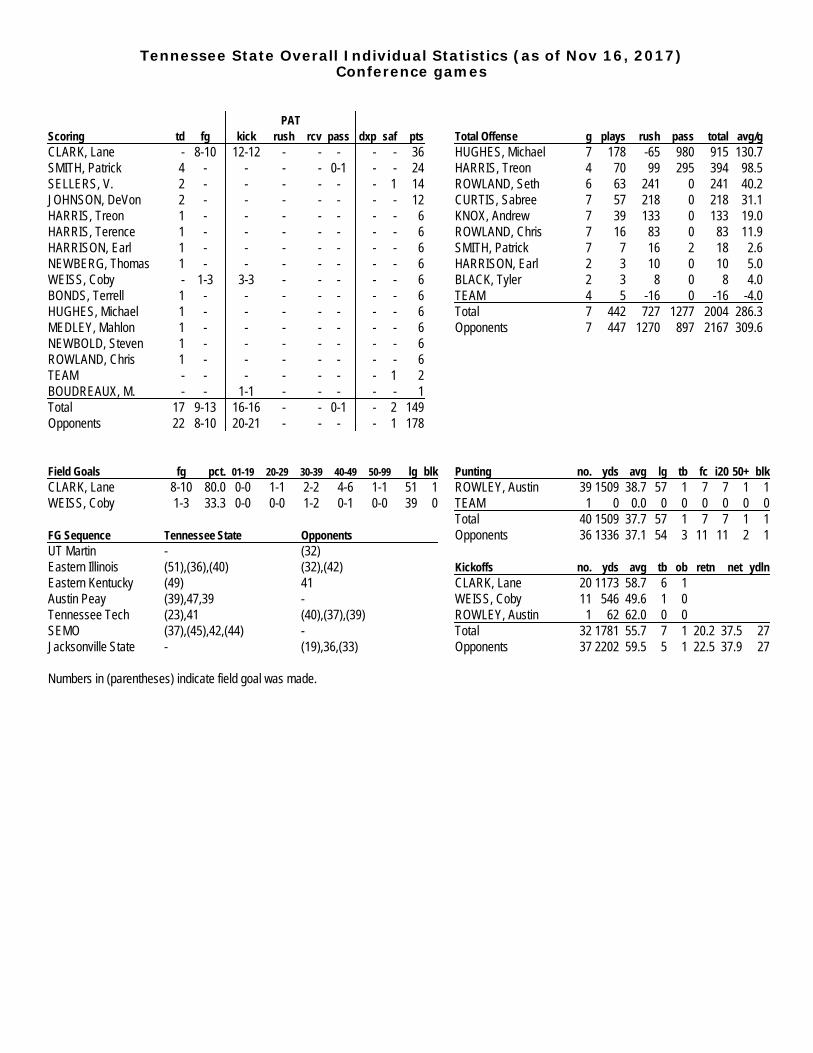
Tennessee State Overall Individual Statistics (as of Nov 16, 2017)
Conference games
PAT
Scoring td fg kick rush rcv pass dxp saf pts
CLARK, Lane - 8-10 12-12 - - - - - 36
SMITH, Patrick 4 - - - - 0-1 - - 24
SELLERS, V. 2 - - - - - - 1 14
JOHNSON, DeVon 2 - - - - - - - 12
HARRIS, Treon 1 - - - - - - - 6
HARRIS, Terence 1 - - - - - - - 6
HARRISON, Earl 1 - - - - - - - 6
NEWBERG, Thomas 1 - - - - - - - 6
WEISS, Coby - 1-3 3-3 - - - - - 6
BONDS, Terrell 1 - - - - - - - 6
HUGHES, Michael 1 - - - - - - - 6
MEDLEY, Mahlon 1 - - - - - - - 6
NEWBOLD, Steven 1 - - - - - - - 6
ROWLAND, Chris 1 - - - - - - - 6
TEAM - - - - - - - 1 2
BOUDREAUX, M. - - 1-1 - - - - - 1
Total 17 9-13 16-16 - - 0-1 - 2 149
Opponents 22 8-10 20-21 - - - - 1 178
Total Offense g plays rush pass total avg/g
HUGHES, Michael 7 178 -65 980 915 130.7
HARRIS, Treon 4 70 99 295 394 98.5
ROWLAND, Seth 6 63 241 0 241 40.2
CURTIS, Sabree 7 57 218 0 218 31.1
KNOX, Andrew 7 39 133 0 133 19.0
ROWLAND, Chris 7 16 83 0 83 11.9
SMITH, Patrick 7 7 16 2 18 2.6
HARRISON, Earl 2 3 10 0 10 5.0
BLACK, Tyler 2 3 8 0 8 4.0
TEAM 4 5 -16 0 -16 -4.0
Total 7 442 727 1277 2004 286.3
Opponents 7 447 1270 897 2167 309.6
Field Goals fg pct. 01-19 20-29 30-39 40-49 50-99 lg blk
CLARK, Lane 8-10 80.0 0-0 1-1 2-2 4-6 1-1 51 1
WEISS, Coby 1-3 33.3 0-0 0-0 1-2 0-1 0-0 39 0
FG Sequence Tennessee State Opponents
UT Martin - (32)
Eastern Illinois (51),(36),(40) (32),(42)
Eastern Kentucky (49) 41
Austin Peay (39),47,39 -
Tennessee Tech (23),41 (40),(37),(39)
SEMO (37),(45),42,(44) -
Jacksonville State - (19),36,(33)
Numbers in (parentheses) indicate field goal was made.
Punting no. yds avg lg tb fc i20 50+ blk
ROWLEY, Austin 39 1509 38.7 57 1 7 7 1 1
TEAM 1 0 0.0 0 0 0 0 0 0
Total 40 1509 37.7 57 1 7 7 1 1
Opponents 36 1336 37.1 54 3 11 11 2 1
Kickoffs no. yds avg tb ob retn net ydln
CLARK, Lane 20 1173 58.7 6 1
WEISS, Coby 11 546 49.6 1 0
ROWLEY, Austin 1 62 62.0 0 0
Total 32 1781 55.7 7 1 20.2 37.5 27
Opponents 37 2202 59.5 5 1 22.5 37.9 27
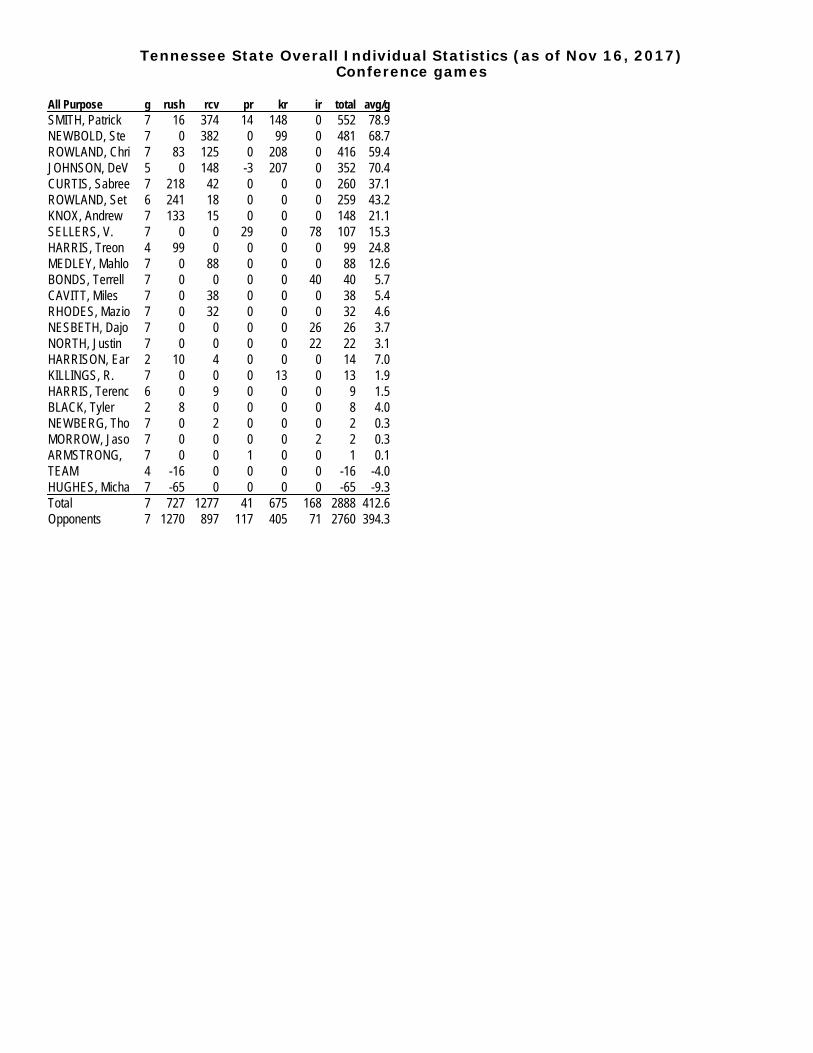
Tennessee State Overall Individual Statistics (as of Nov 16, 2017)
Conference games
All Purpose g rush rcv pr kr ir total avg/g
SMITH, Patrick 7 16 374 14 148 0 552 78.9
NEWBOLD, Ste 7 0 382 0 99 0 481 68.7
ROWLAND, Chri 7 83 125 0 208 0 416 59.4
JOHNSON, DeV 5 0 148 -3 207 0 352 70.4
CURTIS, Sabree 7 218 42 0 0 0 260 37.1
ROWLAND, Set 6 241 18 0 0 0 259 43.2
KNOX, Andrew 7 133 15 0 0 0 148 21.1
SELLERS, V. 7 0 0 29 0 78 107 15.3
HARRIS, Treon 4 99 0 0 0 0 99 24.8
MEDLEY, Mahlo 7 0 88 0 0 0 88 12.6
BONDS, Terrell 7 0 0 0 0 40 40 5.7
CAVITT, Miles 7 0 38 0 0 0 38 5.4
RHODES, Mazio 7 0 32 0 0 0 32 4.6
NESBETH, Dajo 7 0 0 0 0 26 26 3.7
NORTH, Justin 7 0 0 0 0 22 22 3.1
HARRISON, Ear 2 10 4 0 0 0 14 7.0
KILLINGS, R. 7 0 0 0 13 0 13 1.9
HARRIS, Terenc 6 0 9 0 0 0 9 1.5
BLACK, Tyler 2 8 0 0 0 0 8 4.0
NEWBERG, Tho 7 0 2 0 0 0 2 0.3
MORROW, Jaso 7 0 0 0 0 2 2 0.3
A R M S T R O N G , 7 0 0 1 0 0 1 0.1
TEAM 4 -16 0 0 0 0 -16 -4.0
HUGHES, Micha 7 -65 0 0 0 0 -65 -9.3
Total 7 727 1277 41 675 168 2888 412.6
Opponents 7 1270 897 117 405 71 2760 394.3
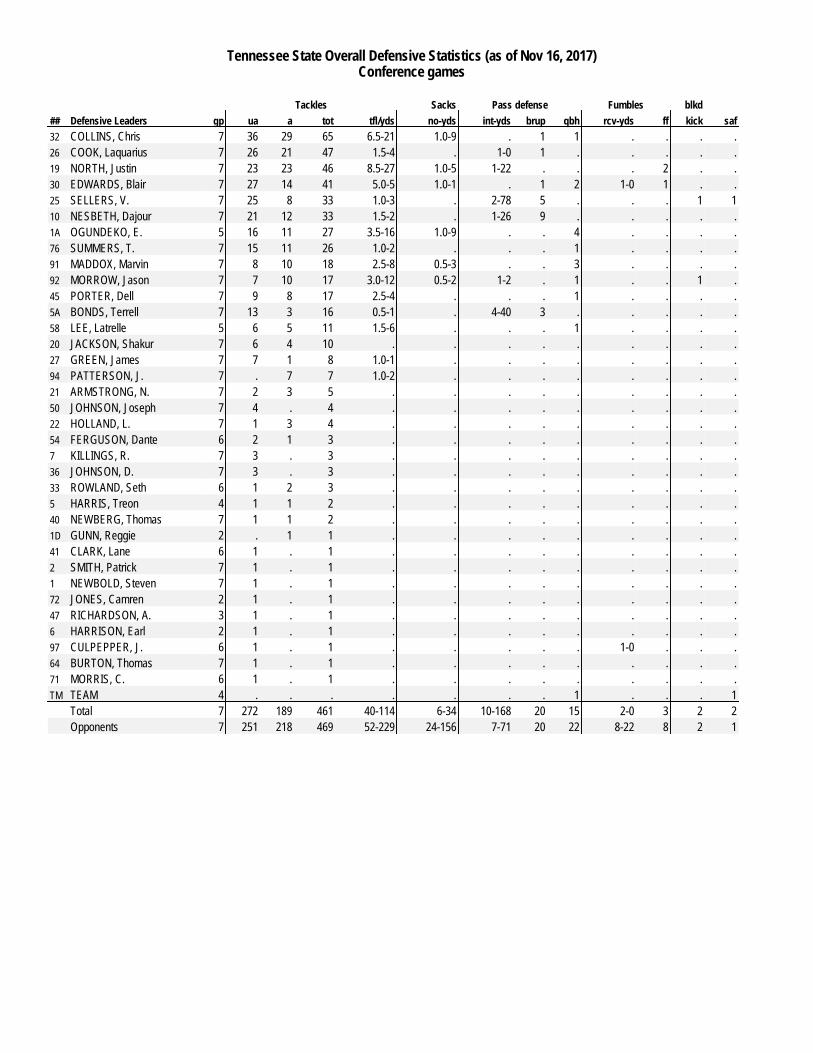
Tennessee State Overall Defensive Statistics (as of Nov 16, 2017)
Conference games
Tackles Sacks Pass defense Fumbles blkd
## Defensive Leaders gp ua a tot tfl/yds no-yds int-yds brup qbh rcv-yds ff kick saf
32 COLLINS, Chris 7 36 29 65 6.5-21 1.0-9 . 1 1 . . . .
26 COOK, Laquarius 7 26 21 47 1.5-4 . 1-0 1 . . . . .
19 NORTH, Justin 7 23 23 46 8.5-27 1.0-5 1-22 . . . 2 . .
30 EDWARDS, Blair 7 27 14 41 5.0-5 1.0-1 . 1 2 1-0 1 . .
25 SELLERS, V. 7 25 8 33 1.0-3 . 2-78 5 . . . 1 1
10 NESBETH, Dajour 7 21 12 33 1.5-2 . 1-26 9 . . . . .
1A OGUNDEKO, E. 5 16 11 27 3.5-16 1.0-9 . . 4 . . . .
76 SUMMERS, T. 7 15 11 26 1.0-2 . . . 1 . . . .
91 MADDOX, Marvin 7 8 10 18 2.5-8 0.5-3 . . 3 . . . .
92 MORROW, Jason 7 7 10 17 3.0-12 0.5-2 1-2 . 1 . . 1 .
45 PORTER, Dell 7 9 8 17 2.5-4 . . . 1 . . . .
5A BONDS, Terrell 7 13 3 16 0.5-1 . 4-40 3 . . . . .
58 LEE, Latrelle 5 6 5 11 1.5-6 . . . 1 . . . .
20 JACKSON, Shakur 7 6 4 10 . . . . . . . . .
27 GREEN, James 7 7 1 8 1.0-1 . . . . . . . .
94 PATTERSON, J. 7 . 7 7 1.0-2 . . . . . . . .
21 ARMSTRONG, N. 7 2 3 5 . . . . . . . . .
50 JOHNSON, Joseph 7 4 . 4 . . . . . . . . .
22 HOLLAND, L. 7 1 3 4 . . . . . . . . .
54 FERGUSON, Dante 6 2 1 3 . . . . . . . . .
7 KILLINGS, R. 7 3 . 3 . . . . . . . . .
36 JOHNSON, D. 7 3 . 3 . . . . . . . . .
33 ROWLAND, Seth 6 1 2 3 . . . . . . . . .
5 HARRIS, Treon 4 1 1 2 . . . . . . . . .
40 NEWBERG, Thomas 7 1 1 2 . . . . . . . . .
1D GUNN, Reggie 2 . 1 1 . . . . . . . . .
41 CLARK, Lane 6 1 . 1 . . . . . . . . .
2 SMITH, Patrick 7 1 . 1 . . . . . . . . .
1 NEWBOLD, Steven 7 1 . 1 . . . . . . . . .
72 JONES, Camren 2 1 . 1 . . . . . . . . .
47 RICHARDSON, A. 3 1 . 1 . . . . . . . . .
6 HARRISON, Earl 2 1 . 1 . . . . . . . . .
97 CULPEPPER, J. 6 1 . 1 . . . . . 1-0 . . .
64 BURTON, Thomas 7 1 . 1 . . . . . . . . .
71 MORRIS, C. 6 1 . 1 . . . . . . . . .
TM TEAM 4 . . . . . . . 1 . . . 1
Total 7 272 189 461 40-114 6-34 10-168 20 15 2-0 3 2 2
Opponents 7 251 218 469 52-229 24-156 7-71 20 22 8-22 8 2 1
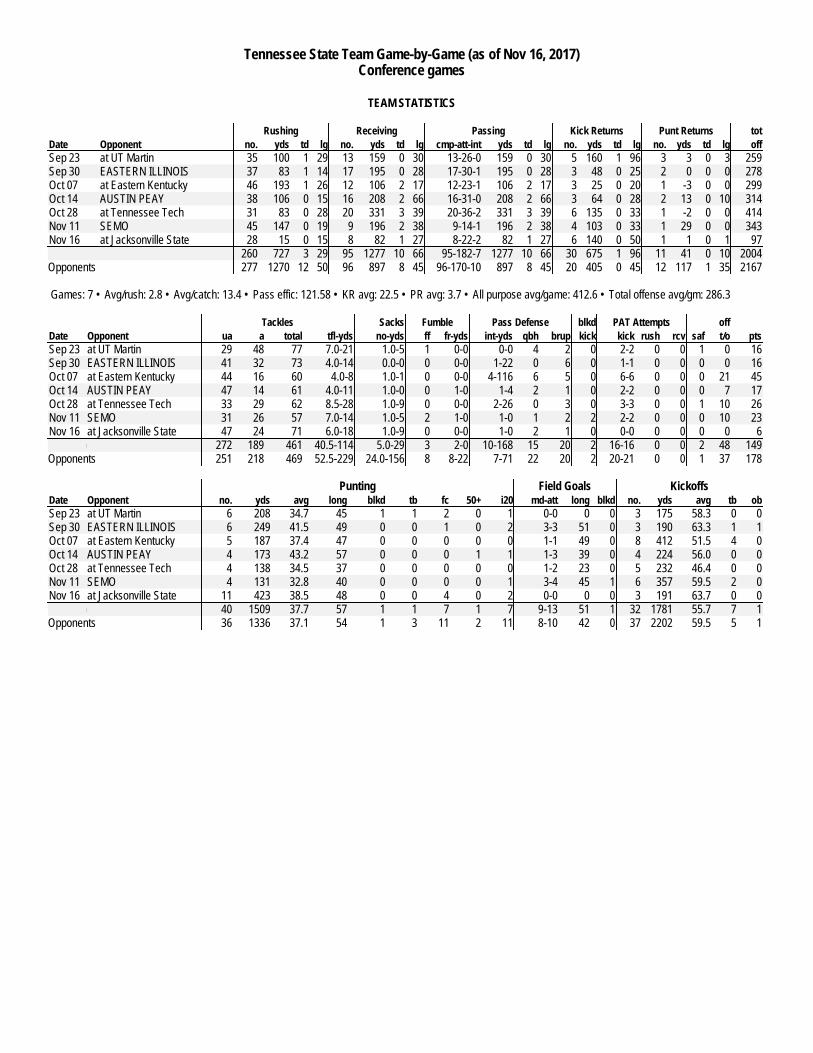
Tennessee State Team Game-by-Game (as of Nov 16, 2017)
Conference games
TEAM STATISTICS
Rushing Receiving Passing Kick Returns Punt Returns tot
Date Opponent no. yds td lg no. yds td lg cmp-att-int yds td lg no. yds td lg no. yds td lg off
Sep 23 at UT Martin 35 100 1 29 13 159 0 30 13-26-0 159 0 30 5 160 1 96 3 3 0 3 259
Sep 30 EASTERN ILLINOIS 37 83 1 14 17 195 0 28 17-30-1 195 0 28 3 48 0 25 2 0 0 0 278
Oct 07 at Eastern Kentucky 46 193 1 26 12 106 2 17 12-23-1 106 2 17 3 25 0 20 1 -3 0 0 299
Oct 14 AUSTIN PEAY 38 106 0 15 16 208 2 66 16-31-0 208 2 66 3 64 0 28 2 13 0 10 314
Oct 28 at Tennessee Tech 31 83 0 28 20 331 3 39 20-36-2 331 3 39 6 135 0 33 1 -2 0 0 414
Nov 11 SEMO 45 147 0 19 9 196 2 38 9-14-1 196 2 38 4 103 0 33 1 29 0 0 343
Nov 16 at Jacksonville State 28 15 0 15 8 82 1 27 8-22-2 82 1 27 6 140 0 50 1 1 0 1 97
Tennessee State 260 727 3 29 95 1277 10 66 95-182-7 1277 10 66 30 675 1 96 11 41 0 10 2004
Opponents 277 1270 12 50 96 897 8 45 96-170-10 897 8 45 20 405 0 45 12 117 1 35 2167
Games: 7 • Avg/rush: 2.8 • Avg/catch: 13.4 • Pass effic: 121.58 • KR avg: 22.5 • PR avg: 3.7 • All purpose avg/game: 412.6 • Total offense avg/gm: 286.3
Tackles Sacks Fumble Pass Defense blkd PAT Attempts off
Date Opponent ua a total tfl-yds no-yds ff fr-yds int-yds qbh brup kick kick rush rcv saf t/o pts
Sep 23 at UT Martin 29 48 77 7.0-21 1.0-5 1 0-0 0-0 4 2 0 2-2 0 0 1 0 16
Sep 30 EASTERN ILLINOIS 41 32 73 4.0-14 0.0-0 0 0-0 1-22 0 6 0 1-1 0 0 0 0 16
Oct 07 at Eastern Kentucky 44 16 60 4.0-8 1.0-1 0 0-0 4-116 6 5 0 6-6 0 0 0 21 45
Oct 14 AUSTIN PEAY 47 14 61 4.0-11 1.0-0 0 1-0 1-4 2 1 0 2-2 0 0 0 7 17
Oct 28 at Tennessee Tech 33 29 62 8.5-28 1.0-9 0 0-0 2-26 0 3 0 3-3 0 0 1 10 26
Nov 11 SEMO 31 26 57 7.0-14 1.0-5 2 1-0 1-0 1 2 2 2-2 0 0 0 10 23
Nov 16 at Jacksonville State 47 24 71 6.0-18 1.0-9 0 0-0 1-0 2 1 0 0-0 0 0 0 0 6
Tennessee State 272 189 461 40.5-114 5.0-29 3 2-0 10-168 15 20 2 16-16 0 0 2 48 149
Opponents 251 218 469 52.5-229 24.0-156 8 8-22 7-71 22 20 2 20-21 0 0 1 37 178
Punting Field Goals Kickoffs
Date Opponent no. yds avg long blkd tb fc 50+ i20 md-att long blkd no. yds avg tb ob
Sep 23 at UT Martin 6 208 34.7 45 1 1 2 0 1 0-0 0 0 3 175 58.3 0 0
Sep 30 EASTERN ILLINOIS 6 249 41.5 49 0 0 1 0 2 3-3 51 0 3 190 63.3 1 1
Oct 07 at Eastern Kentucky 5 187 37.4 47 0 0 0 0 0 1-1 49 0 8 412 51.5 4 0
Oct 14 AUSTIN PEAY 4 173 43.2 57 0 0 0 1 1 1-3 39 0 4 224 56.0 0 0
Oct 28 at Tennessee Tech 4 138 34.5 37 0 0 0 0 0 1-2 23 0 5 232 46.4 0 0
Nov 11 SEMO 4 131 32.8 40 0 0 0 0 1 3-4 45 1 6 357 59.5 2 0
Nov 16 at Jacksonville State 11 423 38.5 48 0 0 4 0 2 0-0 0 0 3 191 63.7 0 0
Tennessee State 40 1509 37.7 57 1 1 7 1 7 9-13 51 1 32 1781 55.7 7 1
Opponents 36 1336 37.1 54 1 3 11 2 11 8-10 42 0 37 2202 59.5 5 1
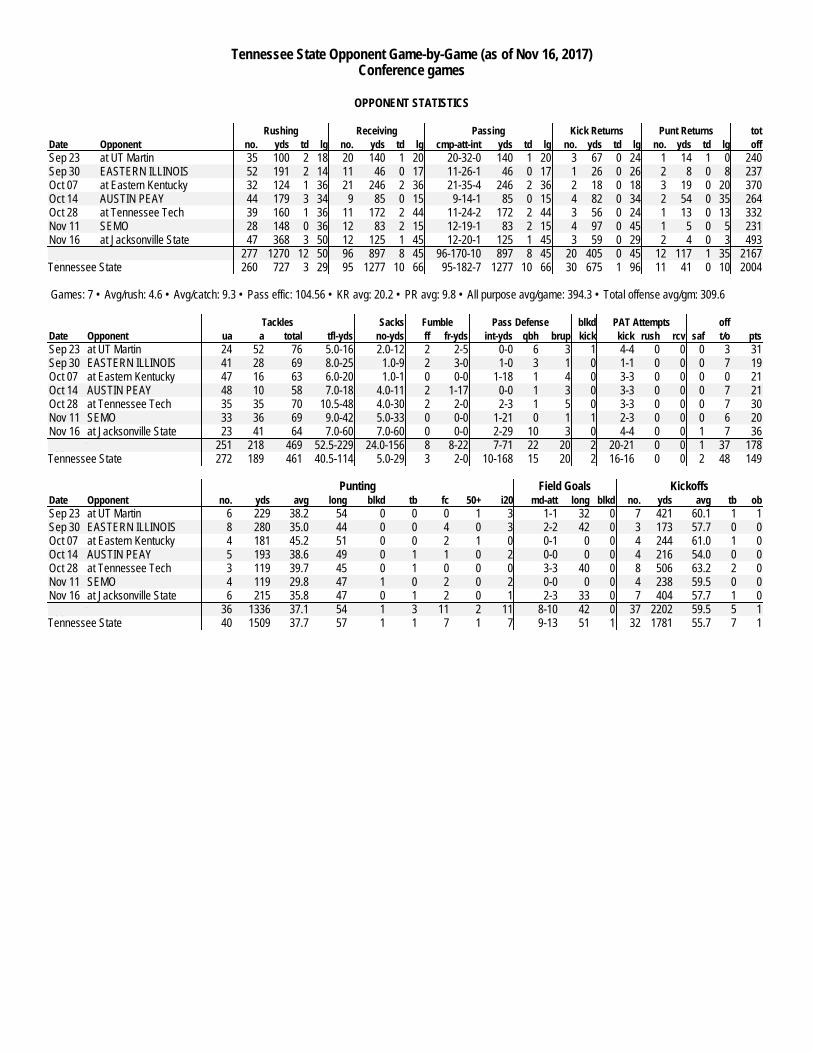
Tennessee State Opponent Game-by-Game (as of Nov 16, 2017)
Conference games
OPPONENT STATISTICS
Rushing Receiving Passing Kick Returns Punt Returns tot
Date Opponent no. yds td lg no. yds td lg cmp-att-int yds td lg no. yds td lg no. yds td lg off
Sep 23 at UT Martin 35 100 2 18 20 140 1 20 20-32-0 140 1 20 3 67 0 24 1 14 1 0 240
Sep 30 EASTERN ILLINOIS 52 191 2 14 11 46 0 17 11-26-1 46 0 17 1 26 0 26 2 8 0 8 237
Oct 07 at Eastern Kentucky 32 124 1 36 21 246 2 36 21-35-4 246 2 36 2 18 0 18 3 19 0 20 370
Oct 14 AUSTIN PEAY 44 179 3 34 9 85 0 15 9-14-1 85 0 15 4 82 0 34 2 54 0 35 264
Oct 28 at Tennessee Tech 39 160 1 36 11 172 2 44 11-24-2 172 2 44 3 56 0 24 1 13 0 13 332
Nov 11 SEMO 28 148 0 36 12 83 2 15 12-19-1 83 2 15 4 97 0 45 1 5 0 5 231
Nov 16 at Jacksonville State 47 368 3 50 12 125 1 45 12-20-1 125 1 45 3 59 0 29 2 4 0 3 493
Opponents 277 1270 12 50 96 897 8 45 96-170-10 897 8 45 20 405 0 45 12 117 1 35 2167
Tennessee State 260 727 3 29 95 1277 10 66 95-182-7 1277 10 66 30 675 1 96 11 41 0 10 2004
Games: 7 • Avg/rush: 4.6 • Avg/catch: 9.3 • Pass effic: 104.56 • KR avg: 20.2 • PR avg: 9.8 • All purpose avg/game: 394.3 • Total offense avg/gm: 309.6
Tackles Sacks Fumble Pass Defense blkd PAT Attempts off
Date Opponent ua a total tfl-yds no-yds ff fr-yds int-yds qbh brup kick kick rush rcv saf t/o pts
Sep 23 at UT Martin 24 52 76 5.0-16 2.0-12 2 2-5 0-0 6 3 1 4-4 0 0 0 3 31
Sep 30 EASTERN ILLINOIS 41 28 69 8.0-25 1.0-9 2 3-0 1-0 3 1 0 1-1 0 0 0 7 19
Oct 07 at Eastern Kentucky 47 16 63 6.0-20 1.0-1 0 0-0 1-18 1 4 0 3-3 0 0 0 0 21
Oct 14 AUSTIN PEAY 48 10 58 7.0-18 4.0-11 2 1-17 0-0 1 3 0 3-3 0 0 0 7 21
Oct 28 at Tennessee Tech 35 35 70 10.5-48 4.0-30 2 2-0 2-3 1 5 0 3-3 0 0 0 7 30
Nov 11 SEMO 33 36 69 9.0-42 5.0-33 0 0-0 1-21 0 1 1 2-3 0 0 0 6 20
Nov 16 at Jacksonville State 23 41 64 7.0-60 7.0-60 0 0-0 2-29 10 3 0 4-4 0 0 1 7 36
Opponents 251 218 469 52.5-229 24.0-156 8 8-22 7-71 22 20 2 20-21 0 0 1 37 178
Tennessee State 272 189 461 40.5-114 5.0-29 3 2-0 10-168 15 20 2 16-16 0 0 2 48 149
Punting Field Goals Kickoffs
Date Opponent no. yds avg long blkd tb fc 50+ i20 md-att long blkd no. yds avg tb ob
Sep 23 at UT Martin 6 229 38.2 54 0 0 0 1 3 1-1 32 0 7 421 60.1 1 1
Sep 30 EASTERN ILLINOIS 8 280 35.0 44 0 0 4 0 3 2-2 42 0 3 173 57.7 0 0
Oct 07 at Eastern Kentucky 4 181 45.2 51 0 0 2 1 0 0-1 0 0 4 244 61.0 1 0
Oct 14 AUSTIN PEAY 5 193 38.6 49 0 1 1 0 2 0-0 0 0 4 216 54.0 0 0
Oct 28 at Tennessee Tech 3 119 39.7 45 0 1 0 0 0 3-3 40 0 8 506 63.2 2 0
Nov 11 SEMO 4 119 29.8 47 1 0 2 0 2 0-0 0 0 4 238 59.5 0 0
Nov 16 at Jacksonville State 6 215 35.8 47 0 1 2 0 1 2-3 33 0 7 404 57.7 1 0
Opponents 36 1336 37.1 54 1 3 11 2 11 8-10 42 0 37 2202 59.5 5 1
Tennessee State 40 1509 37.7 57 1 1 7 1 7 9-13 51 1 32 1781 55.7 7 1
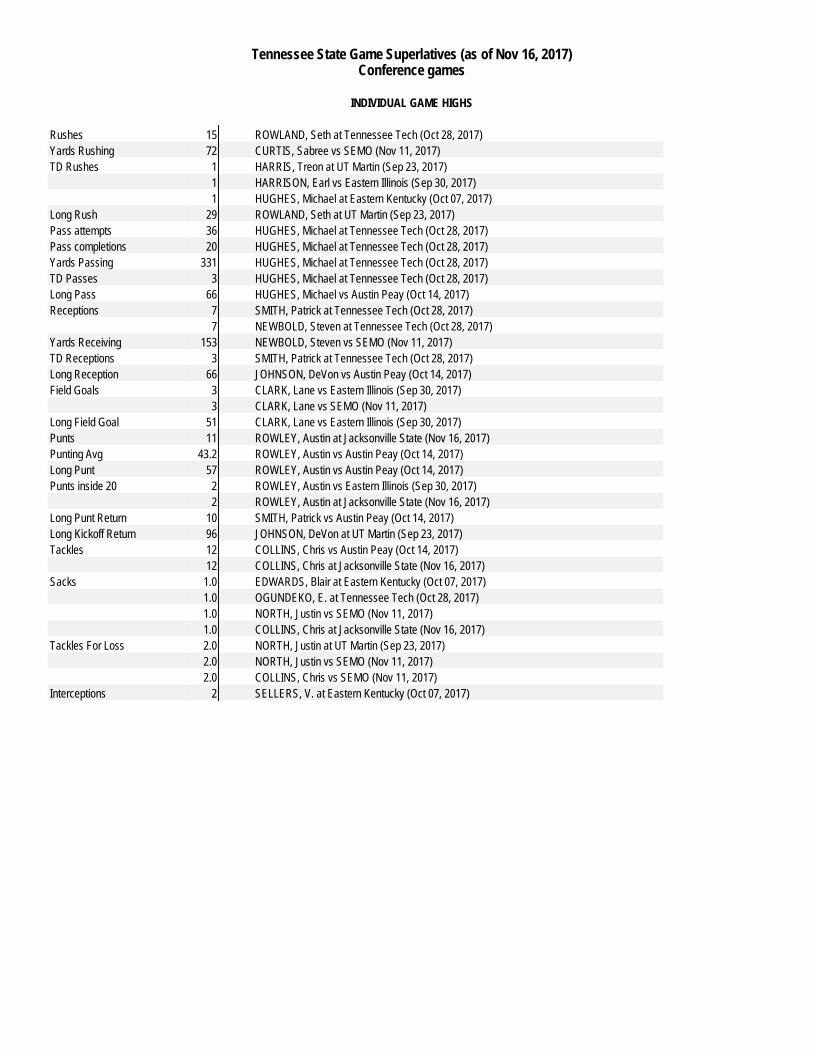
Tennessee State Game Superlatives (as of Nov 16, 2017)
Conference games
INDIVIDUAL GAME HIGHS
Rushes 15 ROWLAND, Seth at Tennessee Tech (Oct 28, 2017)
Yards Rushing 72 CURTIS, Sabree vs SEMO (Nov 11, 2017)
TD Rushes 1 HARRIS, Treon at UT Martin (Sep 23, 2017)
1 HARRISON, Earl vs Eastern Illinois (Sep 30, 2017)
1 HUGHES, Michael at Eastern Kentucky (Oct 07, 2017)
Long Rush 29 ROWLAND, Seth at UT Martin (Sep 23, 2017)
Pass attempts 36 HUGHES, Michael at Tennessee Tech (Oct 28, 2017)
Pass completions 20 HUGHES, Michael at Tennessee Tech (Oct 28, 2017)
Yards Passing 331 HUGHES, Michael at Tennessee Tech (Oct 28, 2017)
TD Passes 3 HUGHES, Michael at Tennessee Tech (Oct 28, 2017)
Long Pass 66 HUGHES, Michael vs Austin Peay (Oct 14, 2017)
Receptions 7 SMITH, Patrick at Tennessee Tech (Oct 28, 2017)
7 NEWBOLD, Steven at Tennessee Tech (Oct 28, 2017)
Yards Receiving 153 NEWBOLD, Steven vs SEMO (Nov 11, 2017)
TD Receptions 3 SMITH, Patrick at Tennessee Tech (Oct 28, 2017)
Long Reception 66 JOHNSON, DeVon vs Austin Peay (Oct 14, 2017)
Field Goals 3 CLARK, Lane vs Eastern Illinois (Sep 30, 2017)
3 CLARK, Lane vs SEMO (Nov 11, 2017)
Long Field Goal 51 CLARK, Lane vs Eastern Illinois (Sep 30, 2017)
Punts 11 ROWLEY, Austin at Jacksonville State (Nov 16, 2017)
Punting Avg 43.2 ROWLEY, Austin vs Austin Peay (Oct 14, 2017)
Long Punt 57 ROWLEY, Austin vs Austin Peay (Oct 14, 2017)
Punts inside 20 2 ROWLEY, Austin vs Eastern Illinois (Sep 30, 2017)
2 ROWLEY, Austin at Jacksonville State (Nov 16, 2017)
Long Punt Return 10 SMITH, Patrick vs Austin Peay (Oct 14, 2017)
Long Kickoff Return 96 JOHNSON, DeVon at UT Martin (Sep 23, 2017)
Tackles 12 COLLINS, Chris vs Austin Peay (Oct 14, 2017)
12 COLLINS, Chris at Jacksonville State (Nov 16, 2017)
Sacks 1.0 EDWARDS, Blair at Eastern Kentucky (Oct 07, 2017)
1.0 OGUNDEKO, E. at Tennessee Tech (Oct 28, 2017)
1.0 NORTH, Justin vs SEMO (Nov 11, 2017)
1.0 COLLINS, Chris at Jacksonville State (Nov 16, 2017)
Tackles For Loss 2.0 NORTH, Justin at UT Martin (Sep 23, 2017)
2.0 NORTH, Justin vs SEMO (Nov 11, 2017)
2.0 COLLINS, Chris vs SEMO (Nov 11, 2017)
Interceptions 2 SELLERS, V. at Eastern Kentucky (Oct 07, 2017)
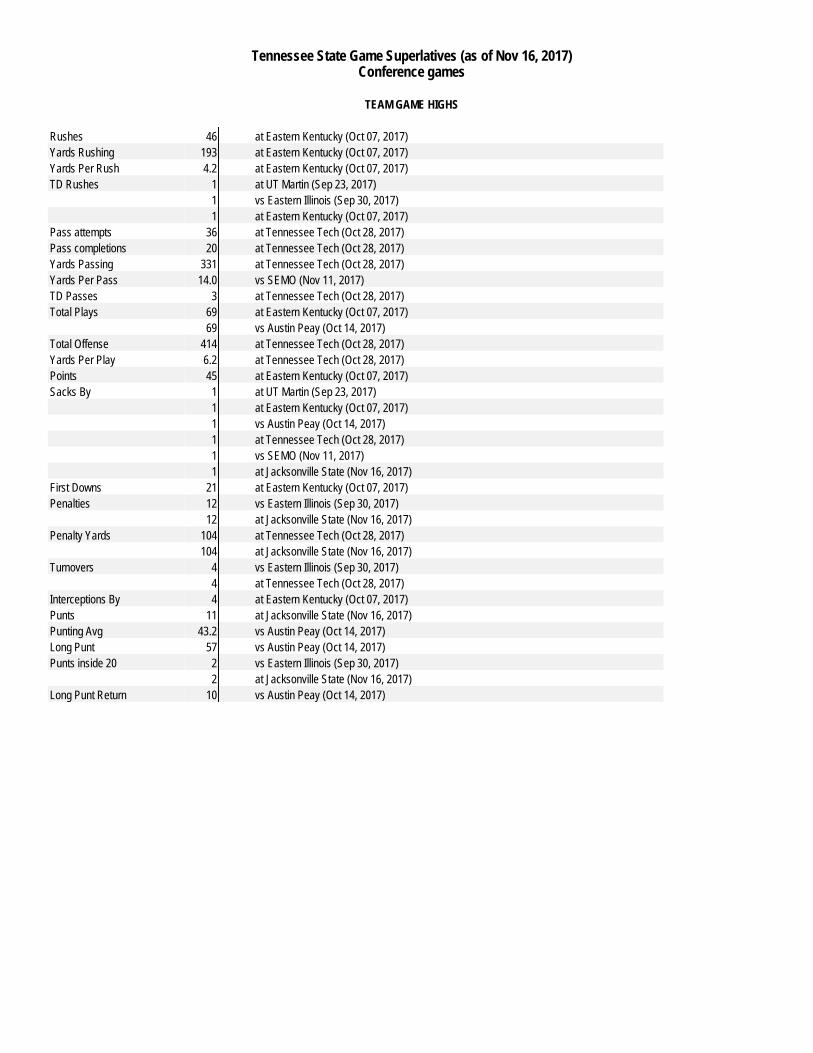
Tennessee State Game Superlatives (as of Nov 16, 2017)
Conference games
TEAM GAME HIGHS
Rushes 46 at Eastern Kentucky (Oct 07, 2017)
Yards Rushing 193 at Eastern Kentucky (Oct 07, 2017)
Yards Per Rush 4.2 at Eastern Kentucky (Oct 07, 2017)
TD Rushes 1 at UT Martin (Sep 23, 2017)
1 vs Eastern Illinois (Sep 30, 2017)
1 at Eastern Kentucky (Oct 07, 2017)
Pass attempts 36 at Tennessee Tech (Oct 28, 2017)
Pass completions 20 at Tennessee Tech (Oct 28, 2017)
Yards Passing 331 at Tennessee Tech (Oct 28, 2017)
Yards Per Pass 14.0 vs SEMO (Nov 11, 2017)
TD Passes 3 at Tennessee Tech (Oct 28, 2017)
Total Plays 69 at Eastern Kentucky (Oct 07, 2017)
69 vs Austin Peay (Oct 14, 2017)
Total Offense 414 at Tennessee Tech (Oct 28, 2017)
Yards Per Play 6.2 at Tennessee Tech (Oct 28, 2017)
Points 45 at Eastern Kentucky (Oct 07, 2017)
Sacks By 1 at UT Martin (Sep 23, 2017)
1 at Eastern Kentucky (Oct 07, 2017)
1 vs Austin Peay (Oct 14, 2017)
1 at Tennessee Tech (Oct 28, 2017)
1 vs SEMO (Nov 11, 2017)
1 at Jacksonville State (Nov 16, 2017)
First Downs 21 at Eastern Kentucky (Oct 07, 2017)
Penalties 12 vs Eastern Illinois (Sep 30, 2017)
12 at Jacksonville State (Nov 16, 2017)
Penalty Yards 104 at Tennessee Tech (Oct 28, 2017)
104 at Jacksonville State (Nov 16, 2017)
Turnovers 4 vs Eastern Illinois (Sep 30, 2017)
4 at Tennessee Tech (Oct 28, 2017)
Interceptions By 4 at Eastern Kentucky (Oct 07, 2017)
Punts 11 at Jacksonville State (Nov 16, 2017)
Punting Avg 43.2 vs Austin Peay (Oct 14, 2017)
Long Punt 57 vs Austin Peay (Oct 14, 2017)
Punts inside 20 2 vs Eastern Illinois (Sep 30, 2017)
2 at Jacksonville State (Nov 16, 2017)
Long Punt Return 10 vs Austin Peay (Oct 14, 2017)
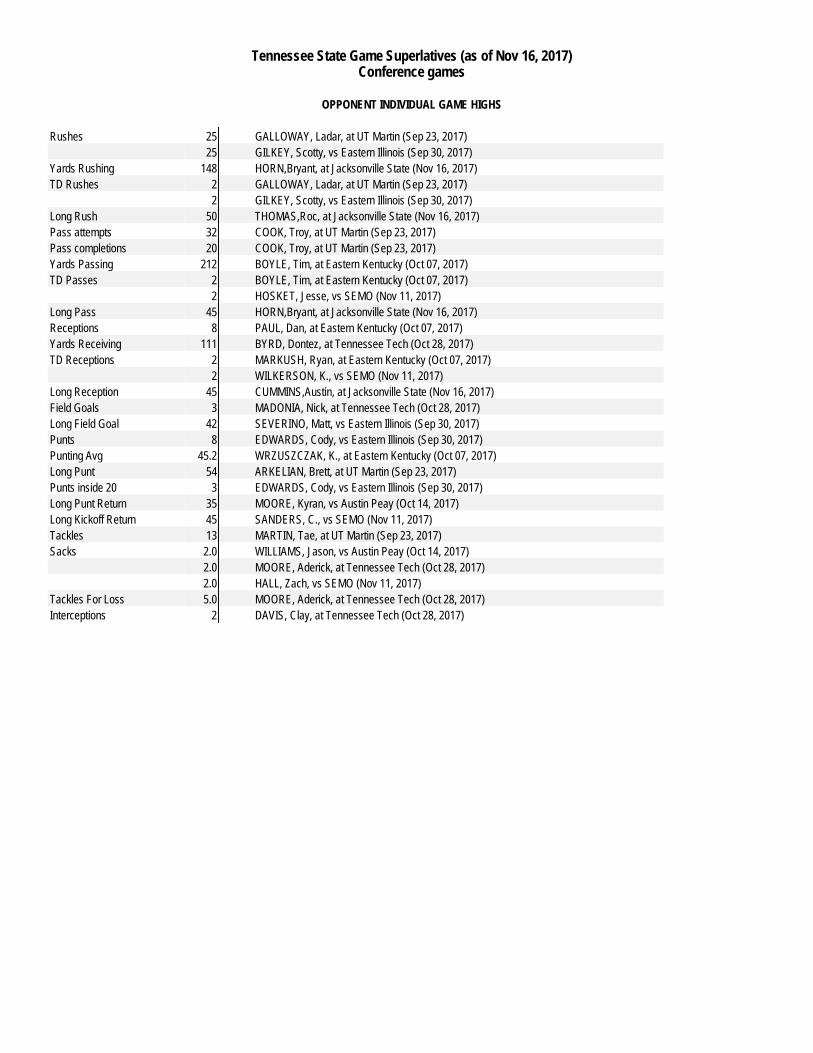
Tennessee State Game Superlatives (as of Nov 16, 2017)
Conference games
OPPONENT INDIVIDUAL GAME HIGHS
Rushes 25 GALLOWAY, Ladar, at UT Martin (Sep 23, 2017)
25 GILKEY, Scotty, vs Eastern Illinois (Sep 30, 2017)
Yards Rushing 148 HORN,Bryant, at Jacksonville State (Nov 16, 2017)
TD Rushes 2 GALLOWAY, Ladar, at UT Martin (Sep 23, 2017)
2 GILKEY, Scotty, vs Eastern Illinois (Sep 30, 2017)
Long Rush 50 THOMAS,Roc, at Jacksonville State (Nov 16, 2017)
Pass attempts 32 COOK, Troy, at UT Martin (Sep 23, 2017)
Pass completions 20 COOK, Troy, at UT Martin (Sep 23, 2017)
Yards Passing 212 BOYLE, Tim, at Eastern Kentucky (Oct 07, 2017)
TD Passes 2 BOYLE, Tim, at Eastern Kentucky (Oct 07, 2017)
2 HOSKET, Jesse, vs SEMO (Nov 11, 2017)
Long Pass 45 HORN,Bryant, at Jacksonville State (Nov 16, 2017)
Receptions 8 PAUL, Dan, at Eastern Kentucky (Oct 07, 2017)
Yards Receiving 111 BYRD, Dontez, at Tennessee Tech (Oct 28, 2017)
TD Receptions 2 MARKUSH, Ryan, at Eastern Kentucky (Oct 07, 2017)
2 WILKERSON, K., vs SEMO (Nov 11, 2017)
Long Reception 45 CUMMINS,Austin, at Jacksonville State (Nov 16, 2017)
Field Goals 3 MADONIA, Nick, at Tennessee Tech (Oct 28, 2017)
Long Field Goal 42 SEVERINO, Matt, vs Eastern Illinois (Sep 30, 2017)
Punts 8 EDWARDS, Cody, vs Eastern Illinois (Sep 30, 2017)
Punting Avg 45.2 WRZUSZCZAK, K., at Eastern Kentucky (Oct 07, 2017)
Long Punt 54 ARKELIAN, Brett, at UT Martin (Sep 23, 2017)
Punts inside 20 3 EDWARDS, Cody, vs Eastern Illinois (Sep 30, 2017)
Long Punt Return 35 MOORE, Kyran, vs Austin Peay (Oct 14, 2017)
Long Kickoff Return 45 SANDERS, C., vs SEMO (Nov 11, 2017)
Tackles 13 MARTIN, Tae, at UT Martin (Sep 23, 2017)
Sacks 2.0 WILLIAMS, Jason, vs Austin Peay (Oct 14, 2017)
2.0 MOORE, Aderick, at Tennessee Tech (Oct 28, 2017)
2.0 HALL, Zach, vs SEMO (Nov 11, 2017)
Tackles For Loss 5.0 MOORE, Aderick, at Tennessee Tech (Oct 28, 2017)
Interceptions 2 DAVIS, Clay, at Tennessee Tech (Oct 28, 2017)
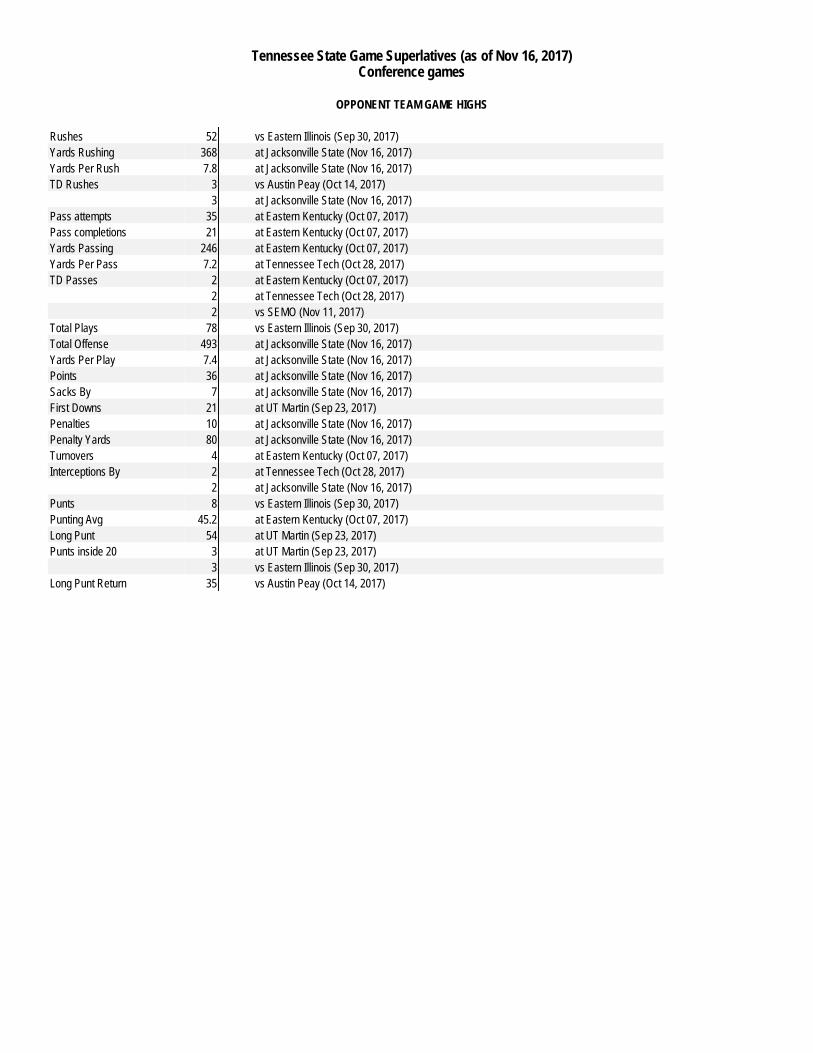
Tennessee State Game Superlatives (as of Nov 16, 2017)
Conference games
OPPONENT TEAM GAME HIGHS
Rushes 52 vs Eastern Illinois (Sep 30, 2017)
Yards Rushing 368 at Jacksonville State (Nov 16, 2017)
Yards Per Rush 7.8 at Jacksonville State (Nov 16, 2017)
TD Rushes 3 vs Austin Peay (Oct 14, 2017)
3 at Jacksonville State (Nov 16, 2017)
Pass attempts 35 at Eastern Kentucky (Oct 07, 2017)
Pass completions 21 at Eastern Kentucky (Oct 07, 2017)
Yards Passing 246 at Eastern Kentucky (Oct 07, 2017)
Yards Per Pass 7.2 at Tennessee Tech (Oct 28, 2017)
TD Passes 2 at Eastern Kentucky (Oct 07, 2017)
2 at Tennessee Tech (Oct 28, 2017)
2 vs SEMO (Nov 11, 2017)
Total Plays 78 vs Eastern Illinois (Sep 30, 2017)
Total Offense 493 at Jacksonville State (Nov 16, 2017)
Yards Per Play 7.4 at Jacksonville State (Nov 16, 2017)
Points 36 at Jacksonville State (Nov 16, 2017)
Sacks By 7 at Jacksonville State (Nov 16, 2017)
First Downs 21 at UT Martin (Sep 23, 2017)
Penalties 10 at Jacksonville State (Nov 16, 2017)
Penalty Yards 80 at Jacksonville State (Nov 16, 2017)
Turnovers 4 at Eastern Kentucky (Oct 07, 2017)
Interceptions By 2 at Tennessee Tech (Oct 28, 2017)
2 at Jacksonville State (Nov 16, 2017)
Punts 8 vs Eastern Illinois (Sep 30, 2017)
Punting Avg 45.2 at Eastern Kentucky (Oct 07, 2017)
Long Punt 54 at UT Martin (Sep 23, 2017)
Punts inside 20 3 at UT Martin (Sep 23, 2017)
3 vs Eastern Illinois (Sep 30, 2017)
Long Punt Return 35 vs Austin Peay (Oct 14, 2017)
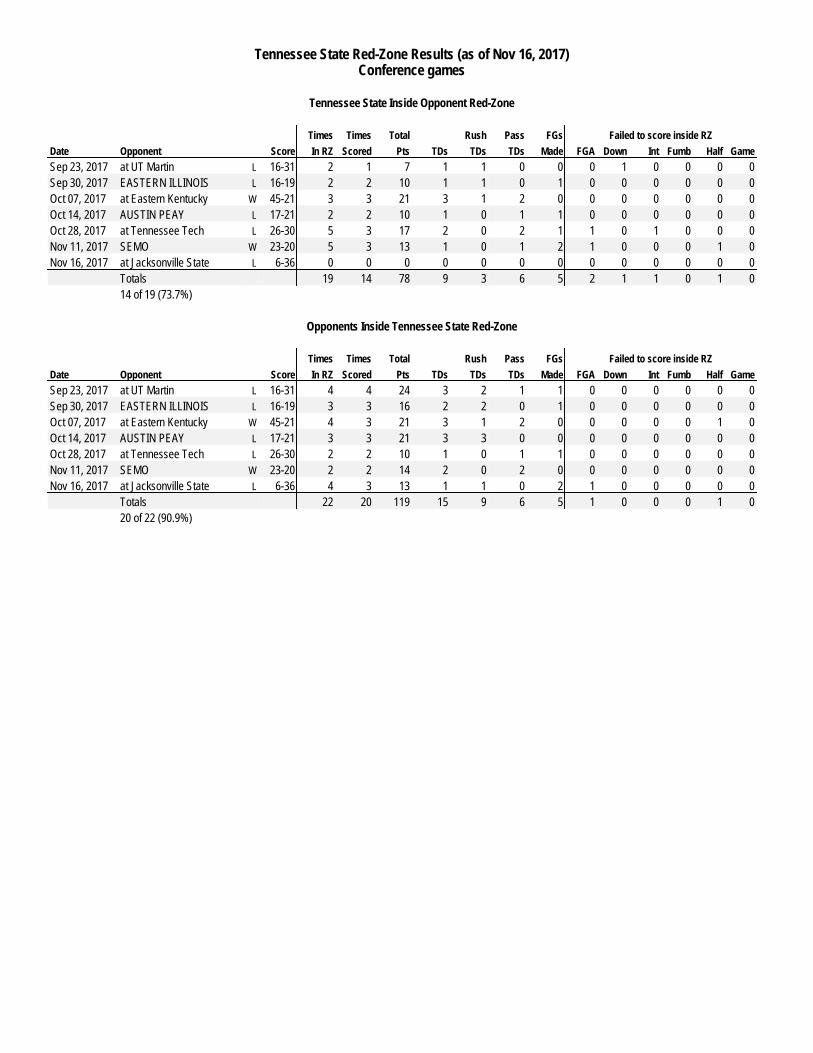
Tennessee State Red-Zone Results (as of Nov 16, 2017)
Conference games
Tennessee State Inside Opponent Red-Zone
Times Times Total Rush Pass FGs Failed to score inside RZ
Date Opponent Score In RZ Scored Pts TDs TDs TDs Made FGA Down Int Fumb Half Game
Sep 23, 2017 at UT Martin L 16-31 2 1 7 1 1 0 0 0 1 0 0 0 0
Sep 30, 2017 EASTERN ILLINOIS L 16-19 2 2 10 1 1 0 1 0 0 0 0 0 0
Oct 07, 2017 at Eastern Kentucky W 45-21 3 3 21 3 1 2 0 0 0 0 0 0 0
Oct 14, 2017 AUSTIN PEAY L 17-21 2 2 10 1 0 1 1 0 0 0 0 0 0
Oct 28, 2017 at Tennessee Tech L 26-30 5 3 17 2 0 2 1 1 0 1 0 0 0
Nov 11, 2017 SEMO W 23-20 5 3 13 1 0 1 2 1 0 0 0 1 0
Nov 16, 2017 at Jacksonville State L 6-36 0 0 0 0 0 0 0 0 0 0 0 0 0
Totals 19 14 78 9 3 6 5 2 1 1 0 1 0
14 of 19 (73.7%)
Opponents Inside Tennessee State Red-Zone
Times Times Total Rush Pass FGs Failed to score inside RZ
Date Opponent Score In RZ Scored Pts TDs TDs TDs Made FGA Down Int Fumb Half Game
Sep 23, 2017 at UT Martin L 16-31 4 4 24 3 2 1 1 0 0 0 0 0 0
Sep 30, 2017 EASTERN ILLINOIS L 16-19 3 3 16 2 2 0 1 0 0 0 0 0 0
Oct 07, 2017 at Eastern Kentucky W 45-21 4 3 21 3 1 2 0 0 0 0 0 1 0
Oct 14, 2017 AUSTIN PEAY L 17-21 3 3 21 3 3 0 0 0 0 0 0 0 0
Oct 28, 2017 at Tennessee Tech L 26-30 2 2 10 1 0 1 1 0 0 0 0 0 0
Nov 11, 2017 SEMO W 23-20 2 2 14 2 0 2 0 0 0 0 0 0 0
Nov 16, 2017 at Jacksonville State L 6-36 4 3 13 1 1 0 2 1 0 0 0 0 0
Totals 22 20 119 15 9 6 5 1 0 0 0 1 0
20 of 22 (90.9%)
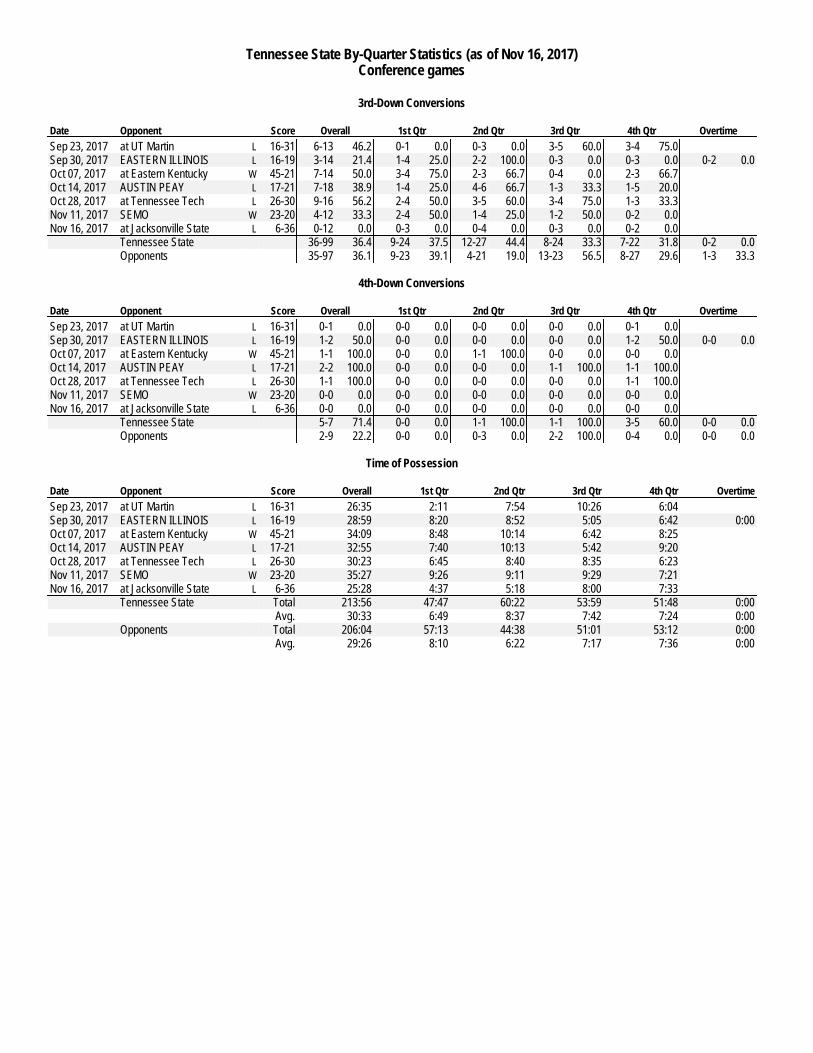
Tennessee State By-Quarter Statistics (as of Nov 16, 2017)
Conference games
3rd-Down Conversions
Date Opponent Score Overall 1st Qtr 2nd Qtr 3rd Qtr 4th Qtr Overtime
Sep 23, 2017 at UT Martin L 16-31 6-13 46.2 0-1 0.0 0-3 0.0 3-5 60.0 3-4 75.0
Sep 30, 2017 EASTERN ILLINOIS L 16-19 3-14 21.4 1-4 25.0 2-2 100.0 0-3 0.0 0-3 0.0 0-2 0.0
Oct 07, 2017 at Eastern Kentucky W 45-21 7-14 50.0 3-4 75.0 2-3 66.7 0-4 0.0 2-3 66.7
Oct 14, 2017 AUSTIN PEAY L 17-21 7-18 38.9 1-4 25.0 4-6 66.7 1-3 33.3 1-5 20.0
Oct 28, 2017 at Tennessee Tech L 26-30 9-16 56.2 2-4 50.0 3-5 60.0 3-4 75.0 1-3 33.3
Nov 11, 2017 SEMO W 23-20 4-12 33.3 2-4 50.0 1-4 25.0 1-2 50.0 0-2 0.0
Nov 16, 2017 at Jacksonville State L 6-36 0-12 0.0 0-3 0.0 0-4 0.0 0-3 0.0 0-2 0.0
Tennessee State 36-99 36.4 9-24 37.5 12-27 44.4 8-24 33.3 7-22 31.8 0-2 0.0
Opponents 35-97 36.1 9-23 39.1 4-21 19.0 13-23 56.5 8-27 29.6 1-3 33.3
4th-Down Conversions
Date Opponent Score Overall 1st Qtr 2nd Qtr 3rd Qtr 4th Qtr Overtime
Sep 23, 2017 at UT Martin L 16-31 0-1 0.0 0-0 0.0 0-0 0.0 0-0 0.0 0-1 0.0
Sep 30, 2017 EASTERN ILLINOIS L 16-19 1-2 50.0 0-0 0.0 0-0 0.0 0-0 0.0 1-2 50.0 0-0 0.0
Oct 07, 2017 at Eastern Kentucky W 45-21 1-1 100.0 0-0 0.0 1-1 100.0 0-0 0.0 0-0 0.0
Oct 14, 2017 AUSTIN PEAY L 17-21 2-2 100.0 0-0 0.0 0-0 0.0 1-1 100.0 1-1 100.0
Oct 28, 2017 at Tennessee Tech L 26-30 1-1 100.0 0-0 0.0 0-0 0.0 0-0 0.0 1-1 100.0
Nov 11, 2017 SEMO W 23-20 0-0 0.0 0-0 0.0 0-0 0.0 0-0 0.0 0-0 0.0
Nov 16, 2017 at Jacksonville State L 6-36 0-0 0.0 0-0 0.0 0-0 0.0 0-0 0.0 0-0 0.0
Tennessee State 5-7 71.4 0-0 0.0 1-1 100.0 1-1 100.0 3-5 60.0 0-0 0.0
Opponents 2-9 22.2 0-0 0.0 0-3 0.0 2-2 100.0 0-4 0.0 0-0 0.0
Time of Possession
Date Opponent Score Overall 1st Qtr 2nd Qtr 3rd Qtr 4th Qtr Overtime
Sep 23, 2017 at UT Martin L 16-31 26:35 2:11 7:54 10:26 6:04
Sep 30, 2017 EASTERN ILLINOIS L 16-19 28:59 8:20 8:52 5:05 6:42 0:00
Oct 07, 2017 at Eastern Kentucky W 45-21 34:09 8:48 10:14 6:42 8:25
Oct 14, 2017 AUSTIN PEAY L 17-21 32:55 7:40 10:13 5:42 9:20
Oct 28, 2017 at Tennessee Tech L 26-30 30:23 6:45 8:40 8:35 6:23
Nov 11, 2017 SEMO W 23-20 35:27 9:26 9:11 9:29 7:21
Nov 16, 2017 at Jacksonville State L 6-36 25:28 4:37 5:18 8:00 7:33
Tennessee State Total 213:56 47:47 60:22 53:59 51:48 0:00
Avg. 30:33 6:49 8:37 7:42 7:24 0:00
Opponents Total 206:04 57:13 44:38 51:01 53:12 0:00
Avg. 29:26 8:10 6:22 7:17 7:36 0:00