Embed Size (px)
Citation preview
VUL Combined Team Statistics (as of Oct 29, 2017)
All games
Date Opponent Score Att.
Aug 27, 2017 LOUISBURG L 10-41 0
Sep 02, 2017 at Florida Tech L 0-44 1230
9/9/2017 at UW-Oshkosh L 7-74 1505
Sep 16, 2017 at Newberry L 7-55 3371
Oct 7, 2017 at Brevard L 14-21 0
Oct 21, 2017 at Mississippi Valley L 5-53 9875
Oct 28, 2017 UVA-WISE L 0-65 1250
Rushing gp att gain loss net avg td lg avg/g
Mohamed Khellah 7 41 138 18 120 2.9 0 16 17.1
Maurice Richard 7 30 111 13 98 3.3 0 49 14.0
Kevin McBride 5 29 119 31 88 3.0 0 16 17.6
Thomas Jones 7 59 185 125 60 1.0 1 28 8.6
Tomas Newman 7 8 27 8 19 2.4 0 9 2.7
Carleton Stewar 6 14 20 6 14 1.0 0 5 2.3
Bryan Reed 6 2 13 0 13 6.5 0 8 2.2
Justin Fritts 5 1 7 0 7 7.0 0 7 1.4
Bernard West 3 1 7 0 7 7.0 0 7 2.3
Jercoby Groover 3 3 6 0 6 2.0 0 6 2.0
Zack Robinson 2 3 10 6 4 1.3 0 10 2.0
Te'Shard Winsto 1 4 8 4 4 1.0 0 7 4.0
Kalvin Roan 2 1 1 0 1 1.0 0 1 0.5
Total 7 220 659 259 400 1.8 1 49 57.1
Opponents 7 251 1254 202 1052 4.2 17 55 150.3
Passing gp effic comp-att-int pct yds td lg avg/g
Thomas Jones 7 72.83 51-123-4 41.5 476 2 67 68.0
DeAnthony Walke 6 54.13 14-38-1 36.8 102 0 21 17.0
Kevin McBride 5 72.42 12-21-1 57.1 62 0 10 12.4
Jamelle Clegg 3 75.12 3-5-0 60.0 9 0 6 3.0
TEAM 5 0.00 0-1-0 0.0 0 0 0 0.0
Total 7 68.68 80-188-6 42.6 649 2 67 92.7
Opponents 7 191.83 156-210-2 74.3 2004 25 60 286.3
Receiving gp no. yds avg td lg avg/g
Kevin McBride 5 15 98 6.5 1 25 19.6
Corye Smith 6 14 159 11.4 0 67 26.5
Javon Green 7 7 97 13.9 1 51 13.9
Justin Fritts 5 7 65 9.3 0 28 13.0
Bernard West 3 7 30 4.3 0 9 10.0
Kris Royal 5 6 47 7.8 0 14 9.4
Zack Robinson 2 6 15 2.5 0 9 7.5
Decarlos Frazie 5 5 61 12.2 0 21 12.2
Antwain Stone 4 4 38 9.5 0 16 9.5
Mohamed Khellah 7 3 14 4.7 0 9 2.0
Danny Baker 7 2 25 12.5 0 15 3.6
Savohn Henderso 6 1 0 0.0 0 0 0.0
Bryan Reed 6 1 0 0.0 0 0 0.0
Stephon Lamb 3 1 0 0.0 0 0 0.0
Jercoby Groover 3 1 0 0.0 0 0 0.0
Total 7 80 649 8.1 2 67 92.7
Opponents 7 156 2004 12.8 25 60 286.3
Field Goals fg pct. 01-19 20-29 30-39 40-49 50-99 lg blk
Christopher Vas 2-7 28.6 0-0 1-3 1-3 0-1 0-0 37 1
PAT
Scoring td fg kick rush rcv pass dxp saf pts
Tomas Newman 2 - - - - - - - 12
Christopher Vas - 2-7 3-4 - - - - - 9
Thomas Jones 1 - - - - - - - 6
Javon Green 1 - - - - - - - 6
Kevin McBride 1 - - - - - - - 6
TEAM - - - - - - - 1 2
Total 5 2-7 3-4 - - - - 1 43
Opponents 49 4-6 43-47 0-1 - 0-1 - 2 353
Score by Quarters 1st 2nd 3rd 4th OT Total
VUL 3 9 15 16 0 43
Opponents 69 102 98 84 0 353
Record: Overall Home Away Neutral
All games 0-7 0-2 0-5 0-0
Conference 0-0 0-0 0-0 0-0
Non-Conference 0-7 0-2 0-5 0-0
Team Statistics VUL OPP
FIRST DOWNS 73 168
R u s h i n g 31 66
P a s s i n g 24 84
P e n a l t y 18 18
RUSHING YARDAGE 400 1052
Rushing Attempts 220 251
Average Per Rush 1.8 4.2
Average Per Game 57.1 150.3
TDs Rushing 1 17
PASSING YARDAGE 649 2004
C o m p - A t t - I n t 80-188-6 156-210-2
Average Per Pass 3.5 9.5
Average Per Catch 8.1 12.8
Average Per Game 92.7 286.3
TDs Passing 2 25
TOTAL OFFENSE 1049 3056
Average Per Play 2.6 6.6
Average Per Game 149.9 436.6
KICK RETURNS: #-Yards 47-928 15-444
PUNT RETURNS: #-Yards 3-24 25-369
INT RETURNS: #-Yards 2-36 6-35
FUMBLES-LOST 19-9 16-9
PENALTIES-Yards 79-780 65-595
PUNTS-AVG 57-35.2 17-36.2
TIME OF POSSESSION/Game 3 1 : 0 6 2 8 : 5 4
3RD-DOWN Conversions 14/97 37/74
4TH-DOWN Conversions 6/15 1/8
Interceptions no. yds avg td lg
DaQuan Richards 1 27 27.0 0 27
Deandrey Johnso 1 9 9.0 0 9
Punting no. yds avg lg tb fc i20 50+ blk
Christopher Vas 54 1965 36.4 60 1 11 12 4 1
TEAM 2 0 0.0 0 0 0 0 0 1
Maurice Richard 1 44 44.0 44 0 0 0 0 0
Punt Returns no. yds avg td lg
Corye Smith 2 25 12.5 0 17
TEAM 1 -1 -1.0 0 0
Total 3 24 8.0 0 17
Opponents 25 369 14.8 4 70
Kick Returns no. yds avg td lg
Tomas Newman 19 542 28.5 2 98
Jercoby Groover 7 122 17.4 0 47
Bernard West 4 76 19.0 0 25
Carleton Stewar 3 18 6.0 0 12
Corye Smith 3 17 5.7 0 8
Te'Shard Winsto 3 51 17.0 0 22
Keith Franklin 2 28 14.0 0 19
Bryan Reed 1 11 11.0 0 11
Mohamed Khellah 1 0 0.0 0 0
Jose Lemus 1 18 18.0 0 18
Maurice Richard 1 18 18.0 0 18
Javon Green 1 17 17.0 0 17
Danny Baker 1 10 10.0 0 10
Total 47 928 19.7 2 98
Opponents 15 444 29.6 1 78
All Purpose g rush rcv pr kr ir total avg/g
Tomas Newman 7 19 0 0 542 0 561 80.1
Corye Smith 6 -4 159 25 17 0 197 32.8
Kevin McBride 5 88 98 0 0 0 186 37.2
Mohamed Khella 7 120 14 0 0 0 134 19.1
Jercoby Groover 3 6 0 0 122 0 128 42.7
Total 7 400 649 24 928 36 2037 291.0
Opponents 7 1052 2004 369 444 35 3904 557.7
Total Offense g plays rush pass total avg/g
Thomas Jones 7 182 60 476 536 76.6
Kevin McBride 5 50 88 62 150 30.0
Mohamed Khellah 7 41 120 0 120 17.1
Maurice Richard 7 30 98 0 98 14.0
DeAnthony Walke 6 55 -10 102 92 15.3
Total 7 408 400 649 1049 149.9
Opponents 7 461 1052 2004 3056 436.6
Tackles Sacks Pass defense Fumbles blkd
## Defensive Leaders gp ua a tot tfl/yds no-yds int-yds brup qbh rcv-yds ff kick saf
8 Willie Holloway 7 21 12 33 9.5-96 2.0-73 . . . . . 1 .
9 Dah-Quan Edring 7 22 9 31 6.5-22 1.0-6 . . . . . . .
32 John Templar 5 21 8 29 3.0-11 . . 1 . 1-0 . . .
43 Jose Lemus 7 17 12 29 2.0-7 . . . . 1-0 . . .
22 Malik Harris 7 20 2 22 2.0-4 . . . . . . . .
Total 7 322 113 435 48-281 7-112 2-36 8 2 9-0 7 2 1
Opponents 7 261 117 378 74-298 23-147 6-35 23 3 9-93 7 4 2
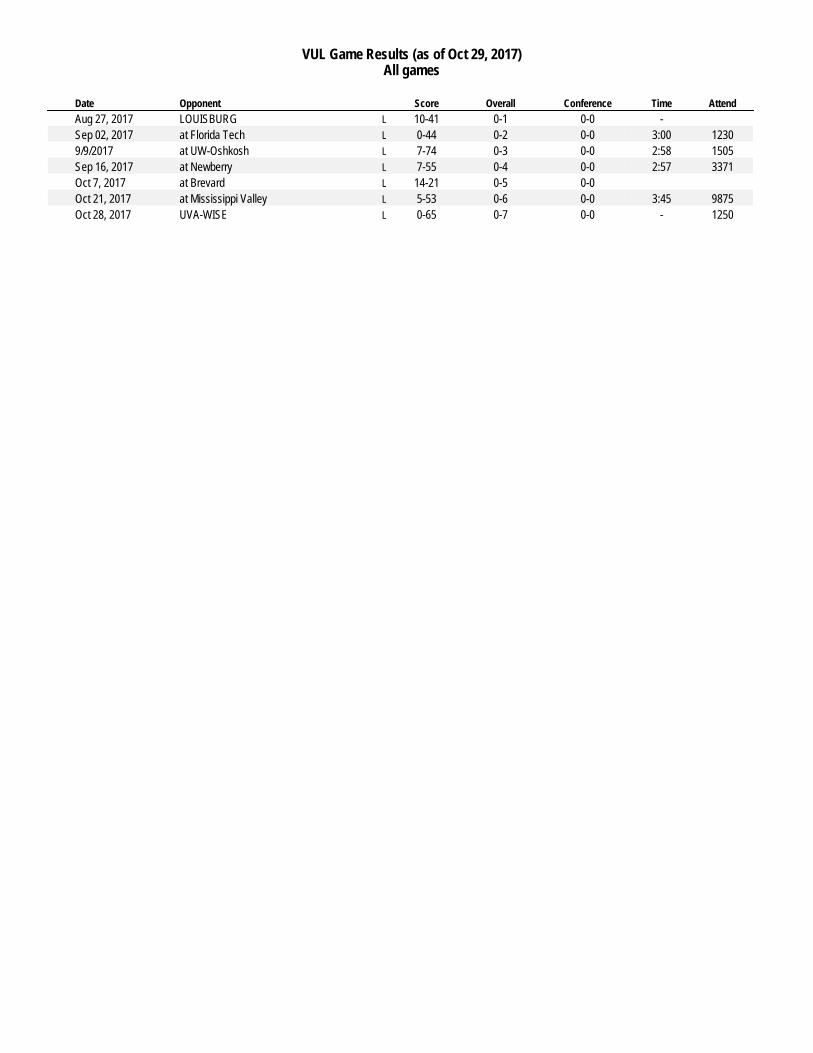
VUL Game Results (as of Oct 29, 2017)
All games
Date Opponent Score Overall Conference Time Attend
Aug 27, 2017 LOUISBURG L 10-41 0-1 0-0 -
Sep 02, 2017 at Florida Tech L 0-44 0-2 0-0 3:00 1230
9/9/2017 at UW-Oshkosh L 7-74 0-3 0-0 2:58 1505
Sep 16, 2017 at Newberry L 7-55 0-4 0-0 2:57 3371
Oct 7, 2017 at Brevard L 14-21 0-5 0-0
Oct 21, 2017 at Mississippi Valley L 5-53 0-6 0-0 3:45 9875
Oct 28, 2017 UVA-WISE L 0-65 0-7 0-0 - 1250
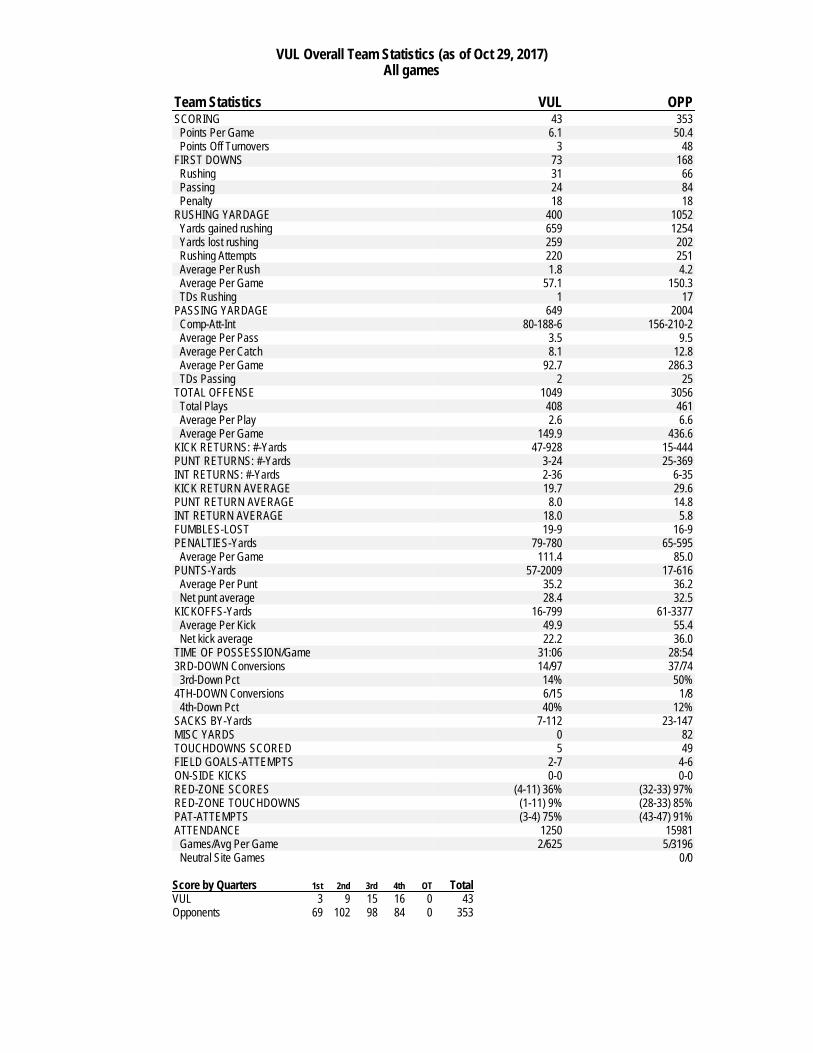
VUL Overall Team Statistics (as of Oct 29, 2017)
All games
Team Statistics VUL OPP
SCORING 43 353
Points Per Game 6.1 50.4
Points Off Turnovers 3 48
FIRST DOWNS 73 168
R u s h i n g 31 66
P a s s i n g 24 84
P e n a l t y 18 18
RUSHING YARDAGE 400 1052
Yards gained rushing 659 1254
Yards lost rushing 259 202
Rushing Attempts 220 251
Average Per Rush 1.8 4.2
Average Per Game 57.1 150.3
TDs Rushing 1 17
PASSING YARDAGE 649 2004
C o m p - A t t - I n t 80-188-6 156-210-2
Average Per Pass 3.5 9.5
Average Per Catch 8.1 12.8
Average Per Game 92.7 286.3
TDs Passing 2 25
TOTAL OFFENSE 1049 3056
Total Plays 408 461
Average Per Play 2.6 6.6
Average Per Game 149.9 436.6
KICK RETURNS: #-Yards 47-928 15-444
PUNT RETURNS: #-Yards 3-24 25-369
INT RETURNS: #-Yards 2-36 6-35
KICK RETURN AVERAGE 19.7 29.6
PUNT RETURN AVERAGE 8.0 14.8
INT RETURN AVERAGE 18.0 5.8
FUMBLES-LOST 19-9 16-9
PENALTIES-Yards 79-780 65-595
Average Per Game 111.4 85.0
PUNTS-Yards 57-2009 17-616
Average Per Punt 35.2 36.2
Net punt average 28.4 32.5
KICKOFFS-Yards 16-799 61-3377
Average Per Kick 49.9 55.4
Net kick average 22.2 36.0
TIME OF POSSESSION/Game 3 1 : 0 6 2 8 : 5 4
3RD-DOWN Conversions 14/97 37/74
3rd-Down Pct 14% 50%
4TH-DOWN Conversions 6/15 1/8
4th-Down Pct 40% 12%
SACKS BY-Yards 7-112 23-147
MISC YARDS 0 82
TOUCHDOWNS SCORED 5 49
FIELD GOALS-ATTEMPTS 2-7 4-6
ON-SIDE KICKS 0-0 0-0
RED-ZONE SCORES (4-11) 36% (32-33) 97%
RED-ZONE TOUCHDOWNS (1-11) 9% (28-33) 85%
PAT-ATTEMPTS (3-4) 75% (43-47) 91%
ATTENDANCE 1250 15981
Games/Avg Per Game 2/625 5/3196
Neutral Site Games 0/0
Score by Quarters 1st 2nd 3rd 4th OT Total
VUL 3 9 15 16 0 43
Opponents 69 102 98 84 0 353
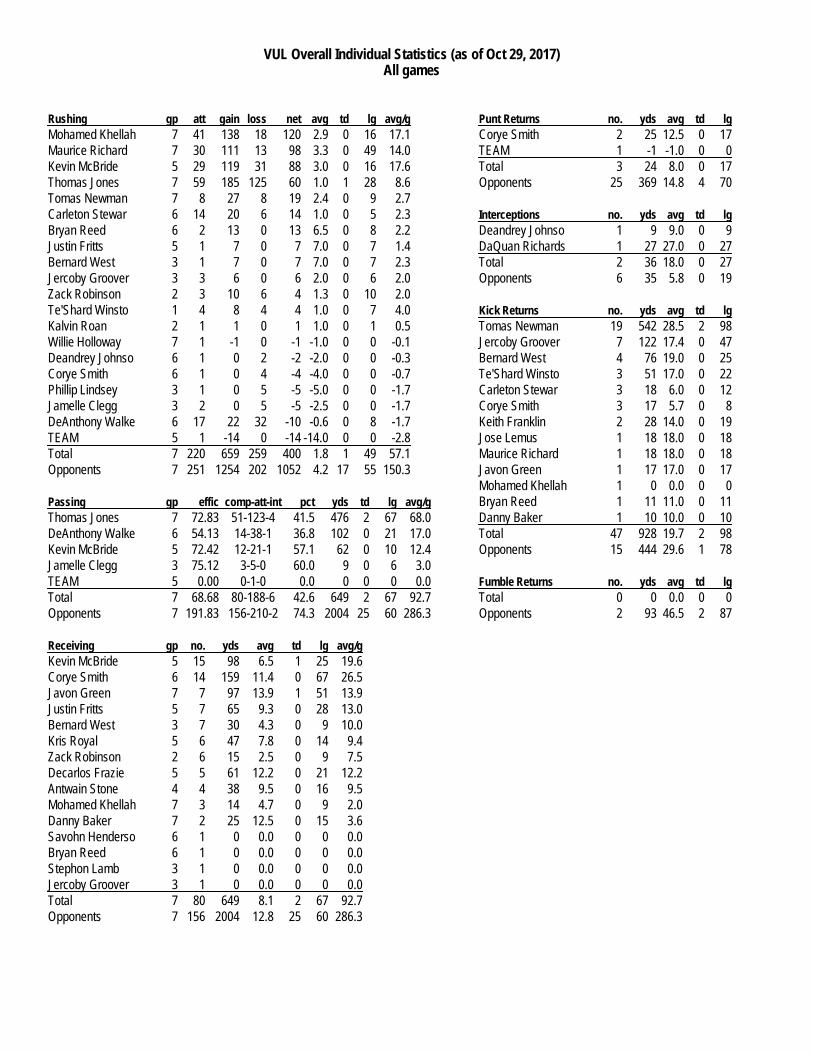
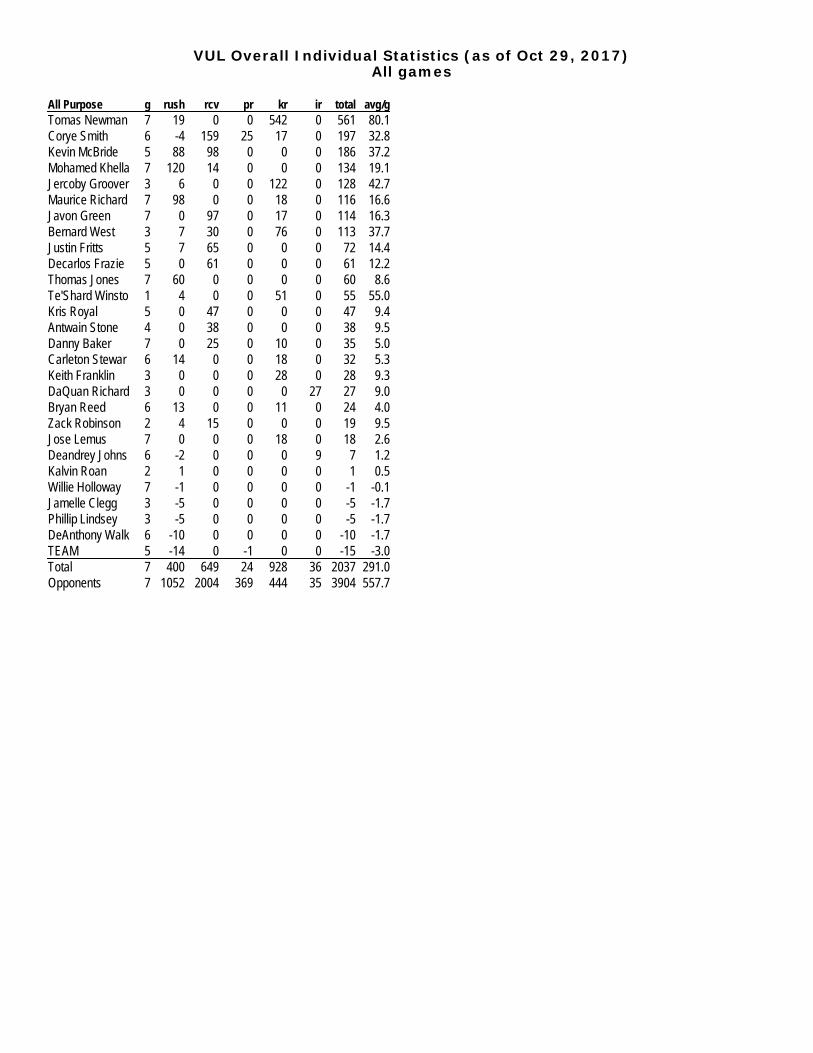
VUL Overall Individual Statistics (as of Oct 29, 2017)
All games
Rushing gp att gain loss net avg td lg avg/g
Mohamed Khellah 7 41 138 18 120 2.9 0 16 17.1
Maurice Richard 7 30 111 13 98 3.3 0 49 14.0
Kevin McBride 5 29 119 31 88 3.0 0 16 17.6
Thomas Jones 7 59 185 125 60 1.0 1 28 8.6
Tomas Newman 7 8 27 8 19 2.4 0 9 2.7
Carleton Stewar 6 14 20 6 14 1.0 0 5 2.3
Bryan Reed 6 2 13 0 13 6.5 0 8 2.2
Justin Fritts 5 1 7 0 7 7.0 0 7 1.4
Bernard West 3 1 7 0 7 7.0 0 7 2.3
Jercoby Groover 3 3 6 0 6 2.0 0 6 2.0
Zack Robinson 2 3 10 6 4 1.3 0 10 2.0
Te'Shard Winsto 1 4 8 4 4 1.0 0 7 4.0
Kalvin Roan 2 1 1 0 1 1.0 0 1 0.5
Willie Holloway 7 1 -1 0 -1 -1.0 0 0 -0.1
Deandrey Johnso 6 1 0 2 -2 -2.0 0 0 -0.3
Corye Smith 6 1 0 4 -4 -4.0 0 0 -0.7
Phillip Lindsey 3 1 0 5 -5 -5.0 0 0 -1.7
Jamelle Clegg 3 2 0 5 -5 -2.5 0 0 -1.7
DeAnthony Walke 6 17 22 32 -10 -0.6 0 8 -1.7
TEAM 5 1 -14 0 -14 -14.0 0 0 -2.8
Total 7 220 659 259 400 1.8 1 49 57.1
Opponents 7 251 1254 202 1052 4.2 17 55 150.3
Passing gp effic comp-att-int pct yds td lg avg/g
Thomas Jones 7 72.83 51-123-4 41.5 476 2 67 68.0
DeAnthony Walke 6 54.13 14-38-1 36.8 102 0 21 17.0
Kevin McBride 5 72.42 12-21-1 57.1 62 0 10 12.4
Jamelle Clegg 3 75.12 3-5-0 60.0 9 0 6 3.0
TEAM 5 0.00 0-1-0 0.0 0 0 0 0.0
Total 7 68.68 80-188-6 42.6 649 2 67 92.7
Opponents 7 191.83 156-210-2 74.3 2004 25 60 286.3
Receiving gp no. yds avg td lg avg/g
Kevin McBride 5 15 98 6.5 1 25 19.6
Corye Smith 6 14 159 11.4 0 67 26.5
Javon Green 7 7 97 13.9 1 51 13.9
Justin Fritts 5 7 65 9.3 0 28 13.0
Bernard West 3 7 30 4.3 0 9 10.0
Kris Royal 5 6 47 7.8 0 14 9.4
Zack Robinson 2 6 15 2.5 0 9 7.5
Decarlos Frazie 5 5 61 12.2 0 21 12.2
Antwain Stone 4 4 38 9.5 0 16 9.5
Mohamed Khellah 7 3 14 4.7 0 9 2.0
Danny Baker 7 2 25 12.5 0 15 3.6
Savohn Henderso 6 1 0 0.0 0 0 0.0
Bryan Reed 6 1 0 0.0 0 0 0.0
Stephon Lamb 3 1 0 0.0 0 0 0.0
Jercoby Groover 3 1 0 0.0 0 0 0.0
Total 7 80 649 8.1 2 67 92.7
Opponents 7 156 2004 12.8 25 60 286.3
Punt Returns no. yds avg td lg
Corye Smith 2 25 12.5 0 17
TEAM 1 -1 -1.0 0 0
Total 3 24 8.0 0 17
Opponents 25 369 14.8 4 70
Interceptions no. yds avg td lg
Deandrey Johnso 1 9 9.0 0 9
DaQuan Richards 1 27 27.0 0 27
Total 2 36 18.0 0 27
Opponents 6 35 5.8 0 19
Kick Returns no. yds avg td lg
Tomas Newman 19 542 28.5 2 98
Jercoby Groover 7 122 17.4 0 47
Bernard West 4 76 19.0 0 25
Te'Shard Winsto 3 51 17.0 0 22
Carleton Stewar 3 18 6.0 0 12
Corye Smith 3 17 5.7 0 8
Keith Franklin 2 28 14.0 0 19
Jose Lemus 1 18 18.0 0 18
Maurice Richard 1 18 18.0 0 18
Javon Green 1 17 17.0 0 17
Mohamed Khellah 1 0 0.0 0 0
Bryan Reed 1 11 11.0 0 11
Danny Baker 1 10 10.0 0 10
Total 47 928 19.7 2 98
Opponents 15 444 29.6 1 78
Fumble Returns no. yds avg td lg
Total 0 0 0.0 0 0
Opponents 2 93 46.5 2 87
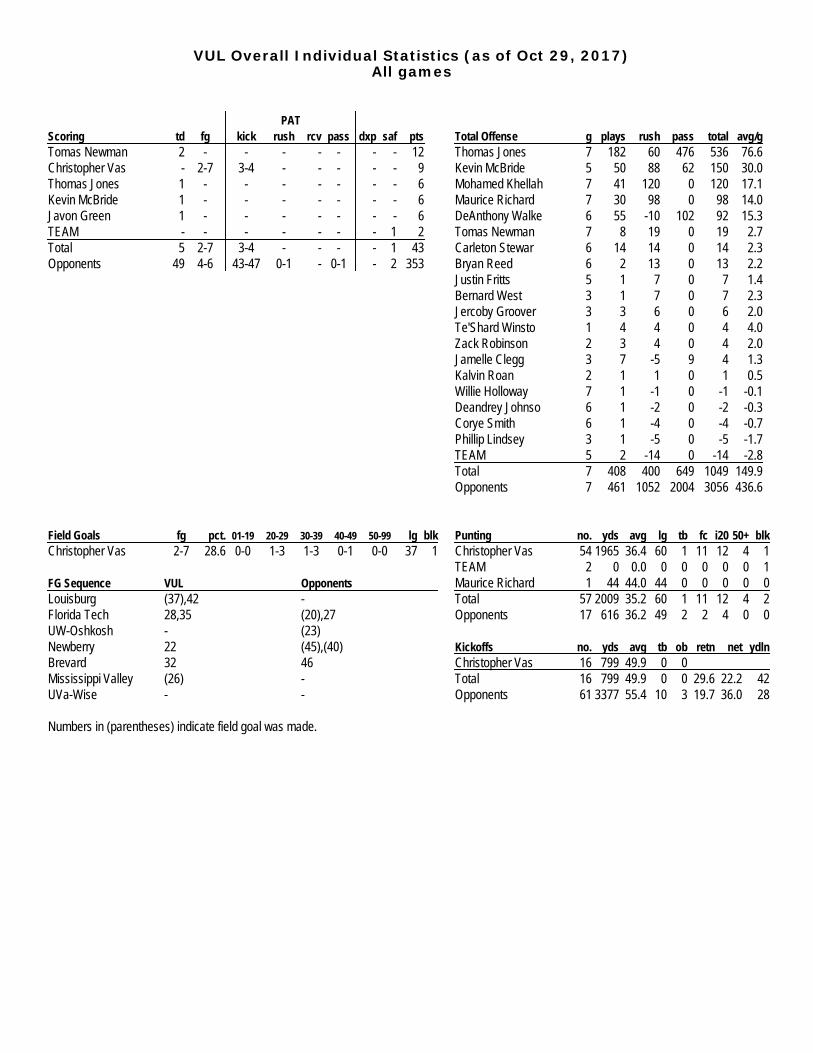
VUL Overall Individual Statistics (as of Oct 29, 2017)
All games
PAT
Scoring td fg kick rush rcv pass dxp saf pts
Tomas Newman 2 - - - - - - - 12
Christopher Vas - 2-7 3-4 - - - - - 9
Thomas Jones 1 - - - - - - - 6
Kevin McBride 1 - - - - - - - 6
Javon Green 1 - - - - - - - 6
TEAM - - - - - - - 1 2
Total 5 2-7 3-4 - - - - 1 43
Opponents 49 4-6 43-47 0-1 - 0-1 - 2 353
Total Offense g plays rush pass total avg/g
Thomas Jones 7 182 60 476 536 76.6
Kevin McBride 5 50 88 62 150 30.0
Mohamed Khellah 7 41 120 0 120 17.1
Maurice Richard 7 30 98 0 98 14.0
DeAnthony Walke 6 55 -10 102 92 15.3
Tomas Newman 7 8 19 0 19 2.7
Carleton Stewar 6 14 14 0 14 2.3
Bryan Reed 6 2 13 0 13 2.2
Justin Fritts 5 1 7 0 7 1.4
Bernard West 3 1 7 0 7 2.3
Jercoby Groover 3 3 6 0 6 2.0
Te'Shard Winsto 1 4 4 0 4 4.0
Zack Robinson 2 3 4 0 4 2.0
Jamelle Clegg 3 7 -5 9 4 1.3
Kalvin Roan 2 1 1 0 1 0.5
Willie Holloway 7 1 -1 0 -1 -0.1
Deandrey Johnso 6 1 -2 0 -2 -0.3
Corye Smith 6 1 -4 0 -4 -0.7
Phillip Lindsey 3 1 -5 0 -5 -1.7
TEAM 5 2 -14 0 -14 -2.8
Total 7 408 400 649 1049 149.9
Opponents 7 461 1052 2004 3056 436.6
Field Goals fg pct. 01-19 20-29 30-39 40-49 50-99 lg blk
Christopher Vas 2-7 28.6 0-0 1-3 1-3 0-1 0-0 37 1
FG Sequence VUL Opponents
Louisburg (37),42 -
Florida Tech 28,35 (20),27
UW-Oshkosh - (23)
Newberry 22 (45),(40)
Brevard 32 46
Mississippi Valley (26) -
UVa-Wise - -
Numbers in (parentheses) indicate field goal was made.
Punting no. yds avg lg tb fc i20 50+ blk
Christopher Vas 54 1965 36.4 60 1 11 12 4 1
TEAM 2 0 0.0 0 0 0 0 0 1
Maurice Richard 1 44 44.0 44 0 0 0 0 0
Total 57 2009 35.2 60 1 11 12 4 2
Opponents 17 616 36.2 49 2 2 4 0 0
Kickoffs no. yds avg tb ob retn net ydln
Christopher Vas 16 799 49.9 0 0
Total 16 799 49.9 0 0 29.6 22.2 42
Opponents 61 3377 55.4 10 3 19.7 36.0 28
VUL Overall Individual Statistics (as of Oct 29, 2017)
All games
All Purpose g rush rcv pr kr ir total avg/g
Tomas Newman 7 19 0 0 542 0 561 80.1
Corye Smith 6 -4 159 25 17 0 197 32.8
Kevin McBride 5 88 98 0 0 0 186 37.2
Mohamed Khella 7 120 14 0 0 0 134 19.1
Jercoby Groover 3 6 0 0 122 0 128 42.7
Maurice Richard 7 98 0 0 18 0 116 16.6
Javon Green 7 0 97 0 17 0 114 16.3
Bernard West 3 7 30 0 76 0 113 37.7
Justin Fritts 5 7 65 0 0 0 72 14.4
Decarlos Frazie 5 0 61 0 0 0 61 12.2
Thomas Jones 7 60 0 0 0 0 60 8.6
Te'Shard Winsto 1 4 0 0 51 0 55 55.0
Kris Royal 5 0 47 0 0 0 47 9.4
Antwain Stone 4 0 38 0 0 0 38 9.5
Danny Baker 7 0 25 0 10 0 35 5.0
Carleton Stewar 6 14 0 0 18 0 32 5.3
Keith Franklin 3 0 0 0 28 0 28 9.3
DaQuan Richard 3 0 0 0 0 27 27 9.0
Bryan Reed 6 13 0 0 11 0 24 4.0
Zack Robinson 2 4 15 0 0 0 19 9.5
Jose Lemus 7 0 0 0 18 0 18 2.6
Deandrey Johns 6 -2 0 0 0 9 7 1.2
Kalvin Roan 2 1 0 0 0 0 1 0.5
Willie Holloway 7 -1 0 0 0 0 -1 -0.1
Jamelle Clegg 3 -5 0 0 0 0 -5 -1.7
Phillip Lindsey 3 -5 0 0 0 0 -5 -1.7
DeAnthony Walk 6 -10 0 0 0 0 -10 -1.7
TEAM 5 -14 0 -1 0 0 -15 -3.0
Total 7 400 649 24 928 36 2037 291.0
Opponents 7 1052 2004 369 444 35 3904 557.7
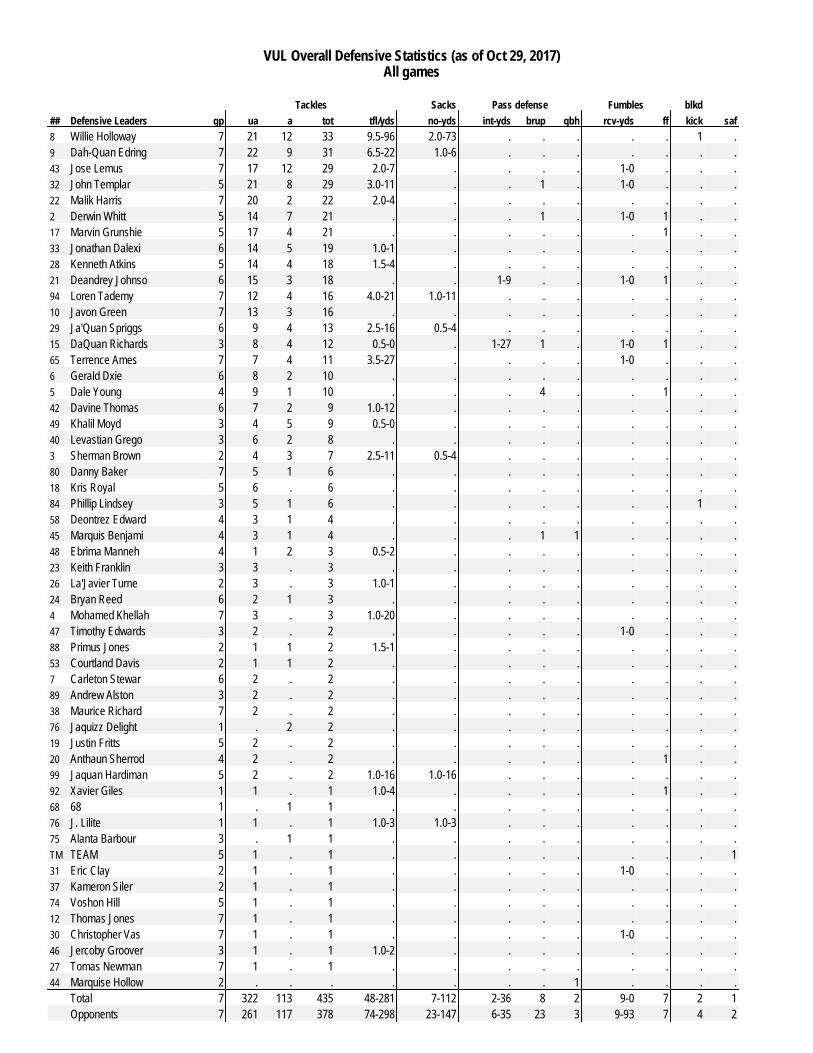
VUL Overall Defensive Statistics (as of Oct 29, 2017)
All games
Tackles Sacks Pass defense Fumbles blkd
## Defensive Leaders gp ua a tot tfl/yds no-yds int-yds brup qbh rcv-yds ff kick saf
8 Willie Holloway 7 21 12 33 9.5-96 2.0-73 . . . . . 1 .
9 Dah-Quan Edring 7 22 9 31 6.5-22 1.0-6 . . . . . . .
43 Jose Lemus 7 17 12 29 2.0-7 . . . . 1-0 . . .
32 John Templar 5 21 8 29 3.0-11 . . 1 . 1-0 . . .
22 Malik Harris 7 20 2 22 2.0-4 . . . . . . . .
2 Derwin Whitt 5 14 7 21 . . . 1 . 1-0 1 . .
17 Marvin Grunshie 5 17 4 21 . . . . . . 1 . .
33 Jonathan Dalexi 6 14 5 19 1.0-1 . . . . . . . .
28 Kenneth Atkins 5 14 4 18 1.5-4 . . . . . . . .
21 Deandrey Johnso 6 15 3 18 . . 1-9 . . 1-0 1 . .
94 Loren Tademy 7 12 4 16 4.0-21 1.0-11 . . . . . . .
10 Javon Green 7 13 3 16 . . . . . . . . .
29 Ja'Quan Spriggs 6 9 4 13 2.5-16 0.5-4 . . . . . . .
15 DaQuan Richards 3 8 4 12 0.5-0 . 1-27 1 . 1-0 1 . .
65 Terrence Ames 7 7 4 11 3.5-27 . . . . 1-0 . . .
6 Gerald Dxie 6 8 2 10 . . . . . . . . .
5 Dale Young 4 9 1 10 . . . 4 . . 1 . .
42 Davine Thomas 6 7 2 9 1.0-12 . . . . . . . .
49 Khalil Moyd 3 4 5 9 0.5-0 . . . . . . . .
40 Levastian Grego 3 6 2 8 . . . . . . . . .
3 Sherman Brown 2 4 3 7 2.5-11 0.5-4 . . . . . . .
80 Danny Baker 7 5 1 6 . . . . . . . . .
18 Kris Royal 5 6 . 6 . . . . . . . . .
84 Phillip Lindsey 3 5 1 6 . . . . . . . 1 .
58 Deontrez Edward 4 3 1 4 . . . . . . . . .
45 Marquis Benjami 4 3 1 4 . . . 1 1 . . . .
48 Ebrima Manneh 4 1 2 3 0.5-2 . . . . . . . .
23 Keith Franklin 3 3 . 3 . . . . . . . . .
26 La'Javier Turne 2 3 . 3 1.0-1 . . . . . . . .
24 Bryan Reed 6 2 1 3 . . . . . . . . .
4 Mohamed Khellah 7 3 . 3 1.0-20 . . . . . . . .
47 Timothy Edwards 3 2 . 2 . . . . . 1-0 . . .
88 Primus Jones 2 1 1 2 1.5-1 . . . . . . . .
53 Courtland Davis 2 1 1 2 . . . . . . . . .
7 Carleton Stewar 6 2 . 2 . . . . . . . . .
89 Andrew Alston 3 2 . 2 . . . . . . . . .
38 Maurice Richard 7 2 . 2 . . . . . . . . .
76 Jaquizz Delight 1 . 2 2 . . . . . . . . .
19 Justin Fritts 5 2 . 2 . . . . . . . . .
20 Anthaun Sherrod 4 2 . 2 . . . . . . 1 . .
99 Jaquan Hardiman 5 2 . 2 1.0-16 1.0-16 . . . . . . .
92 Xavier Giles 1 1 . 1 1.0-4 . . . . . 1 . .
68 68 1 . 1 1 . . . . . . . . .
76 J. Lilite 1 1 . 1 1.0-3 1.0-3 . . . . . . .
75 Alanta Barbour 3 . 1 1 . . . . . . . . .
TM TEAM 5 1 . 1 . . . . . . . . 1
31 Eric Clay 2 1 . 1 . . . . . 1-0 . . .
37 Kameron Siler 2 1 . 1 . . . . . . . . .
74 Voshon Hill 5 1 . 1 . . . . . . . . .
12 Thomas Jones 7 1 . 1 . . . . . . . . .
30 Christopher Vas 7 1 . 1 . . . . . 1-0 . . .
46 Jercoby Groover 3 1 . 1 1.0-2 . . . . . . . .
27 Tomas Newman 7 1 . 1 . . . . . . . . .
44 Marquise Hollow 2 . . . . . . . 1 . . . .
Total 7 322 113 435 48-281 7-112 2-36 8 2 9-0 7 2 1
Opponents 7 261 117 378 74-298 23-147 6-35 23 3 9-93 7 4 2

VUL Team Game-by-Game (as of Oct 29, 2017)
All games
TEAM STATISTICS
Rushing Receiving Passing Kick Returns Punt Returns tot
Date Opponent no. yds td lg no. yds td lg cmp-att-int yds td lg no. yds td lg no. yds td lg off
Aug 27 LOUISBURG 36 59 0 13 9 96 1 51 9-34-0 96 1 51 6 115 0 25 1 17 0 17 155
Sep 02 at Florida Tech 35 125 0 19 9 30 0 15 9-29-0 30 0 15 8 126 0 20 1 8 0 8 155
9/9/2017 at UW-Oshkosh 28 70 1 23 13 124 0 28 13-27-2 124 0 28 8 128 0 47 0 0 0 0 194
Sep 16 at Newberry 22 22 0 16 11 60 0 14 11-23-0 60 0 14 4 137 1 98 1 -1 0 0 82
Oct 7 at Brevard 31 58 0 49 18 243 1 67 18-34-1 243 1 67 4 146 1 92 0 0 0 0 301
Oct 21 at Mississippi Valley 36 40 0 10 10 64 0 15 10-19-1 64 0 15 8 136 0 34 0 0 0 0 104
Oct 28 UVA-WISE 32 26 0 28 10 32 0 9 10-22-2 32 0 9 9 140 0 22 0 0 0 0 58
VUL 220 400 1 49 80 649 2 67 80-188-6 649 2 67 47 928 2 98 3 24 0 17 1049
Opponents 251 1052 17 55 156 2004 25 60 156-210-2 2004 25 60 15 444 1 78 25 369 4 70 3056
Games: 7 • Avg/rush: 1.8 • Avg/catch: 8.1 • Pass effic: 68.68 • KR avg: 19.7 • PR avg: 8.0 • All purpose avg/game: 291.0 • Total offense avg/gm: 149.9
Tackles Sacks Fumble Pass Defense blkd PAT Attempts off
Date Opponent ua a total tfl-yds no-yds ff fr-yds int-yds qbh brup kick kick rush rcv saf t/o pts
Aug 27 LOUISBURG 64 12 76 13.0-45 1.0-11 1 1-0 1-27 0 0 1 1-1 0 0 0 3 10
Sep 02 at Florida Tech 31 4 35 5.0-28 0.0-0 0 0-0 0-0 0 3 0 0-0 0 0 0 0 0
9/9/201 at UW-Oshkosh 59 10 69 5.0-38 1.0-16 1 2-0 0-0 0 0 0 1-1 0 0 0 0 7
Sep 16 at Newberry 62 19 81 3.0-9 0.0-0 2 2-0 0-0 0 2 0 1-1 0 0 0 0 7
Oct 7 at Brevard 33 20 53 6.0-90 2.0-72 1 2-0 1-9 2 1 0 0-1 0 0 0 0 12
Oct 21 at Mississippi Valley 30 12 42 7.0-41 2.0-10 1 1-0 0-0 0 0 1 0-0 0 0 1 0 5
Oct 28 UVA-WISE 43 36 79 9.0-30 1.0-8 1 1-0 0-0 0 2 0 0-0 0 0 0 0 0
VUL 322 113 435 48.0-281 7.0-117 7 9-0 2-36 2 8 2 3-4 0 0 1 3 41
Opponents 261 117 378 74.5-298 23.0-147 7 9-93 6-35 3 23 4 43-47 0 0 2 48 353
Punting Field Goals Kickoffs
Date Opponent no. yds avg long blkd tb fc 50+ i20 md-att long blkd no. yds avg tb ob
Aug 27 LOUISBURG 12 479 39.9 54 0 0 2 1 4 1-2 37 0 3 164 54.7 0 0
Sep 02 at Florida Tech 10 330 33.0 60 0 0 1 1 1 0-2 0 1 1 44 44.0 0 0
9/9/201 at UW-Oshkosh 7 247 35.3 46 0 0 3 0 1 0-0 0 0 2 99 49.5 0 0
Sep 16 at Newberry 10 287 28.7 44 1 0 5 0 1 0-1 0 0 2 120 60.0 0 0
Oct 7 at Brevard 5 178 35.6 47 0 1 0 0 1 0-1 0 0 4 191 47.8 0 0
Oct 21 at Mississippi Valley 6 200 33.3 52 1 0 0 1 2 1-1 26 0 2 103 51.5 0 0
Oct 28 UVA-WISE 7 288 41.1 51 0 0 0 1 2 0-0 0 0 2 78 39.0 0 0
VUL 57 2009 35.2 60 2 1 11 4 12 2-7 37 1 16 799 49.9 0 0
Opponents 17 616 36.2 49 0 2 2 0 4 4-6 45 0 61 3377 55.4 10 3
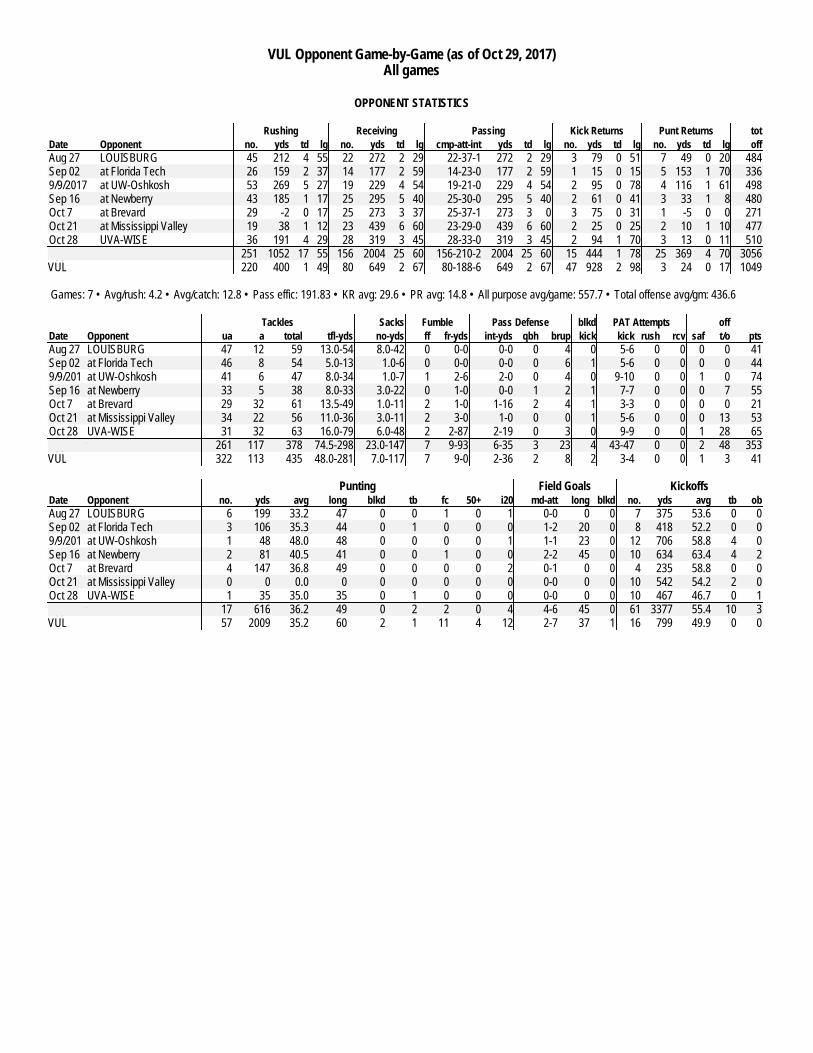
VUL Opponent Game-by-Game (as of Oct 29, 2017)
All games
OPPONENT STATISTICS
Rushing Receiving Passing Kick Returns Punt Returns tot
Date Opponent no. yds td lg no. yds td lg cmp-att-int yds td lg no. yds td lg no. yds td lg off
Aug 27 LOUISBURG 45 212 4 55 22 272 2 29 22-37-1 272 2 29 3 79 0 51 7 49 0 20 484
Sep 02 at Florida Tech 26 159 2 37 14 177 2 59 14-23-0 177 2 59 1 15 0 15 5 153 1 70 336
9/9/2017 at UW-Oshkosh 53 269 5 27 19 229 4 54 19-21-0 229 4 54 2 95 0 78 4 116 1 61 498
Sep 16 at Newberry 43 185 1 17 25 295 5 40 25-30-0 295 5 40 2 61 0 41 3 33 1 8 480
Oct 7 at Brevard 29 -2 0 17 25 273 3 37 25-37-1 273 3 0 3 75 0 31 1 -5 0 0 271
Oct 21 at Mississippi Valley 19 38 1 12 23 439 6 60 23-29-0 439 6 60 2 25 0 25 2 10 1 10 477
Oct 28 UVA-WISE 36 191 4 29 28 319 3 45 28-33-0 319 3 45 2 94 1 70 3 13 0 11 510
Opponents 251 1052 17 55 156 2004 25 60 156-210-2 2004 25 60 15 444 1 78 25 369 4 70 3056
VUL 220 400 1 49 80 649 2 67 80-188-6 649 2 67 47 928 2 98 3 24 0 17 1049
Games: 7 • Avg/rush: 4.2 • Avg/catch: 12.8 • Pass effic: 191.83 • KR avg: 29.6 • PR avg: 14.8 • All purpose avg/game: 557.7 • Total offense avg/gm: 436.6
Tackles Sacks Fumble Pass Defense blkd PAT Attempts off
Date Opponent ua a total tfl-yds no-yds ff fr-yds int-yds qbh brup kick kick rush rcv saf t/o pts
Aug 27 LOUISBURG 47 12 59 13.0-54 8.0-42 0 0-0 0-0 0 4 0 5-6 0 0 0 0 41
Sep 02 at Florida Tech 46 8 54 5.0-13 1.0-6 0 0-0 0-0 0 6 1 5-6 0 0 0 0 44
9/9/201 at UW-Oshkosh 41 6 47 8.0-34 1.0-7 1 2-6 2-0 0 4 0 9-10 0 0 1 0 74
Sep 16 at Newberry 33 5 38 8.0-33 3.0-22 0 1-0 0-0 1 2 1 7-7 0 0 0 7 55
Oct 7 at Brevard 29 32 61 13.5-49 1.0-11 2 1-0 1-16 2 4 1 3-3 0 0 0 0 21
Oct 21 at Mississippi Valley 34 22 56 11.0-36 3.0-11 2 3-0 1-0 0 0 1 5-6 0 0 0 13 53
Oct 28 UVA-WISE 31 32 63 16.0-79 6.0-48 2 2-87 2-19 0 3 0 9-9 0 0 1 28 65
Opponents 261 117 378 74.5-298 23.0-147 7 9-93 6-35 3 23 4 43-47 0 0 2 48 353
VUL 322 113 435 48.0-281 7.0-117 7 9-0 2-36 2 8 2 3-4 0 0 1 3 41
Punting Field Goals Kickoffs
Date Opponent no. yds avg long blkd tb fc 50+ i20 md-att long blkd no. yds avg tb ob
Aug 27 LOUISBURG 6 199 33.2 47 0 0 1 0 1 0-0 0 0 7 375 53.6 0 0
Sep 02 at Florida Tech 3 106 35.3 44 0 1 0 0 0 1-2 20 0 8 418 52.2 0 0
9/9/201 at UW-Oshkosh 1 48 48.0 48 0 0 0 0 1 1-1 23 0 12 706 58.8 4 0
Sep 16 at Newberry 2 81 40.5 41 0 0 1 0 0 2-2 45 0 10 634 63.4 4 2
Oct 7 at Brevard 4 147 36.8 49 0 0 0 0 2 0-1 0 0 4 235 58.8 0 0
Oct 21 at Mississippi Valley 0 0 0.0 0 0 0 0 0 0 0-0 0 0 10 542 54.2 2 0
Oct 28 UVA-WISE 1 35 35.0 35 0 1 0 0 0 0-0 0 0 10 467 46.7 0 1
Opponents 17 616 36.2 49 0 2 2 0 4 4-6 45 0 61 3377 55.4 10 3
VUL 57 2009 35.2 60 2 1 11 4 12 2-7 37 1 16 799 49.9 0 0
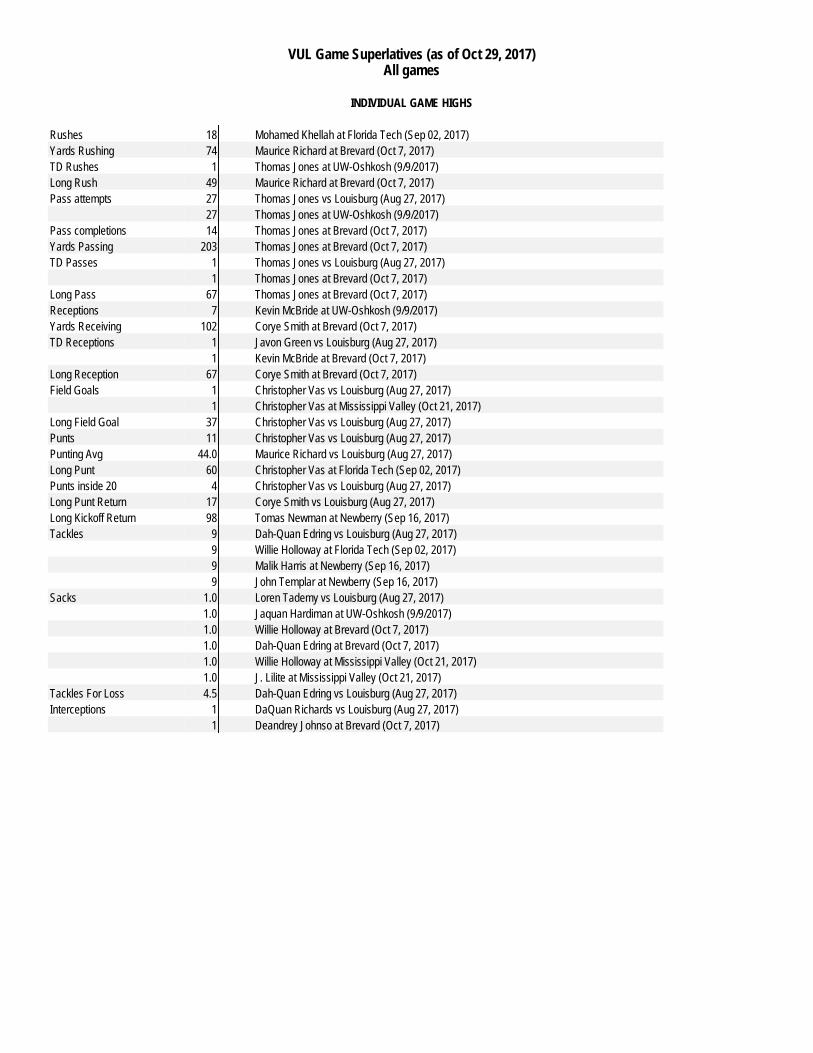
VUL Game Superlatives (as of Oct 29, 2017)
All games
INDIVIDUAL GAME HIGHS
Rushes 18 Mohamed Khellah at Florida Tech (Sep 02, 2017)
Yards Rushing 74 Maurice Richard at Brevard (Oct 7, 2017)
TD Rushes 1 Thomas Jones at UW-Oshkosh (9/9/2017)
Long Rush 49 Maurice Richard at Brevard (Oct 7, 2017)
Pass attempts 27 Thomas Jones vs Louisburg (Aug 27, 2017)
27 Thomas Jones at UW-Oshkosh (9/9/2017)
Pass completions 14 Thomas Jones at Brevard (Oct 7, 2017)
Yards Passing 203 Thomas Jones at Brevard (Oct 7, 2017)
TD Passes 1 Thomas Jones vs Louisburg (Aug 27, 2017)
1 Thomas Jones at Brevard (Oct 7, 2017)
Long Pass 67 Thomas Jones at Brevard (Oct 7, 2017)
Receptions 7 Kevin McBride at UW-Oshkosh (9/9/2017)
Yards Receiving 102 Corye Smith at Brevard (Oct 7, 2017)
TD Receptions 1 Javon Green vs Louisburg (Aug 27, 2017)
1 Kevin McBride at Brevard (Oct 7, 2017)
Long Reception 67 Corye Smith at Brevard (Oct 7, 2017)
Field Goals 1 Christopher Vas vs Louisburg (Aug 27, 2017)
1 Christopher Vas at Mississippi Valley (Oct 21, 2017)
Long Field Goal 37 Christopher Vas vs Louisburg (Aug 27, 2017)
Punts 11 Christopher Vas vs Louisburg (Aug 27, 2017)
Punting Avg 44.0 Maurice Richard vs Louisburg (Aug 27, 2017)
Long Punt 60 Christopher Vas at Florida Tech (Sep 02, 2017)
Punts inside 20 4 Christopher Vas vs Louisburg (Aug 27, 2017)
Long Punt Return 17 Corye Smith vs Louisburg (Aug 27, 2017)
Long Kickoff Return 98 Tomas Newman at Newberry (Sep 16, 2017)
Tackles 9 Dah-Quan Edring vs Louisburg (Aug 27, 2017)
9 Willie Holloway at Florida Tech (Sep 02, 2017)
9 Malik Harris at Newberry (Sep 16, 2017)
9 John Templar at Newberry (Sep 16, 2017)
Sacks 1.0 Loren Tademy vs Louisburg (Aug 27, 2017)
1.0 Jaquan Hardiman at UW-Oshkosh (9/9/2017)
1.0 Willie Holloway at Brevard (Oct 7, 2017)
1.0 Dah-Quan Edring at Brevard (Oct 7, 2017)
1.0 Willie Holloway at Mississippi Valley (Oct 21, 2017)
1.0 J. Lilite at Mississippi Valley (Oct 21, 2017)
Tackles For Loss 4.5 Dah-Quan Edring vs Louisburg (Aug 27, 2017)
Interceptions 1 DaQuan Richards vs Louisburg (Aug 27, 2017)
1 Deandrey Johnso at Brevard (Oct 7, 2017)
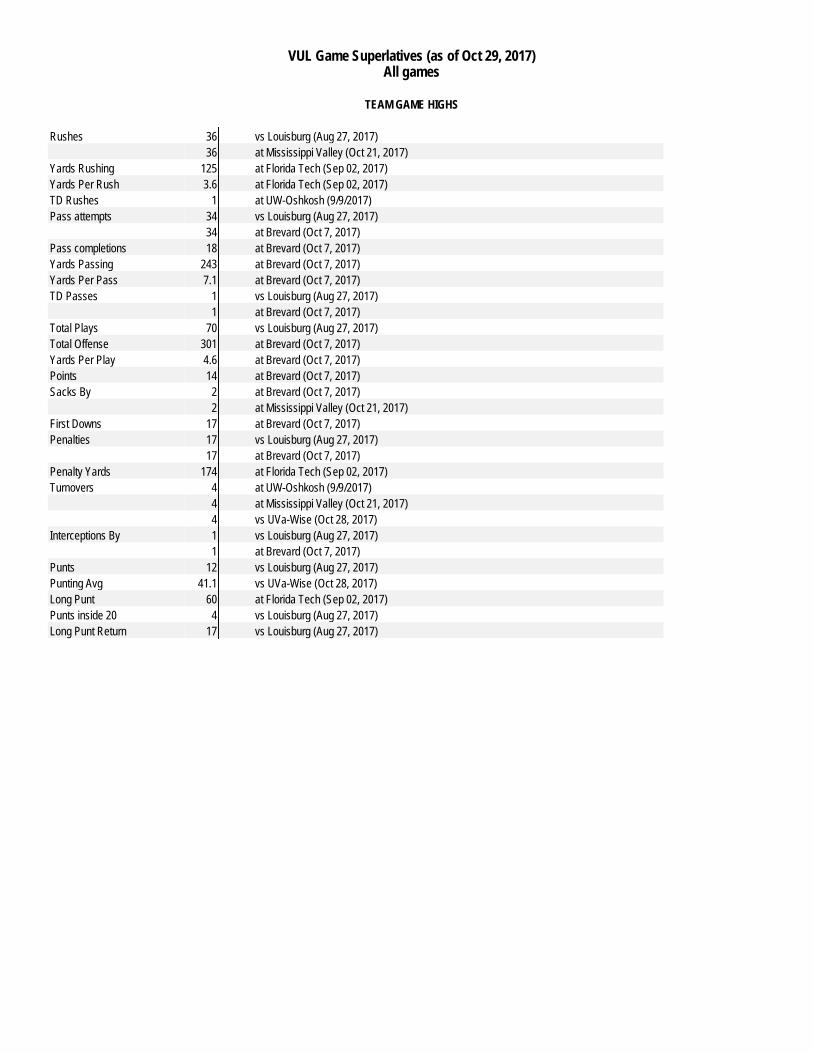
VUL Game Superlatives (as of Oct 29, 2017)
All games
TEAM GAME HIGHS
Rushes 36 vs Louisburg (Aug 27, 2017)
36 at Mississippi Valley (Oct 21, 2017)
Yards Rushing 125 at Florida Tech (Sep 02, 2017)
Yards Per Rush 3.6 at Florida Tech (Sep 02, 2017)
TD Rushes 1 at UW-Oshkosh (9/9/2017)
Pass attempts 34 vs Louisburg (Aug 27, 2017)
34 at Brevard (Oct 7, 2017)
Pass completions 18 at Brevard (Oct 7, 2017)
Yards Passing 243 at Brevard (Oct 7, 2017)
Yards Per Pass 7.1 at Brevard (Oct 7, 2017)
TD Passes 1 vs Louisburg (Aug 27, 2017)
1 at Brevard (Oct 7, 2017)
Total Plays 70 vs Louisburg (Aug 27, 2017)
Total Offense 301 at Brevard (Oct 7, 2017)
Yards Per Play 4.6 at Brevard (Oct 7, 2017)
Points 14 at Brevard (Oct 7, 2017)
Sacks By 2 at Brevard (Oct 7, 2017)
2 at Mississippi Valley (Oct 21, 2017)
First Downs 17 at Brevard (Oct 7, 2017)
Penalties 17 vs Louisburg (Aug 27, 2017)
17 at Brevard (Oct 7, 2017)
Penalty Yards 174 at Florida Tech (Sep 02, 2017)
Turnovers 4 at UW-Oshkosh (9/9/2017)
4 at Mississippi Valley (Oct 21, 2017)
4 vs UVa-Wise (Oct 28, 2017)
Interceptions By 1 vs Louisburg (Aug 27, 2017)
1 at Brevard (Oct 7, 2017)
Punts 12 vs Louisburg (Aug 27, 2017)
Punting Avg 41.1 vs UVa-Wise (Oct 28, 2017)
Long Punt 60 at Florida Tech (Sep 02, 2017)
Punts inside 20 4 vs Louisburg (Aug 27, 2017)
Long Punt Return 17 vs Louisburg (Aug 27, 2017)
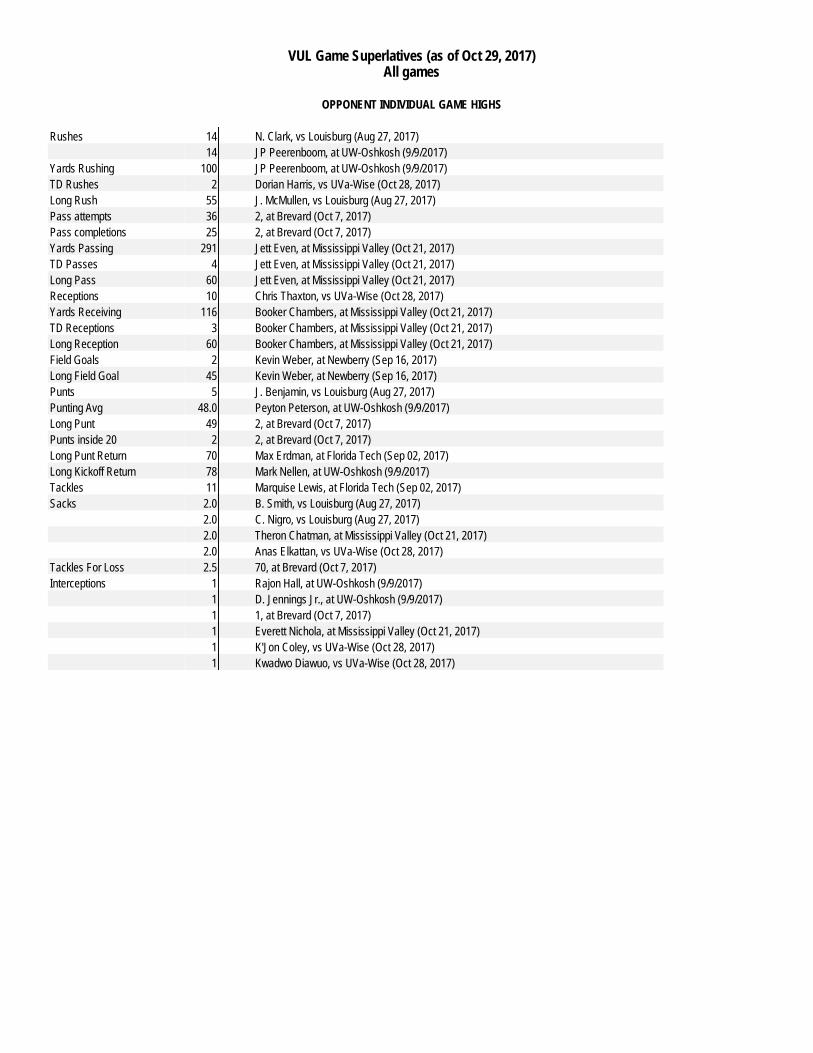
VUL Game Superlatives (as of Oct 29, 2017)
All games
OPPONENT INDIVIDUAL GAME HIGHS
Rushes 14 N. Clark, vs Louisburg (Aug 27, 2017)
14 JP Peerenboom, at UW-Oshkosh (9/9/2017)
Yards Rushing 100 JP Peerenboom, at UW-Oshkosh (9/9/2017)
TD Rushes 2 Dorian Harris, vs UVa-Wise (Oct 28, 2017)
Long Rush 55 J. McMullen, vs Louisburg (Aug 27, 2017)
Pass attempts 36 2, at Brevard (Oct 7, 2017)
Pass completions 25 2, at Brevard (Oct 7, 2017)
Yards Passing 291 Jett Even, at Mississippi Valley (Oct 21, 2017)
TD Passes 4 Jett Even, at Mississippi Valley (Oct 21, 2017)
Long Pass 60 Jett Even, at Mississippi Valley (Oct 21, 2017)
Receptions 10 Chris Thaxton, vs UVa-Wise (Oct 28, 2017)
Yards Receiving 116 Booker Chambers, at Mississippi Valley (Oct 21, 2017)
TD Receptions 3 Booker Chambers, at Mississippi Valley (Oct 21, 2017)
Long Reception 60 Booker Chambers, at Mississippi Valley (Oct 21, 2017)
Field Goals 2 Kevin Weber, at Newberry (Sep 16, 2017)
Long Field Goal 45 Kevin Weber, at Newberry (Sep 16, 2017)
Punts 5 J. Benjamin, vs Louisburg (Aug 27, 2017)
Punting Avg 48.0 Peyton Peterson, at UW-Oshkosh (9/9/2017)
Long Punt 49 2, at Brevard (Oct 7, 2017)
Punts inside 20 2 2, at Brevard (Oct 7, 2017)
Long Punt Return 70 Max Erdman, at Florida Tech (Sep 02, 2017)
Long Kickoff Return 78 Mark Nellen, at UW-Oshkosh (9/9/2017)
Tackles 11 Marquise Lewis, at Florida Tech (Sep 02, 2017)
Sacks 2.0 B. Smith, vs Louisburg (Aug 27, 2017)
2.0 C. Nigro, vs Louisburg (Aug 27, 2017)
2.0 Theron Chatman, at Mississippi Valley (Oct 21, 2017)
2.0 Anas Elkattan, vs UVa-Wise (Oct 28, 2017)
Tackles For Loss 2.5 70, at Brevard (Oct 7, 2017)
Interceptions 1 Rajon Hall, at UW-Oshkosh (9/9/2017)
1 D. Jennings Jr., at UW-Oshkosh (9/9/2017)
1 1, at Brevard (Oct 7, 2017)
1 Everett Nichola, at Mississippi Valley (Oct 21, 2017)
1 K'Jon Coley, vs UVa-Wise (Oct 28, 2017)
1 Kwadwo Diawuo, vs UVa-Wise (Oct 28, 2017)
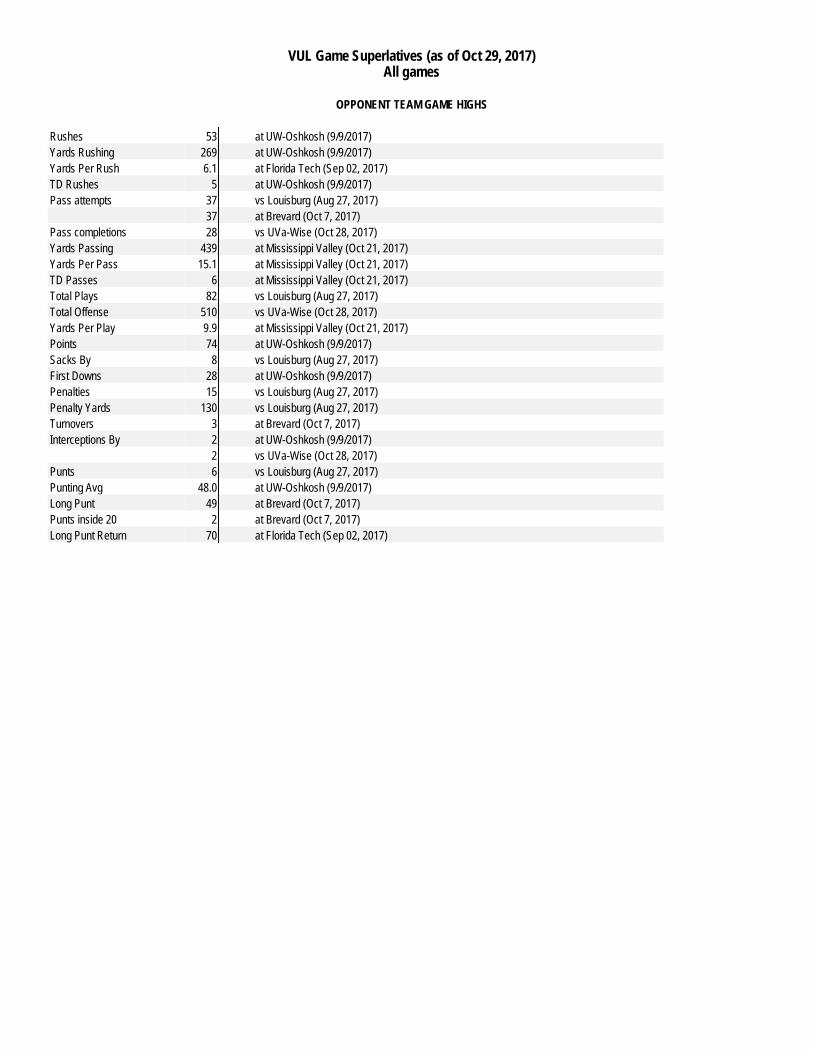
VUL Game Superlatives (as of Oct 29, 2017)
All games
OPPONENT TEAM GAME HIGHS
Rushes 53 at UW-Oshkosh (9/9/2017)
Yards Rushing 269 at UW-Oshkosh (9/9/2017)
Yards Per Rush 6.1 at Florida Tech (Sep 02, 2017)
TD Rushes 5 at UW-Oshkosh (9/9/2017)
Pass attempts 37 vs Louisburg (Aug 27, 2017)
37 at Brevard (Oct 7, 2017)
Pass completions 28 vs UVa-Wise (Oct 28, 2017)
Yards Passing 439 at Mississippi Valley (Oct 21, 2017)
Yards Per Pass 15.1 at Mississippi Valley (Oct 21, 2017)
TD Passes 6 at Mississippi Valley (Oct 21, 2017)
Total Plays 82 vs Louisburg (Aug 27, 2017)
Total Offense 510 vs UVa-Wise (Oct 28, 2017)
Yards Per Play 9.9 at Mississippi Valley (Oct 21, 2017)
Points 74 at UW-Oshkosh (9/9/2017)
Sacks By 8 vs Louisburg (Aug 27, 2017)
First Downs 28 at UW-Oshkosh (9/9/2017)
Penalties 15 vs Louisburg (Aug 27, 2017)
Penalty Yards 130 vs Louisburg (Aug 27, 2017)
Turnovers 3 at Brevard (Oct 7, 2017)
Interceptions By 2 at UW-Oshkosh (9/9/2017)
2 vs UVa-Wise (Oct 28, 2017)
Punts 6 vs Louisburg (Aug 27, 2017)
Punting Avg 48.0 at UW-Oshkosh (9/9/2017)
Long Punt 49 at Brevard (Oct 7, 2017)
Punts inside 20 2 at Brevard (Oct 7, 2017)
Long Punt Return 70 at Florida Tech (Sep 02, 2017)
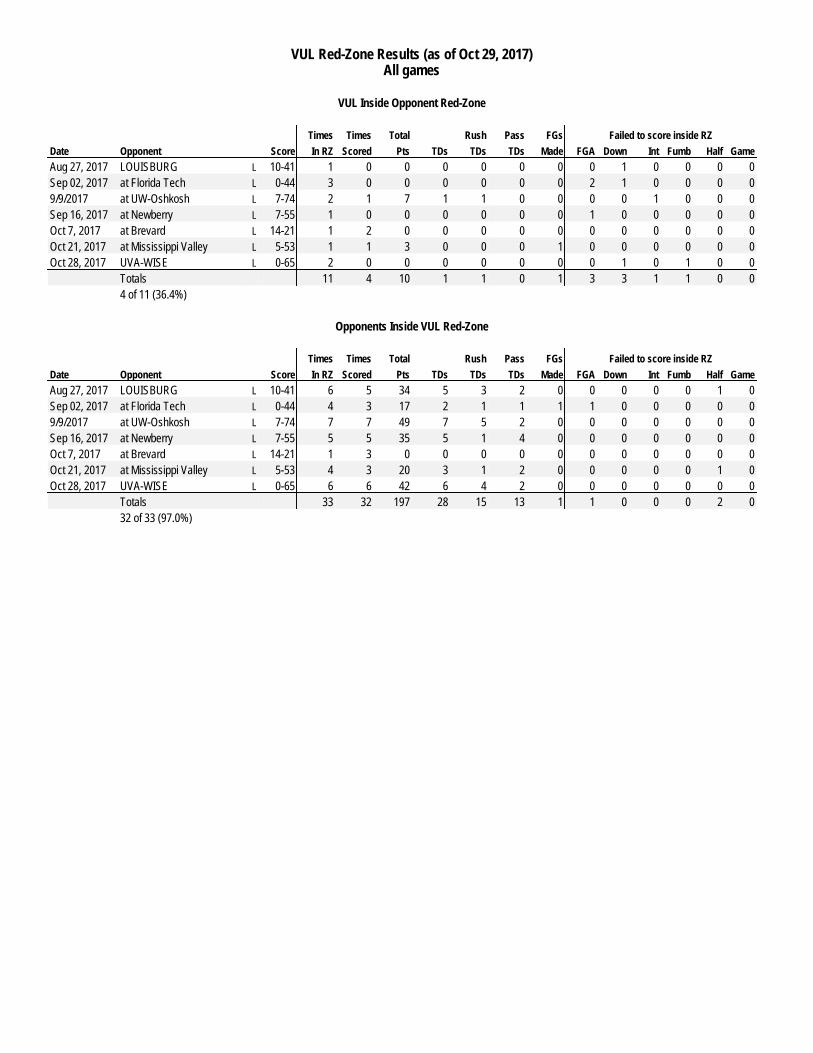
VUL Red-Zone Results (as of Oct 29, 2017)
All games
VUL Inside Opponent Red-Zone
Times Times Total Rush Pass FGs Failed to score inside RZ
Date Opponent Score In RZ Scored Pts TDs TDs TDs Made FGA Down Int Fumb Half Game
Aug 27, 2017 LOUISBURG L 10-41 1 0 0 0 0 0 0 0 1 0 0 0 0
Sep 02, 2017 at Florida Tech L 0-44 3 0 0 0 0 0 0 2 1 0 0 0 0
9/9/2017 at UW-Oshkosh L 7-74 2 1 7 1 1 0 0 0 0 1 0 0 0
Sep 16, 2017 at Newberry L 7-55 1 0 0 0 0 0 0 1 0 0 0 0 0
Oct 7, 2017 at Brevard L 14-21 1 2 0 0 0 0 0 0 0 0 0 0 0
Oct 21, 2017 at Mississippi Valley L 5-53 1 1 3 0 0 0 1 0 0 0 0 0 0
Oct 28, 2017 UVA-WISE L 0-65 2 0 0 0 0 0 0 0 1 0 1 0 0
Totals 11 4 10 1 1 0 1 3 3 1 1 0 0
4 of 11 (36.4%)
Opponents Inside VUL Red-Zone
Times Times Total Rush Pass FGs Failed to score inside RZ
Date Opponent Score In RZ Scored Pts TDs TDs TDs Made FGA Down Int Fumb Half Game
Aug 27, 2017 LOUISBURG L 10-41 6 5 34 5 3 2 0 0 0 0 0 1 0
Sep 02, 2017 at Florida Tech L 0-44 4 3 17 2 1 1 1 1 0 0 0 0 0
9/9/2017 at UW-Oshkosh L 7-74 7 7 49 7 5 2 0 0 0 0 0 0 0
Sep 16, 2017 at Newberry L 7-55 5 5 35 5 1 4 0 0 0 0 0 0 0
Oct 7, 2017 at Brevard L 14-21 1 3 0 0 0 0 0 0 0 0 0 0 0
Oct 21, 2017 at Mississippi Valley L 5-53 4 3 20 3 1 2 0 0 0 0 0 1 0
Oct 28, 2017 UVA-WISE L 0-65 6 6 42 6 4 2 0 0 0 0 0 0 0
Totals 33 32 197 28 15 13 1 1 0 0 0 2 0
32 of 33 (97.0%)
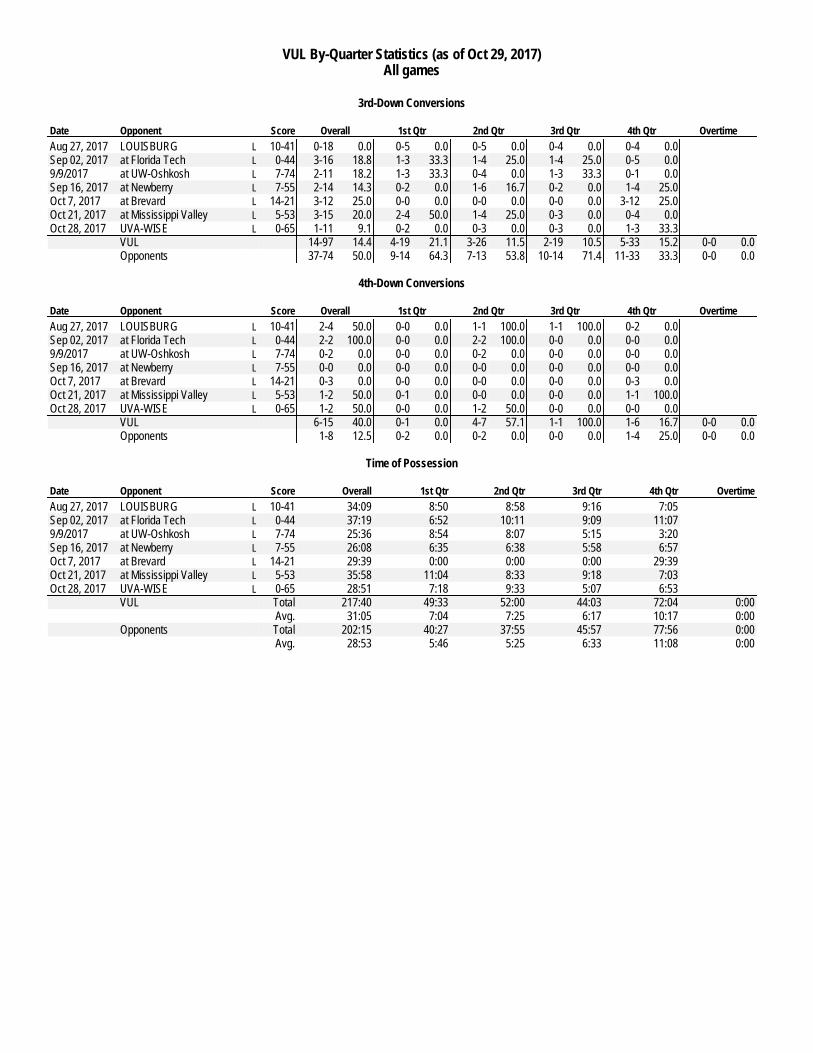
VUL By-Quarter Statistics (as of Oct 29, 2017)
All games
3rd-Down Conversions
Date Opponent Score Overall 1st Qtr 2nd Qtr 3rd Qtr 4th Qtr Overtime
Aug 27, 2017 LOUISBURG L 10-41 0-18 0.0 0-5 0.0 0-5 0.0 0-4 0.0 0-4 0.0
Sep 02, 2017 at Florida Tech L 0-44 3-16 18.8 1-3 33.3 1-4 25.0 1-4 25.0 0-5 0.0
9/9/2017 at UW-Oshkosh L 7-74 2-11 18.2 1-3 33.3 0-4 0.0 1-3 33.3 0-1 0.0
Sep 16, 2017 at Newberry L 7-55 2-14 14.3 0-2 0.0 1-6 16.7 0-2 0.0 1-4 25.0
Oct 7, 2017 at Brevard L 14-21 3-12 25.0 0-0 0.0 0-0 0.0 0-0 0.0 3-12 25.0
Oct 21, 2017 at Mississippi Valley L 5-53 3-15 20.0 2-4 50.0 1-4 25.0 0-3 0.0 0-4 0.0
Oct 28, 2017 UVA-WISE L 0-65 1-11 9.1 0-2 0.0 0-3 0.0 0-3 0.0 1-3 33.3
VUL 14-97 14.4 4-19 21.1 3-26 11.5 2-19 10.5 5-33 15.2 0-0 0.0
Opponents 37-74 50.0 9-14 64.3 7-13 53.8 10-14 71.4 11-33 33.3 0-0 0.0
4th-Down Conversions
Date Opponent Score Overall 1st Qtr 2nd Qtr 3rd Qtr 4th Qtr Overtime
Aug 27, 2017 LOUISBURG L 10-41 2-4 50.0 0-0 0.0 1-1 100.0 1-1 100.0 0-2 0.0
Sep 02, 2017 at Florida Tech L 0-44 2-2 100.0 0-0 0.0 2-2 100.0 0-0 0.0 0-0 0.0
9/9/2017 at UW-Oshkosh L 7-74 0-2 0.0 0-0 0.0 0-2 0.0 0-0 0.0 0-0 0.0
Sep 16, 2017 at Newberry L 7-55 0-0 0.0 0-0 0.0 0-0 0.0 0-0 0.0 0-0 0.0
Oct 7, 2017 at Brevard L 14-21 0-3 0.0 0-0 0.0 0-0 0.0 0-0 0.0 0-3 0.0
Oct 21, 2017 at Mississippi Valley L 5-53 1-2 50.0 0-1 0.0 0-0 0.0 0-0 0.0 1-1 100.0
Oct 28, 2017 UVA-WISE L 0-65 1-2 50.0 0-0 0.0 1-2 50.0 0-0 0.0 0-0 0.0
VUL 6-15 40.0 0-1 0.0 4-7 57.1 1-1 100.0 1-6 16.7 0-0 0.0
Opponents 1-8 12.5 0-2 0.0 0-2 0.0 0-0 0.0 1-4 25.0 0-0 0.0
Time of Possession
Date Opponent Score Overall 1st Qtr 2nd Qtr 3rd Qtr 4th Qtr Overtime
Aug 27, 2017 LOUISBURG L 10-41 34:09 8:50 8:58 9:16 7:05
Sep 02, 2017 at Florida Tech L 0-44 37:19 6:52 10:11 9:09 11:07
9/9/2017 at UW-Oshkosh L 7-74 25:36 8:54 8:07 5:15 3:20
Sep 16, 2017 at Newberry L 7-55 26:08 6:35 6:38 5:58 6:57
Oct 7, 2017 at Brevard L 14-21 29:39 0:00 0:00 0:00 29:39
Oct 21, 2017 at Mississippi Valley L 5-53 35:58 11:04 8:33 9:18 7:03
Oct 28, 2017 UVA-WISE L 0-65 28:51 7:18 9:33 5:07 6:53
VUL Total 217:40 49:33 52:00 44:03 72:04 0:00
Avg. 31:05 7:04 7:25 6:17 10:17 0:00
Opponents Total 202:15 40:27 37:55 45:57 77:56 0:00
Avg. 28:53 5:46 5:25 6:33 11:08 0:00


![nwjHkkk % QSDl% $ dUnh; HkM++ o Åu vul/kku lLFkkuk % 01437-220177 QSDl% $91-1437-220163 dUnh; HkM++ o Åu vul/kku lLFkku vfodkuxj ¼rglhy ekyijk] ftyk Vkd½ ok;k t;ij jktLFkku ¼Hkkjr½](https://img.pdfslide.us/doc/110x75/5b2ae8bc7f8b9aa9498b4bdc/nwjhkkk-qsdl-dunh-hkm-o-au-vulkku-quotk-01437-220177-qsdl-91-1437-220163.jpg)


![[ 413 ] cytological observations on bact. coli, proteus vul- garis and](https://img.pdfslide.us/doc/110x75/58a2e05d1a28ab7f678b80a1/-413-cytological-observations-on-bact-coli-proteus-vul-garis-and-.jpg)