Embed Size (px)
Citation preview
Ten Peaks Coffee Company Inc. 1
Management’s Discussion and Analysis
This Management’s Discussion & Analysis (“MD&A”) of Ten Peaks Coffee Company Inc. (“Ten Peaks” or the
“Company”), dated as of November 13, 2017, provides a review of the financial results for the three and nine
months ended September 30, 2017 relative to the comparable periods of 2016. The nine-month period
represents the third quarter (“Q3”) of our 2017 fiscal year. This MD&A should be read in conjunction with
Ten Peaks’ condensed consolidated interim financial statements for the period ended September 30, 2017, as
well as the amended and restated audited consolidated financial statements for the year ended December
31, 2016, which are available at www.sedar.com.
All financial information is presented in Canadian dollars, unless otherwise specified.
FORWARD-LOOKING STATEMENTS
This MD&A contains forward-looking statements, including statements regarding the future success of our
business and market opportunities. Forward-looking statements typically contain words such as “believes”,
“expects”, “anticipates”, “continue”, “could”, “indicates”, “plans”, “will”, “intends”, “may”, “projects”,
“schedule”, “would” or similar expressions suggesting future outcomes or events, although not all forward-
looking statements contain these identifying words. Examples of such statements include, but are not
limited to, statements concerning: (i) expectations regarding Ten Peaks’ future success in various geographic
markets; (ii) future financial results including anticipated future sales and processing volumes; (iii) future
dividends; (iv) the expected actions of the third parties described herein; (v) factors affecting the coffee
market including supplies and commodity pricing; and (vi) the business and financial outlook of Ten Peaks.
In addition, this MD&A contains financial outlook information that is intended to provide general guidance
for readers based on our current estimates, but which is based on numerous assumptions and may prove to
be incorrect. Therefore, such financial outlook information should not be relied upon by readers. These
statements are neither promises nor guarantees, but involve known and unknown risks and uncertainties
that may cause our actual results, level of activity, performance or achievements to be materially different
from any future results, levels of activity, performance or achievements expressed in or implied by these
statements. These risks include, but are not limited to, risks related to processing volumes and sales growth,
operating results, supply of coffee, general industry conditions, commodity price risks, technology,
competition, foreign exchange rates, construction timing, costs and financing of capital projects, general
economic conditions and those factors described herein under the heading ‘Risks & Uncertainties’.
The forward-looking statements contained herein are also based on assumptions that we believe are current
and reasonable, including but not limited to, assumptions regarding: (i) trends in certain market segments
and the economic climate generally; (ii) the financial strength of our customers; (iii) the value of the
Canadian dollar versus the US dollar; (iv) the expected financial and operating performance of Ten Peaks
going forward; and (v) the expected level of dividends payable to shareholders. We cannot assure readers
that actual results will be consistent with the statements contained in this MD&A. The forward-looking
statements and financial outlook information contained herein are made as of the date of this MD&A and
are expressly qualified in their entirety by this cautionary statement. Except to the extent required by
applicable securities law, Ten Peaks undertakes no obligation to publicly update or revise any such
statements to reflect any change in our expectations or in events, conditions, or circumstances on which any
such statements may be based, or that may affect the likelihood that actual results will differ from those
described herein.

Ten Peaks Coffee Company Inc. 2
EXECUTIVE SUMMARY
We recorded strong growth in the three and nine months ended September 30, 2017. In Q3 2017, our
revenue, net income and EBITDA were up compared to the same period last year. For the year-to-date, we
recorded year-over-year increases in our revenue, gross profit, operating income, net income and EBITDA. A
summary of our financial results is shown in the table below:
1 EBITDA is defined under ‘Non-IFRS Measures’ of this MD&A.
2 Per-share calculations are based on the weighted average number of shares outstanding during the period.
Our improved financial results primarily reflect higher volumes, as we continued to gain market share
against our competitors.
Importantly, our shipped volumes during the third quarter of 2017 were the highest in SWDCC’s history.
Total shipments for Q3 and the year-to-date were up by 11% and 10%, respectively, compared to 2016.
Shipments to importers rose by 39% in Q3 and by 27% in the first nine months of this year, while shipments
to roasters increased by 3% in the quarter and by 1% for the year-to-date, compared to the same periods
last year. Shipments to our commercial accounts were unchanged in the third quarter, while nine-month
shipments to commercial accounts rose by 7%. Volumes to our specialty accounts rose significantly, growing
by 33% in the third quarter and by 14% for the year-to-date.
Higher volumes boosted our year-over-year revenues by 6% in both the third quarter and for the year-to-
date. Quarterly revenue was $22.0 million, compared to $20.8 million in Q3 2016, and nine-month revenue
was $63.1 million, compared to $59.5 million in 2016. In both periods, we recorded gains in all three of our
revenue categories.
Gross profit declined by $0.2 million, or 6%, to $3.0 million in the third quarter. The decrease was owing to a
decline in the US dollar (“US$”) in the period, which compressed our margins for the quarter. For the year-
to-date, gross profit rose by $0.6 million, or 7%, to $9.4 million. The increase was mainly related to higher
process revenue, which grew with our increased volumes to specialty accounts.
Operating expenses were unchanged in the third quarter, and up by $0.2 million, or 4%, for the year-to-date.
The year-over-year increase reflects rising stock-based compensation during the first nine months of 2017,
compared to a declining trend during the same period last year.
Operating income was down by $0.2 million, or 16%, to $1.1 million for the third quarter, due to the lower
gross profit in the period. For the year-to-date, operating income rose by $0.4 million, or 10%, to $3.9
million, as our higher gross profit more than offset increased operating expenses.
Net income for the third quarter increased by 58% to $1.4 million, and by 61% to $4.5 million for the year-
to-date, compared to the same periods last year. In the quarter, gains on foreign exchange more than offset
(In $000s except per share amounts) 3 months ended 3 months ended 9 months ended 9 months ended
(unaudited) September 30, 2017 September 30, 2016 September 30, 2017 September 30, 2016
Sales 21,955$ 20,752$ 63,093$ 59,478$
Gross Profit 3,014 3,219 9,413 8,835
Operating Income 1,117 1,330 3,856 3,490
Net Income 1,385 879 4,541 2,820
EBITDA 1
1,678 1,515 5,593 3,773
Earnings per share, 2
basic 0.15$ 0.10$ 0.50$ 0.31$
Earnings per share, 2
diluted 0.15$ 0.10$ 0.41$ 0.31$
Ten Peaks Coffee Company Inc. 3
declines in operating income compared to Q3 2016. For the year-to-date, higher operating income, gains on
foreign exchange and risk management activities, and a fair value adjustment boosted our net income.
EBITDA for the third quarter increased by $0.2 million, or 11%, to $1.7 million. For the year-to-date, EBITDA
increased by $1.8 million, or 48%, to $5.6 million, driven by higher volumes and operating income, as well as
improved performance on our risk management activities.
BUSINESS OVERVIEW
Ten Peaks is a leading specialty coffee company doing business through two wholly owned subsidiaries,
Swiss Water Decaffeinated Coffee Company, Inc. (“SWDCC”) and Seaforth Supply Chain Solutions Inc.
(“Seaforth”). SWDCC is a premium green coffee decaffeinator located in Burnaby, BC. SWDCC employs the
proprietary SWISS WATER® Process to decaffeinate green coffee without the use of chemicals, leveraging
science-based systems and controls to produce coffee that is 99.9% caffeine free. We believe that the
SWISS WATER® Process is the world’s only 100% chemical free water process for third-party coffee
decaffeination. It is certified organic by the Organic Crop Improvement Association, and is also the world’s
only consumer-branded decaffeination process. This is our primary business, and the financial results of Ten
Peaks are dependent upon the results of SWDCC.
Seaforth provides a complete range of green coffee logistics services including devanning coffee received
from origin; inspecting, weighing and sampling coffees; and storing, handling and preparing green coffee for
outbound shipments. Seaforth provides all of SWDCC’s local green coffee handling and storage services. In
addition, Seaforth handles and stores coffees for several other coffee importers and brokers, and is the main
green coffee handling and storage company in Metro Vancouver. Seaforth is organically certified by Ecocert
Canada.
As at September 30, 2017, the condensed consolidated interim financial statements of Ten Peaks included
the accounts of Ten Peaks; our wholly owned subsidiaries SWDCC and Seaforth; and two wholly owned
subsidiaries of SWDCC, Swiss Water Decaffeinated Coffee Company USA, Inc., and Swiss Water Process
Marketing Services Inc. Inter-company accounts and transactions have been eliminated on consolidation.
Ten Peaks’ shares trade on the Toronto Stock Exchange under the symbol ‘TPK’. As at the date of this
report, 9,038,862 shares were issued and outstanding.
Swiss Water Decaffeinated Coffee Company’s Business
We carry an inventory of premium-grade Arabica coffees that we purchase from the specialty green coffee
trade, decaffeinate and then sell to our customers (our “regular” or “non-toll” business). Revenue from our
regular business includes both processing revenue and green coffee cost recovery revenue.
We also decaffeinate coffee owned by our customers for a processing fee under toll arrangements (our
“toll” business). The value of the coffee processed under toll arrangements does not form part of our
inventory, our revenue or our cost of sales. Revenue from toll arrangements consists entirely of processing
revenue. For the first nine months of this year, approximately 20% of the coffee we processed was under
toll arrangements, with the balance being regular business.
Our cost of sales is comprised primarily of the cost of green coffee purchased for our regular business, and
the plant labour and other processing costs directly associated with our production facility. This incorporates
an allocation of fixed overhead costs, which includes depreciation of our production equipment and
amortization of our proprietary process technology.
Ten Peaks Coffee Company Inc. 4
For our regular business, we work with coffee importers to source premium-grade green coffees from
coffee-producing countries located in Central and South America, Africa and Asia. The purchase price is
based on the New York ‘C’ (“NY‘C’”) coffee futures price on the IntercontinentalExchange, plus a quality
differential. The NY‘C’ component typically makes up more than 80% of the total cost of green coffee, while
the quality differential typically accounts for less than 20%. Both the NY‘C’ price and the quality differential
fluctuate in response to fundamental commodity factors that affect supply and demand.
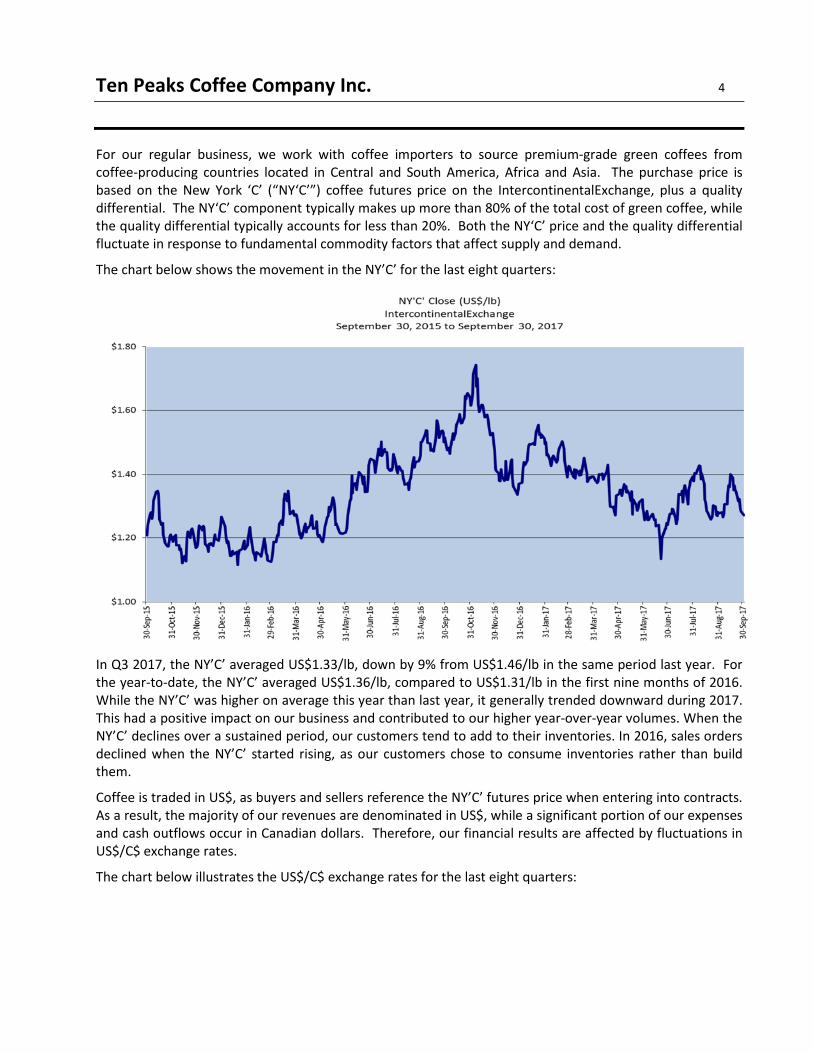
The chart below shows the movement in the NY’C’ for the last eight quarters:
In Q3 2017, the NY’C’ averaged US$1.33/lb, down by 9% from US$1.46/lb in the same period last year. For
the year-to-date, the NY’C’ averaged US$1.36/lb, compared to US$1.31/lb in the first nine months of 2016.
While the NY’C’ was higher on average this year than last year, it generally trended downward during 2017.
This had a positive impact on our business and contributed to our higher year-over-year volumes. When the
NY’C’ declines over a sustained period, our customers tend to add to their inventories. In 2016, sales orders
declined when the NY’C’ started rising, as our customers chose to consume inventories rather than build
them.
Coffee is traded in US$, as buyers and sellers reference the NY’C’ futures price when entering into contracts.
As a result, the majority of our revenues are denominated in US$, while a significant portion of our expenses
and cash outflows occur in Canadian dollars. Therefore, our financial results are affected by fluctuations in
US$/C$ exchange rates.
The chart below illustrates the US$/C$ exchange rates for the last eight quarters:

Ten Peaks Coffee Company Inc. 5
In Q3 2017, the US$ averaged $1.25 Canadian, a decrease of 4% over the same period last year. In the first
nine months of this year, the US$ averaged $1.31 Canadian, which was 1% lower than in the same period
last year. The US$/C$ exchange rate was relatively stable in the first five months of this year, before
declining rapidly between June and the end of August. When the US$ declines rapidly, it reduces our gross
profit on green coffee revenues, as we sell our coffee at a lower US$ than we purchased it for. Accordingly,
gross profit declined in the third quarter of 2017, in spite of our increased volumes and revenues. If the US$
continues to weaken through the balance of 2017, it is likely that our gross profit on sales of our
decaffeinated green coffee will be compressed.
HEDGE ACCOUNTING
We adopted the hedge accounting provisions of IFRS 9 January 1, 2016 because it better aligns with our
existing hedging strategies. The adoption of hedge accounting reduces the volatility in our financial results,
by better matching our accounting practices to our existing hedging practices. We have not changed our risk
management strategies with the adoption of hedge accounting. The economic impact of our hedges is
unchanged, even though the accounting for these derivative instruments has changed.
We enter into three types of hedges:
1) Commodity price risk hedges on our coffee purchase commitments and inventory (“commodity
hedges”);
2) Currency risk hedges on future US$ process revenues (“revenue hedges”); and
3) Customer specific currency risk hedges for coffee sales in C$ (“customer specific hedges”).
Ten Peaks Coffee Company Inc. 6
Each type of hedge is discussed below.
Commodity Hedges:
When we enter into a purchase commitment to purchase green coffee, the contract specifies that the
purchase price will be determined in part based on the future (to-be-determined) futures price or NY’C’. We
agree on or ‘fix’ the NY’C’ price with the vendor on or before receiving the coffee into inventory. When we
bear the economic risk of a change in the commodity price, we offset this price risk by selling short a futures
contract on the IntercontinentalExchange. When we later sell such coffee at a fixed price to a customer, we
cover our short by going long on a futures contract on the IntercontinentalExchange. As we always have
inventory on hand, we are always net short futures contracts.
At each period-end, commodity hedges are re-measured to their fair value. Under hedge accounting, gains
/losses for hedged coffee purchase commitments and inventory are reclassified to the statement of financial
position until such coffee is sold, at which time the gains/losses on our commodity hedges are recognized in
cost of sales. In this way, gains/losses on our commodity hedges are matched to our sales in the period.
Revenue Hedges:
We enter into forward contracts to sell US$ at future dates to hedge the foreign exchange cash flow
variability of expected US$ processing fee revenue up to 60 months in advance. The hedged process revenue
includes both process revenue from tolling arrangements (processing of customer-owned coffee) as well as
the US$ processing fee layer of inventory sales agreements. This enables us to more reliably predict how
much Canadian currency we will receive for our US$ process revenue. Cash flows in the immediate 12-
month period are hedged at a higher percentage of expected future revenues than those farther out,
reflecting greater uncertainty in the 13- to 60-month period.
At each period end, revenue hedges are re-measured to their fair value. Under hedge accounting,
unrealized gains/losses for open revenue hedges are reclassified to other comprehensive income. When a
revenue hedge matures, the realized gain/loss on that contract is reallocated from accumulated other
comprehensive income to process revenue.
Customer Specific Hedges:
We enter into forward contracts to buy US$ for green coffee inventory which, once decaffeinated, will be
sold at a fixed Canadian dollar (“C$”) price pursuant to a customer-specific contract. To mitigate the
exposure to changing margin on these transactions arising from fluctuations in the US$/C$ exchange rate,
we enter into US$ forward purchase contracts which economically lock in the US$/C$ exchange rate, and
effectively locks in the C$ cost of inventory to be sold at the fixed C$ amount.
The adoption of hedge accounting allows for better matching of US$ purchases with the associated
gains/losses on the forward contracts used to economically hedge these items. At each period-end,
customer-specific hedges are re-measured to their fair value. Under hedge accounting, the gains/losses on
these hedges are deferred on the statement of financial position until the inventory is sold, at which time
the gains/losses are recorded in cost of sales on the income statement.

Ten Peaks Coffee Company Inc. 7
OPERATING RESULTS
Processing Volumes and Revenue
During the third quarter, we shipped the highest quarterly volume of decaffeinated coffee in SWDCC’s
history. Compared to 2016, total shipments in the third quarter and for the year-to-date were up by 11%
and 10%, respectively. Growth in sales to our specialty customers led the way in the third quarter, and also
contributed to overall growth for the year-to-date. Volumes to our specialty accounts increased by 33% in
the quarter and by 14% for the year-to-date. Third quarter shipments to our commercial accounts were
unchanged from 2016, while year-to-date shipments to commercial accounts rose by 7%.
We also categorize our customers by the nature of their business (either coffee importer or roasters). Coffee
importers act like grocery stores to roasters, sourcing and importing green coffee from various origins and
carrying a selection of different origins and quality levels for roasters to choose from. Importers buy from us
in order to resell our coffees to roasters when and where they need it. Roasters are in the business of
roasting and packaging coffee for sale to consumers in their own coffee shops, or for home or office use.
Roasters either buy directly from SWDCC, or they buy from an importer. Roasters generally carry lower
inventories, as they tend to take delivery of green coffee shortly before roasting it.
Compared to 2016, shipments to importers rose by 39% in Q3 and by 27% in the first nine months of 2017,
while shipments to roasters increased by 3% in the quarter and by 1% for the year-to-date. Last year, a rising
NY’C’ prompted importers to reduce their inventories and delay buying. As a result, our volumes for 2016
were down slightly from 2015. By comparison, the NY’C’ gradually declined in the first nine months of this
year. Consequently, importers have boosted their inventories through 2017.
We monitor and report our revenue in three categories. “Process revenue” represents the amount we
charge our customers for decaffeinating green coffee, and it generally increases as our processing volumes
increase. “Green coffee cost recovery revenue” (or “green revenue”) is the amount we charge our
customers for the green coffee we purchase for decaffeination. “Distribution revenue” consists of shipping,
handling and warehousing charges billed to our customers. It typically rises with processing volumes and
with the growth of Seaforth’s business.
Our revenue by category for the indicated periods was as follows:
Our third quarter sales totaled $22.0 million, an increase of $1.2 million, or 6%, over the same quarter last
year. Process revenue increased by 11%, reflecting the strong increase in sales to specialty customers, as
well as higher volumes overall. Hedge gains also boosted process revenues in the quarter. Green revenue
increased by 3%, reflecting higher volumes. Distribution revenue rose by 15%, due to our higher volumes
and growth in Seaforth’s business.
Year-to-date sales totaled $63.1 million, an increase of $3.6 million, or 6%, over the same period last year.
Process revenue increased by 8%, and green revenue increased by 5%, both due to higher volumes. As in the
third quarter, hedge gains on revenue hedges also contributed to the increase in process revenue.
(In $000s)
(unaudited)
3 months ended 3 months ended 9 months ended 9 months ended
September 30, 2017 September 30, 2016 September 30, 2017 September 30, 2016
Process revenue 5,722$ 5,137$ 16,129$ 14,959$
Green revenue 14,920 14,475 43,377 41,377
Distribution revenue 1,314 1,140 3,587 3,142
Total 21,955$ 20,752$ 63,093$ 59,478$

Ten Peaks Coffee Company Inc. 8
Distribution revenue rose by 14%, with the increase driven by higher volumes and growth in Seaforth’s
business.
Cost of Sales
Cost of sales includes the cost of green coffee purchased for our regular business, and the plant labour and
other processing costs directly associated with our production facility. This incorporates an allocation of
fixed overhead costs, which includes depreciation of our production equipment and amortization of our
proprietary process technology. In addition, cost of sales includes the costs of operating Seaforth’s
warehouses.
Cost of sales increased during the third quarter, rising by 8% to $18.9 million. The increase was driven by
higher volumes, and a higher US$ earlier in the year (when coffee purchases were made). Year-to-date, our
cost of sales was $53.7 million, up by $3.0 million, or 6%. The increase was driven by higher volumes, a
higher NY’C’ and a stronger US$ earlier in the year.
Gross Profit
Gross profit decreased by 6% in the third quarter, primarily due to the rapid decline of the US$ during the
period. As a result of the decline, we sold green coffee at a lower US$/C$ exchange rate than we paid for it.
For the year-to-date, gross profit increased by 7%, as our higher revenues more than offset increases in our
cost of sales.
Sales and Marketing Expenses
Sales and marketing expenses include compensation and other personnel-related expenses for sales and
marketing staff, consumer and trade advertising and promotion costs, as well as related travel expenses.
Sales and marketing expenses declined by 6% to $0.6 million in Q3 2017, largely due to timing differences in
marketing and promotion activities. Sales and marketing expenses rose by $0.1 million, or 7%, for the first
nine months of the year. These expenses were higher in the first half of this year than they were in the same
period last year, as we invested in increased marketing activities in support of SWDCC’s growth initiatives.
Occupancy Expenses
Occupancy expenses include the cost of renting offices for sales, marketing and administrative use.
Occupancy costs for the third quarter and nine-month period were unchanged compared to the same
periods in 2016.
Administration Expenses
Administration includes general management, inbound and outbound logistics, finance and accounting,
quality control and assurance, engineering, research and development, and other administrative or support
functions. Administration expenses include compensation expenses, travel and other personnel-related
expenses for administrative staff, directors’ fees, investor relations expenses, professional fees, depreciation
of office-related equipment, and amortization of the brand asset.
Administration expenses increased by 4% to $1.2 million for the third quarter of 2017, and by 3% to $3.6
million for the first nine months of 2017. In both periods, the year-over-year increases reflect higher share-
based compensation expenses.
Ten Peaks Coffee Company Inc. 9
Finance Income / Expenses
Finance income reflects the charges we bill to customers for financing coffee inventories and interest earned
on cash balances. Finance expenses include interest costs on bank debt and other borrowings, the accretion
expense on our asset retirement obligation and the interest expense on the convertible debenture.
Net finance expenses were $0.3 million and $0.6 million for the three and nine months ended September
30, 2017, compared to net finance income of $0.1 million and $0.2 million, respectively, in the same periods
last year. Interest on the convertible debenture is expensed at an effective interest rate of 12.15% (a rate
determined by management in accordance with IFRS), while interest is paid on this loan at a rate of 6.85%.
This debenture was issued in Q4 2016, so no similar expense was incurred in the comparative periods last
year.
Gains and Losses on Risk Management Activities
With the adoption of hedge accounting, gains or losses on designated hedges are included in either revenue
or cost of sales, held on the balance sheet or included in other comprehensive income for future
transactions (see ‘Hedge Accounting’, above). Thus, ‘Gain (loss) on risk management activities’ includes only
those gains and losses on derivative financial instruments that are not designated as hedging instruments, as
well as gains/losses on the ineffective portions of our hedging instruments.
For the three months ended September 30, 2017, we recorded a gain of $0.1 million, unchanged from the
same period in 2016. For the year-to-date, we recorded a gain of $0.8 million compared to a gain of $0.1
million for same period last year. Earlier in the year, we recognized more switch gains on our commodity
hedges (and such gains are not part of the designated hedge), boosting our results in the first nine months
of 2017.
Fair Value Adjustment on Embedded Option
Ten Peaks entered into a convertible debenture in October 2016. Under IFRS, this instrument is deemed to
contain an embedded option which must be revalued at each balance sheet date. The fair value of the
derivative liability was determined using the Black-Scholes Option Pricing Model. The variables and
assumptions used in computing the fair value are based on management’s best estimate at each balance
sheet date.
The revaluation on this embedded option resulted in a loss of $0.1 million in the third quarter of 2017 and a
gain of $0.9 million for the year-to-date.
Gains and Losses on Foreign Exchange
We realize gains and losses on transactions denominated in foreign currencies when they occur, and on
assets and liabilities denominated in foreign currencies when they are translated into Canadian dollars as at
the financial statement date.
During the third quarter, we recorded a gain on foreign exchange of $0.6 million, compared to a loss of $0.2
million for the same period last year. For the year-to-date, we recorded a foreign exchange gain of $0.7
million, compared to no effective gain or loss in the same period last year. The rapid appreciation of the C$
in the third quarter contributed to the gain on foreign exchange in both periods.

Ten Peaks Coffee Company Inc. 10
Income Before Taxes and Net Income
In the third quarter, we recorded income before taxes of $1.6 million, compared to $1.3 million in the same
period last year. Current and deferred income taxes slightly reduced our net income in Q3 2017, due to
reconciling items from prior periods which were recorded in the third quarter. By comparison, current and
deferred income taxes reduced our net income by $0.4 million in Q3 2016. Deferred income taxes arise
mainly from temporary differences between the depreciation and amortization expenses deducted for
accounting purposes, and the capital cost allowances deducted for tax purposes, as well as changes in
corporate income tax rates as adjusted for substantively enacted higher future tax rates. The latter are
offset by the tax benefit of loss carry forwards recognized. Overall, we recorded net income of $1.4 million
for the quarter, compared to net income of $0.9 million for the same period in 2016.
For the year-to-date, we recorded pre-tax income of $5.7 million, up from $3.8 million in the first nine
months of 2016. This was reduced by income tax expenses of $1.2 million, compared to income taxes of $1.0
million in the same period last year. Overall, we recorded net income of $4.5 million for the year-to-date,
which is an increase of $1.7 million, or 61%, compared to the same period last year.
Basic and Diluted Earnings per Share
Basic earnings per share is calculated by dividing net income by the basic weighted average number of
shares outstanding during the period. Similarly, diluted earnings per share is calculated by dividing net
income adjusted for the effects of all dilutive potential common shares, by the diluted weighted average
number of shares outstanding. For the purposes of the calculation, under IFRS we are required to assume
that the maximum number of shares issuable under the convertible debenture will be issued, even though
the debenture contains a net share settlement provision (which if exercised would result in far fewer shares
being issued).
In Q3 2017, the potential common shares issuable under the convertible debenture are anti-dilutive, and as
such they are excluded from the calculation of diluted earnings per share in the quarter. These potential
common shares are included in the calculation of the diluted earnings per share for the year-to-date.
The calculations of basic and diluted earnings per share for the current and prior periods are shown in the
table below:
(In $000s except per share data)
(unaudited)
3 months ended 3 months ended 9 months ended 9 months ended
September 30, 2017 September 30, 2016 September 30, 2017 September 30, 2016
Basic EPS:
Net income attributable to shareholders 1,385$ 879 4,541$ 2,820$
Weighted average number of shares 9,038,862 9,016,313 9,038,862 9,013,160
Basic EPS 0.15$ 0.10$ 0.50$ 0.31$
Diluted EPS:
Net income attributable to shareholders 1,385$ 879$ 4,541$ 2,820$
After tax effect of diluted securities if debenture converted:
Interest on convertible debenture - - 770 -
Loss (gain) on fair value adjustment of embedded option - - (909) -
Net income after effect of diluted securities 1,385$ 879$ 4,402$ 2,820$
Weighted average number of shares - basic 9,038,862 9,016,313 9,038,862 9,013,160
Effect of diluted securities: convertible debenture - - 1,818,182 -
Weighted average number of shares - diluted 9,038,862 9,016,313 10,857,044 9,013,160
Diluted EPS 0.15$ 0.10$ 0.41$ 0.31$

Ten Peaks Coffee Company Inc. 11
Other Comprehensive Income
Gains or losses on our revenue hedges that will mature in future periods are recorded in other
comprehensive income, net of income tax expense. Other comprehensive income net of tax for the third
quarter was $0.5 million, compared to a loss of $0.5 million in the same period last year. For the year-to-
date, we reported a gain of $1.4 million, compared to a gain of $1.2 million in the same period of 2016. This
amount fluctuates with the closing US$/C$ exchange rate each period-end.
Non-IFRS Measures
EBITDA
EBITDA is often used by publicly traded companies as a measure of cash from operations, as it excludes
financing costs, taxation and non-cash items. The reporting of EBITDA is intended to assist readers in the
performance of their own financial analysis. However, since this measure does not have a standardized
meaning prescribed by IFRS, it is unlikely to be comparable to similar measures presented by other entities.
We define EBITDA as net income before interest, depreciation, amortization, impairments, share-based
compensation, gains/losses on foreign exchange, gains/losses on disposal of capital equipment, fair value
adjustments on embedded options, and provision for income taxes. Our definition of EBITDA also excludes
unrealized gains and losses on the undesignated portion of foreign exchange forward contracts.
The reconciliation of net income to EBITDA is as follows:
In order to help readers better understand our financial results, the following table shows the reconciliation
of operating income to EBITDA:
(In $000s)
(unaudited)
3 months ended 3 months ended 9 months ended 9 months ended
September 30, 2017 September 30, 2016 September 30, 2017 September 30, 2016
Income for the period 1,385$ 879$ 4,541$ 2,820$
Income taxes 186 396 1,153 1,002$
Income before tax 1,571 1,275 5,694 3,822
Finance (income) expense 251 (50) 640 (188)
Depreciation & amortization 531 526 1,589 1,457
Unrealized (gain) loss on foreign exchange forward contracts (151) (519) (782) (1,147)
Fair value (gain) loss on embedded option 56 - (909) -
(Gain) loss on foreign exchange (633) 202 (745) (24)
Share-based compensation 52 81 105 (147)
EBITDA 1,678$ 1,515$ 5,593$ 3,773$
(In $000s)
(unaudited)
3 months ended 3 months ended 9 months ended 9 months ended
September 30, 2017 September 30, 2016 September 30, 2017 September 30, 2016
Operating income for the period 1,117$ 1,330$ 3,856$ 3,490$
Add back:
Depreciation & amortization 531$ 526$ 1,589$ 1,457$
Share-based compensation 52$ 81$ 105$ (147)$
Gain (loss) on risk management activities 128$ 97$ 825$ 120$
Deduct:
Unrealized (gain) loss on undesignated hedging instruments (151)$ (519)$ (782)$ (1,147)$
EBITDA 1,678$ 1,515$ 5,593$ 3,773$
Ten Peaks Coffee Company Inc. 12
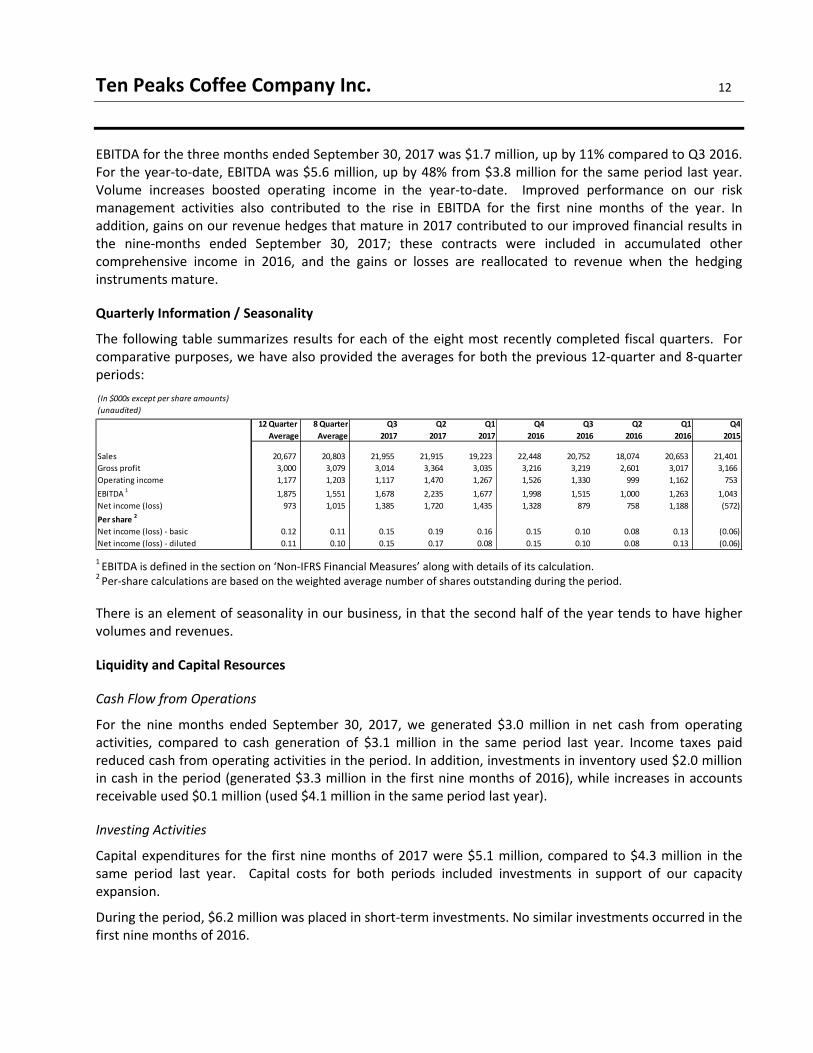
EBITDA for the three months ended September 30, 2017 was $1.7 million, up by 11% compared to Q3 2016.
For the year-to-date, EBITDA was $5.6 million, up by 48% from $3.8 million for the same period last year.
Volume increases boosted operating income in the year-to-date. Improved performance on our risk
management activities also contributed to the rise in EBITDA for the first nine months of the year. In
addition, gains on our revenue hedges that mature in 2017 contributed to our improved financial results in
the nine-months ended September 30, 2017; these contracts were included in accumulated other
comprehensive income in 2016, and the gains or losses are reallocated to revenue when the hedging
instruments mature.
Quarterly Information / Seasonality
The following table summarizes results for each of the eight most recently completed fiscal quarters. For
comparative purposes, we have also provided the averages for both the previous 12-quarter and 8-quarter
periods:
1
EBITDA is defined in the section on ‘Non-IFRS Financial Measures’ along with details of its calculation. 2
Per-share calculations are based on the weighted average number of shares outstanding during the period.
There is an element of seasonality in our business, in that the second half of the year tends to have higher
volumes and revenues.
Liquidity and Capital Resources
Cash Flow from Operations
For the nine months ended September 30, 2017, we generated $3.0 million in net cash from operating
activities, compared to cash generation of $3.1 million in the same period last year. Income taxes paid
reduced cash from operating activities in the period. In addition, investments in inventory used $2.0 million
in cash in the period (generated $3.3 million in the first nine months of 2016), while increases in accounts
receivable used $0.1 million (used $4.1 million in the same period last year).
Investing Activities
Capital expenditures for the first nine months of 2017 were $5.1 million, compared to $4.3 million in the
same period last year. Capital costs for both periods included investments in support of our capacity
expansion.
During the period, $6.2 million was placed in short-term investments. No similar investments occurred in the
first nine months of 2016.
(In $000s except per share amounts)
(unaudited)
12 Quarter 8 Quarter Q3 Q2 Q1 Q4 Q3 Q2 Q1 Q4
Average Average 2017 2017 2017 2016 2016 2016 2016 2015
Sales 20,677 20,803 21,955 21,915 19,223 22,448 20,752 18,074 20,653 21,401
Gross profit 3,000 3,079 3,014 3,364 3,035 3,216 3,219 2,601 3,017 3,166
Operating income 1,177 1,203 1,117 1,470 1,267 1,526 1,330 999 1,162 753
EBITDA 1
1,875 1,551 1,678 2,235 1,677 1,998 1,515 1,000 1,263 1,043
Net income (loss) 973 1,015 1,385 1,720 1,435 1,328 879 758 1,188 (572)
Per share 2
Net income (loss) - basic 0.12 0.11 0.15 0.19 0.16 0.15 0.10 0.08 0.13 (0.06)
Net income (loss) - diluted 0.11 0.10 0.15 0.17 0.08 0.15 0.10 0.08 0.13 (0.06)
Ten Peaks Coffee Company Inc. 13
Financing Activities
During the nine months ended September 30, 2017 we paid $1.7 million in dividends to shareholders,
unchanged from the same period last year.
Credit Facilities and Liquidity
Our current credit facilities include a $14.5 million revolving operating line of credit and a $1.5 million
revolving swing line, each of which bears an interest rate of prime plus 0.75%. Any US$-denominated debt
under the revolving operating line of credit or swing line can be financed using LIBOR loans at the LIBOR rate
plus 2.35% per annum.
In addition, we have a US$8.0 million foreign exchange and commodity futures contract facility. This allows
us to enter into spot, forward and other foreign exchange rate transactions with our bank with a maximum
term of 60 months.
Our facilities are collateralized by a general security agreement over all of the assets of Ten Peaks and a
floating hypothecation agreement over cash balances.
We have certain bank covenants which relate to the maintenance of specified financial ratios and we were
in compliance with all covenants as at September 30, 2017.
Inventory
Our inventory increased 41% by volume and 18% by value between December 31, 2016 and September 30,
2017. The increase reflects a higher NY`C` in the current year, as well as growth in both finished goods and
raw materials inventory.
With the adoption of hedge accounting, gains/losses on derivative instruments for coffee to be sold in future
periods are now recorded in inventory. The hedge accounting component of inventory as at September 30,
2017 was a loss of $0.2 million, compared to a gain of $0.9 million for the same period last year.
Accounts Receivable
Our accounts receivable have increased by $0.1 million, or 1%, between December 31, 2016 and September
30, 2017. This compares to an increase of $4.1 million, or 57%, in the same period last year. Last year’s
increase reflects a trend in the coffee industry, in which large coffee roasters have demanded longer
accounts payable terms from their suppliers. As a result, we extended payment terms to a number of our
larger customers in 2016.
Contractual Obligations
The following table sets forth our contractual obligations and commitments as at September 30, 2017:
Ten Peaks Coffee Company Inc. 14
1 Long-term debt represents the principal amount of the convertible debenture.
2 Minimum obligations for our financing leases.
3 Minimum obligations for our operating leases.
4 Represents outstanding coffee and natural gas purchase commitments.
SWDCC leases a facility which houses its decaffeination plant and offices. The current lease term expires in
2018. After 2018, the lease on the decaffeination facility can be renewed at SWDCC’s option for one
additional five-year term.
Seaforth leases a warehouse for its primary operations; this lease expires on June 30, 2019.
Swiss Water Decaffeinated Coffee Company USA, Inc. holds a lease for its Seattle, WA sales office, which
expires on March 31, 2020.
In Q3 2016, SWDCC signed a lease agreement for a build-to-suit production facility. The lease has an initial
term of five years, and can be renewed at SWDCC’s option in five-year increments up to a total of 30 years.
The lease will commence the earlier of the date of opening of the SWDCC business in any part of the
premises, and the date of expiry of the fixturing period, which is estimated to be March 2018. Under the
lease, SWDCC has multiple options to buy-out the lease starting at the end of the second five-year term.
The buy-out value will be equal to the fair market value of the property as determined by an appraisal
process, subject to specified maximum and minimum values.
The lease also includes a construction management agreement for the construction of a highly specialized
building to house the production plant. The landlord will finance this portion of the building, with loan
payments commencing on the earlier of substantial completion of construction and January 1, 2019. The
loan is repayable in equal monthly installments over 15 years, and can be prepaid without penalty at any
time. There was no loan outstanding as at September 30, 2017.
Off-Balance Sheet Arrangements
Ten Peaks has no off-balance sheet arrangements.
Related Party Transactions
We provide toll decaffeination services and/or sell finished goods to, and purchase raw material inventory
from, a company that is related to Ten Peaks’ Director Roland Veit.
The following tables summarize related party sales and purchases during the periods:
(In $000s)
(unaudited)
Total Less than 1 year 1-3 Years 4-5 Years Over 5 Years
Long-term debt (1)
15,000$ -$ -$ -$ 15,000$
Financing leases (2)
6,186 687 2,357 2,357 786
Operating leases (3)
1,470 916 554 - -
Purchase obligations (4)
31,673 28,033 3,640 - -
Total contractual obligations 54,329$ 29,636$ 6,550$ 2,357$ 15,786$
(In $000s)
(unaudited)
3 months ended 3 months ended 9 months ended 9 months ended
September 30, 2017 September 30, 2016 September 30, 2017 September 30, 2016
Sales 44$ 215$ 270$ 374$
Purchase of raw materials 1,081$ 901$ 5,031$ 3,243$
Ten Peaks Coffee Company Inc. 15
All transactions were in the normal course of operations and were measured at the fair value of the
consideration received or receivable, which was established and agreed to by the related parties. As at
September 30, 2017, our accounts receivable balance with this company was nil (December 31, 2016 – $0.1
million) and our accounts payable balance with this company was $0.2 million (December 31, 2016 - $0.1
million).
On March 16, 2017, a subsidiary of Ten Peaks and a member of Key Management (the borrower) entered
into a promissory note in the amount of US$0.1 million. For as long as the borrower remains an employee,
the obligation to repay the principal is forgiven against current and future awards under the RSU Plan, by
forfeiture of awards. The loan is interest-free other than in the event of default, in which case the
promissory note shall bear simple interest at a rate of 10% per annum.
OUTLOOK
Demand for our premium quality decaffeinated coffees is rising, due to a number of factors. First, the overall
market for decaffeinated coffee is expanding, with decaf being the fastest growing segment of the US coffee
market1. Total decaffeinated coffee sales are up year-over-year, with specialty decaffeinated coffee sales
being particularly strong, especially in out-of-home markets.
We believe this is due, in part, to the premiumization of the coffee market, as well as growing awareness
and consumption of premium decaffeinated coffee. In fact, the largest consumers of decaffeinated coffee
are 18-24 year olds2, who want to drink great-tasting coffee all day long, without worrying about the
potential side effects of caffeine.
Additionally, younger consumers are more conscious of artificial ingredients and chemicals. As a result,
we’ve seen increased demand for our sustainable and organically certified SWISS WATER® Process coffees,
as more food companies now employ our branded coffees to help them respond to this growing consumer
demand.
Importantly, various media sources3 have recently underscored the health and environmental hazards
associated with methylene chloride (the primary chemical used by our competitors to decaffeinate coffee).
This has drawn attention to the harmful effects of chemical decaf. At present, our marketing team is
leveraging this increased consumer awareness, and highlighting the availability of our premium quality,
100% chemical free coffees. We expect this rise in consumer awareness to stimulate market pull for our
coffees over the coming months and year ahead, and we will continue to proactively employ positive
messaging to accentuate our amazing coffees without caffeine.
1 National Coffee Association 2017 Coffee Drinking Trends
2 National Coffee Association 2017 Coffee Drinking Trends
3 New York Times has published (https://www.nytimes.com/2017/10/21/us/epa-toxic-chemicals.html) and podcasted
https://www.nytimes.com/podcasts/the-daily?_r=0 a piece on EPA regulations, and they are highlighting methylene
chloride as a key chemical that isn’t, but should be, regulated, because it’s a hazard to people’s health.
Earlier this year, New Scientist published a report (https://www.newscientist.com/article/2138753-ozone-layer-
recovery-will-be-delayed-by-chemical-leaks/) about how methylene chloride is slowing the regeneration of the ozone
layer. This report was picked up by other media companies as well.

Ten Peaks Coffee Company Inc. 16
In addition to consumer-driven trends, changes in the global decaffeination market are enhancing our
growth prospects. An older decaffeination plant in Europe closed earlier this year, reducing the available
chemical free, third-party decaffeinators. We have already won some additional business from coffee
companies affected by this shutdown, and we expect additional growth in the future.
As we have noted previously, we are building a state-of-the-art production facility which will enable us to
meet the anticipated long-term growth in demand for our decaffeinated coffees. Construction of the new
facility, which will be located in Delta, BC, began in May 2017 and is expected to be completed in 2018.
Initially, this facility will house one new production line, although the site is large enough for expansion well
into the future. Construction of the new production line is expected to be completed in early 2019 and
commissioned in the first half of 2019. The additional capacity that was added in Q1 2016 at our current
Burnaby, BC facility is expected to be sufficient to fulfill expected business growth until the new line is
operational.
In short, our unbending commitment to 100% chemical free processing, and to preserving the unique quality
of fine coffees through the decaffeination process, are already well recognized, valued and respected by the
coffee trade and our customers – and attracting new supporters all the time. Accordingly, we believe our
reputation for excellence will continue to drive incremental growth in SWDCC’s decaffeination business for
the balance of 2017 and beyond.
RISKS AND UNCERTAINTIES
Ten Peaks’ ability to pay dividends is dependent upon the earnings and cash flow generated from SWDCC’s
operations, as well as our current and planned future investments in capital equipment. Cash from
operations may fluctuate with the performance of the business, which can be susceptible to a number of
risks. These risks may include, but are not limited to, foreign exchange fluctuations, labour relations, coffee
prices (notwithstanding hedging programs, as exact hedging correlation is not attainable), the availability of
coffee, competition from existing chemical and other natural or chemical free coffee decaffeinators,
competition from new entrants with alternate processing methods or agricultural technologies,
environmental and regulatory risks, terms of credit agreements, commodity futures losses, ability to
maintain organic certification, adequacy of insurance, dependence on key personnel, product liability,
uncollectable debts, and general economic downturns. The future effect of these risks and uncertainties
cannot be quantified or predicted. In addition, SWDCC leases the building that houses its decaffeination
lines. The lease is renewable at its option under an additional term which, if exercised, would expire in
2023. The lease also provides for an additional five-year renewal term (to 2028), subject to the express
approval of the landlord. Any plans to relocate the production equipment would result in significant capital
expenditures and the payment of the asset retirement obligation (currently recorded as a long-term liability
on our financial statements).
CRITICAL ACCOUNTING ESTIMATES
Information on our critical accounting estimates is disclosed in our 2016 amended and restated annual
MD&A. There have been no material changes to our critical accounting estimates from what was disclosed
at that time.
CHANGES IN ACCOUNTING STANDARDS
The following standards became effective for annual periods beginning on or after January 1, 2017, with
earlier application permitted.

Ten Peaks Coffee Company Inc. 17
• IAS 7: Statement of Cash Flows: requires an entity to present a statement of cash flows as
an integral part of its primary financial statements. Cash flows are classified and presented
into operating activities (either using the 'direct' or 'indirect' method), investing activities or
financing activities, with the latter two categories generally presented on a gross basis.
• IAS 12: Income Taxes: implements a 'comprehensive balance sheet method' of accounting
for income taxes which recognizes both the current tax consequences of transactions and
events and the future tax consequences of the future recovery or settlement of the carrying
amount of an entity's assets and liabilities.
We have adopted these amended standards and interpretations, and we assessed that there was no impact
on our condensed consolidated interim financial statements.
The following new standards, amendments to accounting standards and interpretations have been issued
and will be effective in future periods:
• We have early adopted the new accounting standard IFRS 9 – Financial Instruments (2014)
with a date of initial application of January 1, 2016. This new financial instruments standard
replaces IAS 39 for classification and measurement of financial assets and liabilities, and
provides new standards for hedge accounting. We have implemented hedge accounting
concurrent with the implementation of IFRS 9.
• IFRS 15: Revenue from Contracts with Customers: provides a single, principles-based five-
step model to be applied to all contracts with customers. New disclosures about revenue
are also introduced. It is effective for annual periods beginning on or after January 1, 2018.
• IFRIC 22: Foreign Currency Transactions and Advance Consideration: clarifies the appropriate
exchange rate to use on initial recognition of an asset, expense or income when advance
consideration is paid or received in a foreign currency. Management expects this IFRIC may
change the exchange rate used to translate deposits made on inventory purchases or
advances received for revenue in a foreign currency. The impact on the initial measurement
of inventory and revenue would depend on the movements in exchange rates. It is effective
for annual periods beginning on or after January 1, 2018.
• IFRS 16: Leases: introduces new requirements for the classification and measurement of
leases. Management is currently assessing the impact of the new standard on its
consolidated financial statements. It is effective for annual periods beginning on or after
January 1, 2019.
Other than IFRS 9 Financial Instruments (2014), which we early adopted on January 1, 2016, we have not yet
adopted any of these new and amended standards or interpretations, and we are currently assessing the
impact of adoption.
INTERNAL CONTROLS OVER FINANCIAL REPORTING AND DISCLOSURE CONTROLS AND PROCEDURES
The Chief Executive Officer (“CEO”) and the Chief Financial Officer (“CFO”) of Ten Peaks are responsible for
establishing and maintaining adequate internal control over financial reporting (“ICFR”) to provide
reasonable assurance regarding the reliability of financial reporting and the preparation of financial
statements for external purposes in accordance with IFRS. Under the supervision and with the participation
of management, including the CEO and CFO, we conducted an evaluation of the design and effectiveness of
our ICFR as of September 30, 2017, based on the updated framework issued by the Committee of
Ten Peaks Coffee Company Inc. 18
Sponsoring Organizations of the Treadway Commission (“COSO 2013”). Based on this assessment, the CEO
and the CFO concluded that, as of September 30, 2017, Ten Peaks’ ICFR were effective.
The CEO and the CFO are also responsible for establishing and maintaining adequate disclosure controls and
procedures. Disclosure controls and procedures are controls and other procedures designed to provide
reasonable assurance that information required to be disclosed in documents filed or submitted under
securities legislation is recorded, processed, summarized and reported within the time periods specified in
securities legislation and includes controls and procedures designed to ensure that information required to
be disclosed in documents filed or submitted under securities legislation is accumulated and communicated
to the Company’s management, including the CEO and CFO, as appropriate to allow timely decisions
regarding required disclosure.
The CEO and the CFO evaluated, or caused to be evaluated under their supervision, the effectiveness of our
disclosure controls and procedures and based on this evaluation, the CEO and the CFO concluded that, as of
September 30, 2017, Ten Peaks’ disclosure controls and procedures were effective.
There were no changes in our ICFR that occurred during the period beginning on July 1, 2017 and ended on
September 30, 2017 have materially affected, or are reasonably likely to materially affect, Ten Peaks’ ICFR.
SUBSEQUENT EVENTS
Payment of Dividend
Ten Peaks paid an eligible dividend of $0.0625 per share on October 16, 2017 to shareholders of record on
September 29, 2017.
Following quarter-end, Seaforth entered into an agreement to sub-lease 80,100 square feet of warehouse
facility for a two-year period, commencing on November 15, 2017. The additional warehouse facility will
allow Seaforth to meet significant growth in demand for third-party coffee storage.